Article

A Green Voltammetric Determination of Molnupiravir Using a Disposable Screen-Printed Reduced Graphene Oxide Electrode: Application for Pharmaceutical Dosage and Biological Fluid Forms

1
Pharmaceutical Chemistry Department, Faculty of Pharmacy, Misr International University, Km 28 Ismailia Road, Cairo 44971, Egypt
2
Chemistry Department, Egyptian Drug Authority, Giza 12512, Egypt
3
Analytical Chemistry Department, Faculty of Pharmacy, Suez Canal University Ismailia, Ismailia 41522, Egypt
*
Author to whom correspondence should be addressed.
Chemosensors 2023, 11(9), 471; https://doi.org/10.3390/chemosensors11090471
Submission received: 27 June 2023 / Revised: 1 August 2023 / Accepted: 14 August 2023 / Published: 23 August 2023

Abstract

:
A new green-validated and highly sensitive electrochemical method for the determination of molnupiravir (MOV) has been developed using cyclic voltammetry. The proposed analytical platform involves the use of a disposable laboratory-made screen-printed reduced graphene oxide 2.5% modified electrode (rGO-SPCE 2.5%) for the first time to measure MOV with high specificity. The surface morphology of the sensor was investigated by using a scanning electron microscope armed with an energy-dispersive X-ray probe. The fabricated sensor attained improved sensitivity when sodium dodecyl sulfate (SDS) surfactant (3 µM) was added to the supporting electrolyte solution of 0.04 M Britton–Robinson buffer at pH 2. The electrochemical activity of rGO-SPCE was examined in comparison with two different working electrodes in order to demonstrate that it was the most competitive sensor for MOV monitoring. The method was validated using differential pulse voltammetry according to ICH guidelines, resulting in good precision, accuracy, specificity, and robustness over a concentration range of 0.152–18.272 µM, with a detection limit of 0.048 µM. The stability investigation demonstrated that rGO-SPCE 2.5% can provide high-stability behavior towards the analyte throughout a six-week period under refrigeration. The fabricated rGO-SPCE 2.5% was successfully employed for the measurement of MOV in pharmaceutical capsules and human biofluids without the interference of endogenous matrix components as well as the commonly used excipient.

Graphical Abstract

1. Introduction

The coronavirus pandemic disease was first recognized in December 2019 in Wuhan, China [1]. This viral infection has caused hundreds of millions of cases and several million deaths. Therefore, launching new anti-viral drugs to control the pandemic crisis is essential. One of the approved antivirals is molnupiravir (MOV), [(2R,3S,4R,5R)-3,4-dihydroxy-5-[4-(hydroxyamino)-2-oxopyrimidin-1-yl]oxolan-2-yl] methyl 2-methylpropanoate, which inhibits RNA replication (Figure 1). Using MOV reduces the risk of hospitalization and death in patients with COVID-19. Based on the urgent importance of the studied drug, much effort should be directed for the development of fast, affordable, and reliable methods to measure MOV in different matrices. Different analytical methods have been developed for MOV determination alone or in mixtures, including UV spectrophotometry [2,3], fluorimetry [4], and chromatography [5,6,7]. MOV in human plasma and saliva has been determined using a liquid chromatographic approach incorporating mass spectrometric detection [8,9]. Although this approach is more sensitive and selective, it is more expensive and can only be conducted by skilled persons due to its complexity. In addition, it produces large amounts of wastes in comparison with the new electrochemical techniques. Thus, electrochemical methods surpass spectroscopic and chromatographic approaches for measuring MOV [10]. A square wave voltammetry method for assaying MOV in pharmaceutical products based on electrooxidation of reduced graphene oxide (rGO) on a glassy carbon electrode has been reported [11]. The electrochemical behavior and sensitive voltammetric determination of MOV were evaluated using a magnetite nanoparticle modified carbon paste electrode [12]. On the glassy carbon electrode, a metal-organic framework composited with ethylene-glycol-treated poly(3,4-ethylene dioxythiophene), poly(styrene sulfonate), has been characterized as an efficient electrochemical sensor for the quantification of MOV [13].
The electroanalytical technique provides all the advantages required for analysis, such as higher sensitivity, selectivity, rapidity, simplicity, reliability, and ease of use. Furthermore, the evolution of screen-printing technology has resulted in a potent sensing electrode that is characterized by high reproducibility, a disposable nature, being economical, and having a wide capacity for adjusting its working surface area [14,15]. Moreover, electrochemical devices are portable and miniaturized to the extent that they can be employed with miniaturized electrochemical sensors [16]. Electrochemical sensors are now commonly used instead of traditional analytical tools. These sensors are ideal for ‘in situ’ monitoring of pharmaceutical residues in biomedical, pharmaceutical, and industrial applications because of high sensitivity and selectivity. Thus, the use of electrochemical techniques in conjunction with screen-printed electrodes (SPEs) represents an advanced and alternative technique for the analysis of pharmaceuticals with high sensitivity [17,18]. Furthermore, pharmaceutical compounds in a variety of matrices can be easily measured utilizing electroanalytical techniques without influence from their endogenous components [19,20]. Moreover, one of the most commonly used type of nanoparticles in many electrochemical platforms is graphene nanoparticles. As a result, the current work is intended to develop an affordable, simple, sensitive, and disposable reduced-graphene-oxide-modified screen-printed carbon electrode (rGO-SPCE) as an electrochemical sensor and to improve the experimental conditions in order to determine the amount of MOV in capsules as well as biological fluids. To clarify and prove the features of the proposed electrode, a comparative study was performed between several types of working electrodes, such as a carbon paste electrode (CPE) and a multiwalled carbon nanotube (MWCNT)-modified CPE, as well as rGO-SPCE. In this study, several factors such as electrolyte pH, surfactant concentration, scan rate, and surface area that affect the performance of the examined electrodes for the quantification of MOV have been investigated. Different modifier ratios were also investigated to improve the selectivity and sensitivity of the rGO-SPCE in quantifying MOV. According to the literature review, the proposed method is the best combination of being rapid, eco-friendly, and economical for determining MOV in various matrices. To the best of our knowledge, voltammetric measurement of MOV based on the electrochemical oxidation properties of the analyte using an rGO-SPCE has not been reported.

2. Materials and Methods

2.1. Chemicals and Reagents

The highly pure MOV (>99% purity) used in this study was supplied by the National Organization for Drug Control and Research (NODCAR), located in Cairo, Egypt. To facilitate the experimental procedures, several chemicals and reagents of analytical grade were obtained from Sigma-Aldrich (Cairo, Egypt), including sodium dodecyl sulfate (SDS), Triton X-100, cetyltrimethyl ammonium bromide (CTAB), methanol, carbon, phosphoric acid, acetic acid, boric acid, graphite, paraffin oil, [Fe(CN)6]3−/4−, NaOH, and KCl. Bidistilled deionized water was employed throughout the entire experimental process.
For the electrolyte solution, Britton–Robinson (BR) buffer solutions with a pH range of 2 to 11 were prepared by combining appropriate volumes of 0.04 mol/L acetic acid, ortho-phosphoric acid, and boric acid. The solution was then brought to the desired volume using calibrated 500 mL measuring flasks and adjusted to the desired pH using sodium hydroxide. It should be noted that the preparation of the BR buffer solutions followed the established protocol [21]. The pharmaceutical dosage form used in the study was Molupiravir® capsules, specifically Batch no. 2201112. These capsules, containing 200 mg of MOV, were manufactured by the Eva Pharmaceutical Company based in Egypt.

2.2. Apparatus

The Autolab Potentiostat-Galvanostat (PGSTAT 30) (Metrohm, Herisau, Switzerland) electrochemical instrument with a three-electrode system and Nova 2.1 software was used to conduct the electrochemical tests. A revolving disc with a diameter of two millimeters (Rotring Co. Ltd., Hamburg, Germany, R505210 N) was applied. All studies were carried out with a three-electrode system, using rGO-SPCE as a working electrode, a platinum counter electrode, and silver/silver chloride as a reference electrode. A scanning electron microscope (SEM) at an accelerated voltage of 5 kV (JSM-7610F, JEOL) (Tokyo, Japan) was used to obtain a high-resolution image of the electrode morphology. The buffer solution was calibrated with standard buffers at room temperature using a digital pH/mV meter (JANEWAY 3510) with a glass combination electrode (Cole-Parmer, Vernon Hills, IL, USA).

2.3. Fabrication of Working Electrodes

The CPE was prepared by hand mixing 0.25 g graphite powder (<20 µm sigma Aldrich, Cairo, Egypt) and 180 μL paraffin oil (0.827–0.890 g/mL at 20 °C with viscosity (110–230 mPa.s)) [22,23], and after proper homogenization, the resulting suitable pastes were packed into CPE body–2.87 mm ID (surface area Se = 6.75 mm2). Before each voltammetric measurement, the electrode surface was mechanically regenerated by removing a small amount of paste from the holder and wiping the electrode surface with a piece of clean filter paper. The rGO-SPCEs were fabricated by an in-house screen-printing method using carbon ink (Electrodag 421 SS, Acheson, Milan, Italy) as a printing material modified by bulk mixing of the appropriate amount of rGO with lot number MKCC2772 (<50 nm Sigma Aldrich, Cairo, Egypt). A silk-screen printing technique was used to apply carbon ink on the electrode support (inert polyvinyl chloride (PVC) material with a thickness of 2 mm). The printed electrode was dried at room temperature for 20 min and cut into individual sensor strips; then, the equivalent active surface of each tested sensor was fixed by isolating out the appropriate surface area. The electrode was inserted into the batch solution and electric contact was made with a crocodile clamp. Figure S2 illustrates a diagram of the in-house preparation of the rGO-SPCE. The stability investigation demonstrated that rGO-SPCE 2.5% can provide high-stability behavior throughout a six-week period under refrigeration for MOV measurement.

2.4. Preparation of Working Standard Solution

To prepare a solution of MOV with a concentration of 0.1 mg/mL, a precise quantity of 10 mg of the tested pharmaceutical was weighed and transferred into a 100 mL volumetric flask. Then, 5 mL of methanol was added to the flask. The mixture was thoroughly dissolved and the volume adjusted by adding more bidistilled water: methanol (1:1) until reaching the mark on the flask, ensuring a final volume of 100 mL.

2.5. Method Optimization

Optimization of the experimental parameters, as a part of method development, to improve the electrode’s performance for measuring MOV in capsules as well as biological fluids was carefully conducted in the current research. These parameters included the pH of the supporting electrolyte, type and concentration of the surfactant, scan rate, surface area, and modifier (rGO) ratio. All of these parameters tested in a comparison study on three different working electrodes.

2.6. General Procedure

Different aliquots of MOV working standard solutions were transferred into a calibrated 10 mL volumetric flask; SDS was then added. The prepared mixture was completed to the mark with 0.04 M BR buffer (pH 2) and then transferred to the voltammetric vessel cell. The final concentration of SDS was 3 µM. The resulting solution was subjected to continuous stirring at a speed of 2000 rpm at room temperature for 10 s. After stopping the stirrer, the solution was allowed to rest for 10 s before voltammograms were recorded, using a scan rate of 100 mV/s and a voltage step of 0.95 mV. The scan was performed over a range from +20 to +200 mV; the derived regression equation was used to calculate the mean concentration of the triple measurements of the samples.

2.7. Sample Preparation

2.7.1. Preparation of Pharmaceutical Dosage Form

Ten capsules of Molnupiravir® (each labelled to contain 200 mg of MOV) were precisely weighed and the average weight calculated. The contents of the capsules were thoroughly mixed, and an appropriate weight equivalent to the content of one capsule was transferred into a 100 mL volumetric flask. The flask was then filled with 50 mL of methanol, the solution was shaken vigorously to ensure complete dissolution, and additional methanol was added until the volume reached the mark on the flask. This resulted in the preparation of an MOV stock solution of 2 mg/mL. The stock solution was further diluted in a serial manner to obtain different concentrations. An aliquot of each solution was completed to 10 mL with BR buffer (pH 2) and contained 3 µM SDS in the final dilution. The general procedure mentioned previously was then applied to analyze MOV.

2.7.2. Spiked Urine Analysis

Free-drug human urine samples collected from healthy volunteers were transferred into dry centrifuge tubes. The tubes were then centrifuged at a speed of 5000 rpm for 10 min at room temperature (22 ± 2 °C). Following centrifugation, the supernatant solution was filtered through a syringe filter to remove any particulate matter. The filtered supernatant (1 mL) was added to a 9 mL portion of 0.04 M BR buffer (pH 2). To establish concentrations ranging from 0.759 to 6.225 µM, aliquots of working standard solutions of MOV at various concentrations were added to the diluted urine samples. Each spiked sample contained 3 µM SDS in the final dilution. For assessing the analyte concentrations in the spiked urine samples, the general procedure was employed.

2.7.3. Spiked Serum Analysis

To prepare spiked human serum samples, a volume of 2 mL of serum was transferred into a dry centrifuge tube. An appropriate volume of MOV working standard solution was added to the serum, and the mixture was thoroughly mixed using a forced vortex method. The volume was then adjusted to 5 mL using methanol. The prepared mixtures were further vortexed and centrifuged for 5 min at a speed of 5000 rpm. Subsequently, the supernatant was filtered using a 0.45 μm syringe filter. An appropriate aliquot of the filtered supernatant was taken and added to a calibrated measuring flask with a volume of 10 mL. The flask was then filled to the marked volume with a 0.04 M BR buffer solution (pH 2) and contained 3 µM SDS in the final dilution. The general procedure was used to determine the MOV concentrations in spiked serum samples. VACSERA (Cairo, Egypt) supplied the drug-free serum samples.

3. Results and Discussion

3.1. Characterization of the Electrode

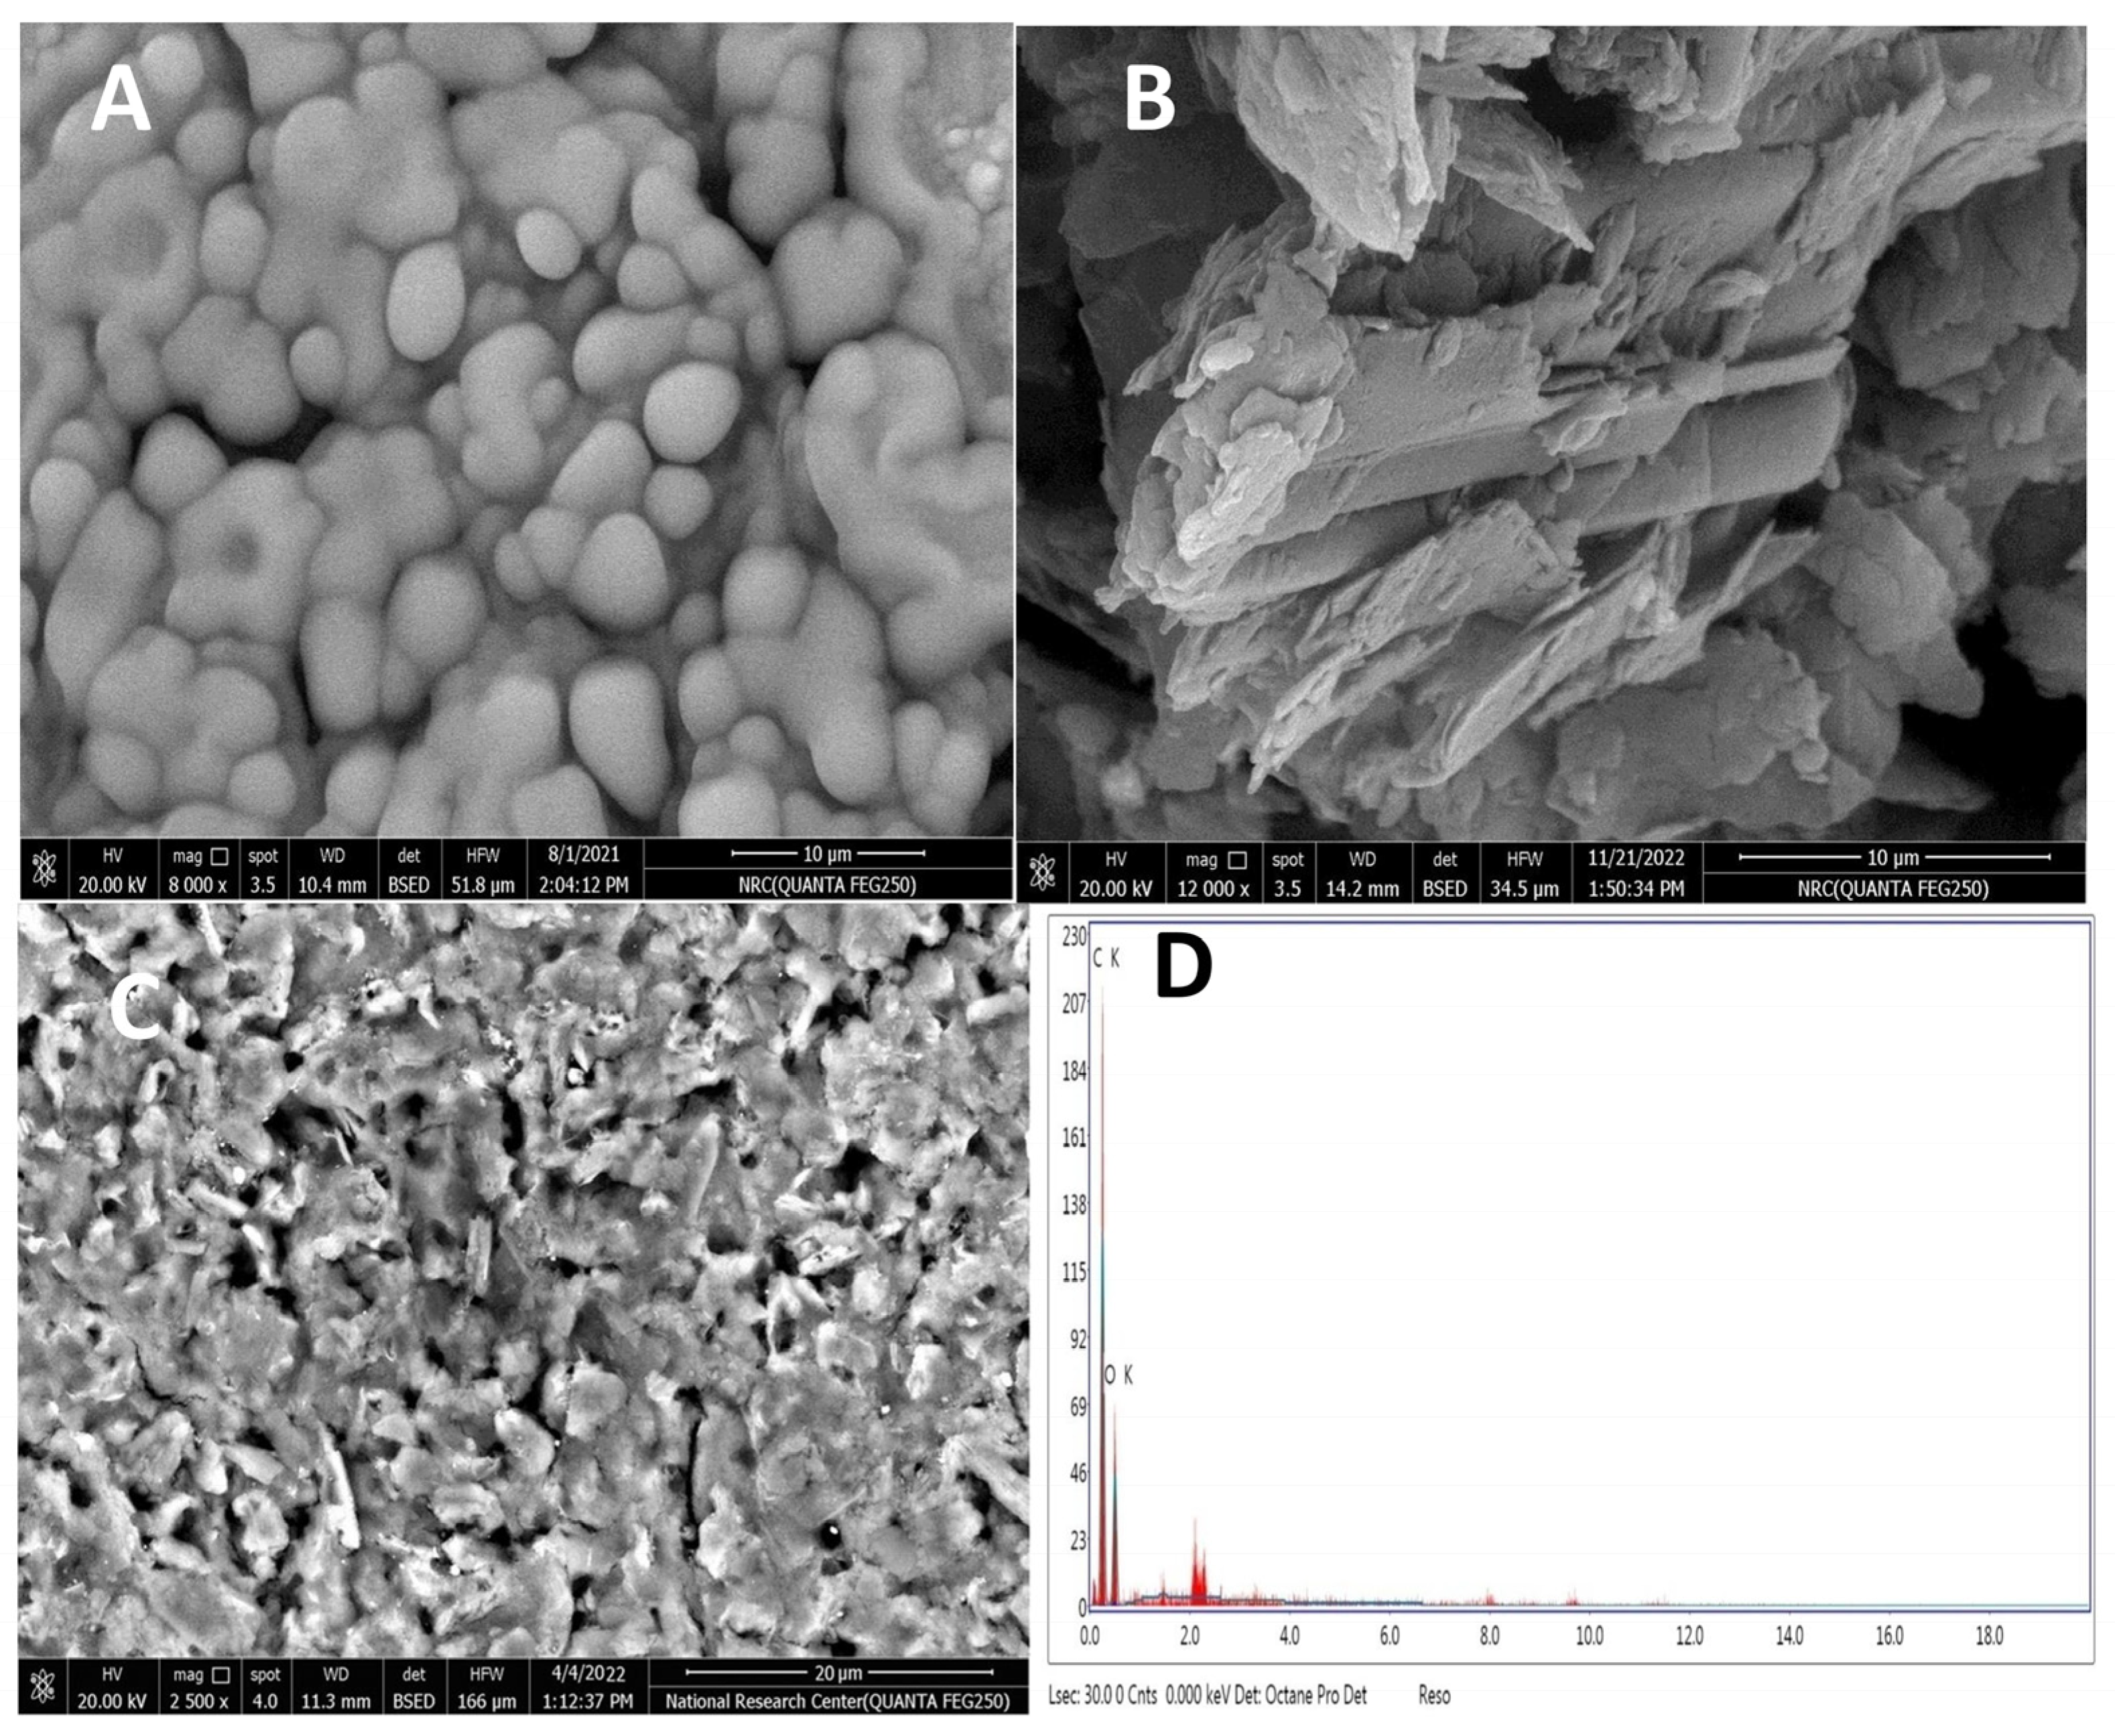
3.1.1. Structural and Surface Morphology of Working Electrodes

We examined the electrochemical activity of different working electrodes in order to illustrate that the rGO-SPCE can be considered as the best competitive sensor for analysis of MOV. Three electrodes, a CPE, an MWCNT-modified CPE, and the rGO-SPCE, were studied in the current research. The SEM was utilized to perform characterization of the surfaces of the prepared electrodes, as depicted in Figure 2. The substrate exhibited a dense and uniform pattern, demonstrating the controlled features achieved through screen printing with the modified inks. The SEM image of the graphite CPE surface (Figure 2A) revealed the presence of spherical protrusions as deposits. On the other hand, the MWCNT-modified electrode exhibited a surface covered with skeletal sediments, forming cubical caverns, as displayed in Figure 2B. This surface morphology contributes to an increased active surface area compared with that of the CPE. The SEM image of the rGO-SPCE (Figure 2C) revealed flake-like structures with a homogeneous surface that are attributed to rGO sheet stacking, which increases the specific active surface area resulting from the controllable feature of the screen printing with the prepared modifier inks [24,25,26,27]. The incorporation of rGO as a modifier at a low concentration of 2.5 % wt. was confirmed by the energy-dispersive X-ray spectroscopy (EDX). The hexagonal lattice structure of rGO was confirmed by selected-area electron diffraction (SAED) (Figure 2D), which produced a pattern with bright, visible spots forming a hexagon [28,29]. It was observed that the 3D regular porous network formed by the overlapping rGO flakes would result in a large specific area. Consequently, enhancing the electrochemical performance and electro-transfer kinetics based on the large specific site of rGO allowed the improvement of sensitivity for MOV determination.

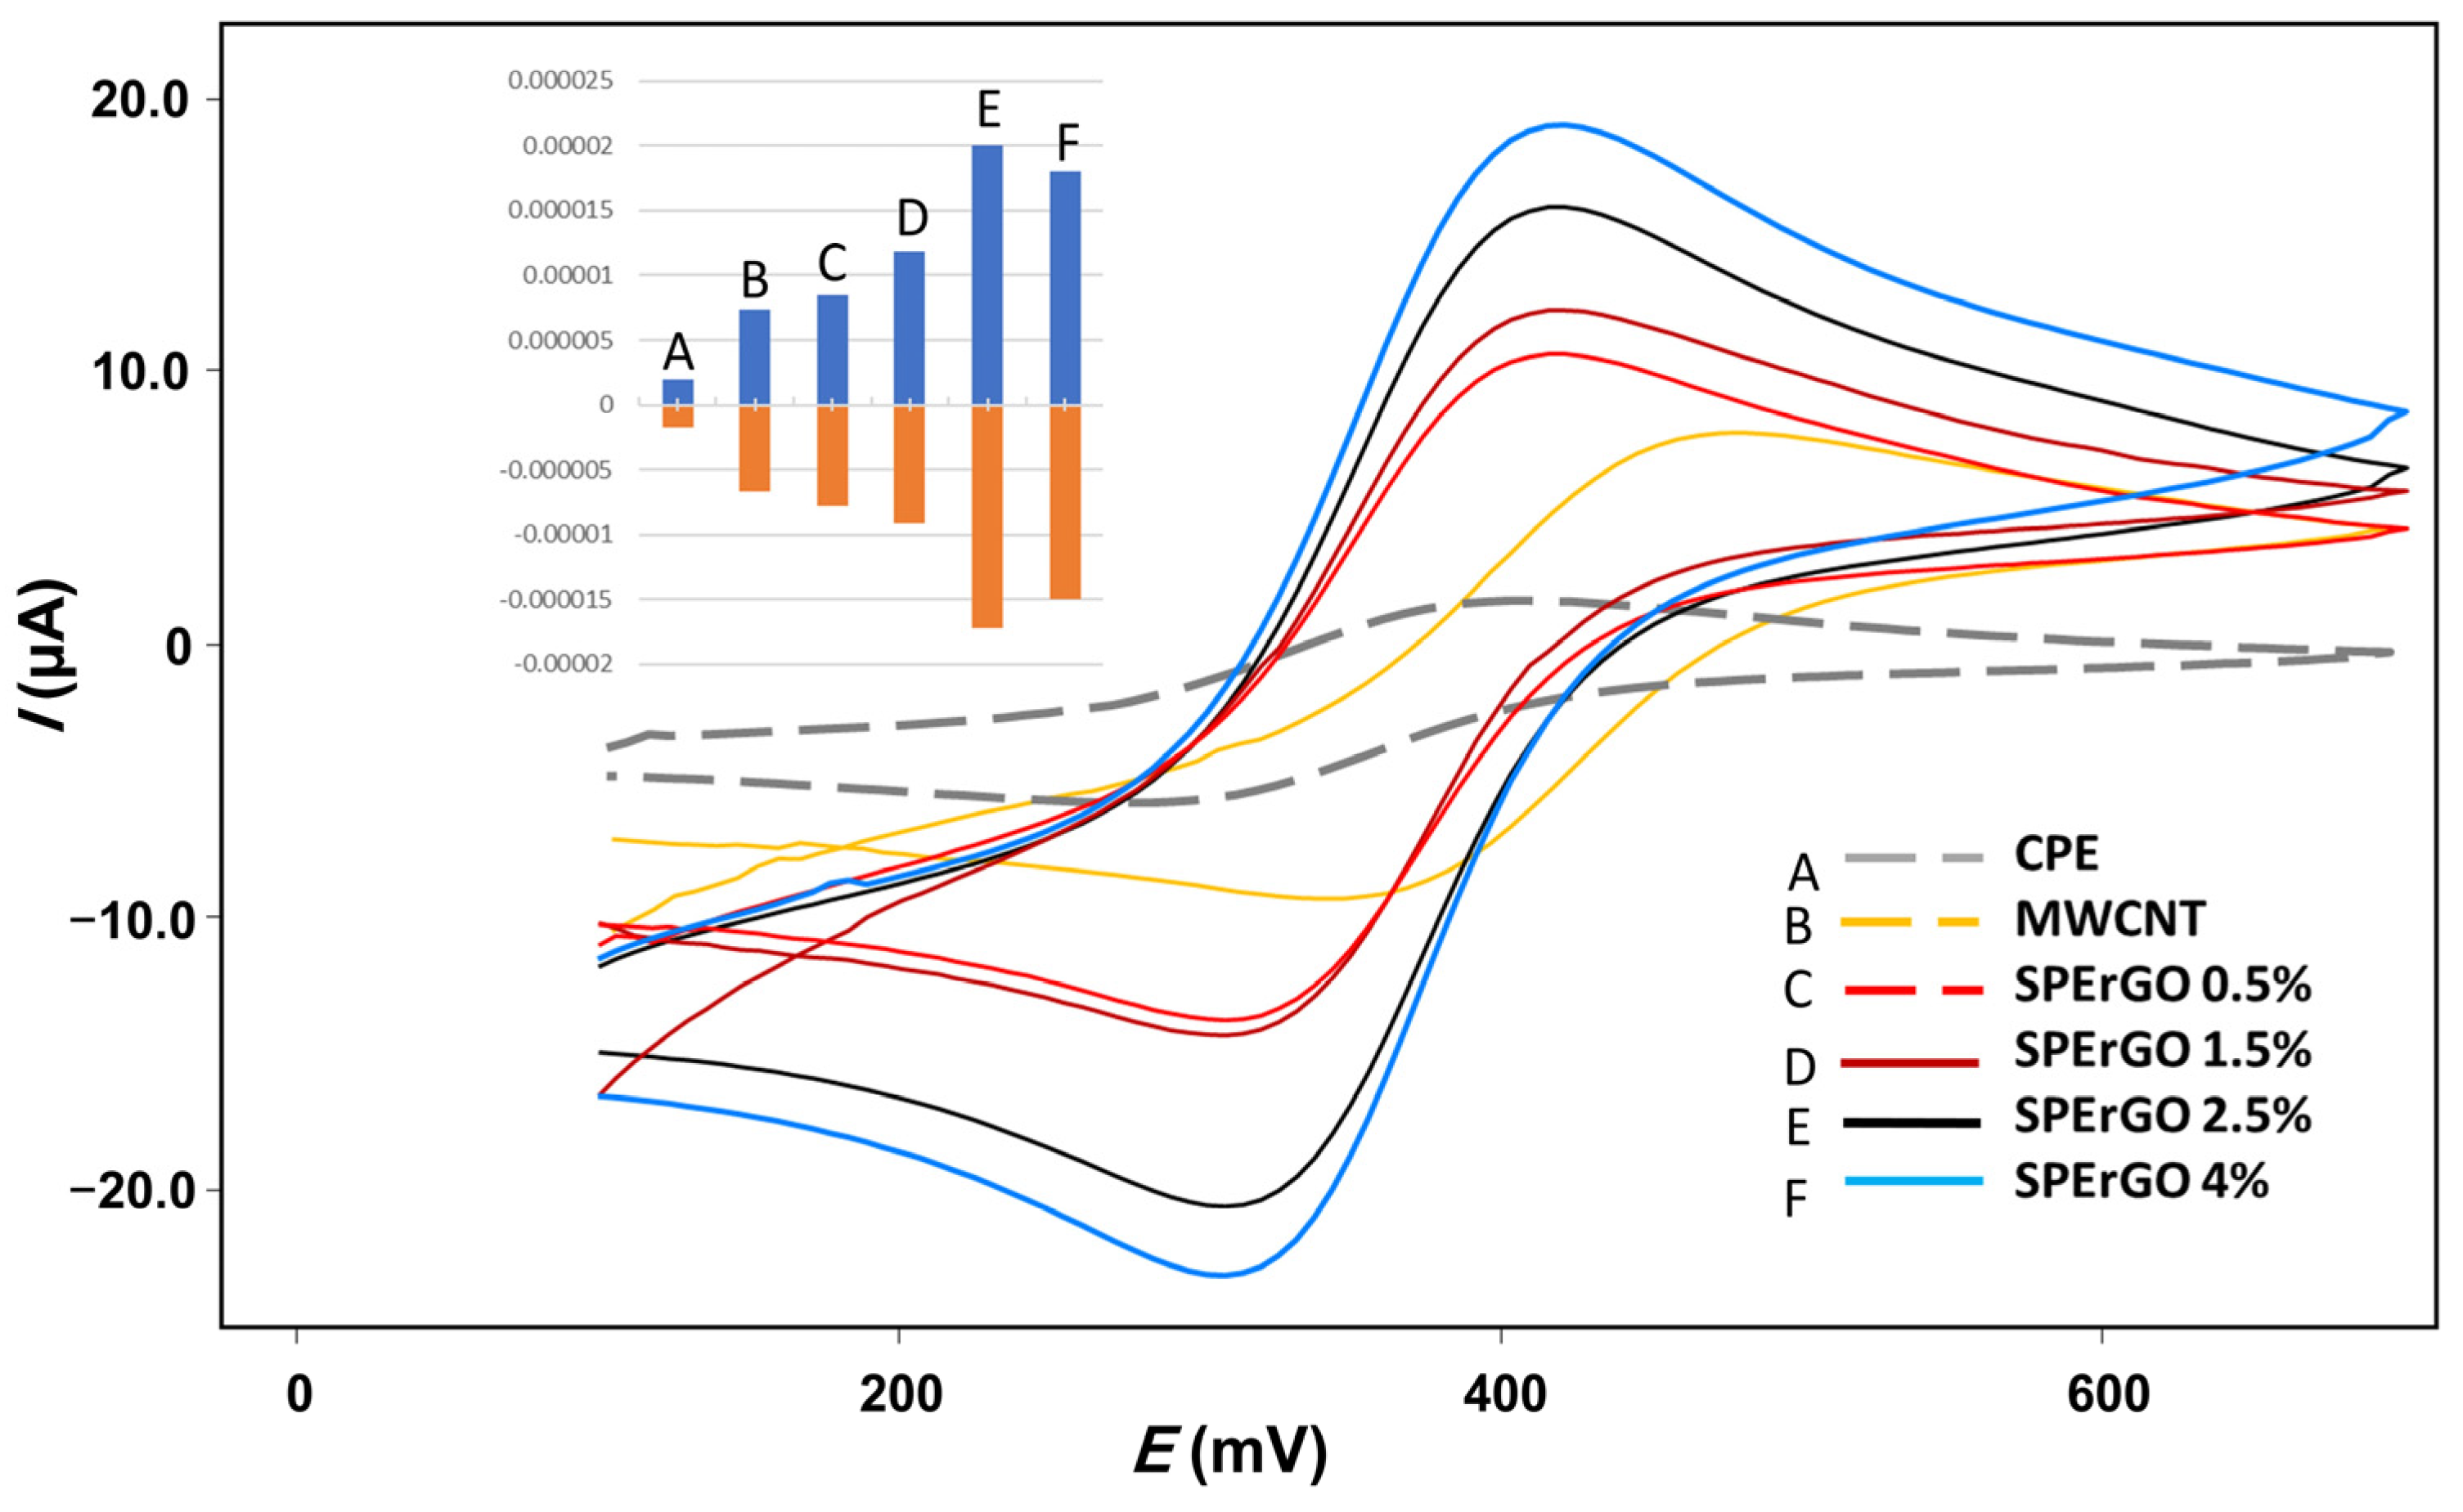
3.1.2. Electro-Characterization of the Working Electrode

To evaluate the electrochemical behavior and compare the active surface areas of the three working electrodes, cyclic voltammetry (CV) was employed at a scan rate of 50 mV/s. Additionally, to investigate the impact of rGO modifier percentage on the rGO-SPCE response and figure out its optimum ratio, rGO-SPCEs containing 0.5, 1.5, 2.5, and 4% of the modifier were fabricated. The voltammetric responses of the working electrodes were investigated in a solution containing 1 mM [Fe(CN)6]3−/4− and 0.1 M KCl at various scan rates (Figure 3). The Randles–Sevcik equation [30,31] was utilized to calculate the electroactive surface areas of the examined electrodes as follows:
Ip = 268,600 n 3/2 AD1/21/2
This equation represents the peak current (Ip), concentration (C), scan rate (ʋ), the number of electrons involved in the redox process (n = 1), the diffusion coefficient (D = 7.6 × 10⁻⁶ cm2/s), and the electrode area (A). By analyzing the CV data and applying the Randles–Sevcik equation, the electroactive surface area of each electrode was determined and used for further comparisons, as listed in Table 1. The obtained results allowed for a comprehensive assessment of the electrochemical behavior of the three electrodes and facilitated a quantitative comparison of their active surface areas. In the case of the rGO-SPCE, our investigation revealed an appropriate surface area. The plot of peak currents versus modifier ratios in Figure 3 and the obtained results in Table 1 also showed that raising the percentage of the modifier enhanced the anodic peak current of the MOV in rGO-SPCEs; however, increasing the amount over 2.5% resulted in inappropriate sensitivity. Thus, the 2.5% rGO-SPCE was selected as the best sensor owing to its large electro-active area, which is the main factor that gives high responses for MOV determination.

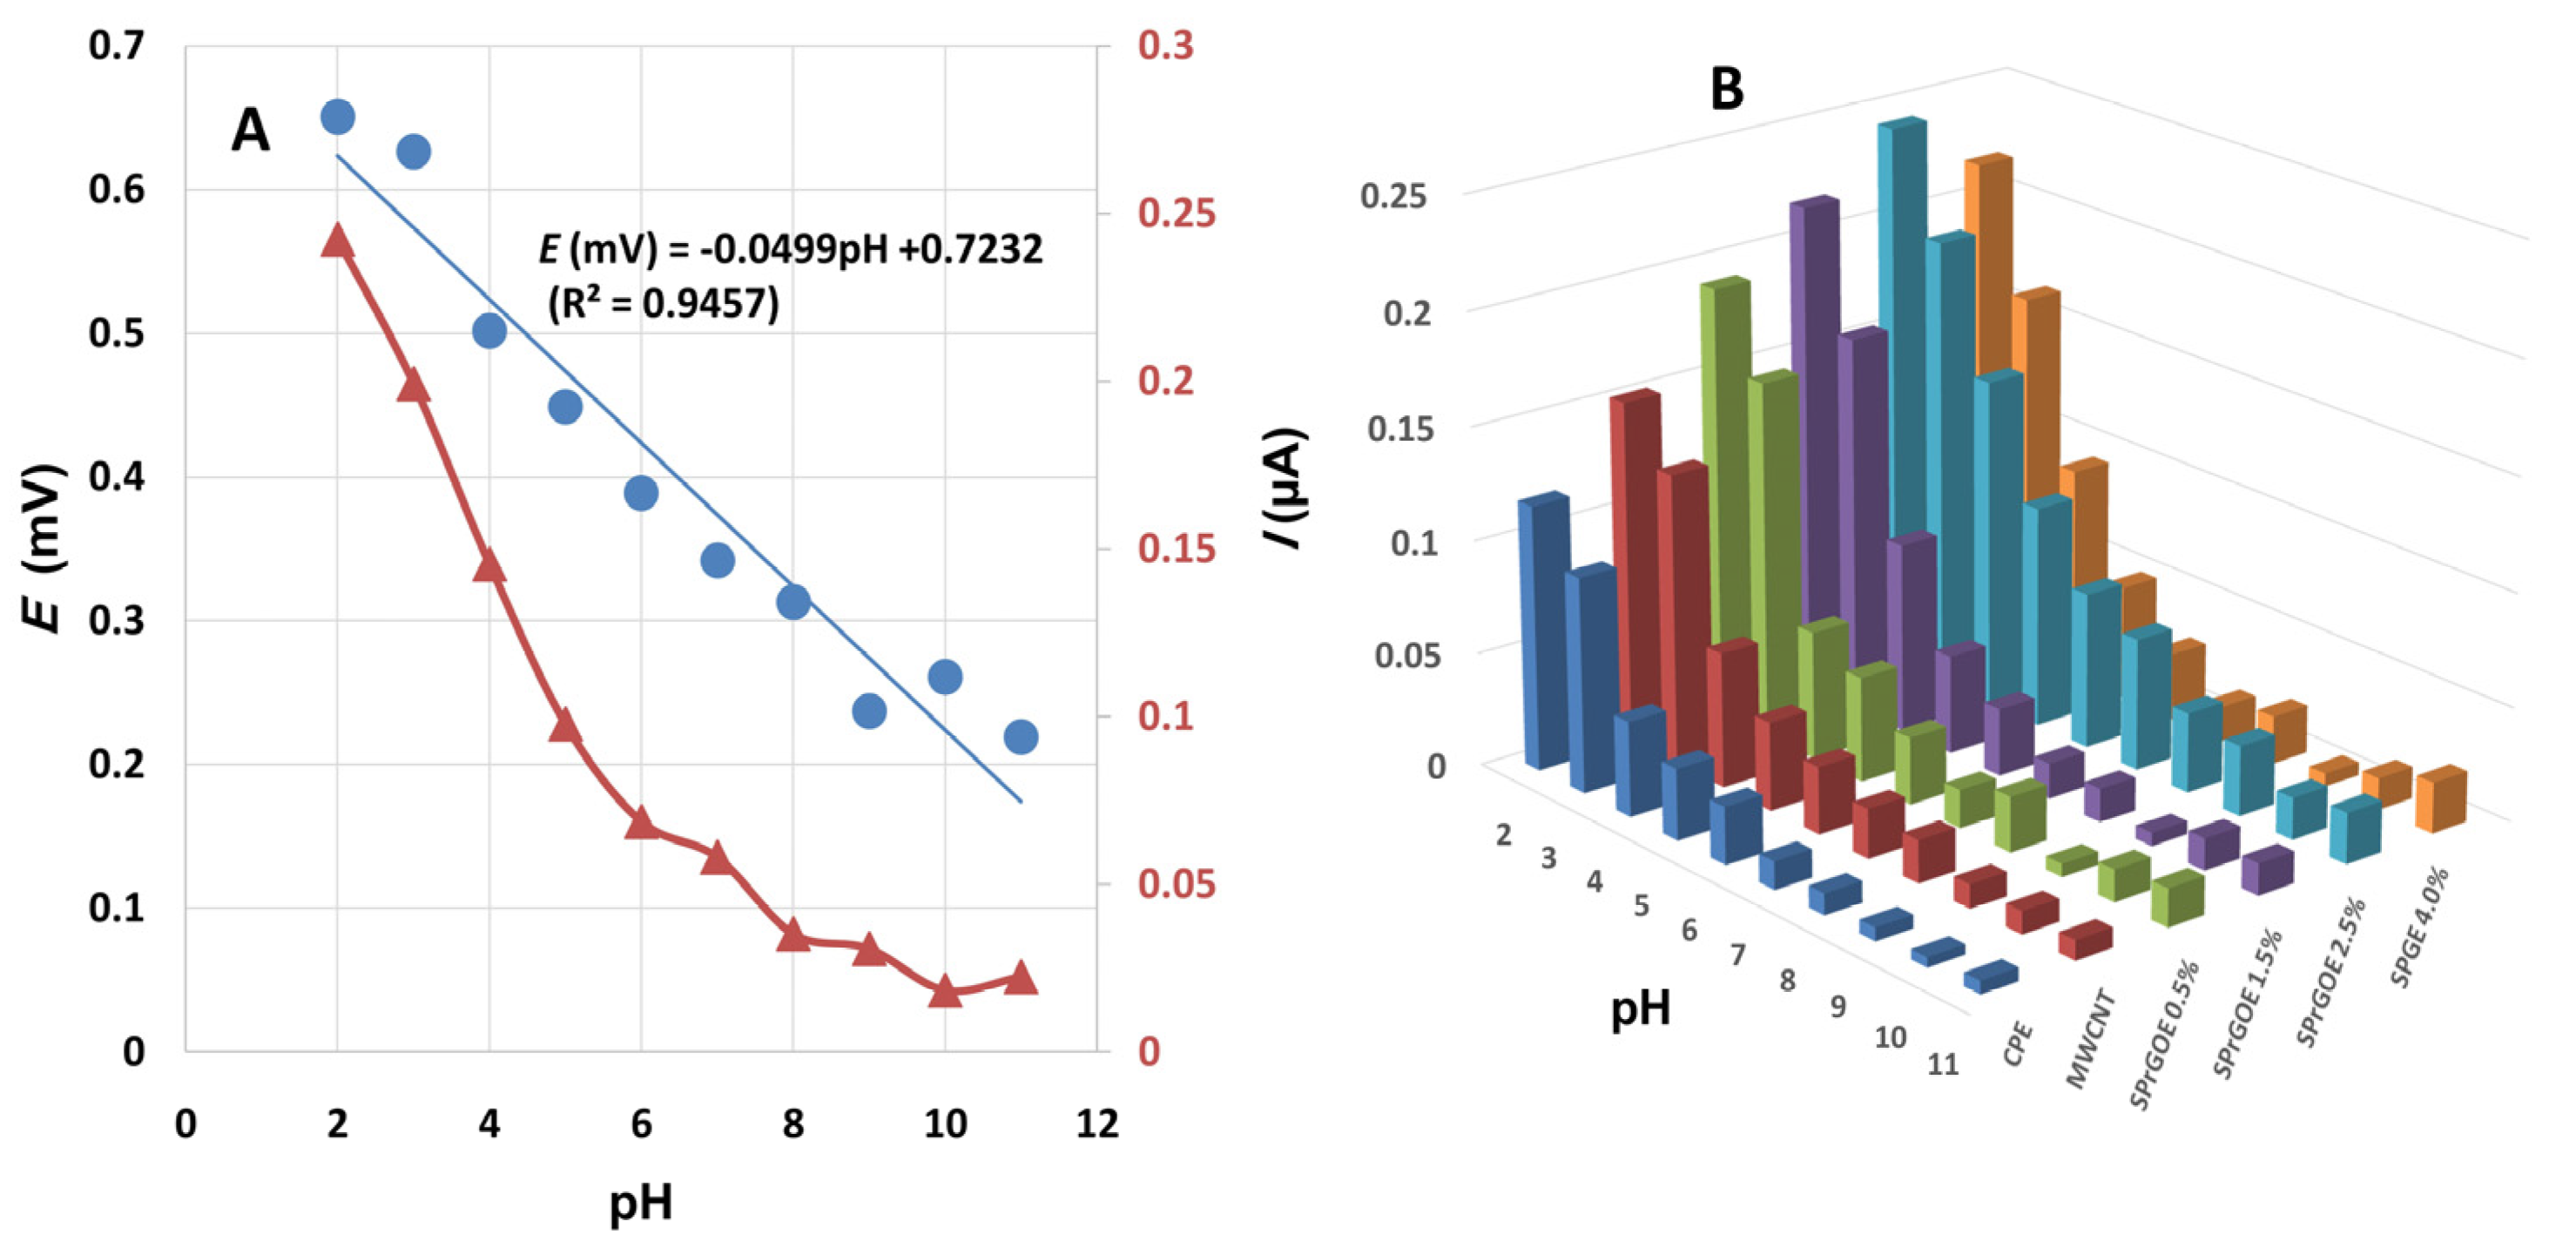
3.1.3. Optimization of pH Using the rGO-SPCE

The pH of the supporting electrolyte solution plays a critical role in helping to understand the electrochemical redox behavior of the studied drug, making it necessary to optimize this variable and evaluate its impact on the anodic peak potential and current [32]. Therefore, an investigation was conducted to determine the optimal pH that would yield superior oxidation peak current and peak potential for MOV measurement. The effect of pH on the electrochemical behavior of MOV was examined over the range 2–11, using a 2.5% rGO-SPCE through the CV technique in 0.04 M BR buffer solution. As shown in Figure 4A, a linear relationship was observed between the oxidation peak of MOV and the pH of the supporting electrolyte, with the movement of oxidation peak potential towards the negative direction. The following equation was achieved:
E(mV) = 0.0499 pH + 0.7232 (R2 = 0.9457)
The oxidation peaks of MOV revealed that the electrochemical activity of the examined working electrodes towards the analyte was observed at low pH values, as shown in Figure 4B. Thus, the most suitable supporting electrolyte was determined to be BR buffer solution (0.04 M) with pH 2 in the presence of 3 µM SDS, where the electrochemical response of MOV oxidation was at the highest level. The protonation of MOV can explain why high peak currents were obtained at acidic pH levels. MOV is protonated at low pH values, and the mass transfer to the electrode surface increases, facilitating oxidation. The gradual decrease in current as the pH rises from 2 to 11 is attributable to a decrease in protonated species, which supports the experimental results. Based on these results, the optimal pH value selected for the 0.04 M BR buffer solution as an electrolyte was 2. Figure 5 also provides a comparison of the studied electrodes at pH 2. It is evident from this figure that the best current intensity (Figure 5A) and system performance (Figure 5B) were achieved when using a 2.5% rGO-SPCE. The observed enhancement in the electrochemical response, characterized by the highest current values, highlights the significance of the rGO-SPCE modification for the MOV assay. As a result, the use of the 2.5% rGO-SPCE at an optimal pH of 2 provides a more sensitive and reliable analytical platform for MOV measurement.

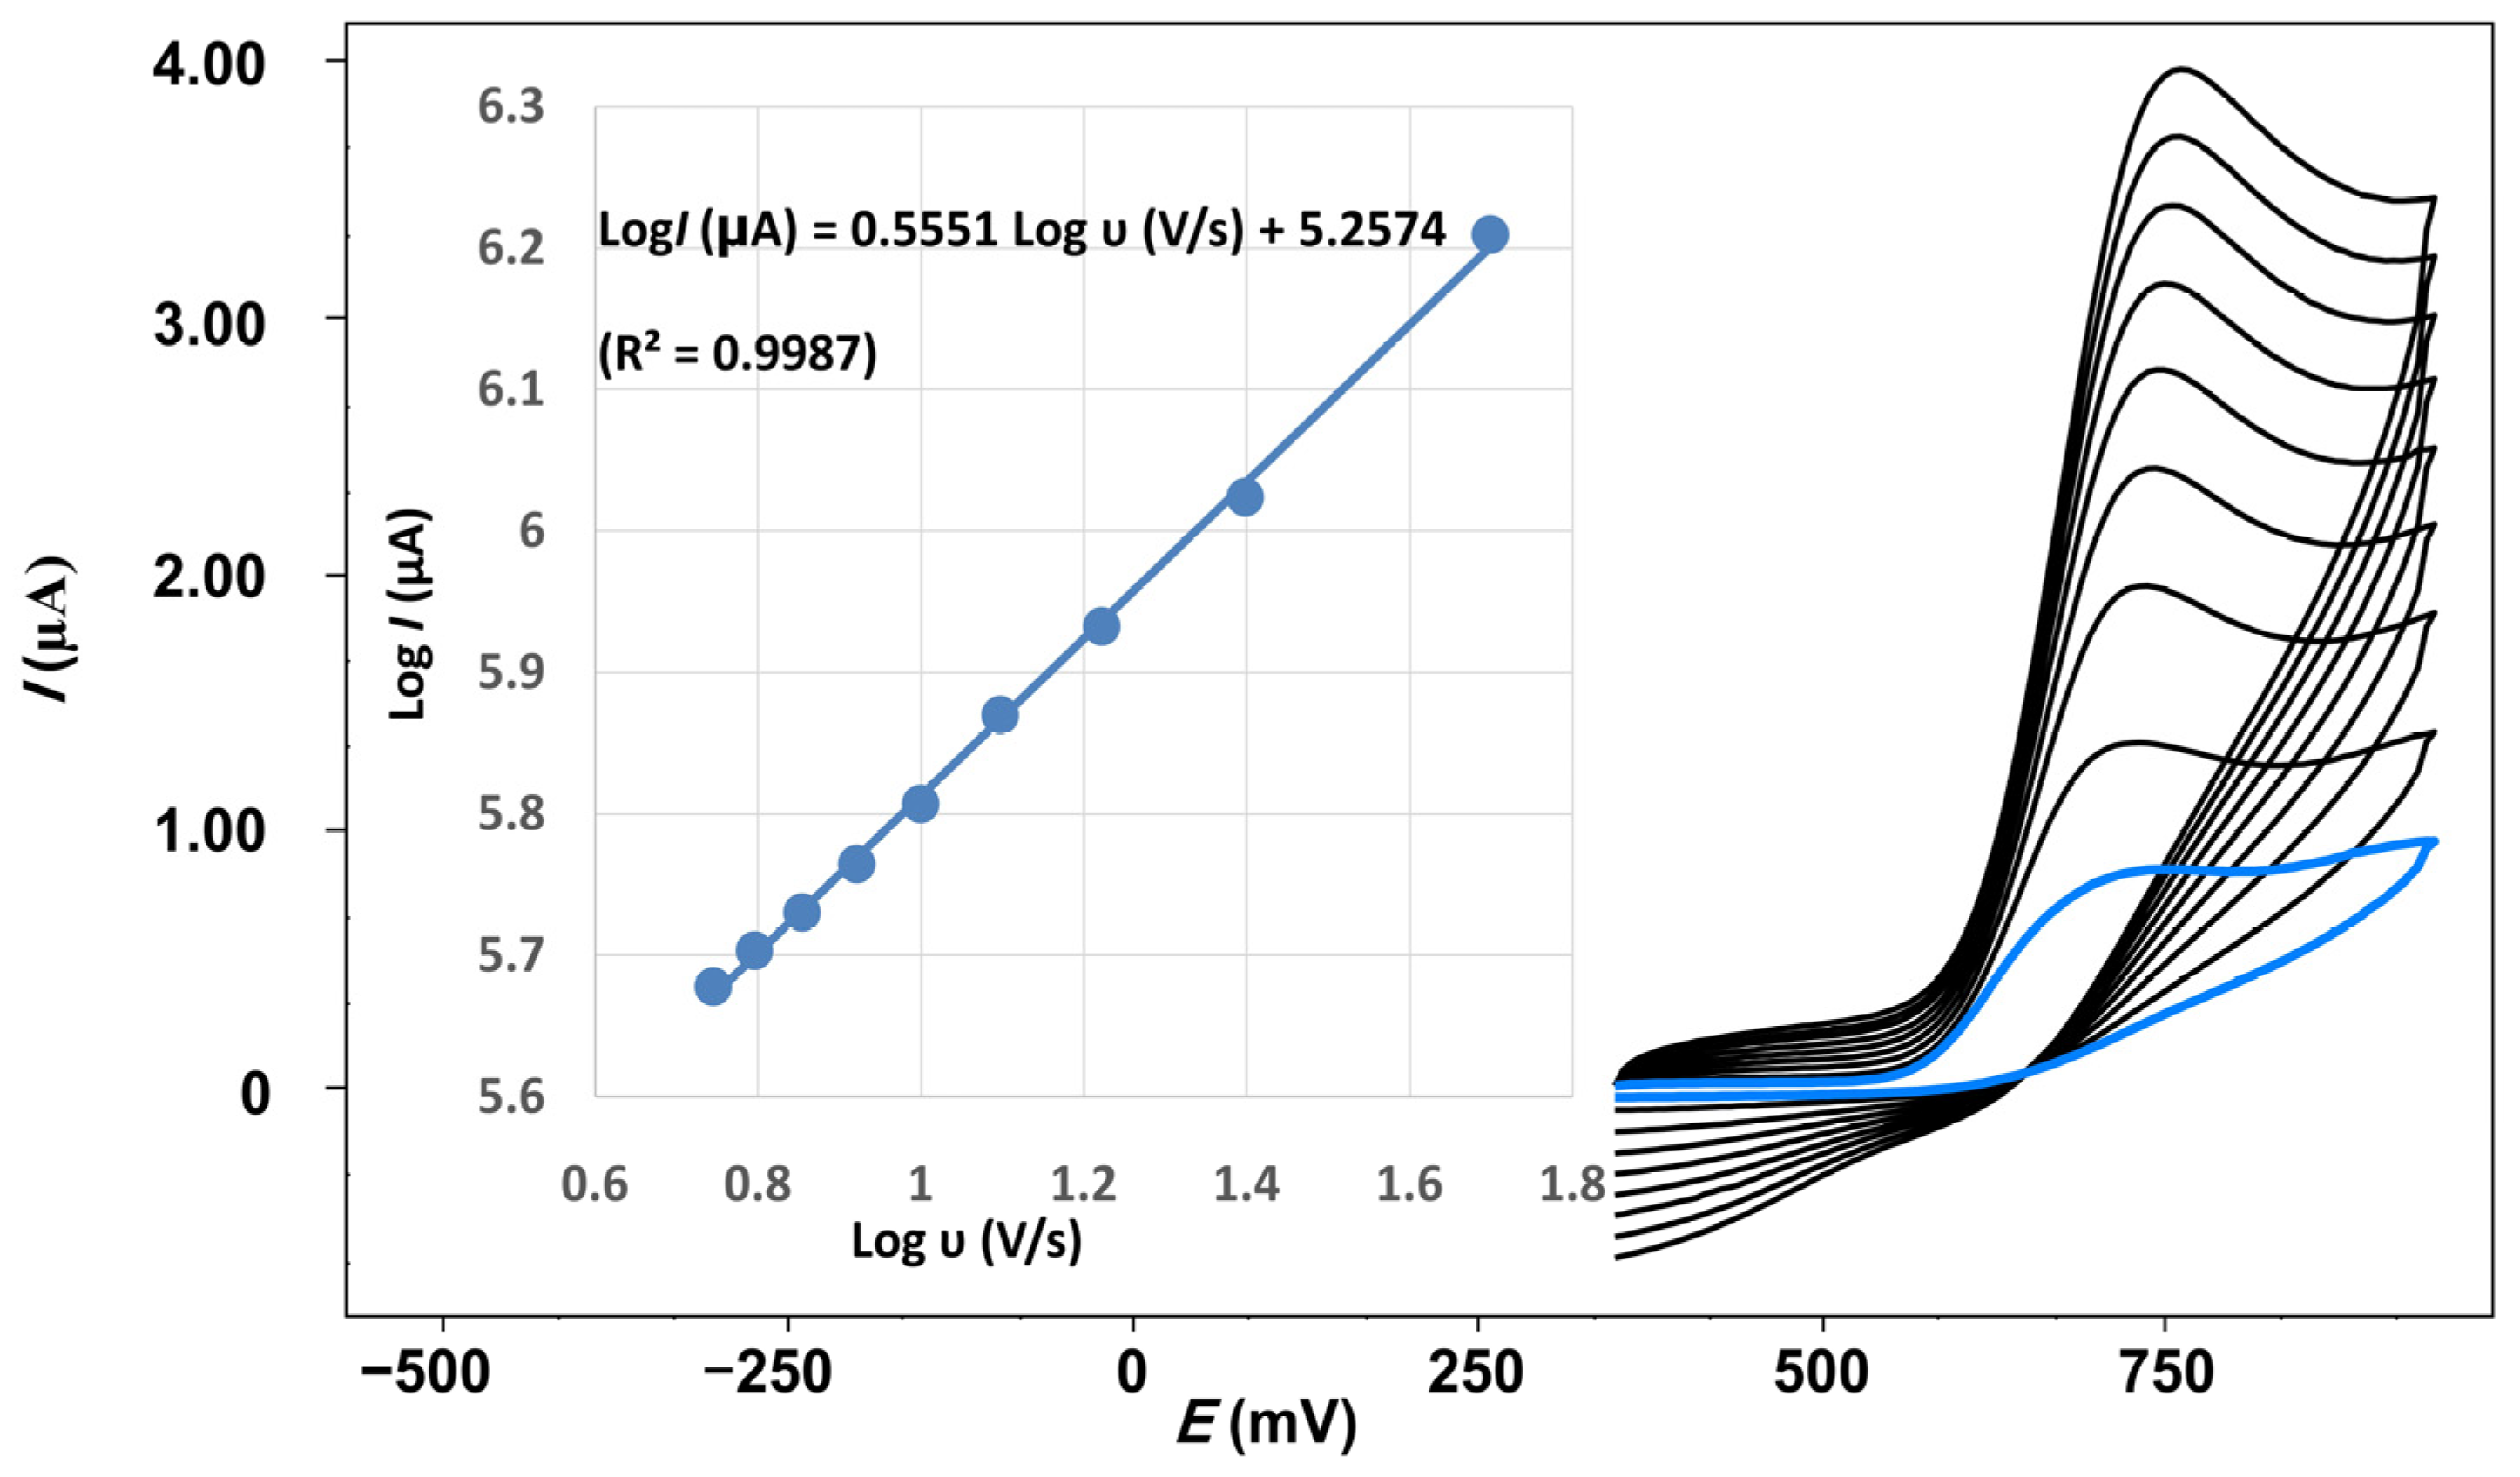
3.1.4. Effect of Scan Rate

To investigate the effect of scan rate on the oxidation reaction of 1.518 µM MOV in 0.04 M BR buffer with pH 2, CV studies were conducted using a 2.5% rGO-SPCE. The scan rate was varied from 20 to 200 mV/s within a potential range of 0.6 to 1.6 V. The results revealed that the anodic peak current of the oxidation reaction increased with an increase in the scan rate. Figure 6 illustrates the log of the oxidation current (I(µA)) plotted against the log of the scan rate (υ), exhibiting a strong linear correlation [33]. The linear regression equation obtained from the data analysis was log I(µA) = 0.5551 log υ (V/s) + 5.2574, with a high correlation coefficient (0.9987). The slope value of the linear regression equation indicates that the electro-catalytic action of the 2.5% rGO-SPCE in the oxidation response of MOV is close to the theoretical value, suggesting that the oxidation process follows a diffusion-controlled pathway.
Furthermore, the anodic peak potential is influenced by the scan rate. As the scan rate increases, the peak potential moves towards more positive values, indicating the presence of kinetic limitations in the electrochemical process. This observation supports the understanding that the rate at which the oxidation reaction occurs is influenced by the scan rate. Additionally, a linear relationship was observed between the logarithm of the scan rate and the peak potential, as depicted in Figure S1. This linear relationship was described by the following regression equation:
Ep = 0.0482 log ʋ + 0.7738 (R2 = 0.964)
and thus the number of electrons involved in the irreversible redox process of MOV with an rGO-SPCE can be estimated according to Laviron’s theory [34] for an irreversible process and the following equation exists:
E p = E 0 + 2.303 R T α n F l o g R T K 0 α n F + 2.303 R T α n F l o g υ 4 ,
where E0 is the formal standard potential, k0 is the standard heterogeneous reaction rate constant, n is the transfer electron number, α refers to the charge transfer coefficient, and ʋ, R, T, and F have their usual meanings. Since in this study the slope was 0.0482 (Figure S1), the value of αn was evaluated as 1.224. Likewise, the value of α can be estimated as follows:
ΔEp = Ep − Ep/2 = (47.7/α) mV
Thus, α was determined as 0.62 and the number of electrons transferred in the oxidation process was 1.974.

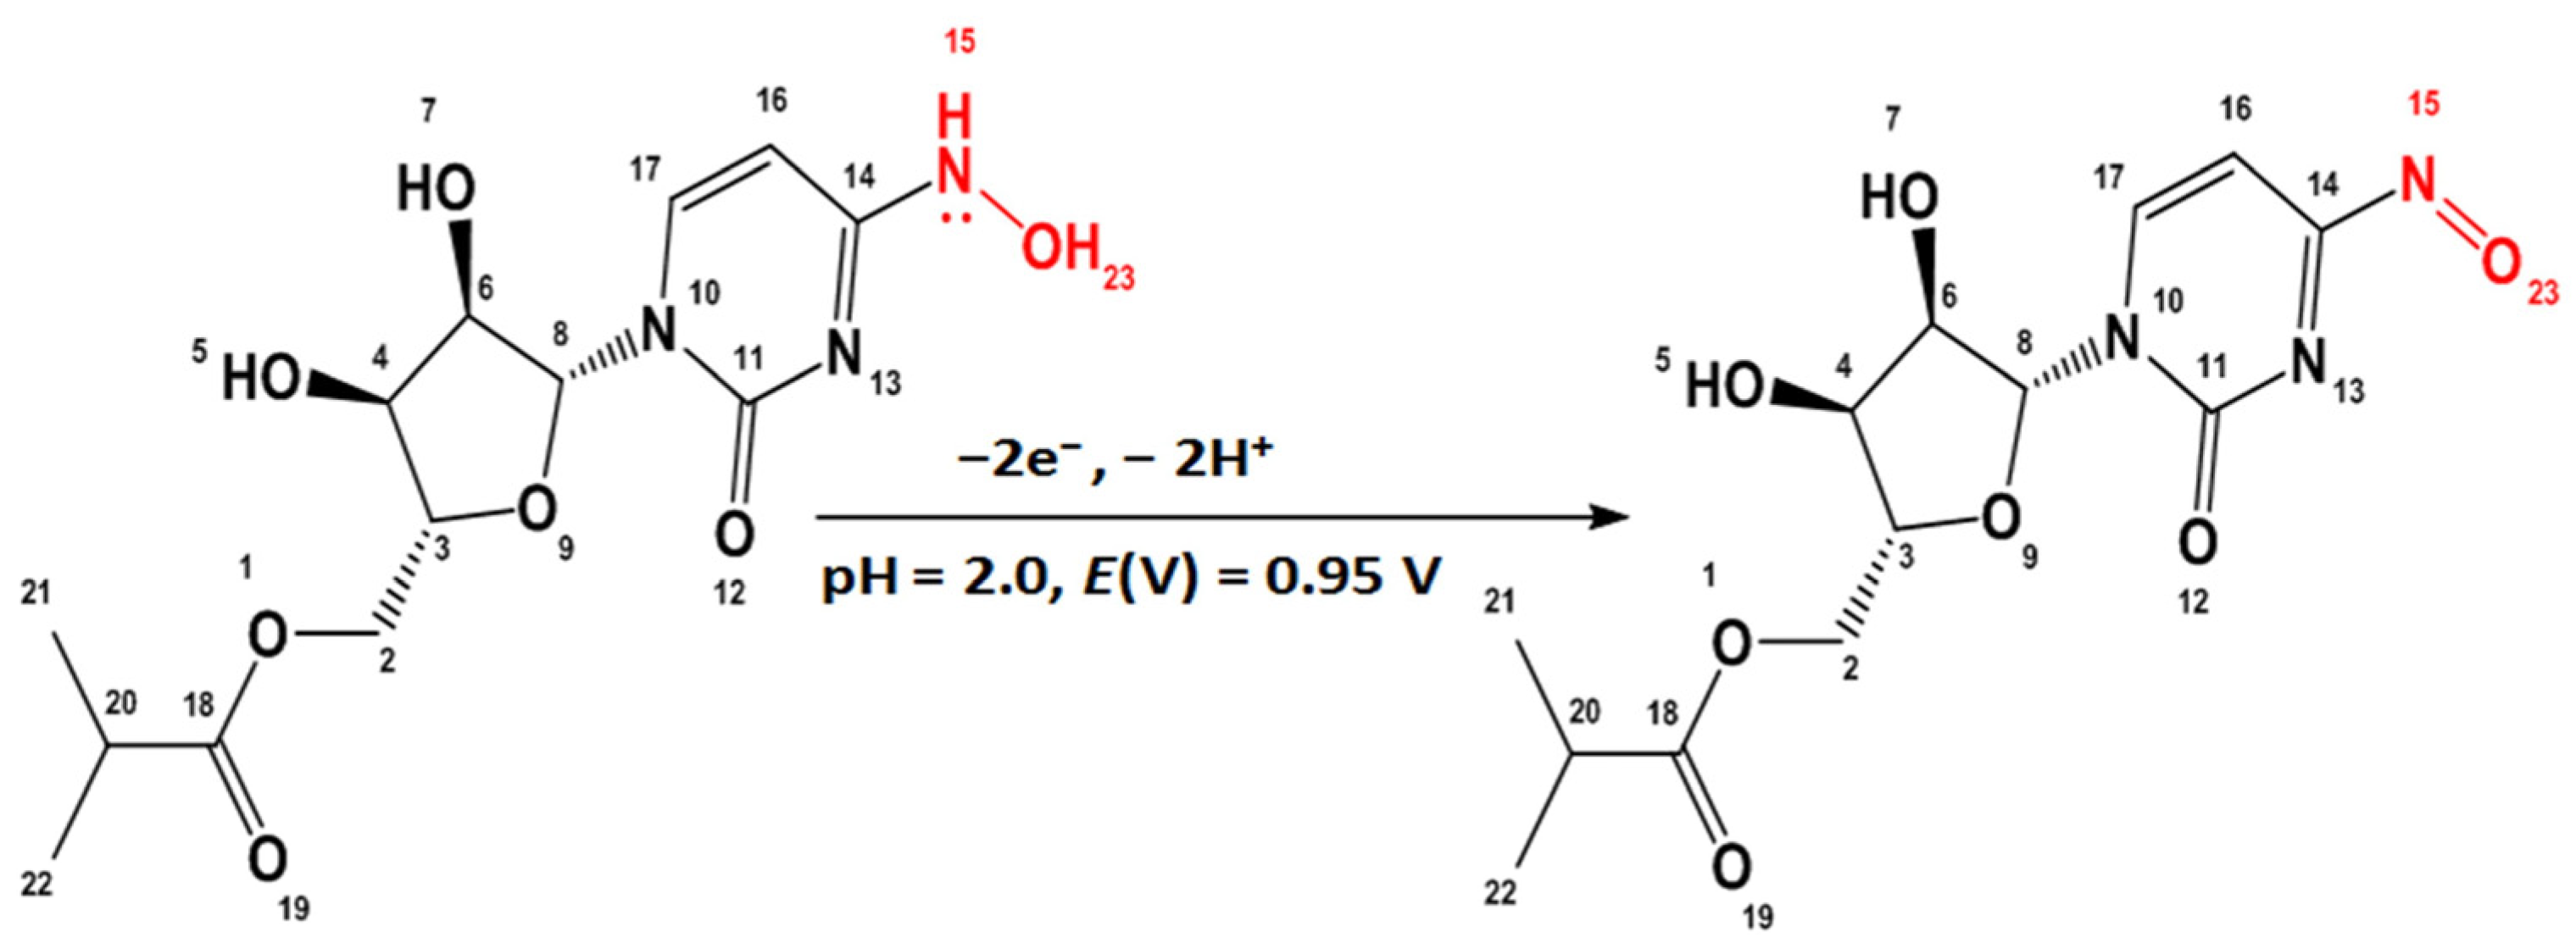
3.1.5. Proposed Oxidation Mechanism of MOV Using the rGO-SPCE 2.5%

The number of electrons transferred during the oxidation of MOV was found to be 1.974, which is close to 2. This confirms the proposed oxidation mechanism for MOV. A possible electrooxidation mechanism for MOV at the electrode surface is illustrated in Scheme 1. The terminal aliphatic side chain contains two atoms (N15 and O23) that can donate electrons. This makes it likely that two unlocalized lone pairs of electrons in the N enamine will be lost, along with two protons from the N enamine and O alcohol. This would form a π-bond at E = 0.95 V. It is possible that, in the first step, MOV loses one electron to become a cation radical. This is followed by the loss of protons; in the next step, another electron is transferred to form a π-bond.

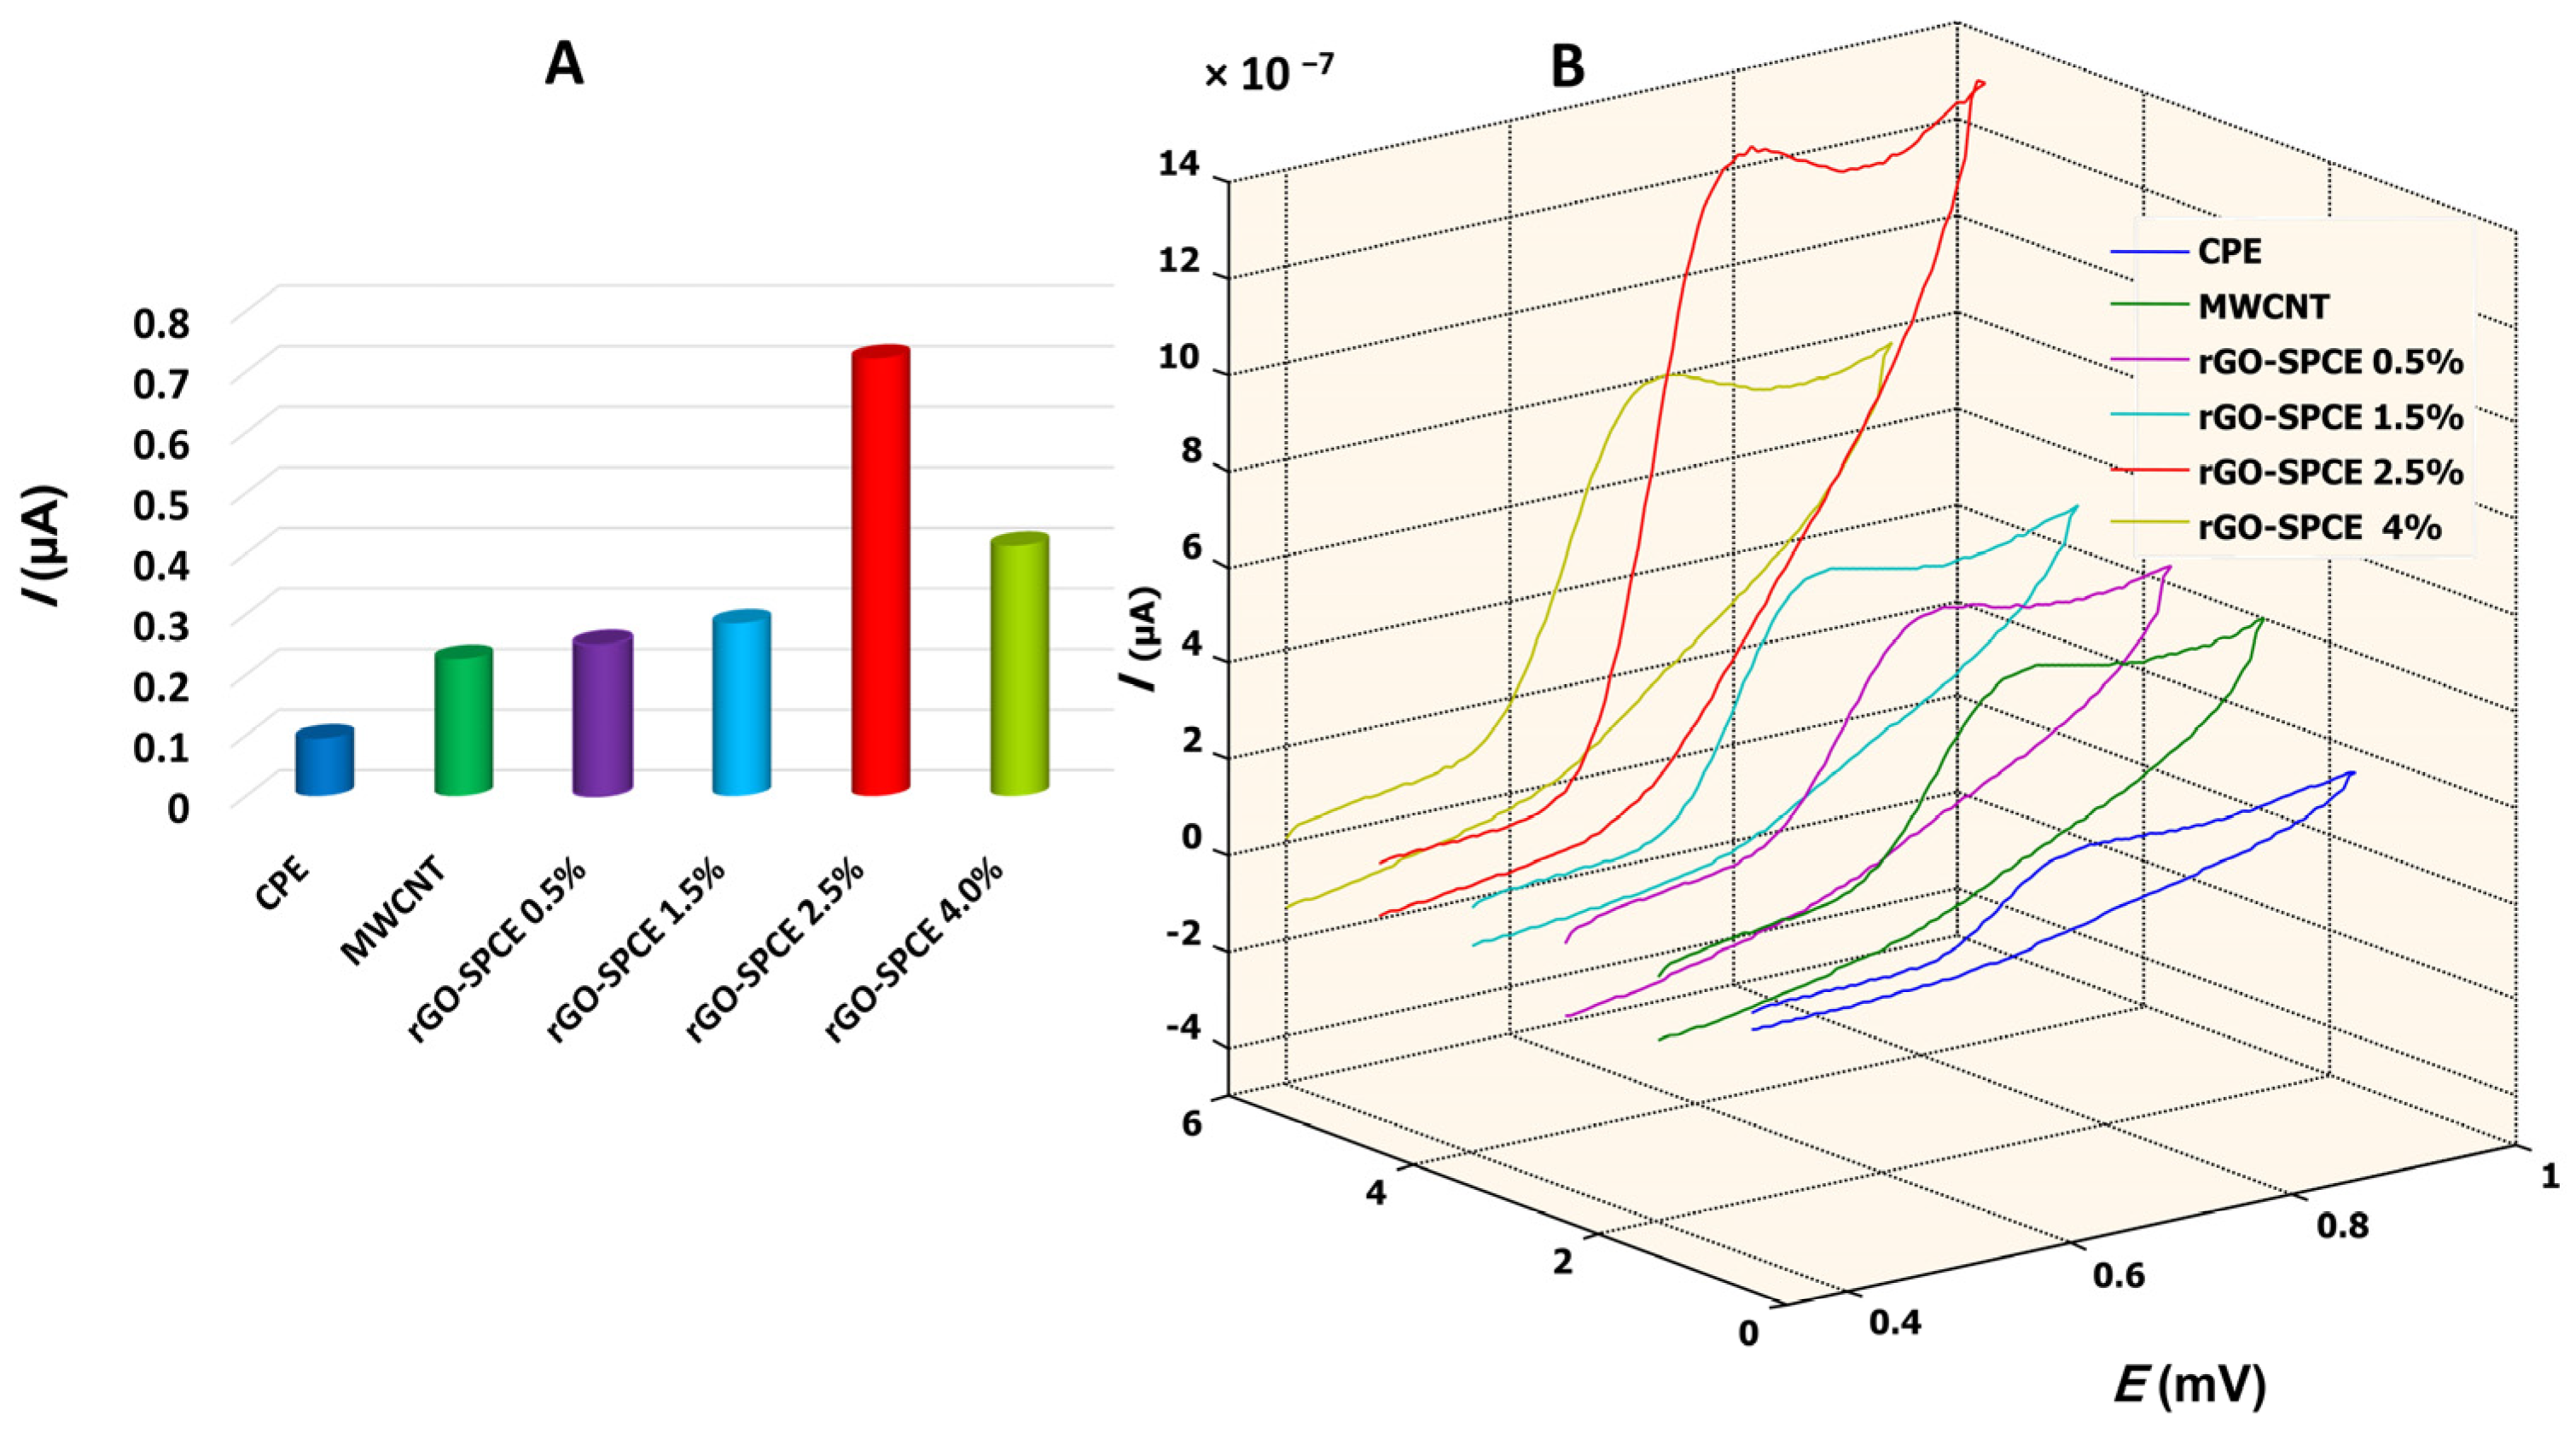
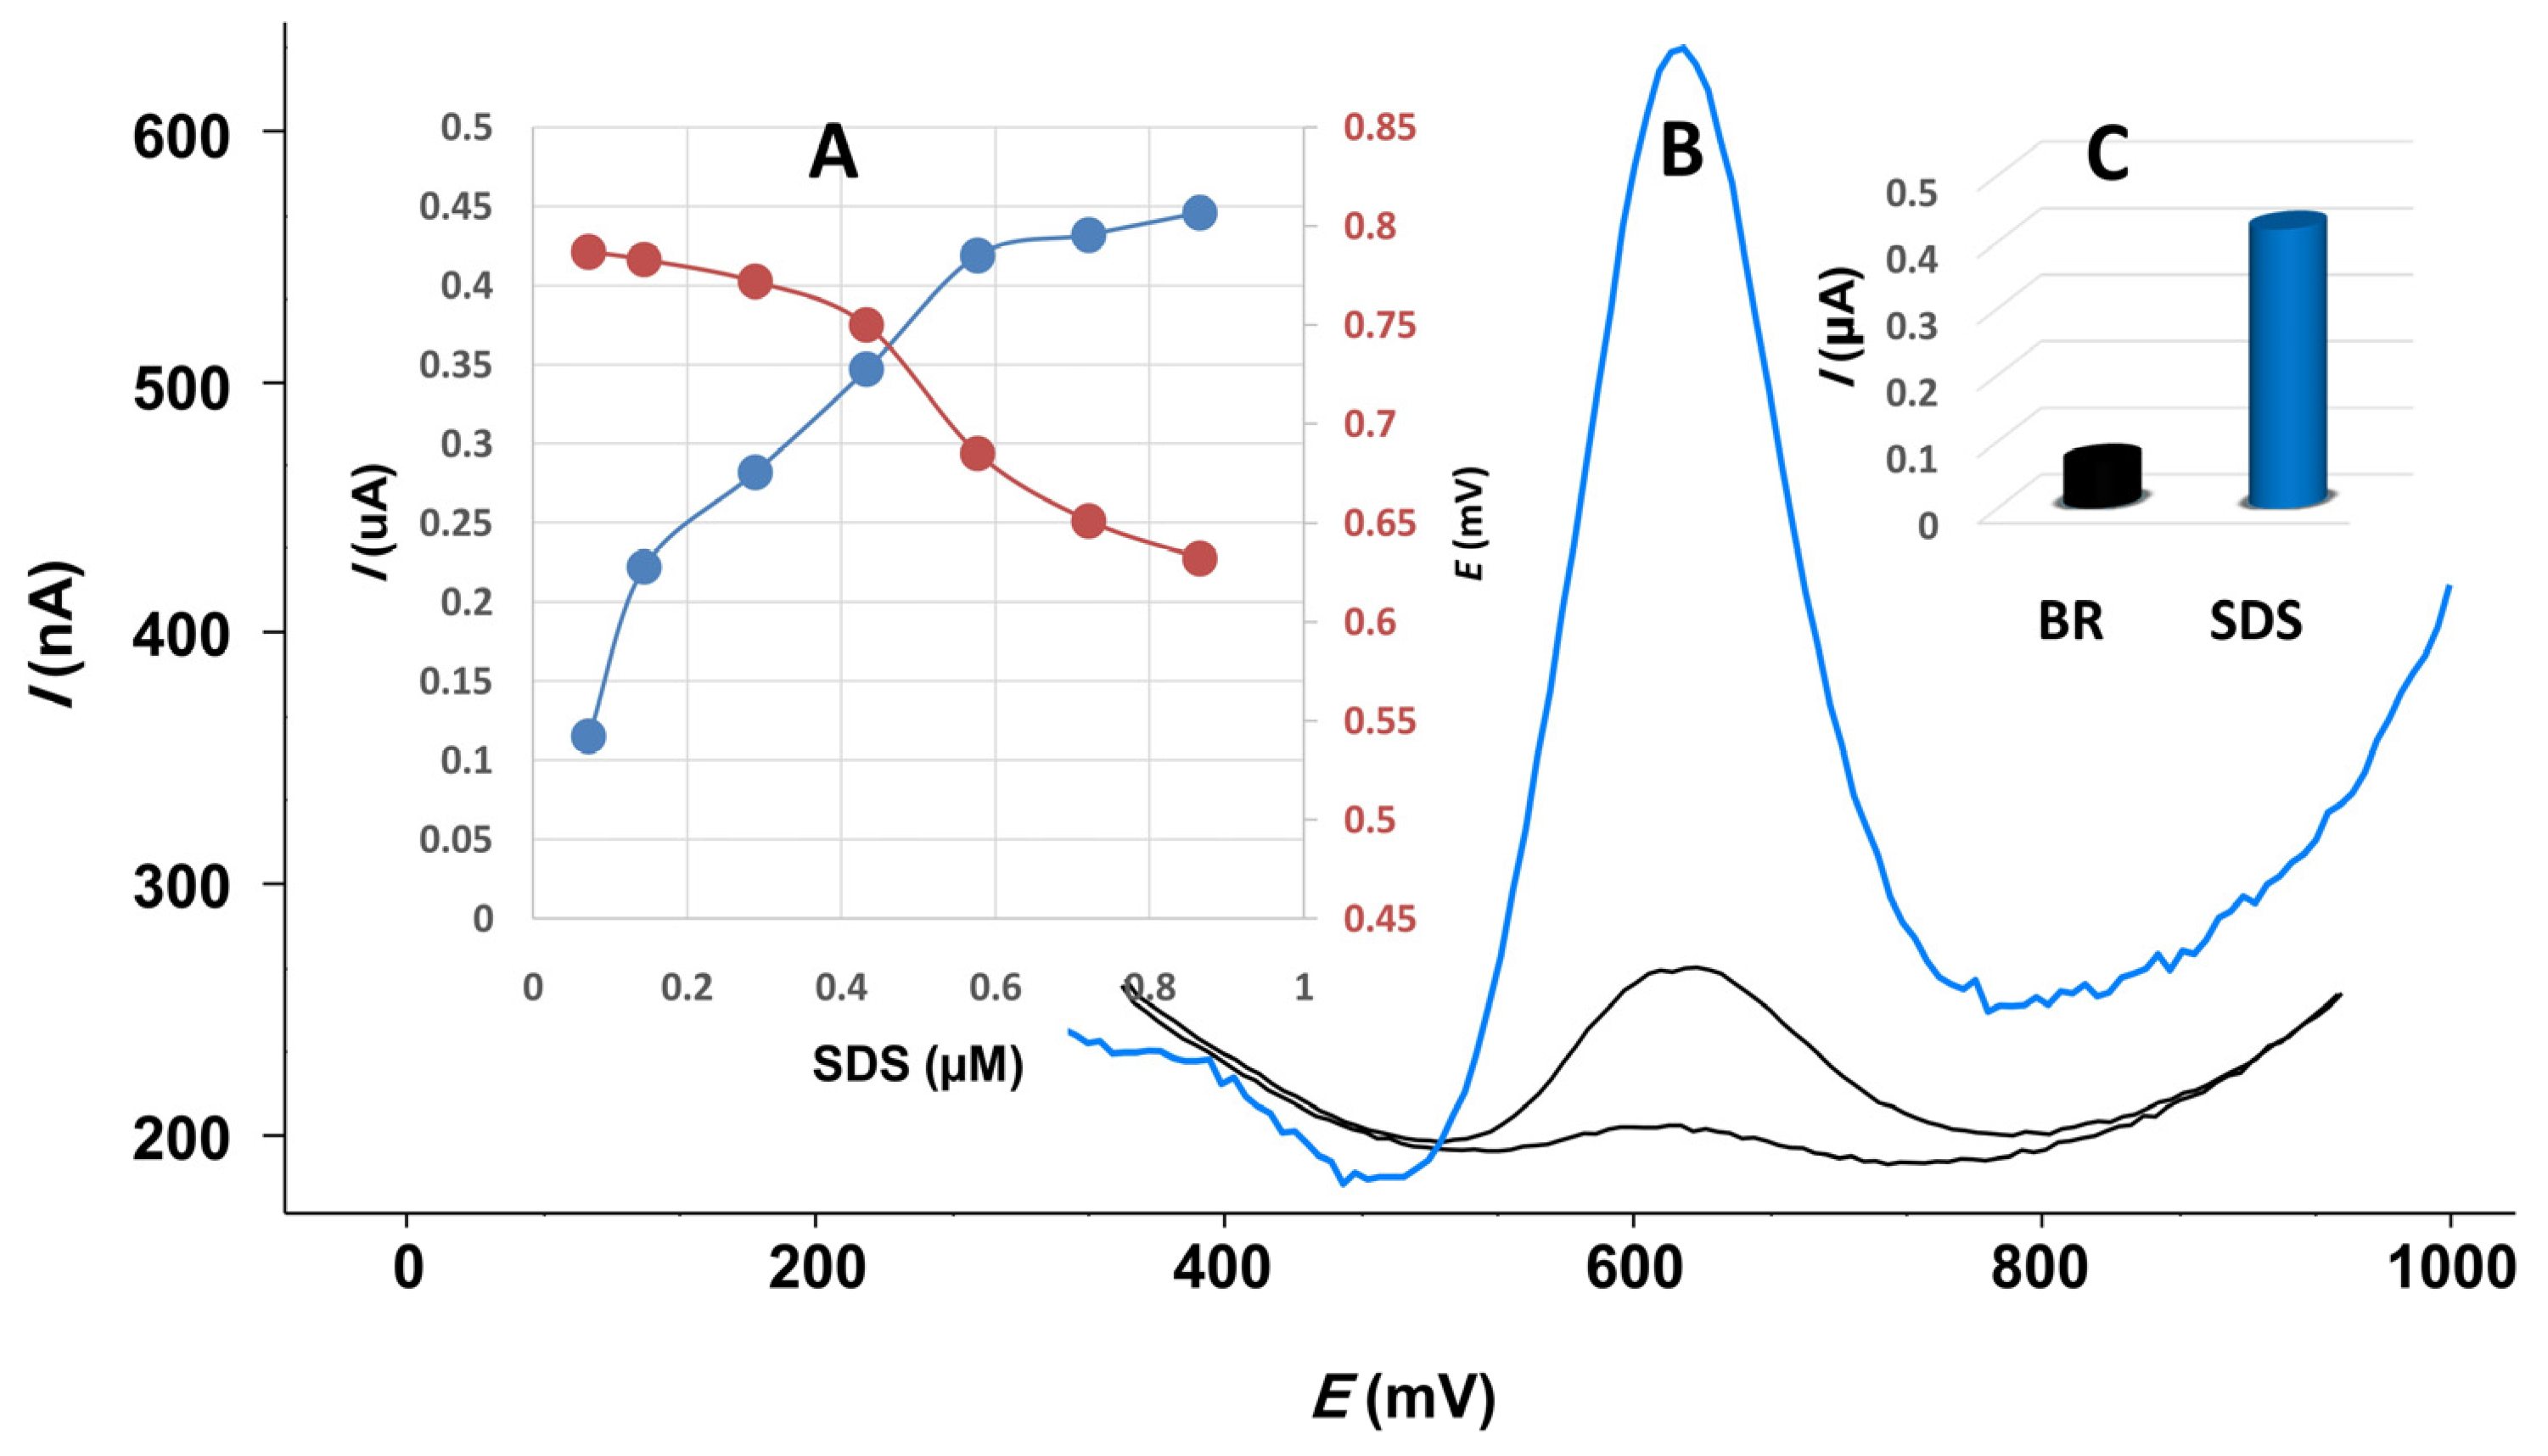
3.1.6. Effect of Surfactant Concentration

In general, surfactants can be utilized to improve the performance of redox reactions in both bulk solutions and on the surface of electrodes by modifying the properties of the electrode surfaces. In this study, several surfactants, including SDS, Triton X-100, and CTAB, were investigated for their potential effects. The study demonstrated that when the surfactant CTAB was used, peak height and peak position were essentially unchanged, whereas peak height was reduced when using Triton X-100. However, the application of SDS resulted in a noticeable negative shift in the peak position (as demonstrated in Figure 7A) and an enhancement of peak height (as displayed in Figure 7B). Figure 7C shows the considerable differences in MOV peak heights at the surface of rGO-SPCE 2.5% when SDS was absent (BR alone) or present. Because of SDS’s unique features, it can be self-assembled into micelles, which are small clusters of surfactant molecules with a hydrophobic core and a hydrophilic outer layer. The application of SDS leads to a decrease in the interface between MOV and the electrode surface. This decrease in the interface is evident from the increase in peak height shown in Figure 7B. By reducing the MOV–electrode surface interaction, SDS facilitates the oxidation process by allowing the reactants to reach the electrode surface and participate in redox reactions more easily [35,36]. Therefore, SDS was chosen as a surfactant and was added to the supporting electrolyte solution at final concentration of 3 µM.

3.2. Method Validation

In the development of a voltammetric method for the determination of MOV, we selected the DPV mode as the peaks were sharper and better defined at lower concentrations of MOV than those produced by CV. Additionally, low background current in the DPV mode resulted in enhanced resolution. By conducting differential pulse measurements, several parameters can be optimized to improve the accuracy and quality of the results. Selecting a pulse amplitude of 100 mV, a pulse time of 20 ms, and a scan rate of 100 mV/s led to superior results, which were characterized by enhanced sensitivity and well-defined waveforms with narrow peak widths. According to ICH guidelines [37], the validity of the proposed method was assessed by studying the following parameters: linearity, range, limit of detection (LOD), limit of quantification (LOQ), precision, robustness, and specificity.

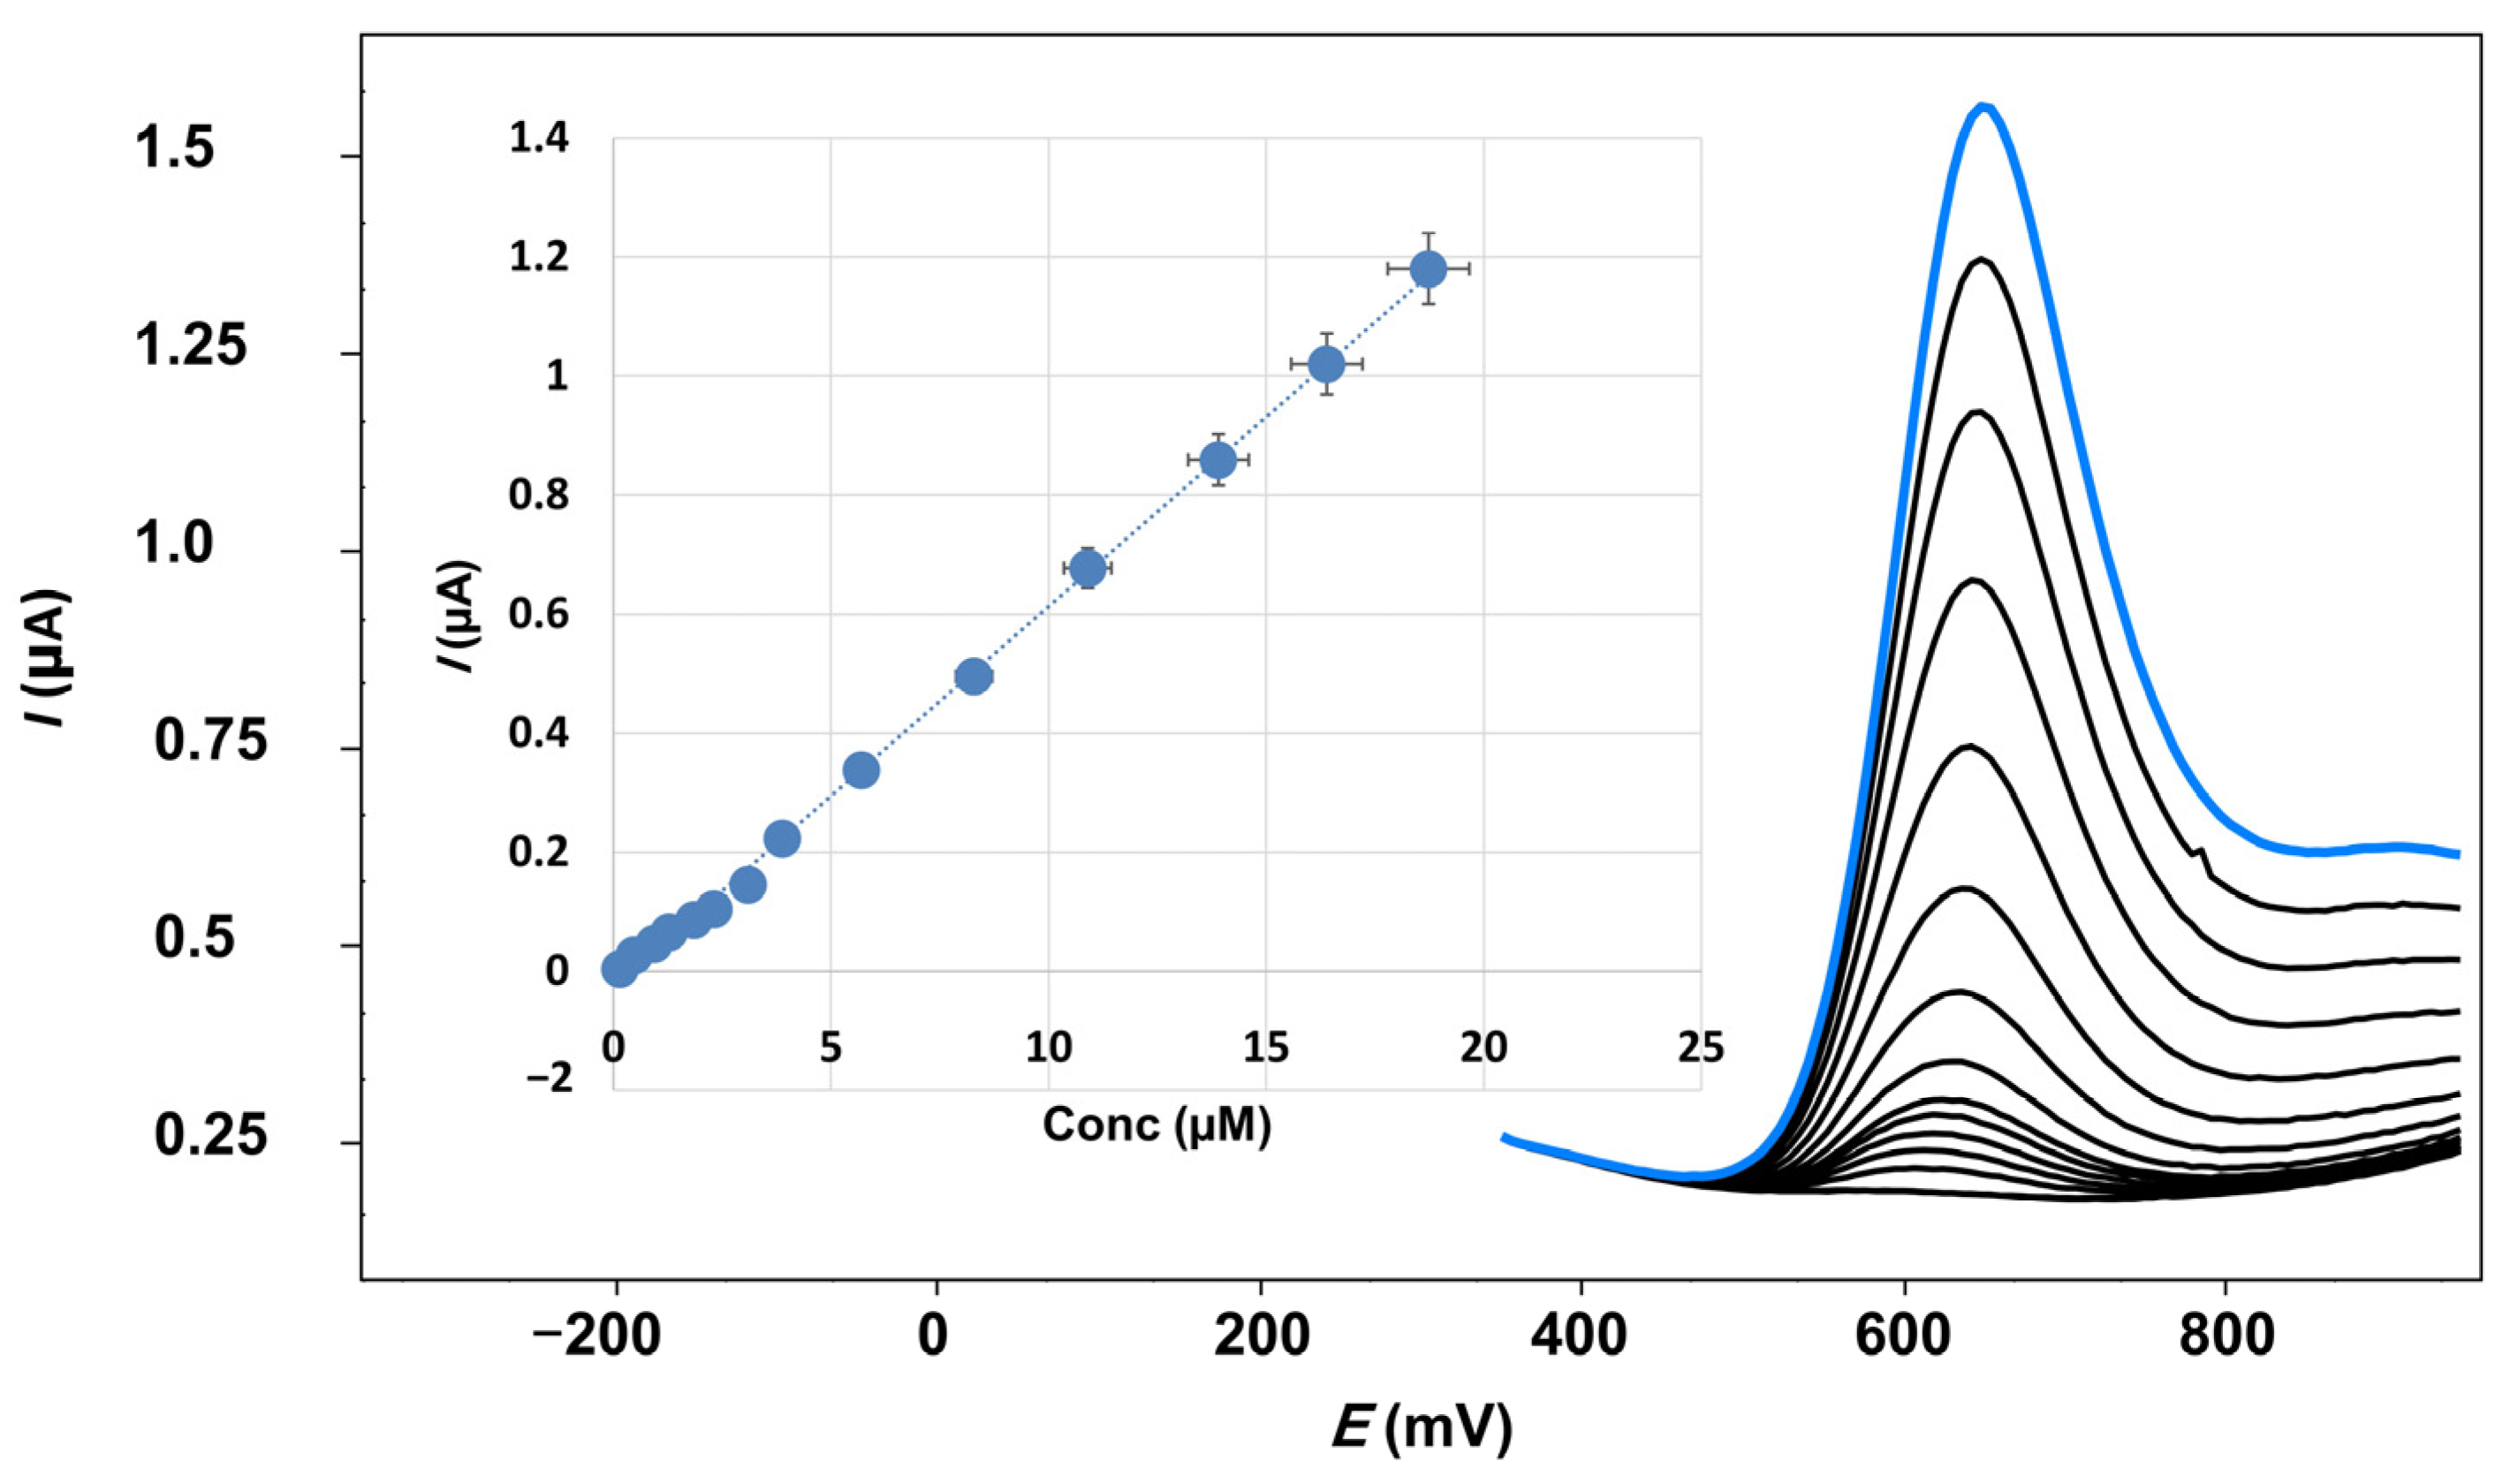
3.2.1. Linearity, Limit of Detection, and Limit of Quantification

Figure 8 presents the voltammograms, which clearly depict the impact of varying MOV concentrations. It is evident also that lower MOV concentrations yielded distinct and sharper peaks. Notably, when using an rGO-SPCE 2.5%, an increase in MOV concentration led to a significant enhancement in the intensity of the anodic peaks. This enhancement was visually observable, indicating a broad linearity range. The proposed method demonstrated linearity over a concentration range of 0.152–18.272 µM, as confirmed by plotting the peak current against the MOV concentration (Figure 8). Table 2 further confirms these experimental results, showing a high degree of linearity with a correlation coefficient of 0.9989. The statistical analysis of the data in Table 2 revealed low values for the standard deviation (SD), standard error (SE), and relative standard deviation (RSD). These low values indicate that the calibration curve is very linear, with very little scatter in the data points. This is important because it ensures that the method is accurate and reliable over the designated concentration range.
The LOD and LOQ were determined in accordance with the ICH guidelines, utilizing the formulas LOD = 3.3 SD/S and LOQ = 10 SD/S, where S represents the slope of the linear calibration curve and SD represents the standard deviation. The LOD of MOV was determined to be 0.048 µM, whereas the LOQ was found to be 0.147 µM. These values demonstrate the higher sensitivity achieved by the developed method in detecting and quantifying MOV.

3.2.2. Precision

To assess the precision of the proposed method, both intra-day and inter-day precision were evaluated. For intra-day precision, three different concentrations of freshly prepared working standard solutions were assayed in triplicate on the same day. For inter-day precision, the same samples were analyzed on three consecutive days. The results obtained from these assessments demonstrated a high level of precision in the developed rGO-SPCE 2.5% analytical platform. This indicates that the developed method produces reliable and consistent results. The detailed results can be found in Table 2, which further confirm the method’s precision and its applicability in ensuring the quality control of MOV.

3.2.3. Specificity

The DPV assay procedure’s specificity for measuring MOV was thoroughly examined in the presence of various excipients, including microcrystalline cellulose, starch, colloidal anhydrous silica, talc, Cl, SO42, Na+, K+, and Mg2+. Different concentrations of these excipients were introduced to a solution containing MOV (at a concentration of 2 µg/mL) and analyzed using the proposed rGO-SPCE 2.5%. The resulting percentage recoveries obtained from three replicate measurements ranged from 99.1% to 101.2%. These recoveries demonstrated that no significant interferences were detected from the excipients.

3.2.4. Robustness

The robustness of an analytical procedure refers to its ability to withstand small, intentionally introduced variations in method parameters without significant impact. In the case of the proposed method, robustness was demonstrated by the consistent peak current observed despite deliberate minor changes to the experimental parameters. The studied variables included change in pH (±0.2) and the time considered before each measurement (10 s ± 5 s). These minor changes, which may take place during the experimental operation, did not affect the peak current intensity of the studied drug, indicating the reliability of the proposed method.

3.3. Applications

3.3.1. Pharmaceutical Dosage Form

To assess the suitability of the proposed method for analyzing real samples, rGO-SPCE 2.5% was successfully employed for the determination of MOV in pharmaceutical dosage forms. The outcomes of this analysis are provided in Table 3. The results demonstrate that the recovery of MOV fell within the range of 101.24% to 98.67%. In order to validate the precision and accuracy of the voltammetric determination of MOV using the proposed electrode, t-tests and F-tests were also conducted. These statistical tests were performed to ascertain whether there were any significant disparities in the means of analysis between the voltammetric method and the reference technique, HPLC [38]. The results from these tests revealed no significant differences, confirming the acceptable precision of the voltammetric method in quantifying MOV and indicating a close alignment between the results obtained using the proposed analytical platform and those obtained by the reference HPLC method. Thus, the proposed rGO-SPCE 2.5% exhibits promise for the reliable analysis of MOV in practical applications. Overall, Table 3 presents the recovery rates of MOV within the specified range.

3.3.2. Human Biofluids

The proposed method was employed to determine the concentration of MOV in spiked serum and urine samples. Known quantities of MOV were added to blank serum and urine, and the recoveries were calculated and presented in Table 4. Notably, no interference from noise peaks or oxidation compounds was observed within the potential range where the analyte’s peak appeared. The obtained recoveries for urine samples ranged from 99.75% to 100.80%, whereas for serum samples, they ranged from 99.08% to 100.52%. These results provide confidence in the reliability and applicability of the proposed method for the analysis of MOV in both urine and serum matrices. The method also ensures accurate and precise measurements without interference from matrix ingredients, confirming the suitability of the method for practical applications in clinical or research settings.

3.4. Stability of the Modified Electrode

To assess the stability of the rGO-SPCE 2.5%, the CV response was investigated in a solution containing 1 mM [Fe(CN)6]3−/4− and 0.1 M KCl [39]. The measurements were recorded weekly over a period of three months under refrigeration. A total of three runs were conducted, and the average RSD was found to be 1.15%. Notably, both the anodic and cathodic peak currents exhibited relatively stable behavior throughout the testing period. However, the developed sensor’s stability study revealed that the rGO-SPCE had good storage stability over a period of six weeks for the measurement of MOV. The repetitive measurements demonstrated the good reproducibility of the rGO-SPCE 2.5% and indicated that it was not susceptible to surface-related issues.

3.5. Assessment of the Greenness Profile

AGREE software was used to assess the greenness of the proposed electrochemical technique [40]. AGREE is a software calculator that evaluates 12 parameters of green analytical aspects, each of which represents one of the green analytical chemistry standards. The results of the assessment are shown in Figure 9. This figure shows the 12 parameters with different colors, ranging from dark green (low environmental impact) to red (high environmental impact). The majority of the parameters are dark green, with the exception of sections 1, 7, and 11, which are pale green. These three parameters have a higher environmental impact than the others. An excellent green analysis is a score of >75, an acceptable green analysis is a score of >50, and if the technique receives a score of 50, it will be deemed to have an inadequate green analysis [41]. The proposed electrochemical technique scores 0.91, which is a high score and indicates that the method has excellent green credentials and has the potential to be a more environmentally friendly alternative to traditional analytical methods.

3.6. The Features of the Developed Methodology Based on rGO-SPCE in Terms of Performance and Economic Perspective

Although reduced graphene oxide has been employed as a modifier in a glassy carbon electrode [11] for measuring MOV in dosage forms, it demonstrated significant analytical advantages when combined with a screen-printed electrode in the current investigation. Glassy carbon electrodes have the drawback of frequently being impractical for use in products, particularly when disposable or semi-disposable electrodes are required. The benefits of the screen-printed carbon electrode are that a whole electrochemical cell can be printed into an extremely tiny area and that it can be a disposable component. The memory effect and labor-intensive pre-treatment steps of glassy carbon electrodes are thus avoided by the disposable, inexpensive rGO-SPCEs. Moreover, the disposable screen-printed sensor is appropriate for the successful and accurate determination of MOV in biomatrices because the rGO-SPCE has a strong selectivity towards the potential interferences of biofluid matrices such as human serum and urine. Surfactants (SDS), on the other hand, have been employed in the current study to improve the voltammetric method’s sensitivity. SDS in the electrolyte solution can improve the wettability of the rGO-SPCE’s surface, improving its performance. In other words, SDS enhances oxidation by enabling reactants to have easy access to the rGO-SPCE surface, allowing them to be involved in the redox process. To the best of our knowledge, no studies referring to the voltammetric determination of MOR have been reported in the literature, either for rGO-modified screen-printed electrodes or those in the presence of SDS as a surfactant.

4. Conclusions

In this study, a novel disposable 2.5% modified rGO-SPCE analytical platform has been applied to determine MOV in pure, dosage, and biological fluid forms using DPV. MOV determination with an rGO-SPCE offers a precise technique, where the voltammetric oxidation behavior of the analyte appears to be a single anodic peak. Employing SDS results in increased surface area and greater stability in aqueous solutions. Because of its simplicity and time-saving and real-time analytical properties, the proposed approach was adopted as an ecologically friendly alternative method for MOV measurement. The MOR recoveries from urine and serum ranged from 99.75% to 100.80% and 99.08% to 100.52%, respectively, indicating the method’s reliability and appropriateness for the measurement of the tested analyte in biofluid matrices. Because the modified rGO-SPCE sensor has remarkable features, such as a low detection limit, high sensitivity and selectivity, and a quick response time, it could replace existing expensive techniques for measuring MOV in various matrices.

Supplementary Materials

The following supporting information can be downloaded at: https://www.mdpi.com/article/10.3390/chemosensors11090471/s1, Figure S1: A linear relationship between the logarithm of the scan rate and the peak potential. Figure S2: An illustrative diagram of the in-house preparation of the rGO-SPCE.

Author Contributions

A.N.: sample analysis, investigation, validation, and writing—original draft; H.A.M.H.: conceptualization, methodology and results interpretation; R.A.-S.: conceptualization and supervision; R.M.A.: investigation, sample analysis and English editing; A.S.: investigation, results interpretation, validation and writing—original draft; S.E.: conceptualization and supervision; N.I.: methodology, sample analysis; results interpretation, validation and writing—original draft. All authors have read and agreed to the published version of the manuscript.

Funding

This research received no external funding.

Institutional Review Board Statement

Not applicable.

Informed Consent Statement

Not applicable.

Data Availability Statement

The data presented in this study are available in the manuscript and supplementary martial.

Conflicts of Interest

The authors declare no conflict of interest.

References

  1. Mohan, B.; Vinod, N. COVID-19: An Insight into SARS-CoV-2 Pandemic Originated at Wuhan City in Hubei Province of China. J. Infect. Dis. Epidemiol. 2020, 6, 146. [Google Scholar] [CrossRef]
  2. Abdelazim, A.H.; Abourehab, M.A.S.; Abd Elhalim, L.M.; Almrasy, A.A.; Ramzy, S. Green Adherent Spectrophotometric Determination of Molnupiravir Based on Computational Calculations; Application to a Recently FDA-Approved Pharmaceutical Dosage Form. Spectrochim. Acta Part A Mol. Biomol. Spectrosc. 2023, 285, 121911. [Google Scholar] [CrossRef]
  3. Mohamed, A.R.; Abolmagd, E.; Nour, I.M.; Badrawy, M.; Hasan, M.A. Earth-Friendly-Assessed Silver-Nanoparticles Spectrophotometric Method for Rapid and Sensitive Analysis of Molnupiravir, an FDA-Approved Candidate for COVID-19: Application on Pharmaceutical Formulation and Dissolution Test. BMC Chem. 2023, 17, 13. [Google Scholar] [CrossRef] [PubMed]
  4. Salman, B.I.; Hara, M.A.; El Deeb, S.; Ibrahim, A.E.; Saraya, R.E.; Ali, M.F.B. Zinc(II) Complexation Strategy for Ultra-Sensitive Fluorimetric Estimation of Molnupiravir: Applications and Greenness Evaluation. Arch. Pharm. 2023, 356, e2300005. [Google Scholar] [CrossRef] [PubMed]
  5. Sharaf, Y.A.; El Deeb, S.; Ibrahim, A.E.; Al-Harrasi, A.; Sayed, R.A. Two Green Micellar HPLC and Mathematically Assisted UV Spectroscopic Methods for the Simultaneous Determination of Molnupiravir and Favipiravir as a Novel Combined COVID-19 Antiviral Regimen. Molecules 2022, 27, 2330. [Google Scholar] [CrossRef] [PubMed]
  6. Reçber, T.; Timur, S.S.; Kablan, S.E.; Yalçın, F.; Karabulut, T.C.; Gürsoy, R.N.; Eroğlu, H.; Kır, S.; Nemutlu, E. A Stability Indicating RP-HPLC Method for Determination of the COVID-19 Drug Molnupiravir Applied Using Nanoformulations in Permeability Studies. J. Pharm. Biomed. Anal. 2022, 214, 114693. [Google Scholar] [CrossRef]
  7. Saraya, R.E.; ElDeeb, S.; Salman, B.I.; Ibrahim, A.E. Highly Sensitive High-Performance Thin-Layer Chromatography Method for the Simultaneous Determination of Molnupiravir, Favipiravir, and Ritonavir in Pure Forms and Pharmaceutical Formulations. J. Sep. Sci. 2022, 45, 2582–2590. [Google Scholar] [CrossRef]
  8. Amara, A.; Penchala, S.D.; Else, L.; Hale, C.; FitzGerald, R.; Walker, L.; Lyons, R.; Fletcher, T.; Khoo, S. The Development and Validation of a Novel LC-MS/MS Method for the Simultaneous Quantification of Molnupiravir and Its Metabolite ß-d-N4-Hydroxycytidine in Human Plasma and Saliva. J. Pharm. Biomed. Anal. 2021, 206, 114356. [Google Scholar] [CrossRef]
  9. Parsons, T.L.; Kryszak, L.A.; Marzinke, M.A. Development and Validation of Assays for the Quantification of β-D-N4-Hydroxycytidine in Human Plasma and β-D-N4-Hydroxycytidine-Triphosphate in Peripheral Blood Mononuclear Cell Lysates. J. Chromatogr. B Anal. Technol. Biomed. Life Sci. 2021, 1182, 122921. [Google Scholar] [CrossRef]
  10. Gupta, V.K.; Karimi-Maleh, H.; Sadegh, R. Simultaneous Determination of Hydroxylamine, Phenol and Sulfite in Water and Waste Water Samples Using a Voltammetric Nanosensor. Int. J. Electrochem. Sci. 2015, 10, 303–316. [Google Scholar] [CrossRef]
  11. Kablan, S.E.; Reçber, T.; Tezel, G.; Timur, S.S.; Karabulut, C.; Karabulut, T.C.; Eroğlu, H.; Kır, S.; Nemutlu, E. Voltammetric Sensor for COVID-19 Drug Molnupiravir on Modified Glassy Carbon Electrode with Electrochemically Reduced Graphene Oxide. J. Electroanal. Chem. 2022, 920, 116579. [Google Scholar] [CrossRef]
  12. Vural, K.; Karakaya, S.; Dilgin, D.G.; Gökçel, H.İ.; Dilgin, Y. Voltammetric Determination of Molnupiravir Used in Treatment of the COVID-19 at Magnetite Nanoparticle Modified Carbon Paste Electrode. Microchem. J. 2023, 184, 108195. [Google Scholar] [CrossRef] [PubMed]
  13. Erk, N.; Bouali, W.; Mehmandoust, M.; Soylak, M. An Electrochemical Sensor for Molnupiravir Based on a Metal-Organic Framework Composited with Poly(3,4-Ethylene Dioxythiophene): Poly(Styrene Sulfonate). ChemistrySelect 2022, 7, e202203325. [Google Scholar] [CrossRef]
  14. Li, M.; Li, Y.T.; Li, D.W.; Long, Y.T. Recent Developments and Applications of Screen-Printed Electrodes in Environmental Assays—A Review. Anal. Chim. Acta 2012, 734, 31–44. [Google Scholar] [CrossRef] [PubMed]
  15. Antuña-Jiménez, D.; González-García, M.B.; Hernández-Santos, D.; Fanjul-Bolado, P. Screen-Printed Electrodes Modified with Metal Nanoparticles for Small Molecule Sensing. Biosensors 2020, 10, 9. [Google Scholar] [CrossRef] [PubMed]
  16. Pereira, D.F.; Santana, E.R.; Spinelli, A. Electrochemical paper-based analytical devices containing magnetite nanoparticles for the determination of vitamins B2 and B6. Microchem. J. 2022, 179, 107588. [Google Scholar] [CrossRef]
  17. Torres-Rivero, K.; Torralba-Cadena, L.; Espriu-Gascon, A.; Casas, I.; Bastos-Arrieta, J.; Florido, A. Strategies for Surface Modification with Ag-Shaped Nanoparticles: Electrocatalytic Enhancement of Screen-Printed Electrodes for the Detection of Heavy Metals. Sensors 2019, 19, 4249. [Google Scholar] [CrossRef]
  18. Meier, J.; Schiøtz, J.; Liu, P.; Nørskov, J.K.; Stimming, U. Nano-Scale Effects in Electrochemistry. Chem. Phys. Lett. 2004, 390, 440–444. [Google Scholar] [CrossRef]
  19. Li, C.M.; Hu, W. Electroanalysis in Micro- and Nano-Scales. J. Electroanal. Chem. 2013, 688, 20–31. [Google Scholar] [CrossRef]
  20. Jirasirichote, A.; Punrat, E.; Suea-Ngam, A.; Chailapakul, O.; Chuanuwatanakul, S. Voltammetric Detection of Carbofuran Determination Using Screen-Printed Carbon Electrodes Modified with Gold Nanoparticles and Graphene Oxide. Talanta 2017, 175, 331–337. [Google Scholar] [CrossRef]
  21. Fernández, C.M.; Martin, V.C. Preparation d’un Tampon Universel de Force Ionique 0.3 M. Talanta 1977, 24, 747–748. [Google Scholar] [CrossRef] [PubMed]
  22. Rizk, M.; Taha, E.A.; El-Alamin, M.M.A.; Hendawy, H.A.M.; Sayed, Y.M. Highly Sensitive Carbon Based Sensors Using Zinc Oxide Nanoparticles Immobilized Multiwalled Carbon Nanotubes for Simultaneous Determination of Desvenlafaxine Succinate and Clonazepam. J. Electrochem. Soc. 2018, 165, H333–H341. [Google Scholar] [CrossRef]
  23. Hendawy, H.A.M.; Salem, W.M.; Abd-Elmonem, M.S.; Khaled, E. Nanomaterial-Based Carbon Paste Electrodes for Voltammetric Determination of Naproxen in Presence of Its Degradation Products. J. Anal. Methods Chem. 2019, 2019, 5381031. [Google Scholar] [CrossRef]
  24. Jahani, P.M.; Beitollahi, H.; Tajik, S. Surface Amplification of Graphite Screen Printed Electrode Using Reduced Graphene Oxide/Polypyrrole Nanotubes Nanocomposite; a Powerful Electrochemical Strategy for Determination of Sulfite in Food Samples. Food Chem. Toxicol. 2022, 167, 113274. [Google Scholar] [CrossRef] [PubMed]
  25. Er, E. A Portable Electrochemical Platform Based on Graphene Nanosheets by Metal Intercalation Engineering for Anticancer Drug Pemetrexed Sensing. FlatChem 2022, 33, 100353. [Google Scholar] [CrossRef]
  26. Hasanpour, M.; Pardakhty, A.; Tajik, S. The Development of Disposable Electrochemical Sensor Based on MoSe2-RGO Nanocomposite Modified Screen Printed Carbon Electrode for Amitriptyline Determination in the Presence of Carbamazepine, Application in Biological and Water Samples. Chemosphere 2022, 308, 136336. [Google Scholar] [CrossRef]
  27. Barthasarathy, P.R.; Ahmed, N.A.; Salim, W.W.A.W. Reduced Graphene Oxide on Screen-Printed Carbon Electrodes as Biosensor for Escherichia Coli O157:H7 Detection. Proceedings 2020, 60, 13. [Google Scholar]
  28. Wu, Y.; Zhang, T.; Su, L.; Wu, X. Electrodeposited rGO/AuNP/MnO2 Nanocomposite-Modified Screen-Printed Carbon Electrode for Sensitive Electrochemical Sensing of Arsenic(III) in Water. Biosensors 2023, 13, 563. [Google Scholar] [CrossRef]
  29. Dinani, H.S.; Pourmadadi, M.; Yazdian, F.; Rashedi, H.; Ebrahimi, S.A.S.; Shayeh, J.S.; Ghorbani, M. Fabrication of Au/Fe3O4/RGO Based Aptasensor for Measurement of MiRNA-128, a Biomarker for Acute Lymphoblastic Leukemia (ALL). Eng. Life Sci. 2022, 22, 519–534. [Google Scholar] [CrossRef]
  30. Ngamchuea, K.; Eloul, S.; Tschulik, K.; Compton, R.G. Planar Diffusion to Macro Disc Electrodes—What Electrode Size Is Required for the Cottrell and Randles-Sevcik Equations to Apply Quantitatively? J. Solid State Electrochem. 2014, 18, 3251–3257. [Google Scholar] [CrossRef]
  31. Al Alamein, A.M.A.; Hendawy, H.A.M.; Elabd, N.O. Voltammetric Determination of Dicyclomine Hydrochloride by Carbon Paste Electrode Modified with Iron (III) Oxide Nanoparticles and Activated Glassy Carbon Electrode in Pharmaceutical Dosage Form, Human Plasma and Urine. Int. J. Electrochem. Sci. 2018, 13, 7989–8005. [Google Scholar] [CrossRef]
  32. Abdel Maksoud, M.I.A.; El-Sayyad, G.S.; Ashour, A.H.; El-Batal, A.I.; Abd-Elmonem, M.S.; Hendawy, H.A.M.; Abdel-Khalek, E.K.; Labib, S.; Abdeltwab, E.; El-Okr, M.M. Synthesis and Characterization of Metals-Substituted Cobalt Ferrite [Mx Co (1-x) Fe2O4; (M = Zn, Cu and Mn; x = 0 and 0.5)] Nanoparticles as Antimicrobial Agents and Sensors for Anagrelide Determination in Biological Samples. Mater. Sci. Eng. C Mater. Biol. Appl. 2018, 92, 644–656. [Google Scholar] [CrossRef] [PubMed]
  33. Hendawy, H.A.M.; Youssif, R.M.; Salama, N.N.; Fayed, A.S.; Salem, M.Y. Challenge Approach of an Inexpensive Electrochemical Sensor for Rapid Selective Determination of Two Non-Classical β-Lactams in Presence of Different Degradants and Interference Substances. Electroanalysis 2017, 29, 2708–2718. [Google Scholar] [CrossRef]
  34. Laviron, E. Surface Linear Potential Sweep Voltammetry. Equation of the Peaks for a Reversible Reaction When Interactions between the Adsorbed Molecules Are Taken into Account. J. Electroanal. Chem. 1974, 52, 395–402. [Google Scholar] [CrossRef]
  35. Fekry, A.M.; Shehata, M.; Azab, S.M.; Walcarius, A. Voltammetric Detection of Caffeine in Pharmacological and Beverages Samples Based on Simple Nano-Co (II, III) Oxide Modified Carbon Paste Electrode in Aqueous and Micellar Media. Sens. Actuators B Chem. 2020, 302, 127172. [Google Scholar] [CrossRef]
  36. Boltia, S.A.; Kandeel, N.H.; Hegazy, M.A.; Hendawy, H.A. Analytical Eco-Scale Determination of Vortioxetine using Advanced Electrochemical Platform for Screen-Printed Disposable Multi-Walled Carbon Nanotube Electrode in Presence of an Anionic Surfactant. New J. Chem. 2023, 47, 11015–11029. [Google Scholar] [CrossRef]
  37. International Conference on Harmonization (ICH: Q2). Guideline on Validation of Analytical Procedures: Text and Methodology; European Medicines Agency: Amsterdam, The Netherlands, 2005.
  38. Bindu, M.; Gandla, K.; Vemireddy, S.; Samuel, S.; Praharsha, Y. A Validated Stability Indicating RP-HPLC Method for the Determination of Molnupiravir in Pharmaceutical Dosage Form. World J. Adv. Res. Rev. 2022, 15, 580–590. [Google Scholar] [CrossRef]
  39. Lin, K.C.; Chen, S.M. Reversible Cyclic Voltammetry of the NADH/NAD+ Redox System on Hybrid Poly(Luminol)/FAD Film Modified Electrodes. J. Electroanal. Chem. 2006, 589, 52–59. [Google Scholar] [CrossRef]
  40. Soliman, S.S.; Sedik, G.A.; Elghobashy, M.R.; Zaazaa, H.E.; Saad, A.S. Greenness Assessment Profile of a QbD Screen-Printed Sensor for Real-Time Monitoring of Sodium Valproate. Microchem. J. 2022, 182, 107859. [Google Scholar] [CrossRef]
  41. El-Hanboushy, S.; Marzouk, H.M.; Fayez, Y.M.; Abdelkawy, M.; Lotfy, H.M. Sustainable spectrophotometric determination of antihypertensive medicines reducing COVID-19 risk via paired wavelength data processing technique-Assessment of purity, greenness and whiteness. Sustain. Chem. Pharm. 2022, 29, 100806. [Google Scholar] [CrossRef]
Figure 1. The chemical structure of MOV.
Chemosensors 11 00471 g001
Figure 2. (A) SEM image of a selected area of CPE. (B) SEM image of MWCNT-modified CPE. (C) SEM image of rGO-SPCE (2.5%). (D) EDX of rGO-SPCE (2.5%).
Chemosensors 11 00471 g002
Figure 3. Cyclic voltammograms of the different working electrodes in 1 mM [Fe(CN)6]3−/4− and 0.1 M KCl solution at a scan rate of 50 mV/s.
Chemosensors 11 00471 g003
Figure 4. (A) Dependence of the oxidation potential and current peak height of MOV in 0.04 M BR electrolyte solution with different pH values with the rGO-SPCE 2.5% using CV at scan rate 100 mV/s. (B) Comparison of the current peak height of 0.498 µM MOV in BR electrolyte solution (0.04 M) at different pH values using different sensors at scan rate 100 mV/s.
Chemosensors 11 00471 g004
Figure 5. (A) The current intensity of cyclic voltammograms at pH 2 employing different sensors. (B) Cycle voltammograms of 1.518 µM MOV in 0.04 M BR electrolyte solution (pH 2) using different sensors at scan rate 100 mV/s.
Chemosensors 11 00471 g005
Figure 6. Cyclic voltammograms for 1.518 µM MOV in 0.04 M BR electrolyte solution (pH 2) at different consecutive scan rates with the rGO-SPCE 2.5%. The inset figure is the linear relationship between log v(V/s) and I(µA).
Chemosensors 11 00471 g006
Scheme 1. Proposed oxidation mechanism of MOV using the rGO-SPCE 2.5%.
Chemosensors 11 00471 sch001
Figure 7. (A) Effect of SDS concentration on the peak potential and anodic peak current. (B) DPV of MOV (0.976 µM) in 0.04 M BR at the surface of CPE and rGO-SPCE 2.5%. (C) Peak potential at the surface of rGO-SPCE 2.5% in the absence and presence of SDS.
Chemosensors 11 00471 g007
Figure 8. Calibration curve of MOV using DPV method using an rGO-SPCE in 0.04 M BR electrolyte at pH 2 with 3 µM SDS.
Chemosensors 11 00471 g008
Figure 9. Analytical greenness metric for evaluation of the proposed method’s greenness.
Chemosensors 11 00471 g009
Table 1. Comparison of active surface area and redox characteristic peaks of the different studied electrodes.
ElectrodeΔE (mV)Ipa/Ipc (µA)Active Area (cm2)
CPE0.0890.860.035
MWCNT-modified CPE0.0890.8330.061
rGO-SPCE (0.5%)0.0890.7650.055
rGO-SPCE (1.5%)0.090.9250.076
rGO-SPCE (2.5%)0.0830.9920.083
rGO-SPCE (4.0%)0.0810.8620.086
Table 2. Characteristic parameters of the calibration line (n = 3) for the quantitative determinations of MOV using the rGO-SPCE 2.5% and the proposed voltammetric technique.
Parameters MOV
E (mV)641
pH2
Linearity range (µM)0.152–18.272
Intercept−0.0238
Slope0.0002
Multiple R0.9994
R square0.9989
Standard Error0.01
RSD1.43
LOD (µM)0.048
LOQ (µM)0.147
Intra-day precision of the peak current (RSD %)0.86
Inter-day precision of the peak current (RSD %)1.23
Intra-day precision of the peak potential (RSD %)0.95
Inter-day precision of the peak potential (RSD %)1.12
Table 3. Application of the proposed method for the determination of MOV in pharmaceutical dosage form and statistical comparative study between the proposed method and the reported method.
MOV
(Batch no. 2201112)
Added (µM)Found (µM)Bias (%)Developed Method Recovery (%) *Reported Method [38] Recovery (%) *
0.4550.449−1.3398.67100.12
1.3661.3811.11101.1198.97
2.4292.4591.26101.24100.18
7.2877.3120.34100.3499.95
Mean 100.3499.80
Variance 1.4080.319
F test4.41
t test.0.81
F tabulated a(9.28)
t tabulated a(2.45)
* Average of three determinations. a The values in parentheses are the corresponding tabulated values at p = 0.05.
Table 4. Analytical data for spiked human urine and serum of MOV on a rGO-SPCE 2.5%.
MOVSpiked (µM)Found (µM)Bias%Recovery (%)RSD (%)
Human urine0.7590.7650.79100.800.84
2.7332.7540.77100.771.05
4.5554.5760.46100.460.95
6.2256.210−0.2499.751.11
Human serum1.1541.1600.52100.521.24
2.2772.256−0.9299.080.98
5.4665.442−0.4499.560.78
7.5927.561−0.4199.591.33
Disclaimer/Publisher’s Note: The statements, opinions and data contained in all publications are solely those of the individual author(s) and contributor(s) and not of MDPI and/or the editor(s). MDPI and/or the editor(s) disclaim responsibility for any injury to people or property resulting from any ideas, methods, instructions or products referred to in the content.

