Article

Capacitive, Highly Selective Zeolite-Based Ammonia Sensor for Flue Gas Applications

Department of Functional Materials, Zentrum für Energietechnik (ZET), University of Bayreuth, D-95440 Bayreuth, Germany
*
Author to whom correspondence should be addressed.
Chemosensors 2023, 11(7), 413; https://doi.org/10.3390/chemosensors11070413
Submission received: 25 June 2023 / Revised: 14 July 2023 / Accepted: 18 July 2023 / Published: 22 July 2023
(This article belongs to the Section Applied Chemical Sensors)

Abstract

:
The selective detection of different gas components will remain of huge importance in the future, either in the ambient air or in flue gases, e.g., for controlling purposes of combustion processes. The focus here is on the development of a highly selective ammonia sensor that will be exemplarily used in the flue gas of biomass combustion plants with catalysts for nitrogen oxide reduction. Such applications require a robust sensor design, in this case, based on a ceramic substrate. The gaseous ammonia is detected with the help of a zeolite film, whose selective adsorption properties towards ammonia are already intensively being used in the field of flue gas catalysis. The adsorption and desorption of ammonia on the gas-sensitive zeolite film lead to changes in the dielectric properties of the functional material. Using an interdigital electrode (IDE) structure below the zeolite film, the capacitance was determined as a measure of the ammonia concentration in the gas. In this context, the fabrication of all layers of the sensor in the thick film with subsequent laser patterning of the IDE structure enables a cost-efficient and effective method. The functionality of this sensor principle was extensively tested during measurements in the laboratory. A high and fast response to ammonia was detected at different sensor temperatures. In addition, very low cross-sensitivities to other gas components such as water (very low) and oxygen (zero) were found.

1. Introduction

In the context of the energy system transition and the associated increased use of renewable energies, the wide range of applications for ammonia is becoming apparent [1]. Ammonia is available as a liquid energy carrier to ensure the safe transport of volatile hydrogen [2,3]. Furthermore, ammonia is already used in the exhaust gas after-treatment of many combustion processes, such as diesel-powered vehicles or power plants, as a reducing agent for the selective catalytic reduction (SCR) of nitrogen oxide emissions produced during combustion [4,5,6].
In order to avoid the unintentional release of ammonia into the environment, e.g., from leaks within pipes, the use of appropriate sensors to detect gaseous ammonia is essential and will also be required by legislation in the future [7,8]. The Euro 7 standard for vehicles dictates a new emission limit of 10 mg/km for ammonia as of 2025 [9]. However, suitable sensors for ammonia detection are rarely available for applications in high-temperature processes [10].
The sensor shown in this work is to be applied to biomass boilers. Since the use of wood as a renewable energy source is also widely discussed, there are major efforts to promote the thermal utilization of biogenic residuals and waste materials, such as straw or other agricultural residues. The share of biomass in the total amount of energy in Germany was 17% in 2022, whereby the use of biogenic residues is still very low despite its high potential [11,12].
However, the high amount of nitrogen (compared to fossil fuels) bound in biogenic fuels creates high nitrogen oxide emissions during combustion [13,14]. These emissions will be more limited in the future, and suitable systems for reducing NOx will therefore be needed [15]. For this purpose, catalysts for selective catalytic reduction, which reduce nitrogen oxide emissions with the use of additional ammonia dosing according to the following reaction equations, will be increasingly used [16,17].
4NH3 + 4NO + O2 → 4N2 + 6H2O
4NH3 + 2NO + 2NO2 → 4N2 + 6H2O
Usually, ammonia is used in the form of a liquid urea-water solution (AdBlue, DEF) [18]. In order to determine the correct amount of ammonia or AdBlue for NOx conversion, appropriate sensors are envisaged. In vehicles, a NOx sensor is used for this purpose, which has a cross-sensitivity to ammonia. Based on several models, the signal from the sensor is used to control the NH3 dosage [19]. On the other hand, for use in individually manufactured flue gas systems, a highly selective ammonia sensor is to be developed to avoid overdosing and the associated ammonia slip while maintaining a high NOx conversion rate at the same time.
Apart from the application in flue gas, some research projects have already focused on the development of various ammonia sensors for a wide range of different sectors, such as medical, environmental, or chemical analysis [20,21]. The most common ones are semiconducting metal oxide (MOX) gas sensors, mostly based on SnO2. Here, different catalytically active substances, such as platinum, palladium, or TiO2, are added, depending on the gas component to be determined [22,23]. Due to their high level of development and simple design, sensors of this type can be produced comparatively cheaply, but disadvantageously, their selectivity is low and their long-term stability is not sufficient [24].
In addition to other variants for ammonia detection, such as sensors based on carbon nanotubes (CNT) or surface acoustic waves (SAW), optical measurement methods in particular show high selectivity with respect to the gas component to be determined [25,26,27]. However, the low detection limit of concentrations in the ppm range results in high acquisition costs and a high space requirement for such analytical devices [20].
The common factor among the examples mentioned so far is that they are not suitable for applications in high-temperature processes with aggressive flue gas components [28]. For such purposes, sensors based on electrochemical principles on alumina or YSZ substrates have proven to be particularly robust. For ammonia sensors, functional materials are often used, known for their application as SCR catalysts. Accordingly, these materials are widely available and also demonstrate good long-term stability. The basic principle of these materials is based on the reaction of the alkaline ammonia with the acid centers of the catalyst material, which can also be used as a sensor effect [29]. There, a voltage is measured between two electrodes that are applied on YSZ. One of these electrodes is covered with a catalytically active layer, often V2O5-WO3/TiO2 (VWT), and thus different reactions take place depending on the exhaust gas composition [30,31,32,33]. A sensor working according to this principle is installed in some diesel engine exhaust gas systems for ammonia slip detection [34].
As an alternative, investigations were carried out several years ago in which the electrical properties of a zeolite film were measured using an interdigital electrode structure [35,36,37]. Zeolites are microporous aluminosilicates composed of SiO4 and AlO4 tetrahedra [38,39,40]. Besides their natural appearance, zeolites are often produced synthetically. This requires reactive aluminum and silicon compounds, which form the zeolite under appropriate temperature and pressure [41]. The difference in the oxidation state between aluminum and silicon has to be compensated with the help of a cation or proton [42]. The ratio of Si and Al atoms is called modulus and always has values larger than one according to the Löwenstein rule [42]. This results in a huge number of different zeolite types, which can be further distinguished by the ring-like arrangement of the Si and Al tetrahedra [38]. Depending on the size of the rings, porous structures are formed into which molecules of different sizes can enter and be adsorbed.
For this reason, zeolites are often used in catalysis as an alternative catalyst to VWT to store ammonia and make it available for the SCR reactions (1) and (2) [43]. Among others, the zeolite modulus influences the maximum amount of ammonia that can be stored. Accordingly, this material is also suitable as a gas sensor to determine its gas-dependent properties and thus the ammonia concentration in the exhaust gas by means of a simple impedance or capacitance measurement [36]. In addition to their application as ammonia sensors, zeolites of various structures and compositions have already been successfully used to detect different exhaust gas components, such as hydrocarbons or hydrogen [44,45,46,47,48]. There were also successful investigations where zeolite SCR catalysts were simultaneously used as a sensor element during operation. Using a high-frequency method, the dielectric properties of the catalyst could be determined contactless and correlated to the ammonia loading [49,50].
In the context of this work, an ammonia gas sensor based on a zeolite film for applications in the flue gas of biomass firing with SCR systems is to be considered in more detail. The basic principle of a ceramic high-temperature sensor with an integrated heater structure and gas-sensitive zeolite film, whose properties (e.g., impedance) are measured with an IDE structure, has already been described in the literature [36,51]. A common factor for many sensors for high-temperature processes is the sensor signal drift, which may be caused, for example, by temperature variations of the exhaust gas or by changes in the properties of the functional layer due to aggressive flue gas components [28]. Further developments in the design of the heater structure through previous simulations or in the manufacturing methods of sensor elements, e.g., the laser patterning of screen-printed layers, make the sensors more robust in terms of various influences. The higher resolution due to laser patterning increases the signal height, and the capacitive evaluation is much less expensive compared to an evaluation based on the complex impedance. By manufacturing the IDE structure with thick-film technology with subsequent laser patterning, aspects such as production costs and long-term stability of the sensor were optimized in comparison to the thin-film IDEs of earlier works. A zeolite material with a lower module was used to increase the sensor response, and a capacitive measurement was used to further increase the simplicity of evaluation. Capacitive sensor methods are well known and widely applied, especially in the field of microelectromechanical systems (MEMS), where even small capacitance changes must be precisely detected [52]. With the help of this optimized sensor concept, the response to gaseous ammonia and different influences (such as temperature and cross-sensitivities to H2O and O2) on the sensor behavior were investigated and found to be suitable for flue gas applications.
The sensor is intended to be used for applications in a wide variety of biomass firing systems operated with biogenic residues. In particular, applications in biogas plants for power generation and pellet boilers for hot water supply are envisaged. Such plants will be affected in the future by legal regulations on flue gas emissions. Here, the functionality of SCR systems in the exhaust gas has to be ensured during operation in order to avoid overdosing on the urea-water solution that serves as a reducing agent and to counteract an ammonia slip. This will effectively reduce nitrogen oxide emissions.

2. Structure and Operating Principle of the Sensor

The detection of ammonia in the special case of biomass combustion poses a particular challenge and will be described in more detail below.

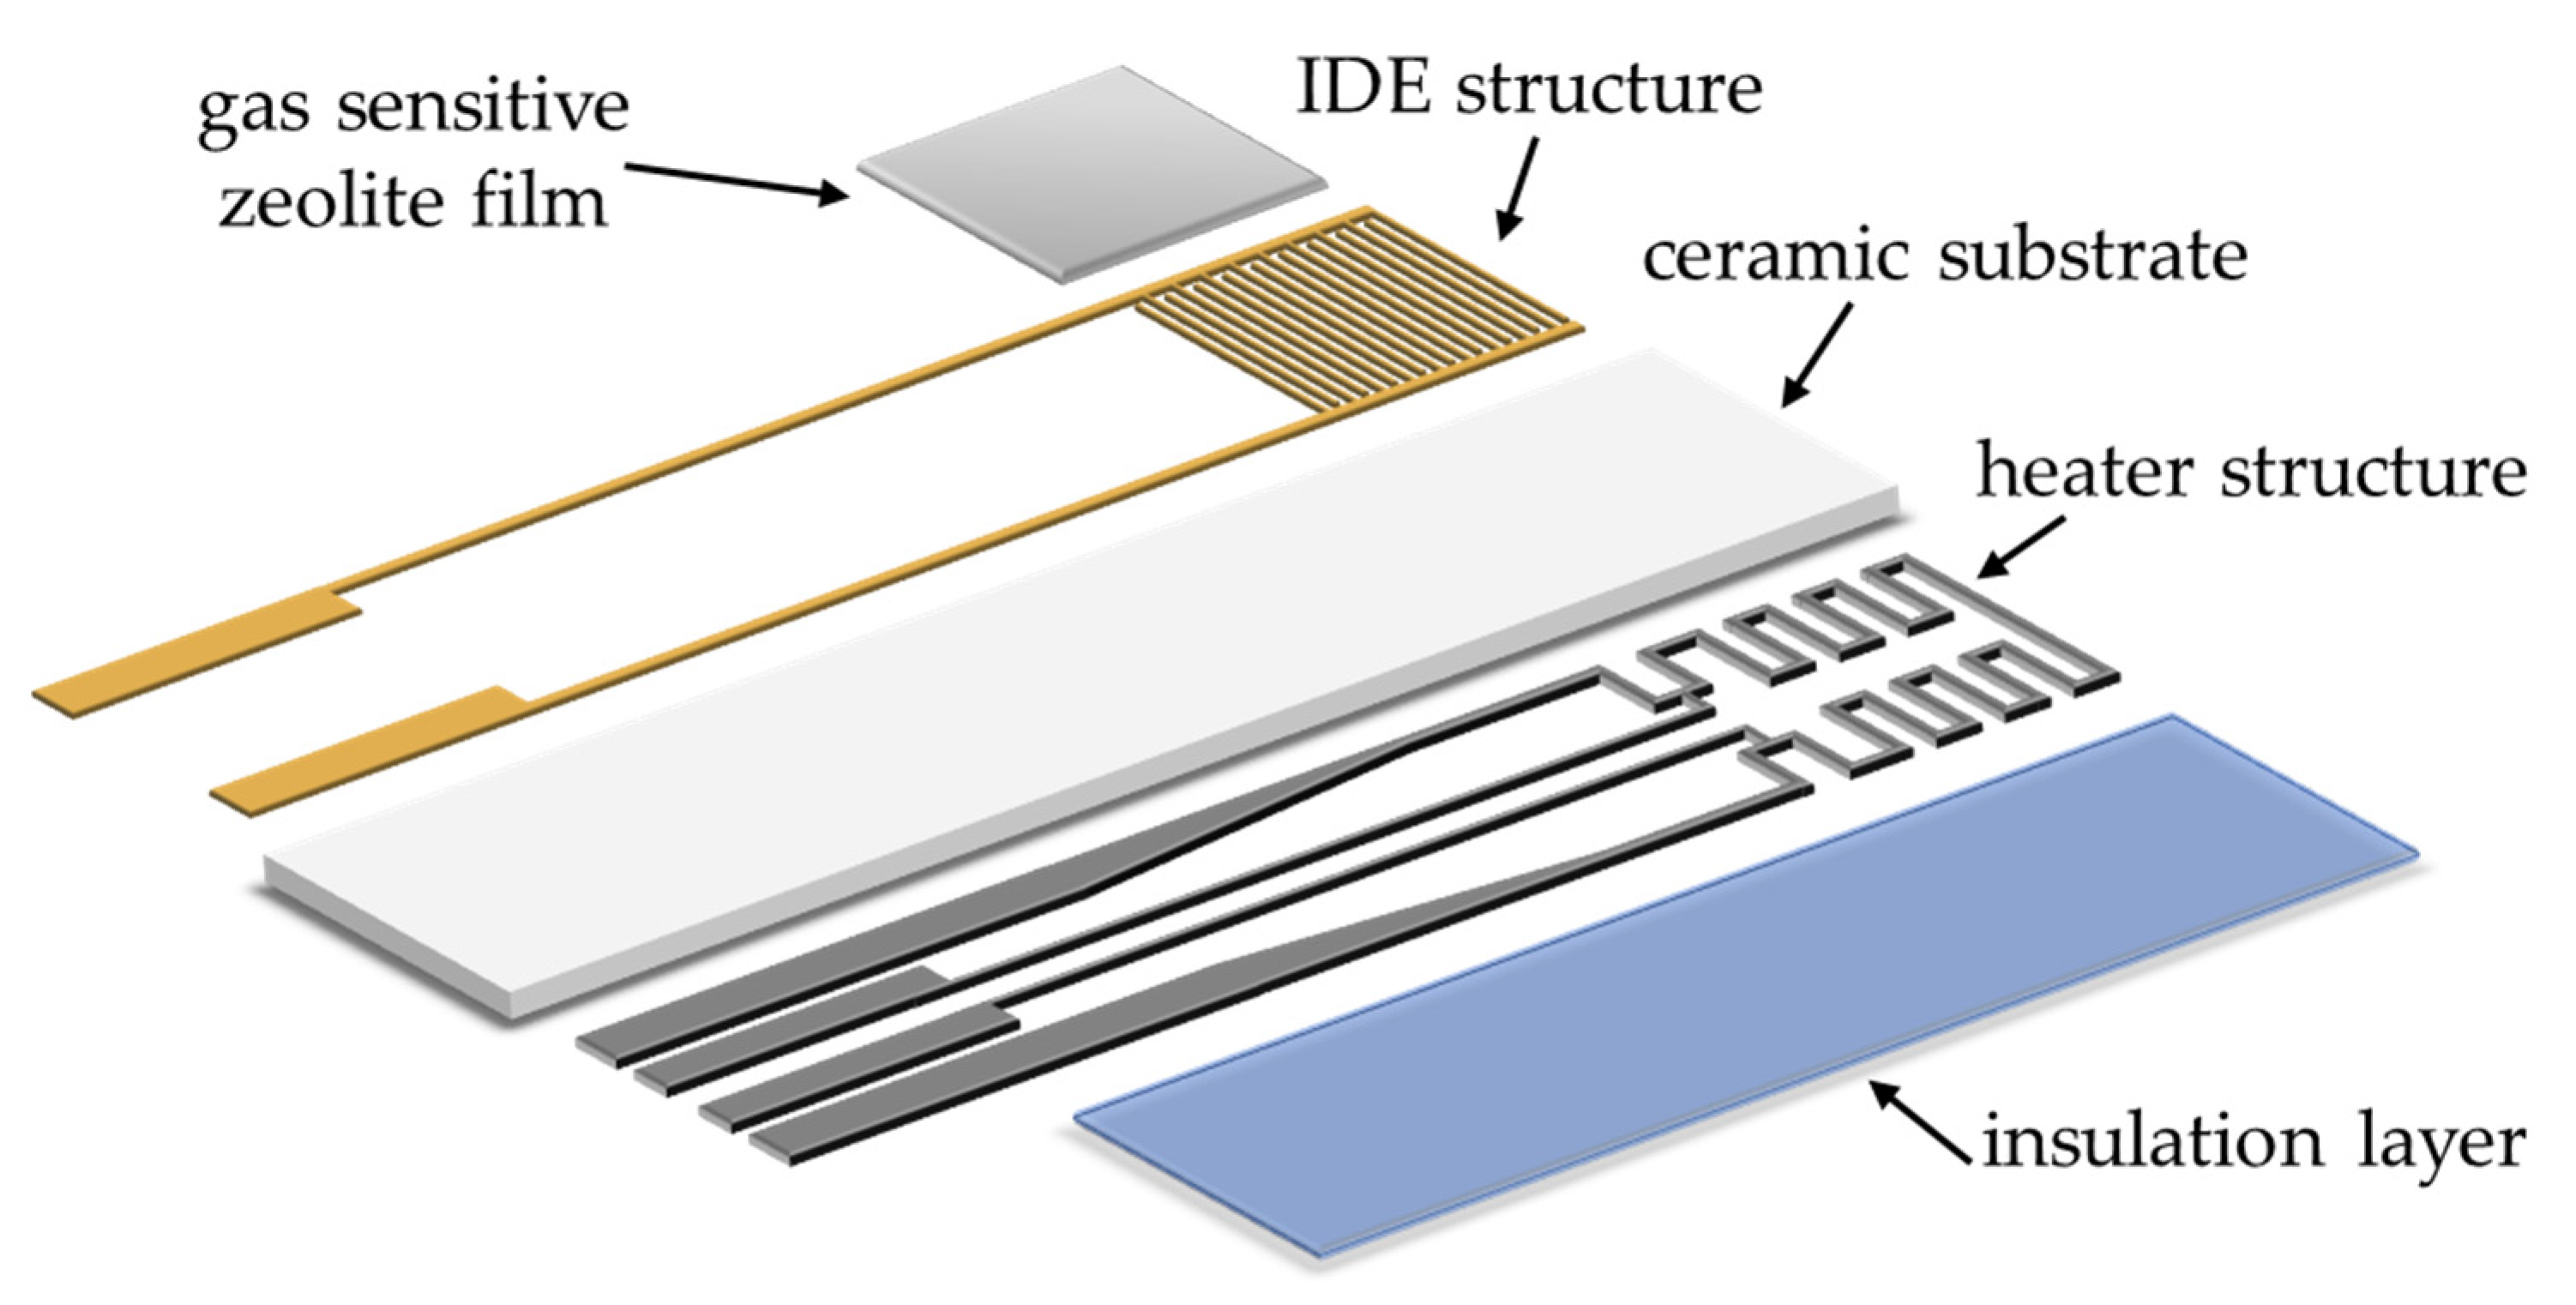
2.1. General Sensor Setup

For applications in biomass boilers, the sensor must permanently withstand changing conditions in the exhaust gas temperature and particularly various gas components, such as H2O and O2 [53,54]. Especially sensors based on a ceramic substrate have proven to be robust in this case of application [55]. To ensure the simple and cost-effective manufacture of the sensors, all layers were applied to a planar substrate using thick-film technology [56,57]. The schematic structure of the sensor is shown as an example in Figure 1.
The reverse side of the sensor substrate comprises a printed platinum heater structure (Heraeus LPA88-11S). During the measurements, the sensor was heated to the desired operating temperature via its meander-shaped structure. The operating temperature was controlled via a four-wire resistance measurement of the heater, which considers the area of the gas-sensitive layer [58]. The temperature was then calculated and controlled via a resistance-dependent temperature characteristic [59]. In order to avoid the catalytic effects of the platinum heater structure and thus an unwanted conversion of ammonia, it was covered with an additional insulation layer (DuPont QM42).
Interdigital electrodes (IDE) were implemented on the front side, which will be used to measure the electrical properties of the zeolite film on top [36,60,61]. Due to the generally low conductivity of zeolites, it is necessary to provide as many finger pairs as possible. This results in a parallel connection of many resistors or capacitors, which leads to a better measurable sensor effect [62,63]. Typically, IDE structures with a resolution below 50 μm are manufactured using thin-film technology, which, however, usually shows poor long-term stability in the case of high-temperature applications [64]. In addition, for cost reasons, production using thick-film technology should be considered. The usual line widths or line spacings of IDE structures that can be produced by screen-printing are in the range of 100 μm [65]. Due to the large area required for about 75 finger pairs, the decision was made to create the fingers by laser patterning, since a significant resolution improvement of down to 20 μm is possible. This method is used intensively for trimming resistance temperature sensors, for example, and is therefore also suitable here [66,67].
In the first step, a gold solid area with conducting lines (DuPont 5744R) was screen-printed and fired at 850 °C (Figure 2a). Further, the IDE form was structured using Protolaser R4 (LPKF, Germany) with picosecond-fast laser pulses. Due to very short pulses, laser ablation occurs with practically no heat input. Thus, the targeted material evaporates immediately without deterioration of the alumina substrate. Using this method, a wide variety of structures is possible with a minimum line/space resolution of down to 20 μm (Figure 2b). The capacitance of such an IDE structure without a zeolite was about 45 pF.

2.2. Gas-Sensitive Zeolite Film

For the here-used ZSM5 zeolite, a microporous structure is formed based on a 10-ring arrangement of the Si and Al tetrahedra. This results in pore sizes in the range of about 0.58 nm, which allows the intrusion of not only H2O but also NH3 molecules into the zeolite. By different mechanisms, these solvate molecules are bound to the zeolite [68,69,70].
Due to these characteristics, ZSM5 zeolites are often used in applications for the reduction of nitrogen oxides. The SCR activity of the zeolite plays a decisive role. It is influenced by not only the modulus of the zeolite but also the properties of the charge-balancing ions. Fe and Cu zeolites exhibit high SCR activity, but this is less suitable for gas sensing purposes since the stored ammonia would react with nitrogen oxides in the exhaust gas and would therefore not be detected by the sensor [43,71,72].
For this reason, a proton-balanced ZSM5 zeolite (H-form) was used as the gas-sensitive film for the sensor, which has low SCR activity. Furthermore, the temperature is important. While permanent storage of the ammonia molecules is desired for use as a catalyst, the sensor principle is based on an equilibrium between the adsorption and desorption of the solvate molecules. This effect can be controlled by the operating temperature. In general, the binding of the molecules affects the electrical and dielectric properties of the material, which are subsequently used as a measure of the ammonia concentration in the exhaust gas [73].
A zeolite with a modulus of 27 (ALSI-Penta Zeolithe GmbH) was processed into a paste suitable for screen printing. Using a zeolite with such a low modulus improves the sensitivity to ammonia [36]. Due to the high proportion of Al tetrahedra in the zeolite, a high number of acid centers are formed, where more ammonia molecules can adsorb compared to zeolites with a high modulus [49]. The high number of adsorption sites of zeolites with a low modulus, therefore, leads to a high output signal from the sensor. The zeolite paste is then applied to the sensor substrate (Figure 2c). After screen-printing, the zeolite layers were dried at 120 °C for 15 min and then fired in the air. The heating and cooling rates were about 30 K/min with a holding time of 20 min at a firing temperature of 850 °C. Due to the coating in a screen-printing process, a porous layer is created (Figure 2d), which allows rapid gas diffusion to the surface of the zeolite and thus a good response time for the sensor. The layer thickness of the zeolite film was approx. 35 μm. In a previous series of measurements, the highest ammonia sensitivity was observed with layer thicknesses in the range between 20 and 40 μm. Therefore, 35 µm was selected.

3. Experiments

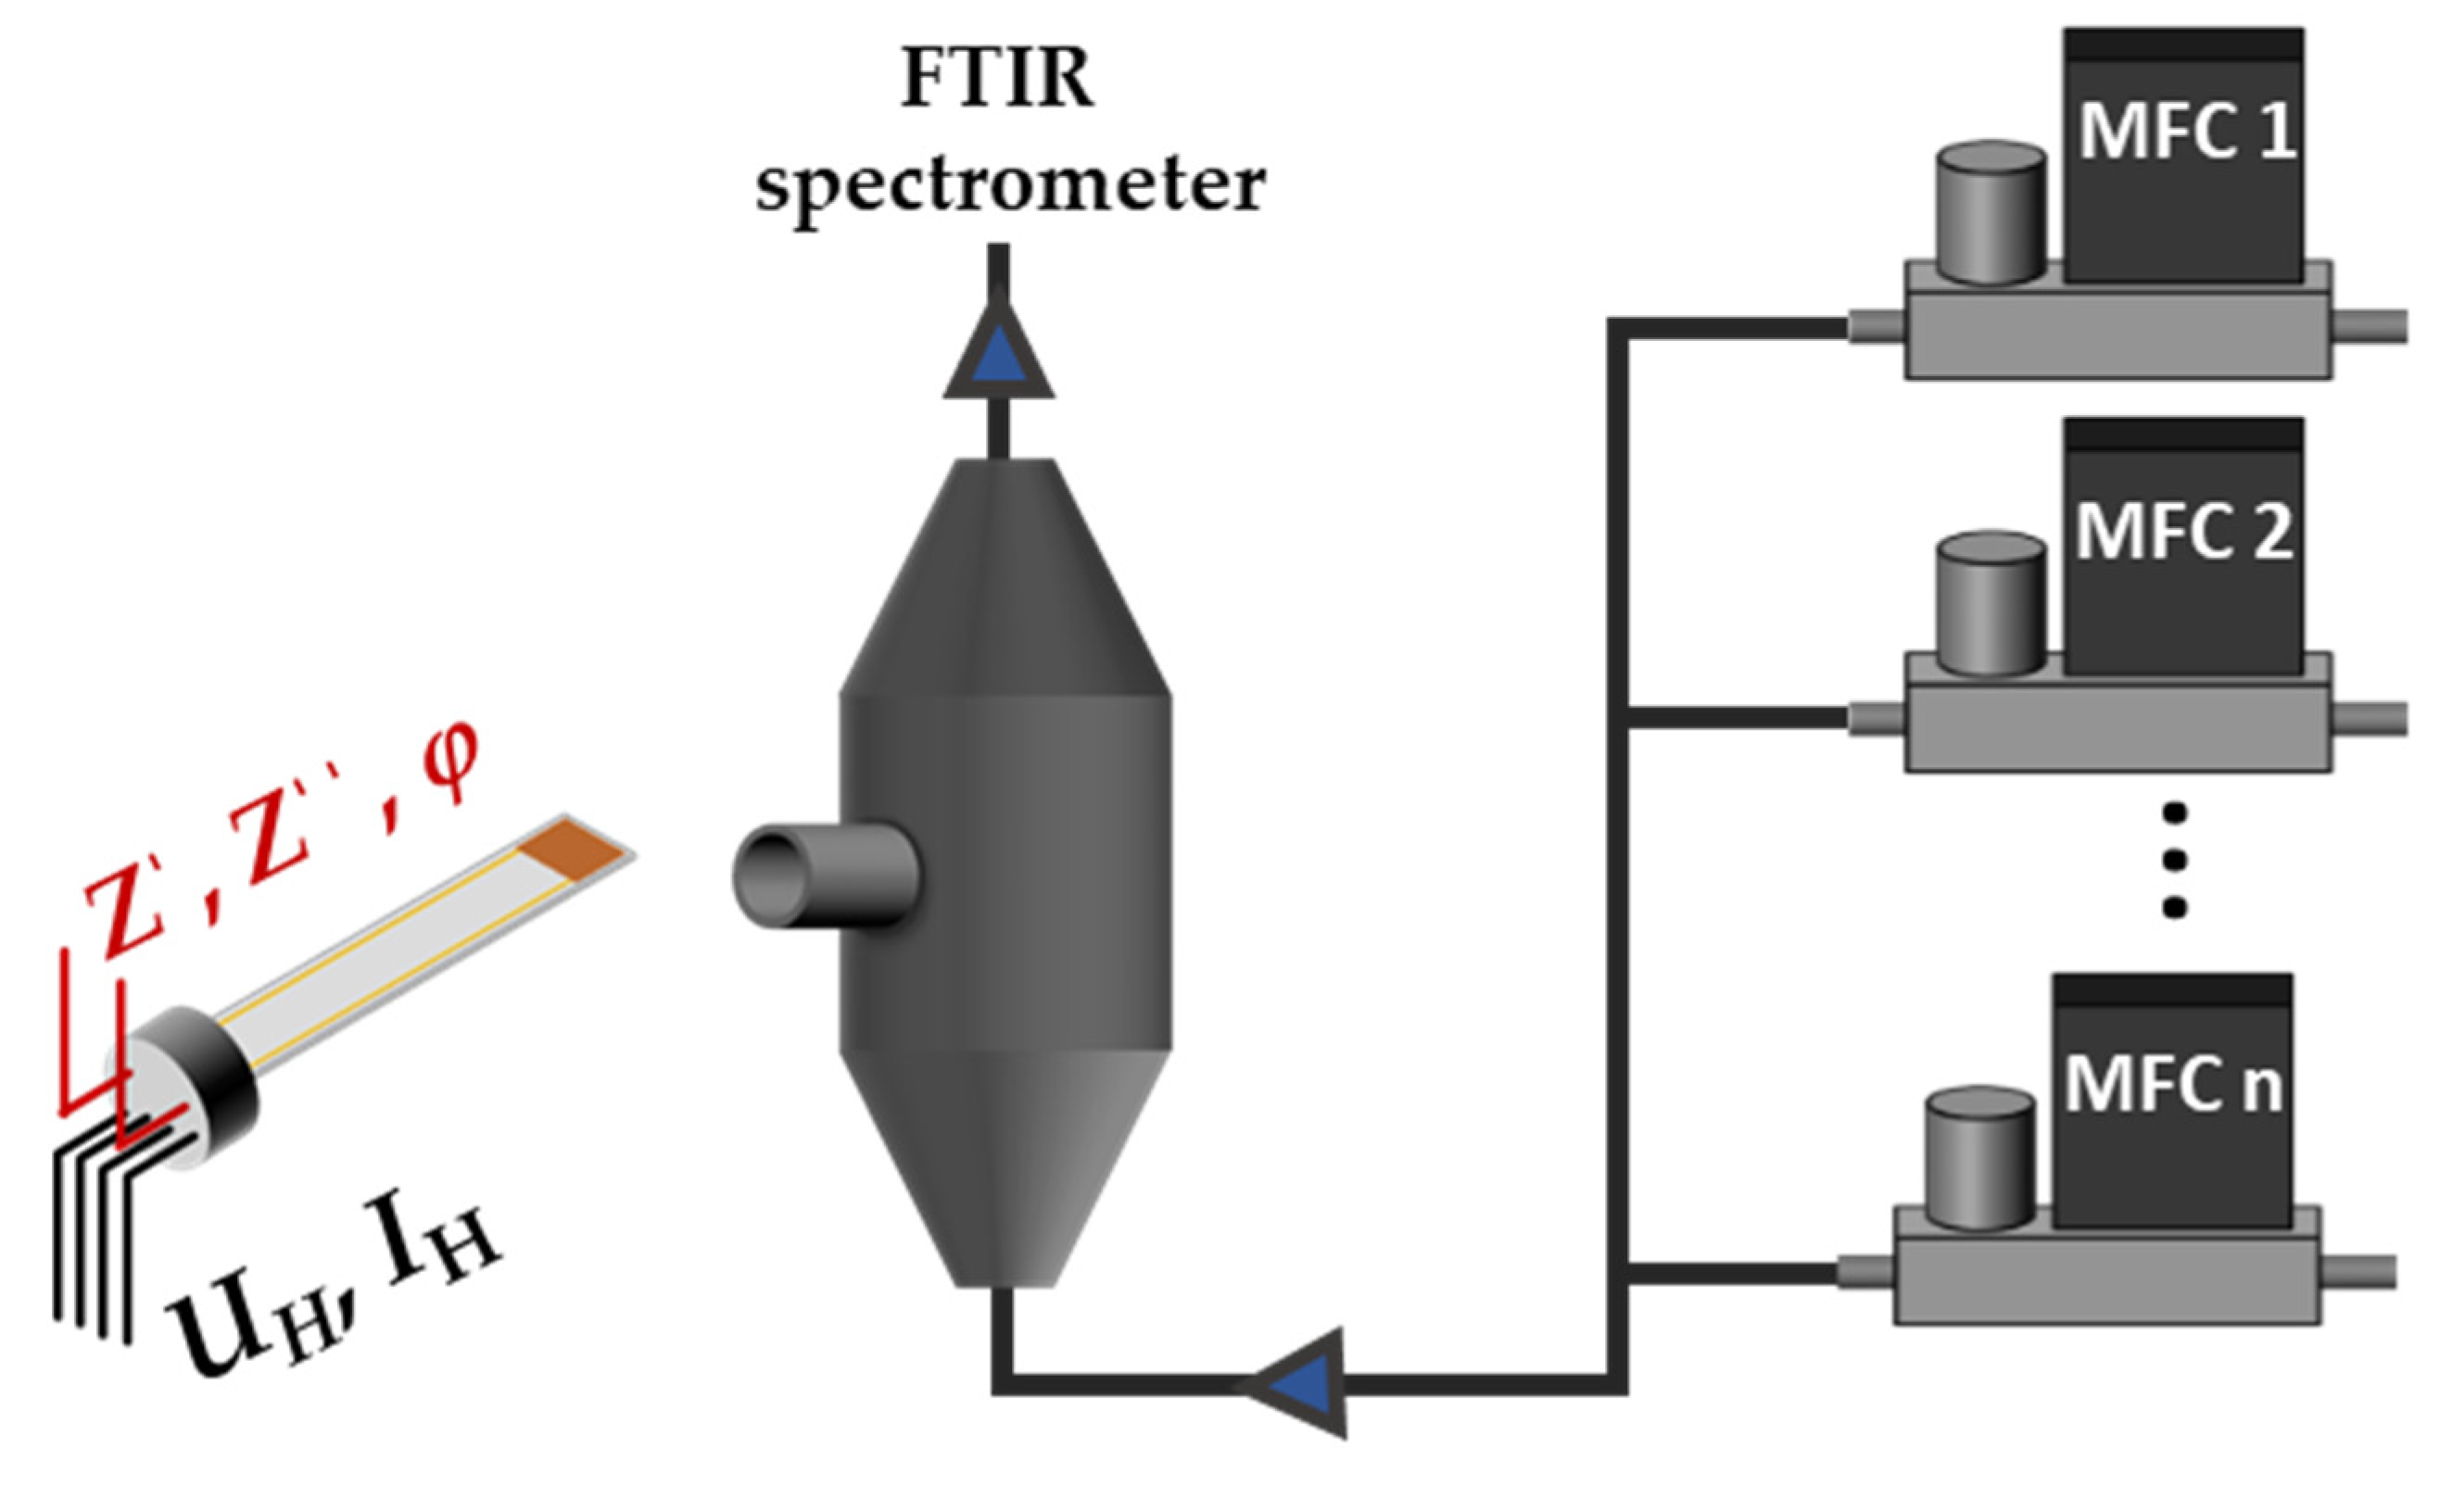
3.1. Measurement Setup

The characterization of the sensors was carried out on a test bench for synthetic exhaust gases. It is briefly outlined below (Figure 3).
Several Mass Flow Controllers (MFC) allowed the dosing of different gas components (N2, O2, CO2, NH3, etc.) through a measuring chamber. For all subsequent measurements, the total volume flow was set to 6 L/min. A minimum ammonia concentration of approx. 12 ppm was possible. All gas lines, including the measuring chamber, were heated to approx. 120 °C, as ammonia interacts (adsorps) with the cold walls of the pipes [74]. Due to the adsorption and desorption processes on the surfaces of the pipes and the measuring chamber, there are temporal changes in the expected ammonia concentration [75]. Therefore, an FTIR spectrometer (MKS MultiGas 2030 FTIR Analyzer) was installed downstream of the chamber to measure the course of the ammonia concentration in proximity to the sensor. In addition to ammonia, other common gas components that could also be found in typical exhausts were dosed, including oxygen (4–18%), carbon dioxide (3%), and water (1–10 vol.%), with nitrogen serving as a balance.
A measuring device for electrochemical analysis (PalmSens 4) measured the electrical impedance of the zeolite film on the sensor (real and imaginary parts of the impedance Z′ and Z″, or magnitude Z and phase angle φ). So, changes in the dielectric properties of the zeolite film that depend on the composition of the gas atmosphere can be determined in the form of frequency-dependent impedance [76]. The power supply for the heater structure of the sensor was provided by a digital four-wire control (heater voltage and current UH and IH).

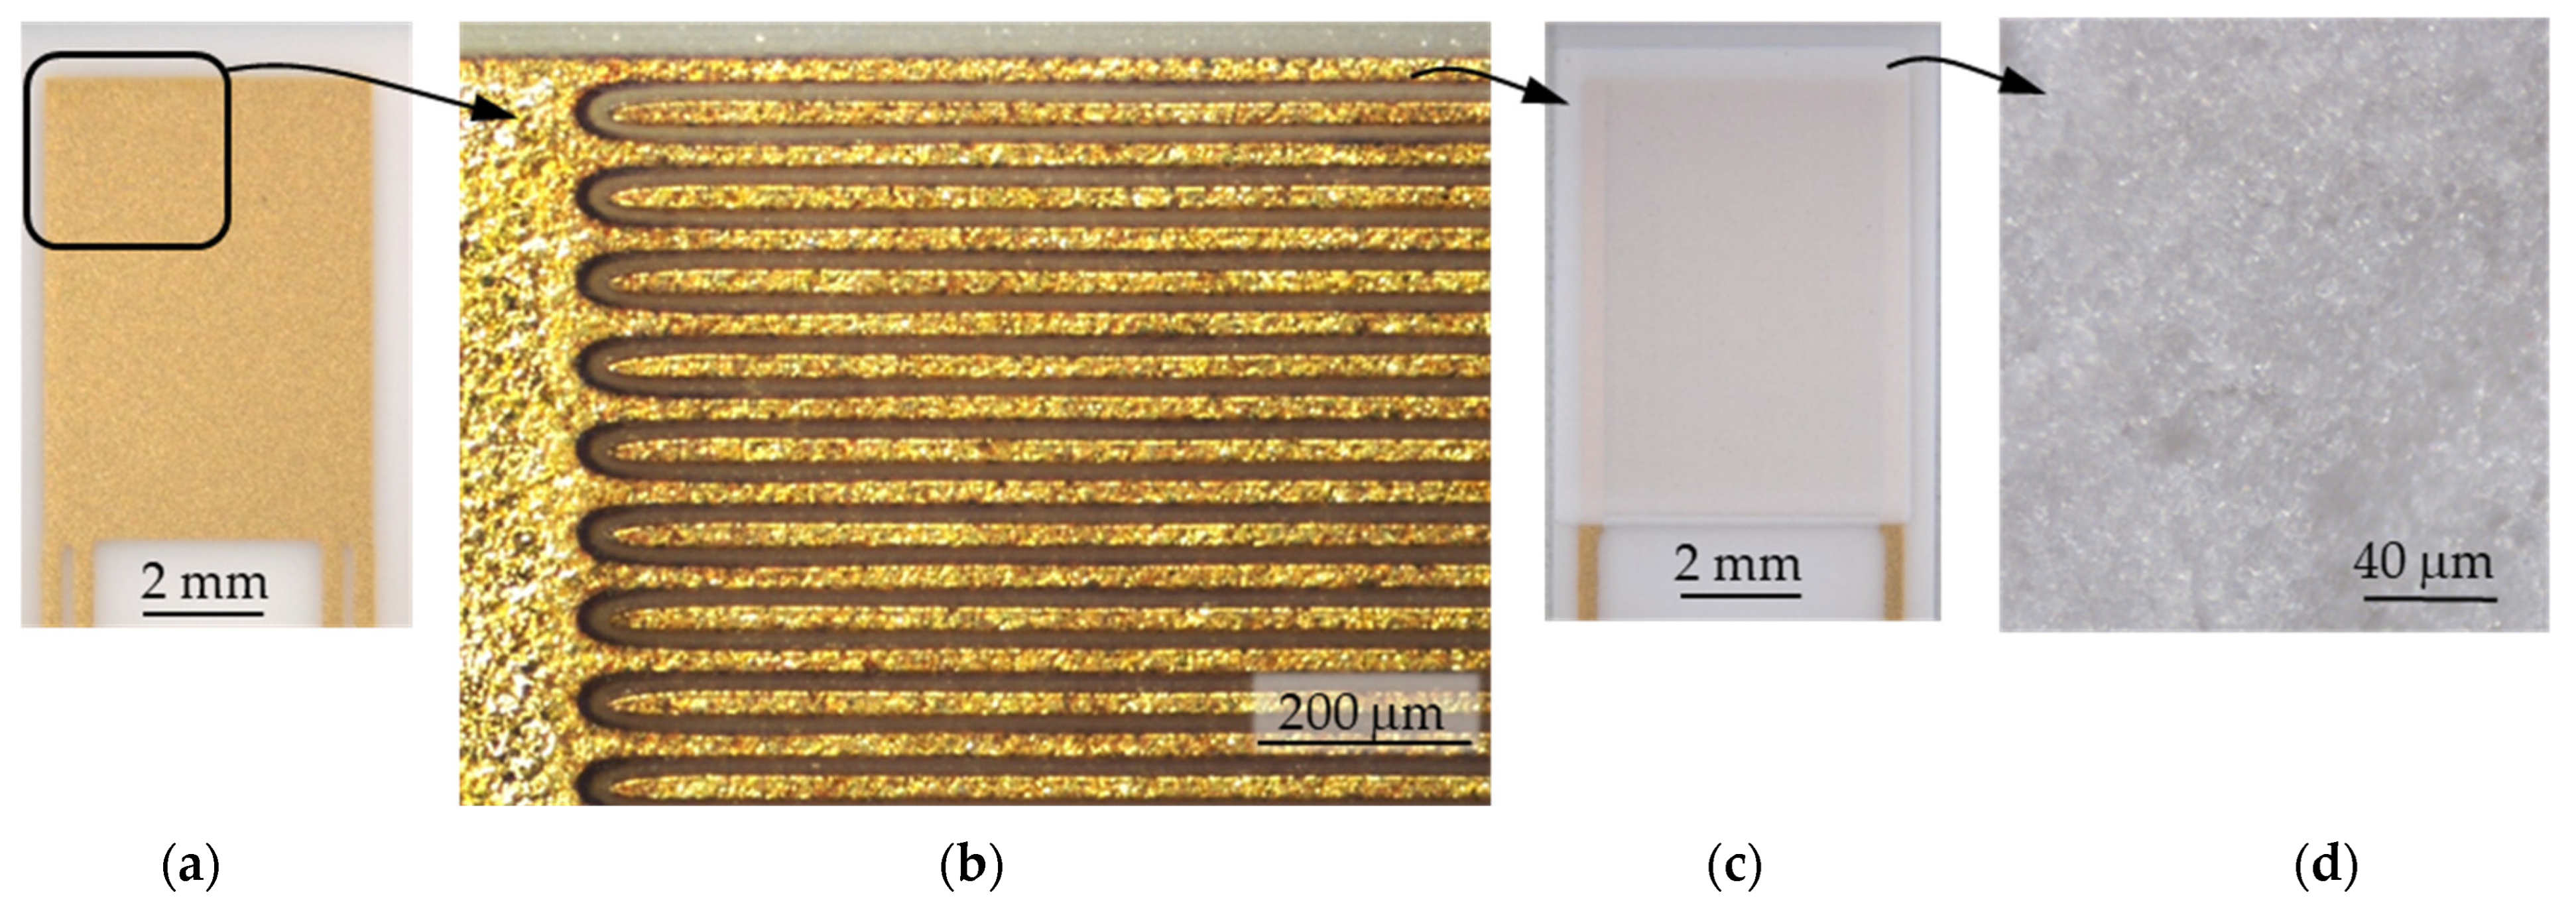
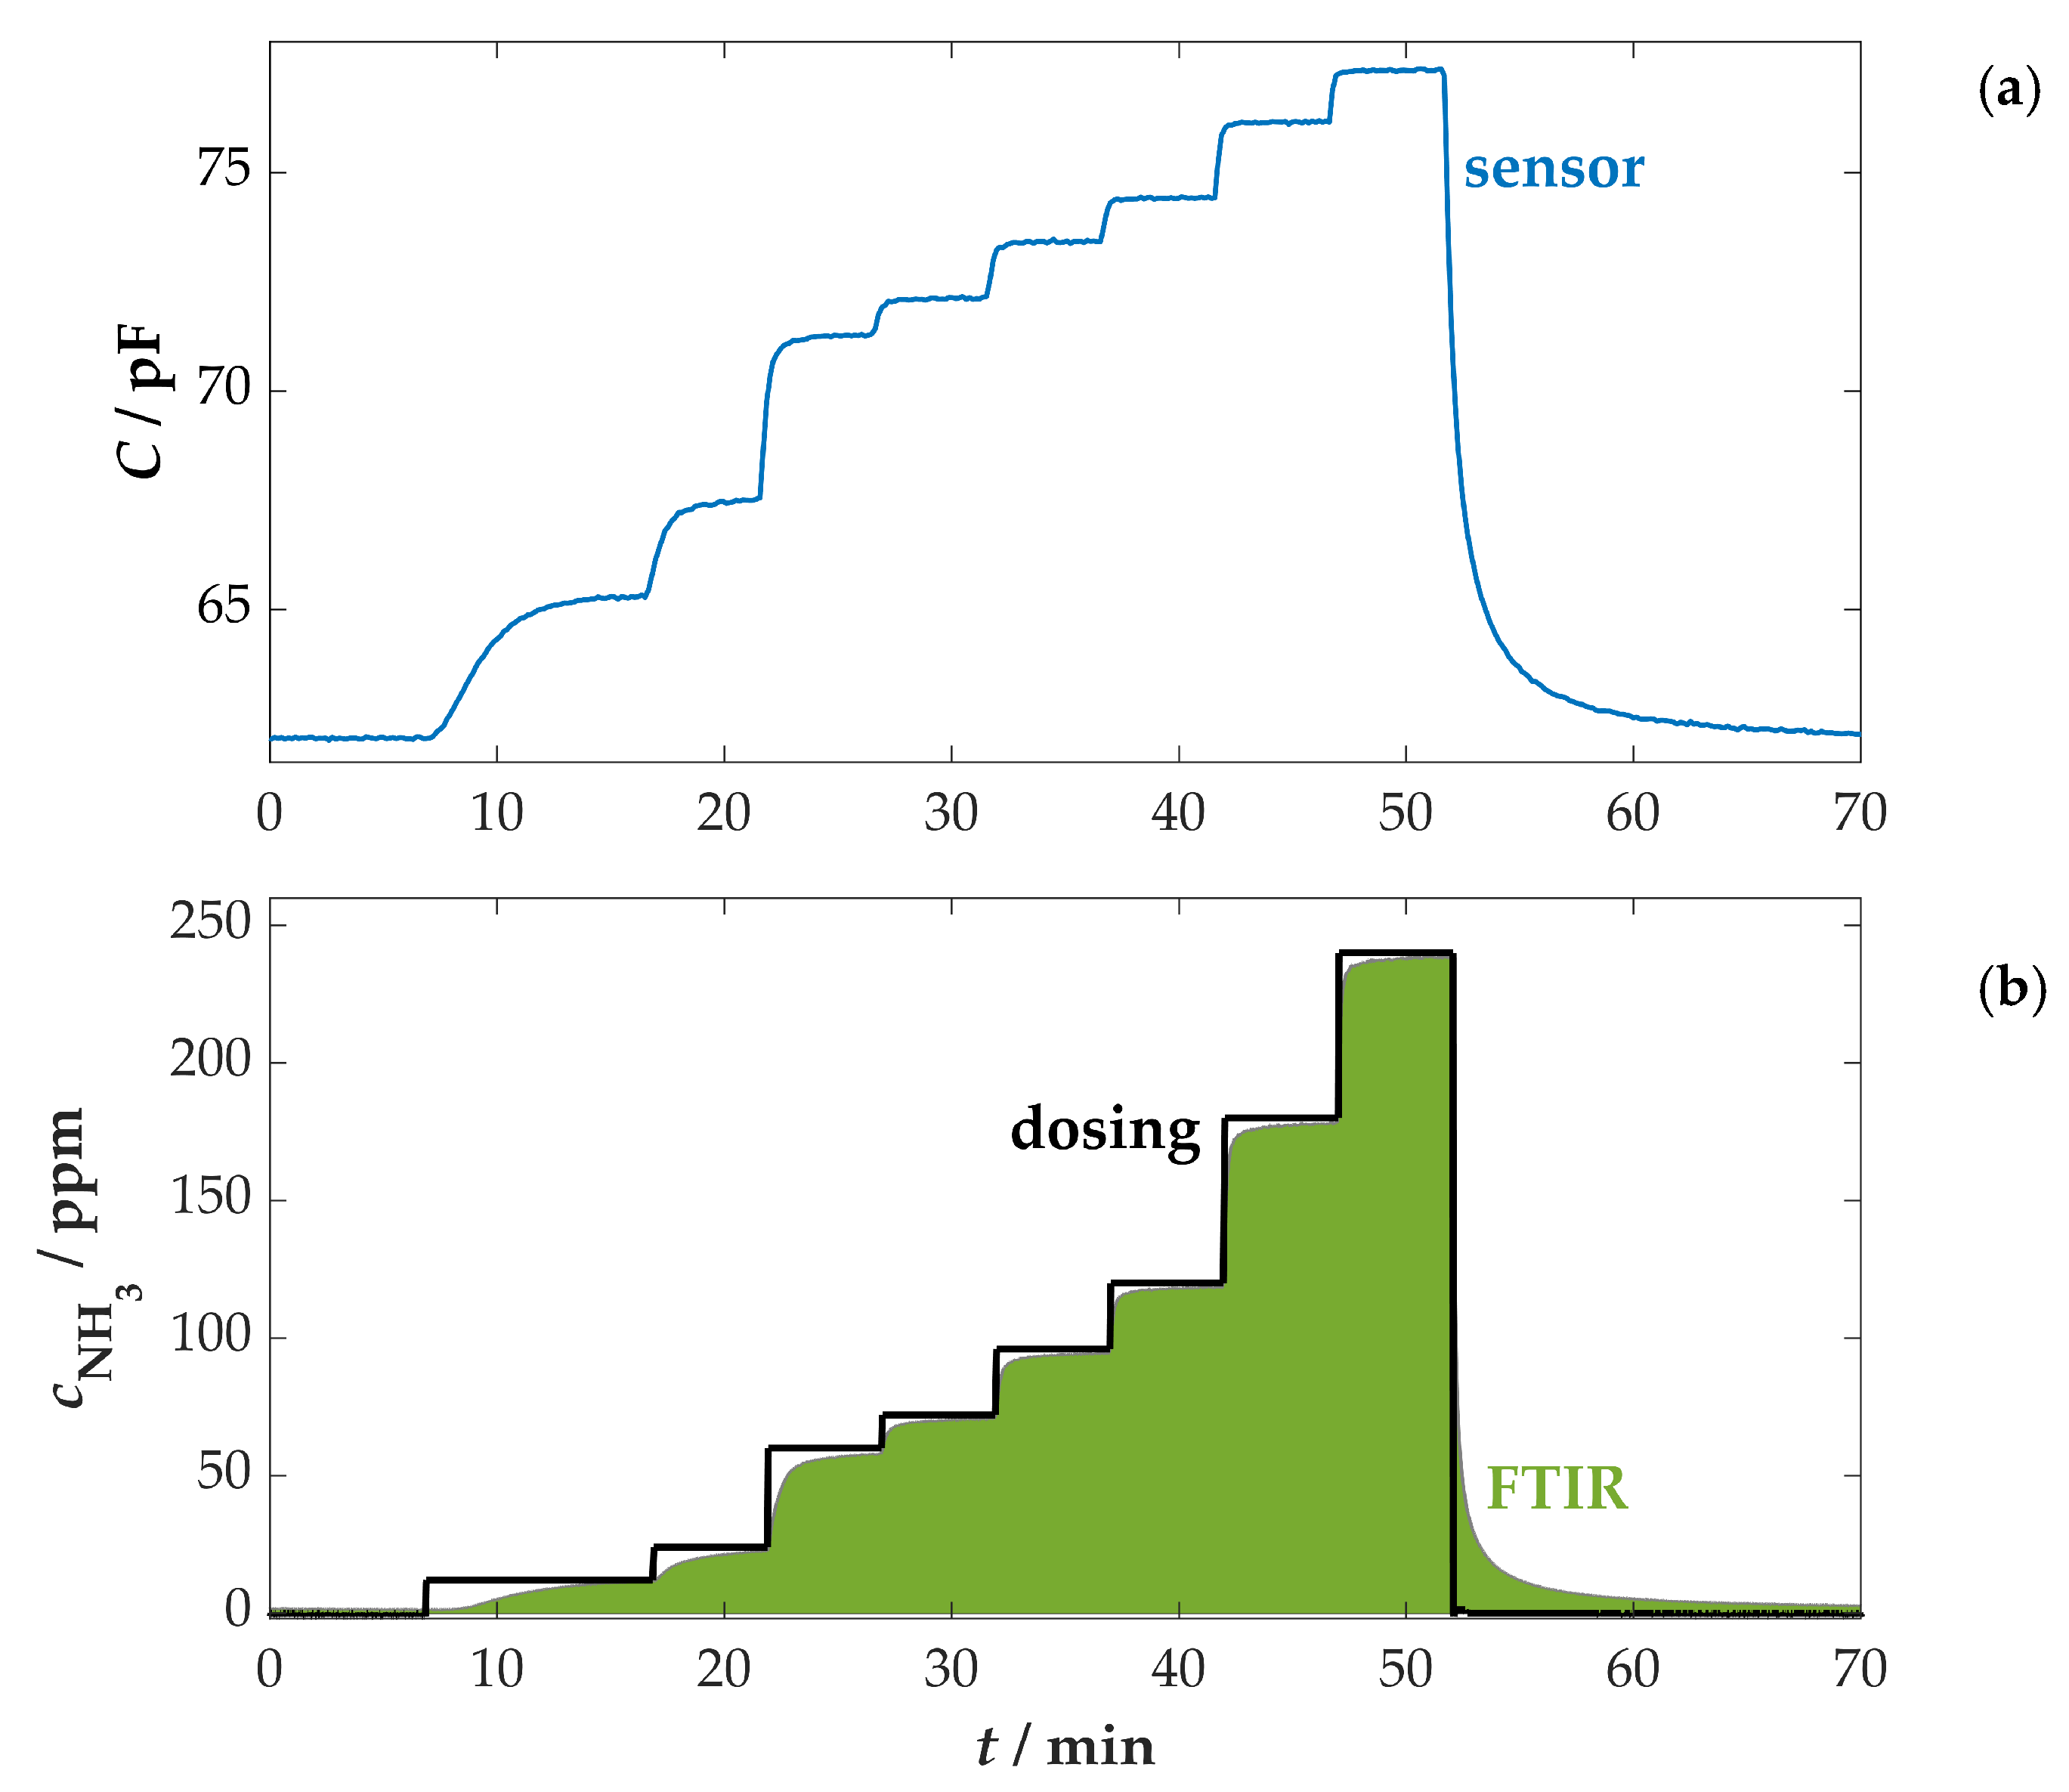
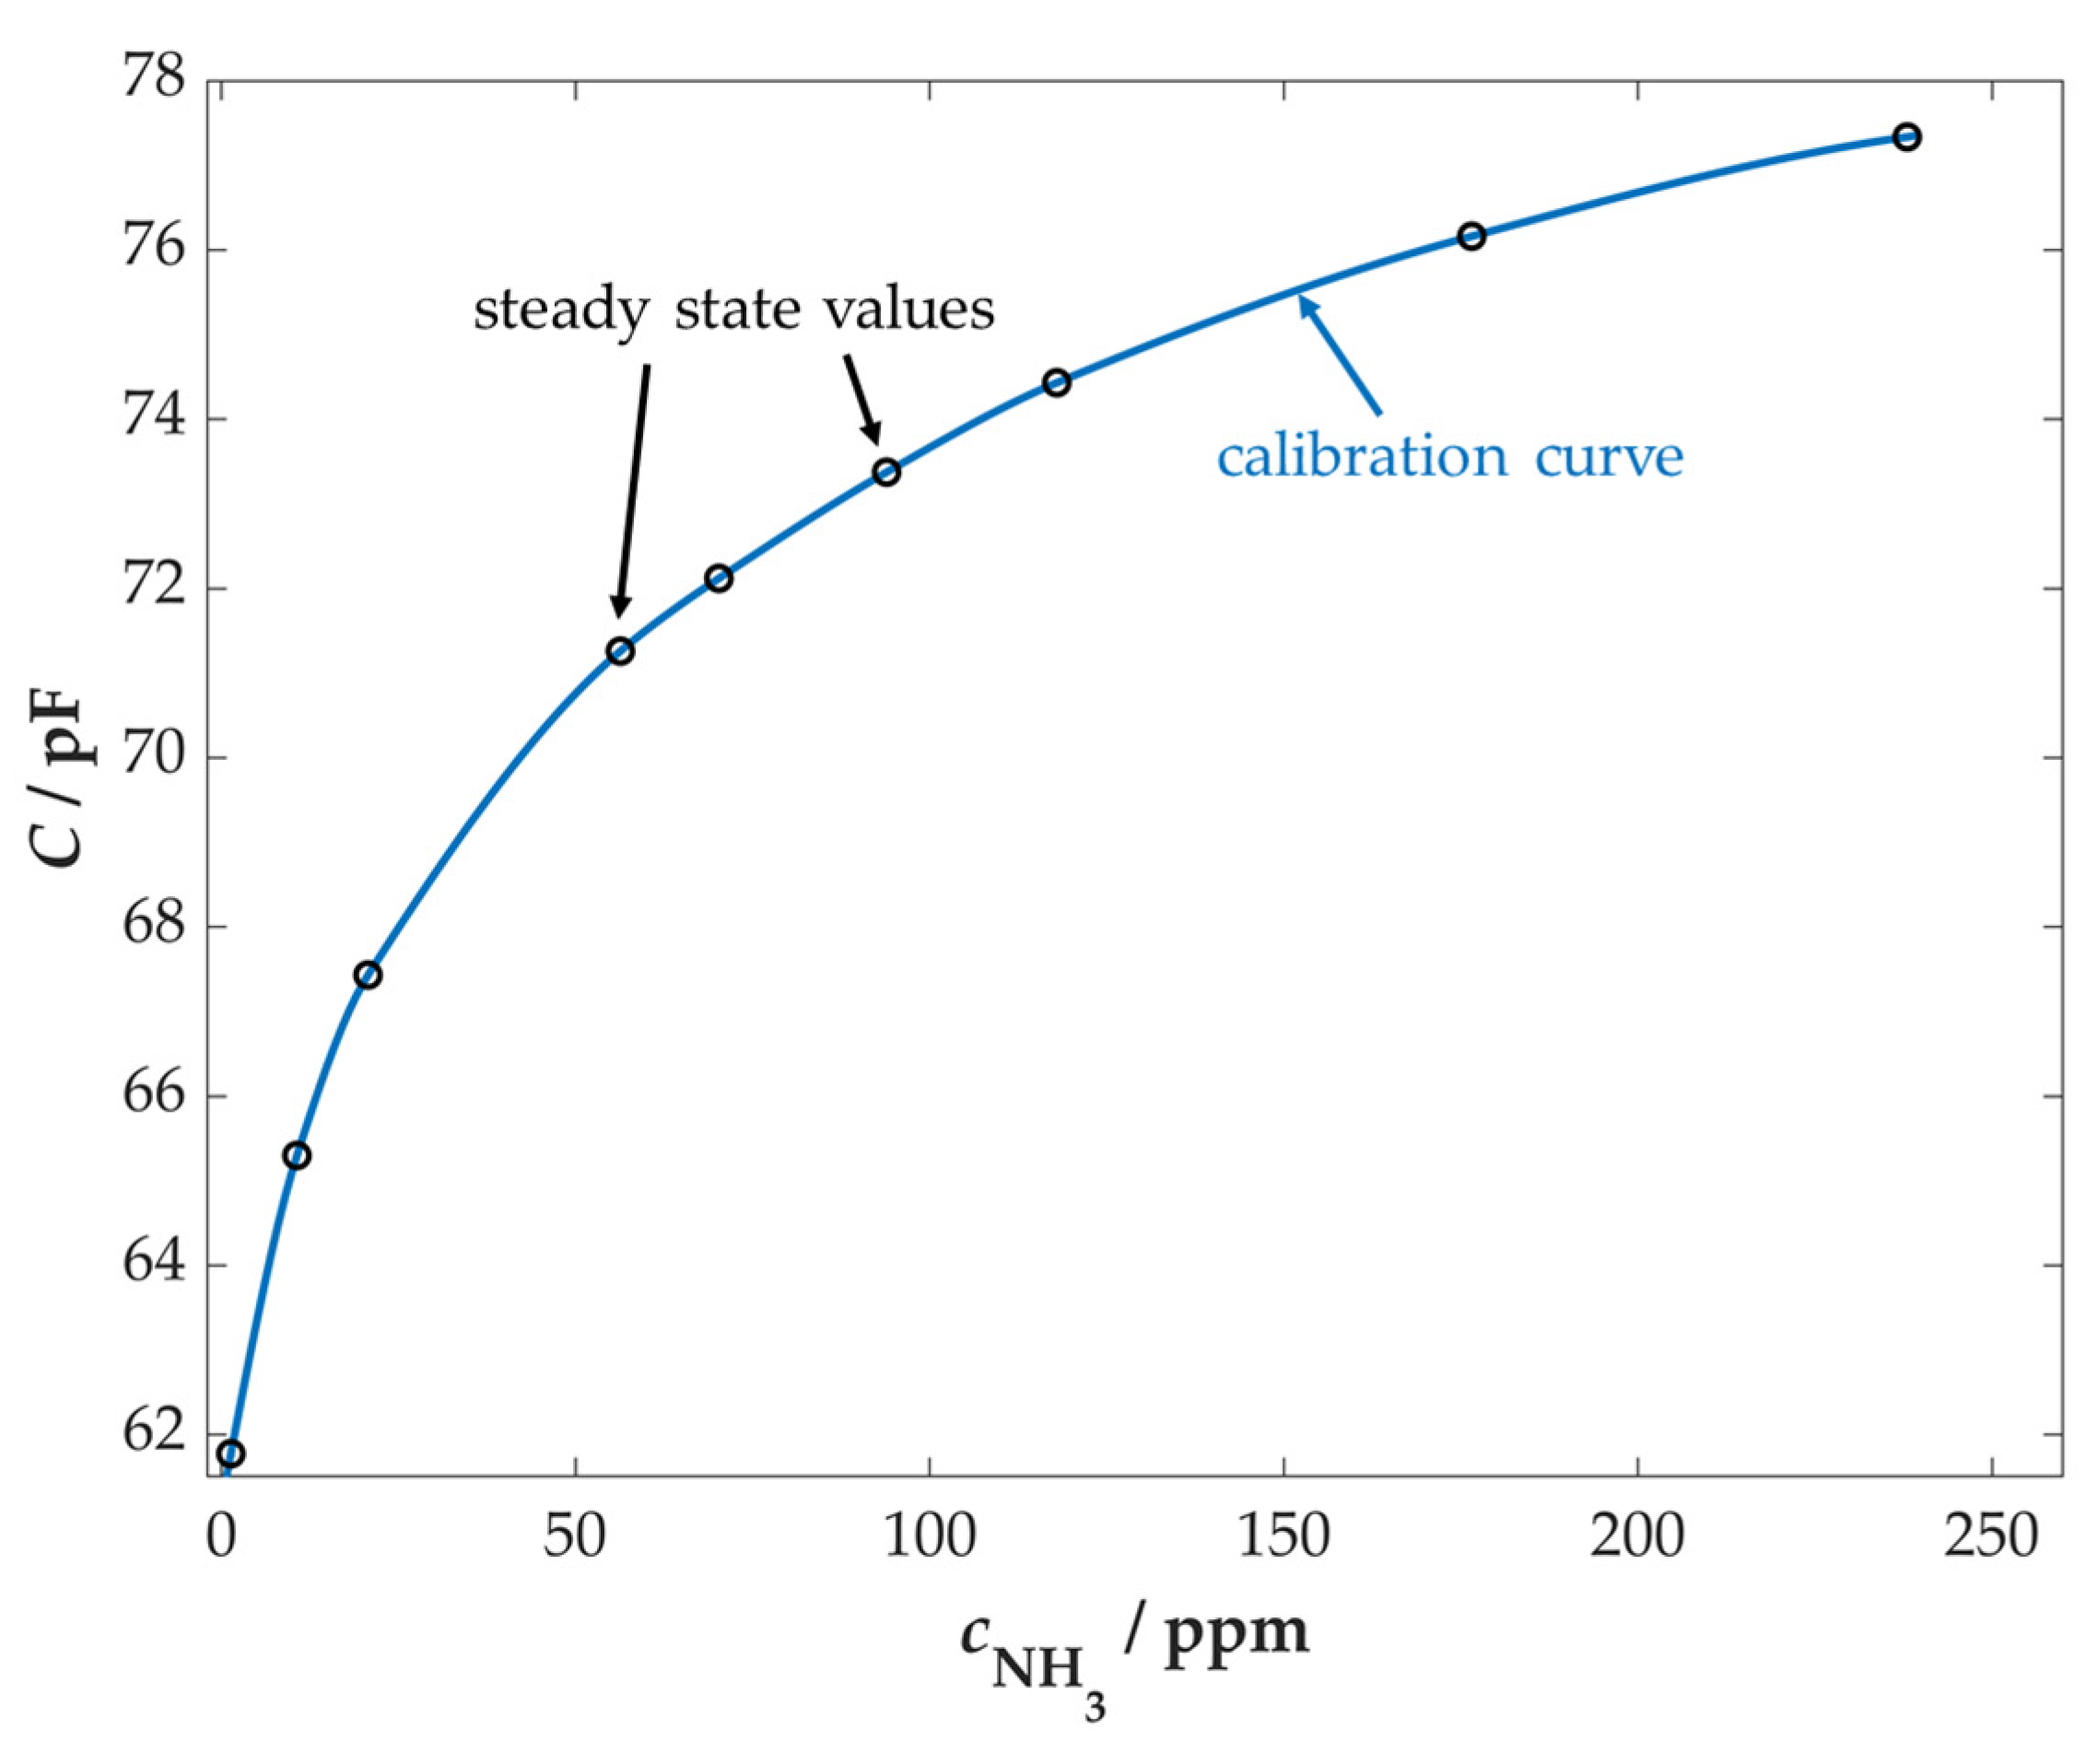
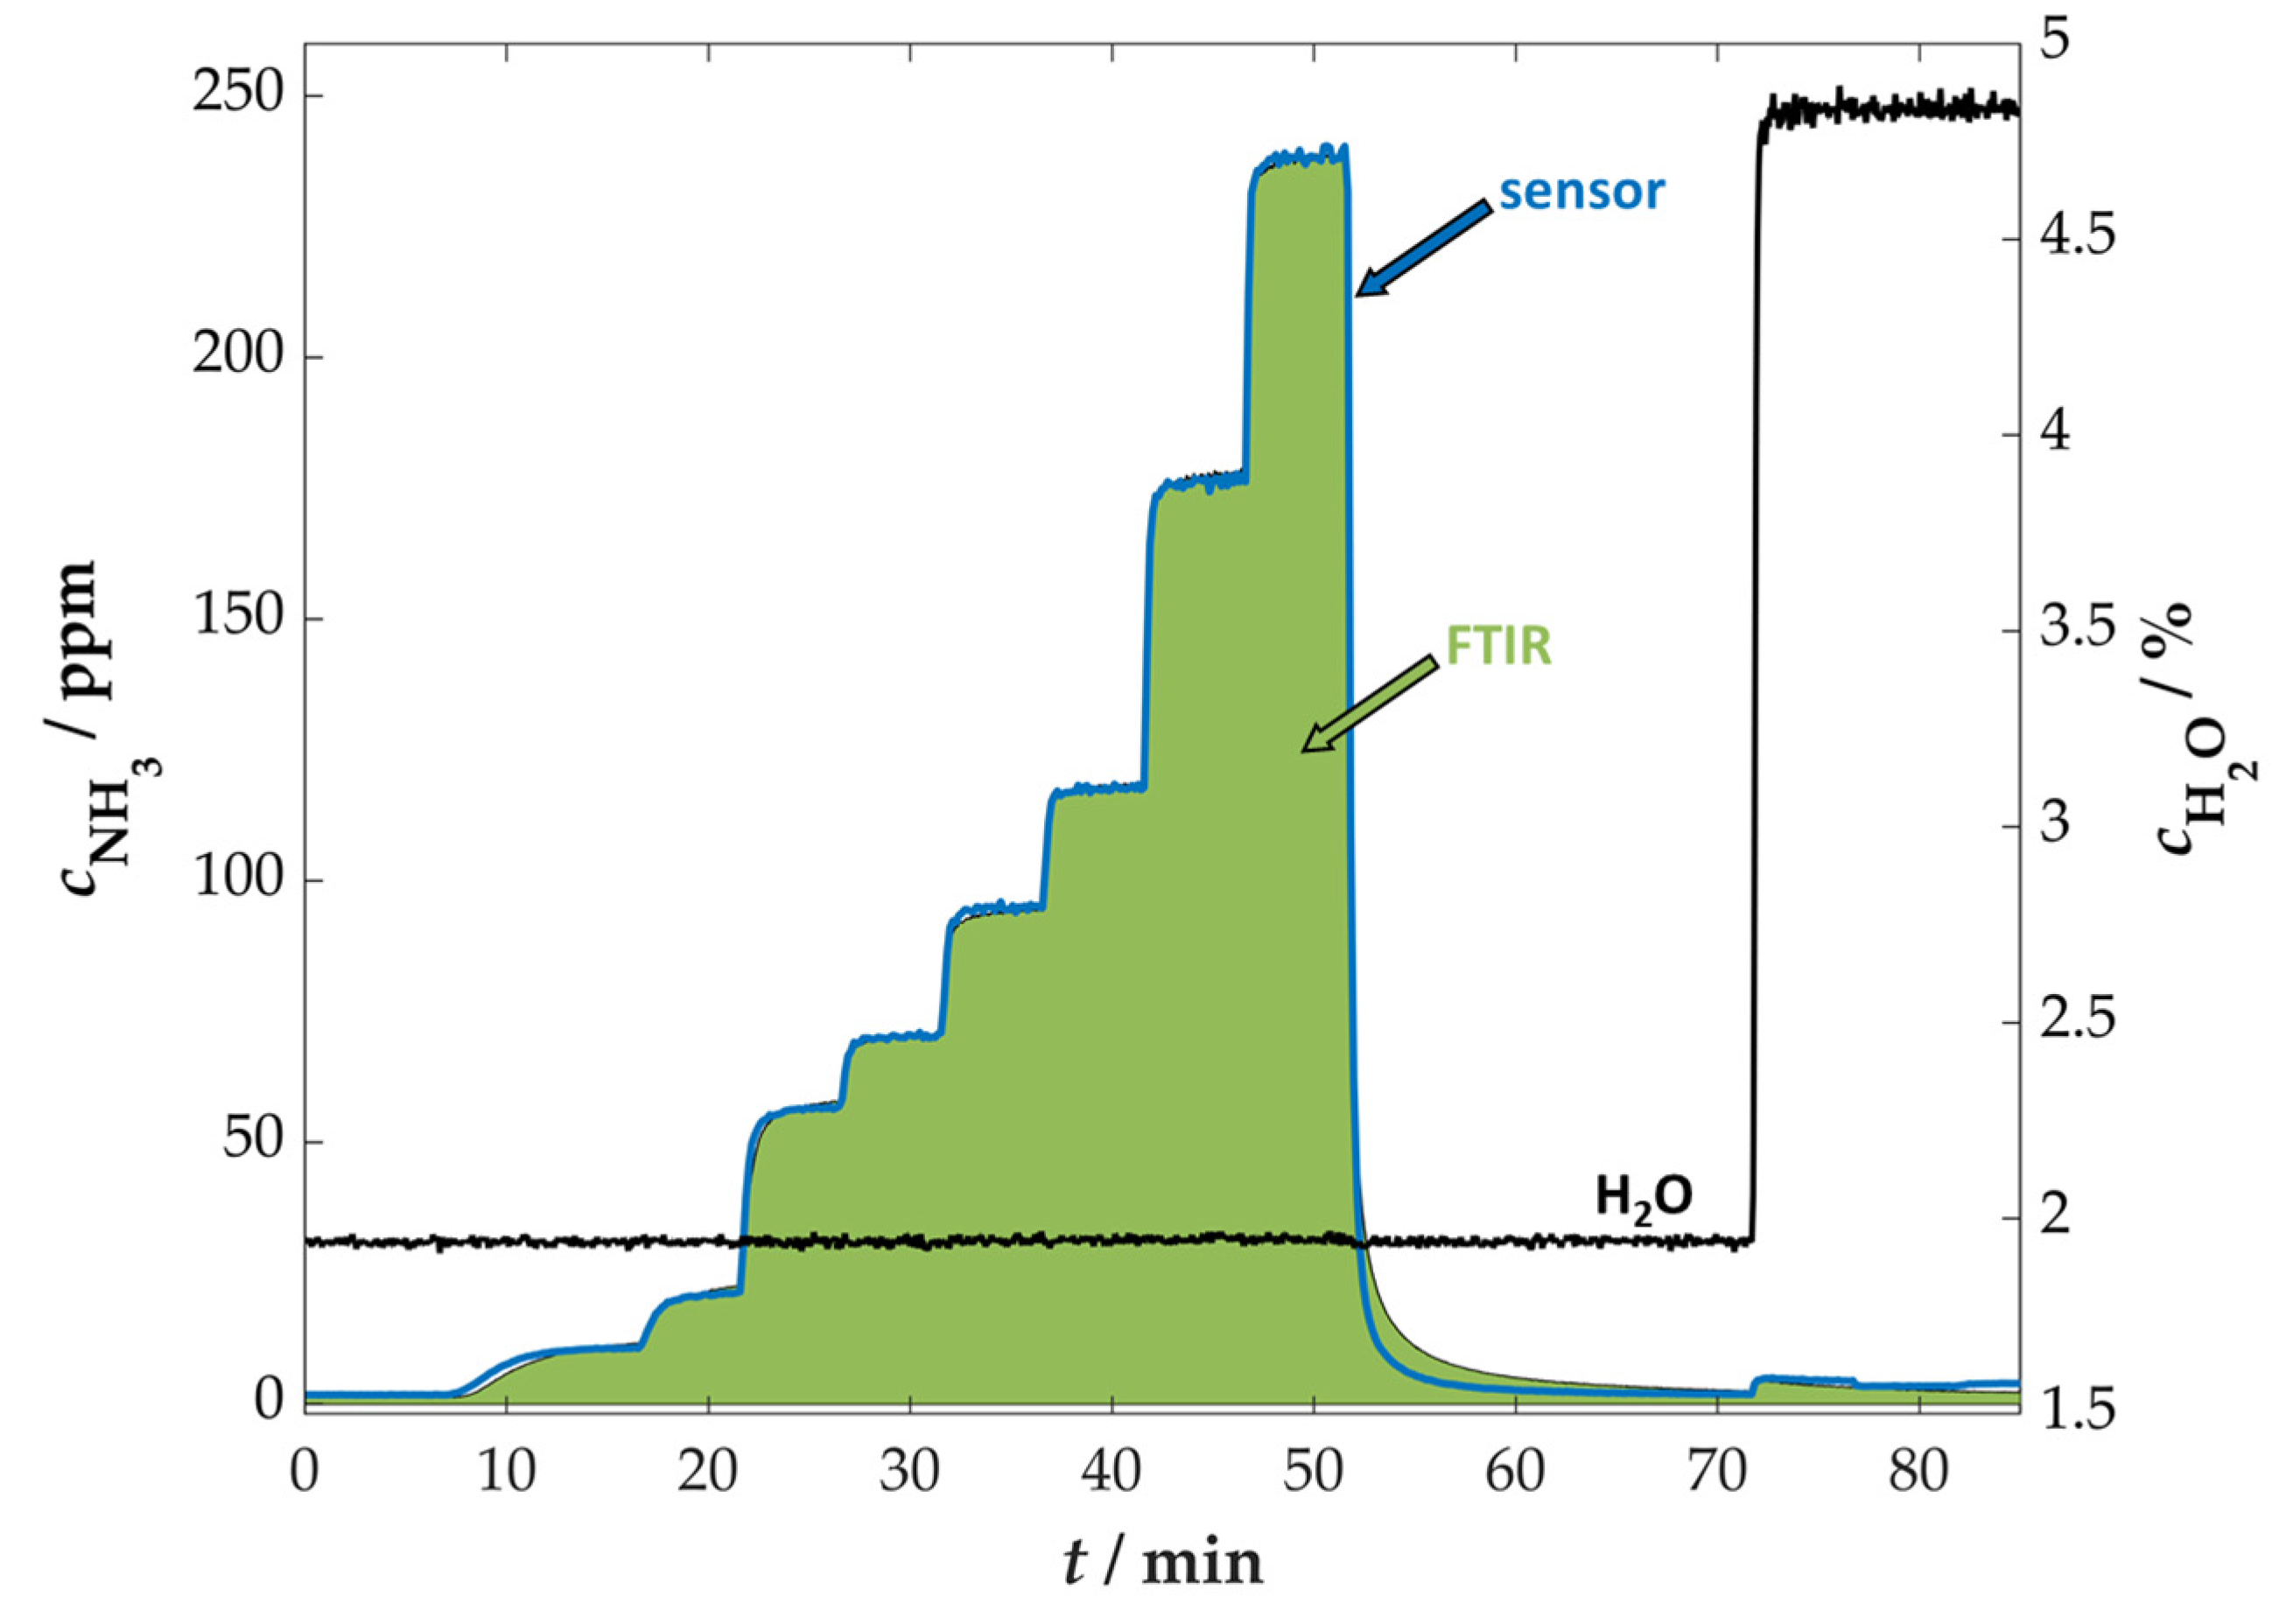
3.2. Characterization of First Sensors

After the first set of self-heated sensors was fabricated, the sensors were initially analyzed by impedance spectroscopy. A frequency sweep was performed between 1 Hz and 1 MHz at an RMS voltage value of 250 mV. The Nyquist plot of a sensor with a 20/20 μm IDE structure at a temperature of 440 °C is shown at different ammonia concentrations (0–240 ppm) in Figure 4.
Basically, the Nyquist diagram shows the typical behavior of a parallel R||C element. The high resistance is due to the poor ionic conductivity of the zeolites. In the case of the H-ZSM5 zeolite used, the ionic conductivity results from the movement or rearrangement of the protons present for charge balance. In a gas flow without ammonia, the so-called proton hopping occurs primarily at the zeolite. In this condition, the protons move along the acid centers of the zeolite. Besides the dependence on temperature due to thermally activated proton hopping, the proton conductivity can also be increased by reducing the modulus of the zeolite. The lower the modulus, the more acidic centers are located at a smaller distance from each other. This, in turn, increases the probability of proton hopping [77].
A beginning of a “tail”, which may be related to a diffusion-controlled process in conjunction with blocking electrodes, can be seen at very low measurement frequencies f below 10 Hz.
At higher frequencies (>>1 kHz), however, the sensor behaves similarly to a capacitor. The phase angle is almost −90° and the magnitude of the impedance is only in the range of a few kiloohms since Z is proportional to (ω·C)−1.
Due to the adsorption of ammonia at the centers of the zeolite, various conductivity mechanisms can be found, which have already been described in detail in the literature [71,77,78]. This results, e.g., in conductive paths in which protons can move or in an oscillation of the ammonia molecular chains due to the changing electric field caused by the applied AC voltage. This affects both the electrical and dielectric properties of the zeolite film.
For application in the real exhaust gas, the permanent measurement of a complete impedance spectrum is not necessary. For this reason, impedances were measured only at one single frequency, also to improve the timely resolution.
As mentioned before, the adsorption and desorption of the analyte molecules (NH3) change the permittivity and resistivity of the zeolite film. Due to the blocking electrode effect at low frequencies, in conjunction with the high impedances in the megaohm region, a capacitive measurement at high frequencies (>100 kHz) is preferred. The charge balance, in this case between protons, results in ionic conductivity. The measurement at high frequencies leads to the fact that there is only a reorientation of the protons within the zeolite. The adsorption of solvate molecules additionally leads to a rotation and reorientation of the different molecules (NH3, H2O). This, in turn, influences the dielectric properties of the material [49]. For this reason, instead of the electrical resistance R, the capacitance C is determined below as a measure of the ammonia concentration. The relationship between the measured impedance Z, the measured phase angle φ, and the capacitance C can be described by Equation (3) in the case of a parallel R||C element [79]:
C = sin ( φ ) 2 π f · Z
In view of the increasing inductive influences of the electrical leads (Z ~ ω·L) that begin to become noticeable just below 1 MHz, a frequency of f = 700 kHz was selected as the measuring frequency with a constant RMS voltage value of 250 mV. In addition, the connection wires to the sensor, depending on their positioning, also contribute to the measured capacitance value with a small amount (about 1–2 pF), which must be considered in the evaluation. An exemplary measurement of a sensor at 440 °C under varying ammonia concentrations between 0 and 240 ppm can be seen in Figure 5.
The sensor operated at 440 °C responded quickly to ammonia concentration changes (see Figure 5a in comparison with the FTIR data in Figure 5b). The sensor reached stable capacitance values and returned to its initial value after the ammonia dosing ended. In the shown measurement, a higher signal response appeared at low ammonia concentrations. The relationship between the ammonia concentration and the sensor capacitance is illustrated in Figure 6 (calibration curve).
The ammonia-dependent capacitance curve in Figure 6 reminds a classical adsorption isotherm. In theory, the sorbed NH3 mass of the zeolite depends on the partial pressure and, thus, on the concentration of the solvate molecule present in the gas. There is much debate in the literature about the exact sorption mechanism for zeolites. The Langmuir isotherm is often mentioned as the simplest and most widely accepted theory, in which the NH3 loading continues to increase with increasing adsorbent concentration (in this case, ammonia) but approaches a maximum value that cannot be exceeded [80,81].
However, this relationship does not exactly apply to this type of zeolite. The description of the Freundlich isotherms includes, similar to that of the Langmuir isotherms, that with a stronger loading of the material, fewer molecules can adsorb on the surface, but a maximum value of the loading is not reached immediately. This shows a dependence on the partial pressure of the adsorbent in the form of a power function. Sorption measurements on various zeolite-based SCR catalysts proved this relationship [50,81,82,83].
Accordingly, the sensor can also detect higher ammonia concentrations, but with significantly reduced sensitivity. For use as an ammonia slip sensor, however, high sensitivity at low concentrations (<100 ppm) is advantageous, which corresponds to the results presented here. Nevertheless, higher ammonia concentrations up to approx. 240 ppm can also be investigated in measurements in order to test the possible use upstream of the SCR catalyst to measure the amount of dosed ammonia.
As already mentioned, despite dosing ammonia stepwise, in the sensor chamber, a delayed ammonia concentration increase can be seen (see Figure 5b) due to adsorption and desorption processes at the pipes of the test bench. This is in contrast to other “non-sticky” gas components, such as CO2 or H2O (see Figure 7 at 72 min). This fact can be noticed mainly at small concentrations at the beginning (8–18 min) and at the end of the measurement (53–70 min).
For a better interpretation of the sensor response time, the measured sensor signal (capacitance, Figure 5a) was processed into concentration data on the basis of the calibration curve (Figure 6). The comparison between the sensor-derived and the FTIR-derived ammonia concentrations is shown in Figure 7.
The comparison of the two curves here shows a good agreement between the ammonia concentration measured with the sensor and using FTIR spectroscopy. It can be seen in the plot (at 10 min and 52 min) that the sensor reacted earlier to changes in the ammonia concentration because the piping between the sensor and the FTIR spectrometer blurs the ammonia concentration profile. This also confirms the slightly “lagging” behavior of ammonia in the gas dosing system. Furthermore, the data show that even low concentrations (<10 ppm) could be detected with the sensor.
The fast response time of the sensor in this case can be attributed to the (relatively) high operating temperature of 440 °C. As a result, the adsorption and desorption of ammonia on the zeolite film occur quickly, which means that no permanent ammonia storage can be observed at this high temperature. However, further influences on the operating temperature of the sensor are to be specified in the next section.

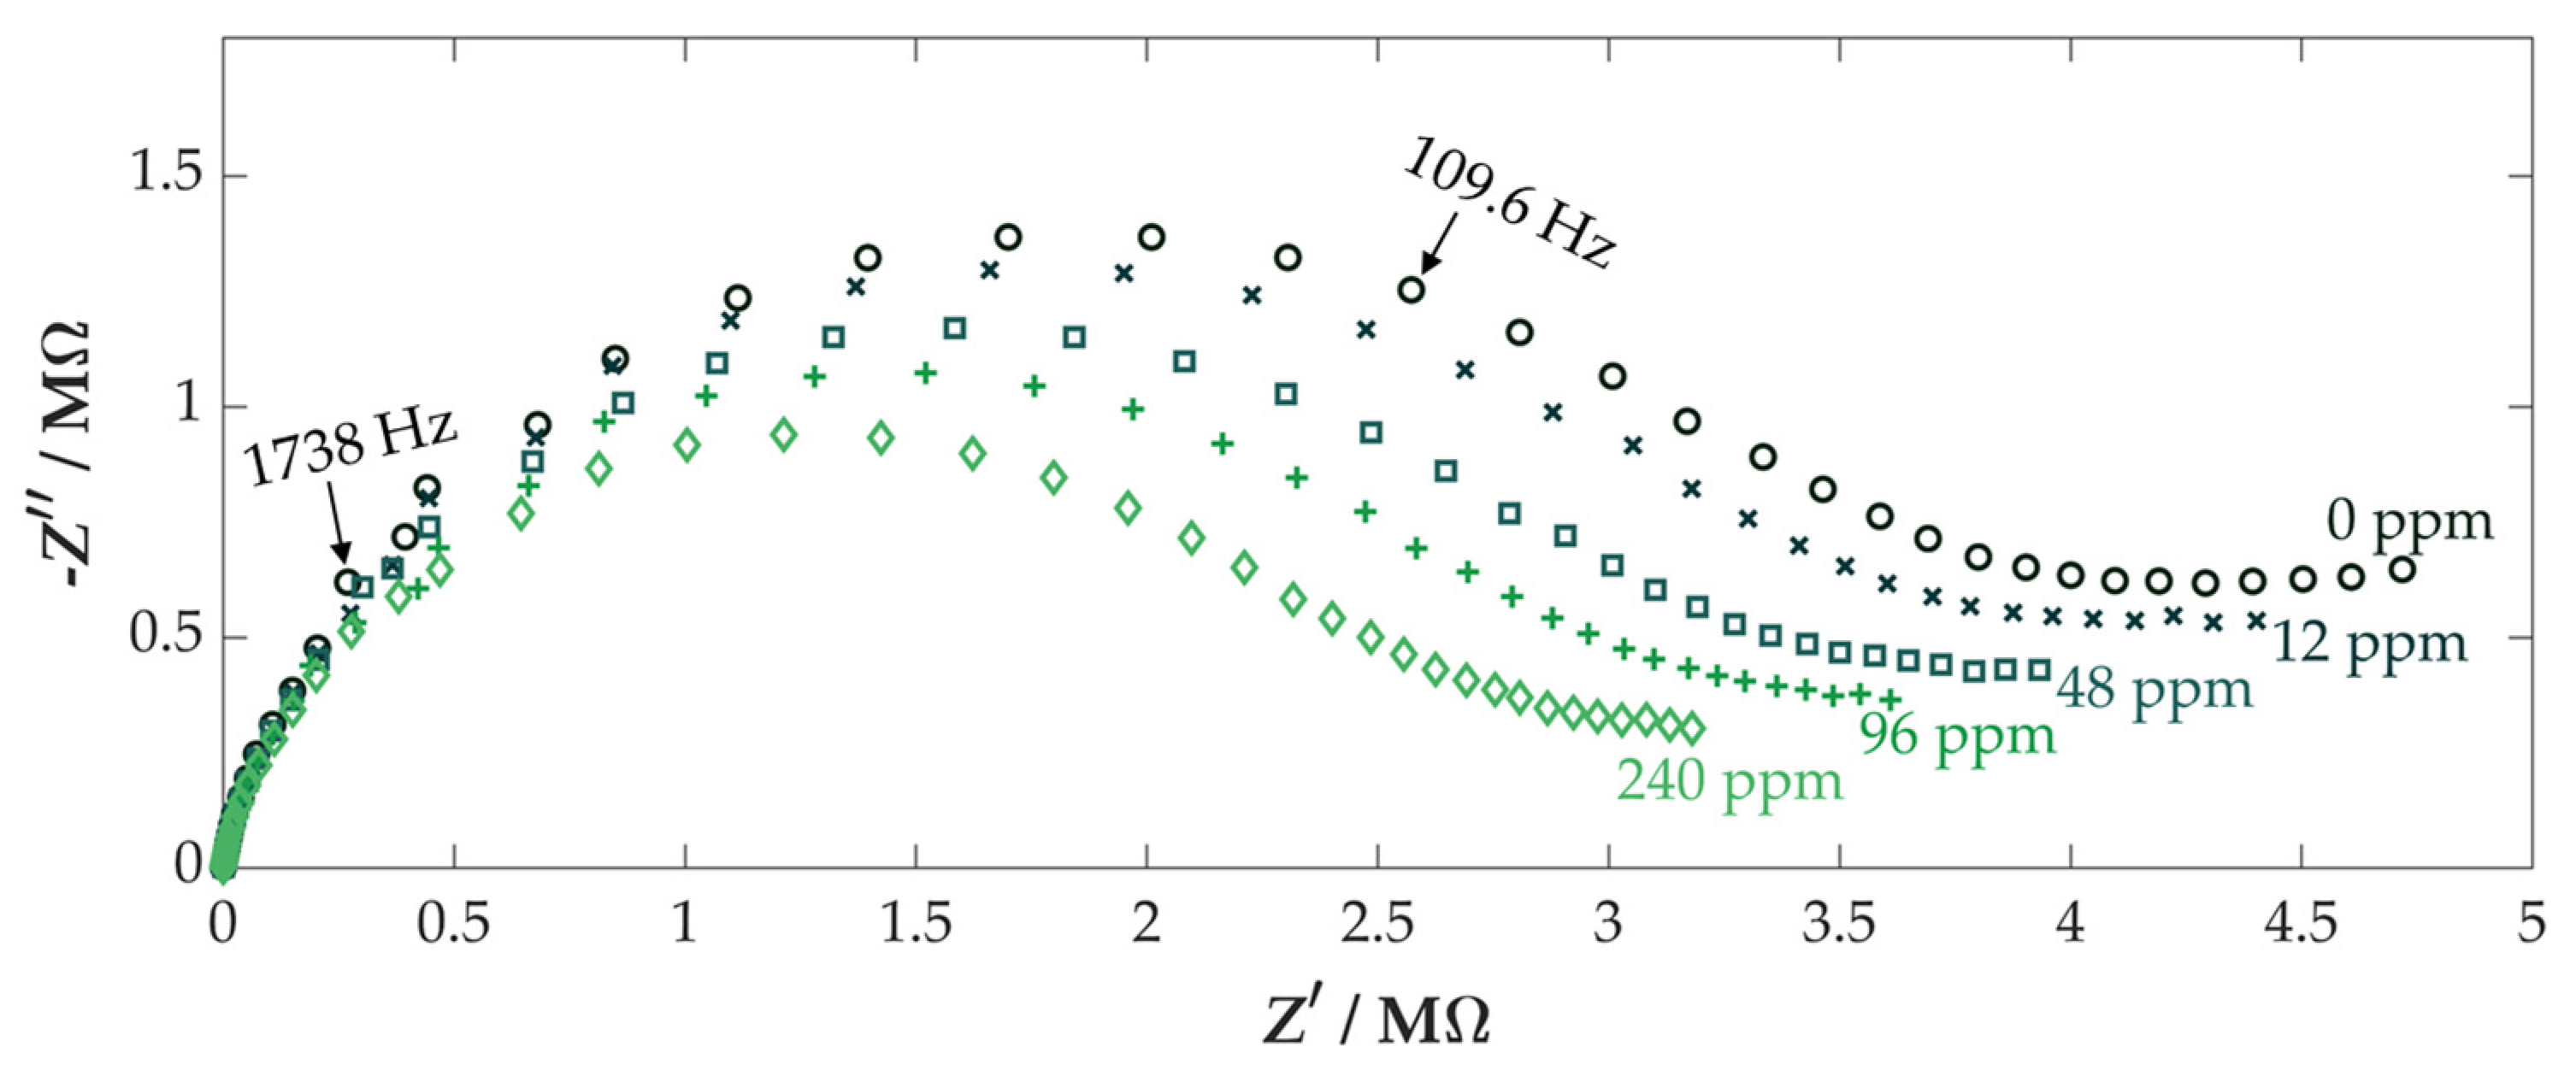
3.3. Further Sensor Characterization

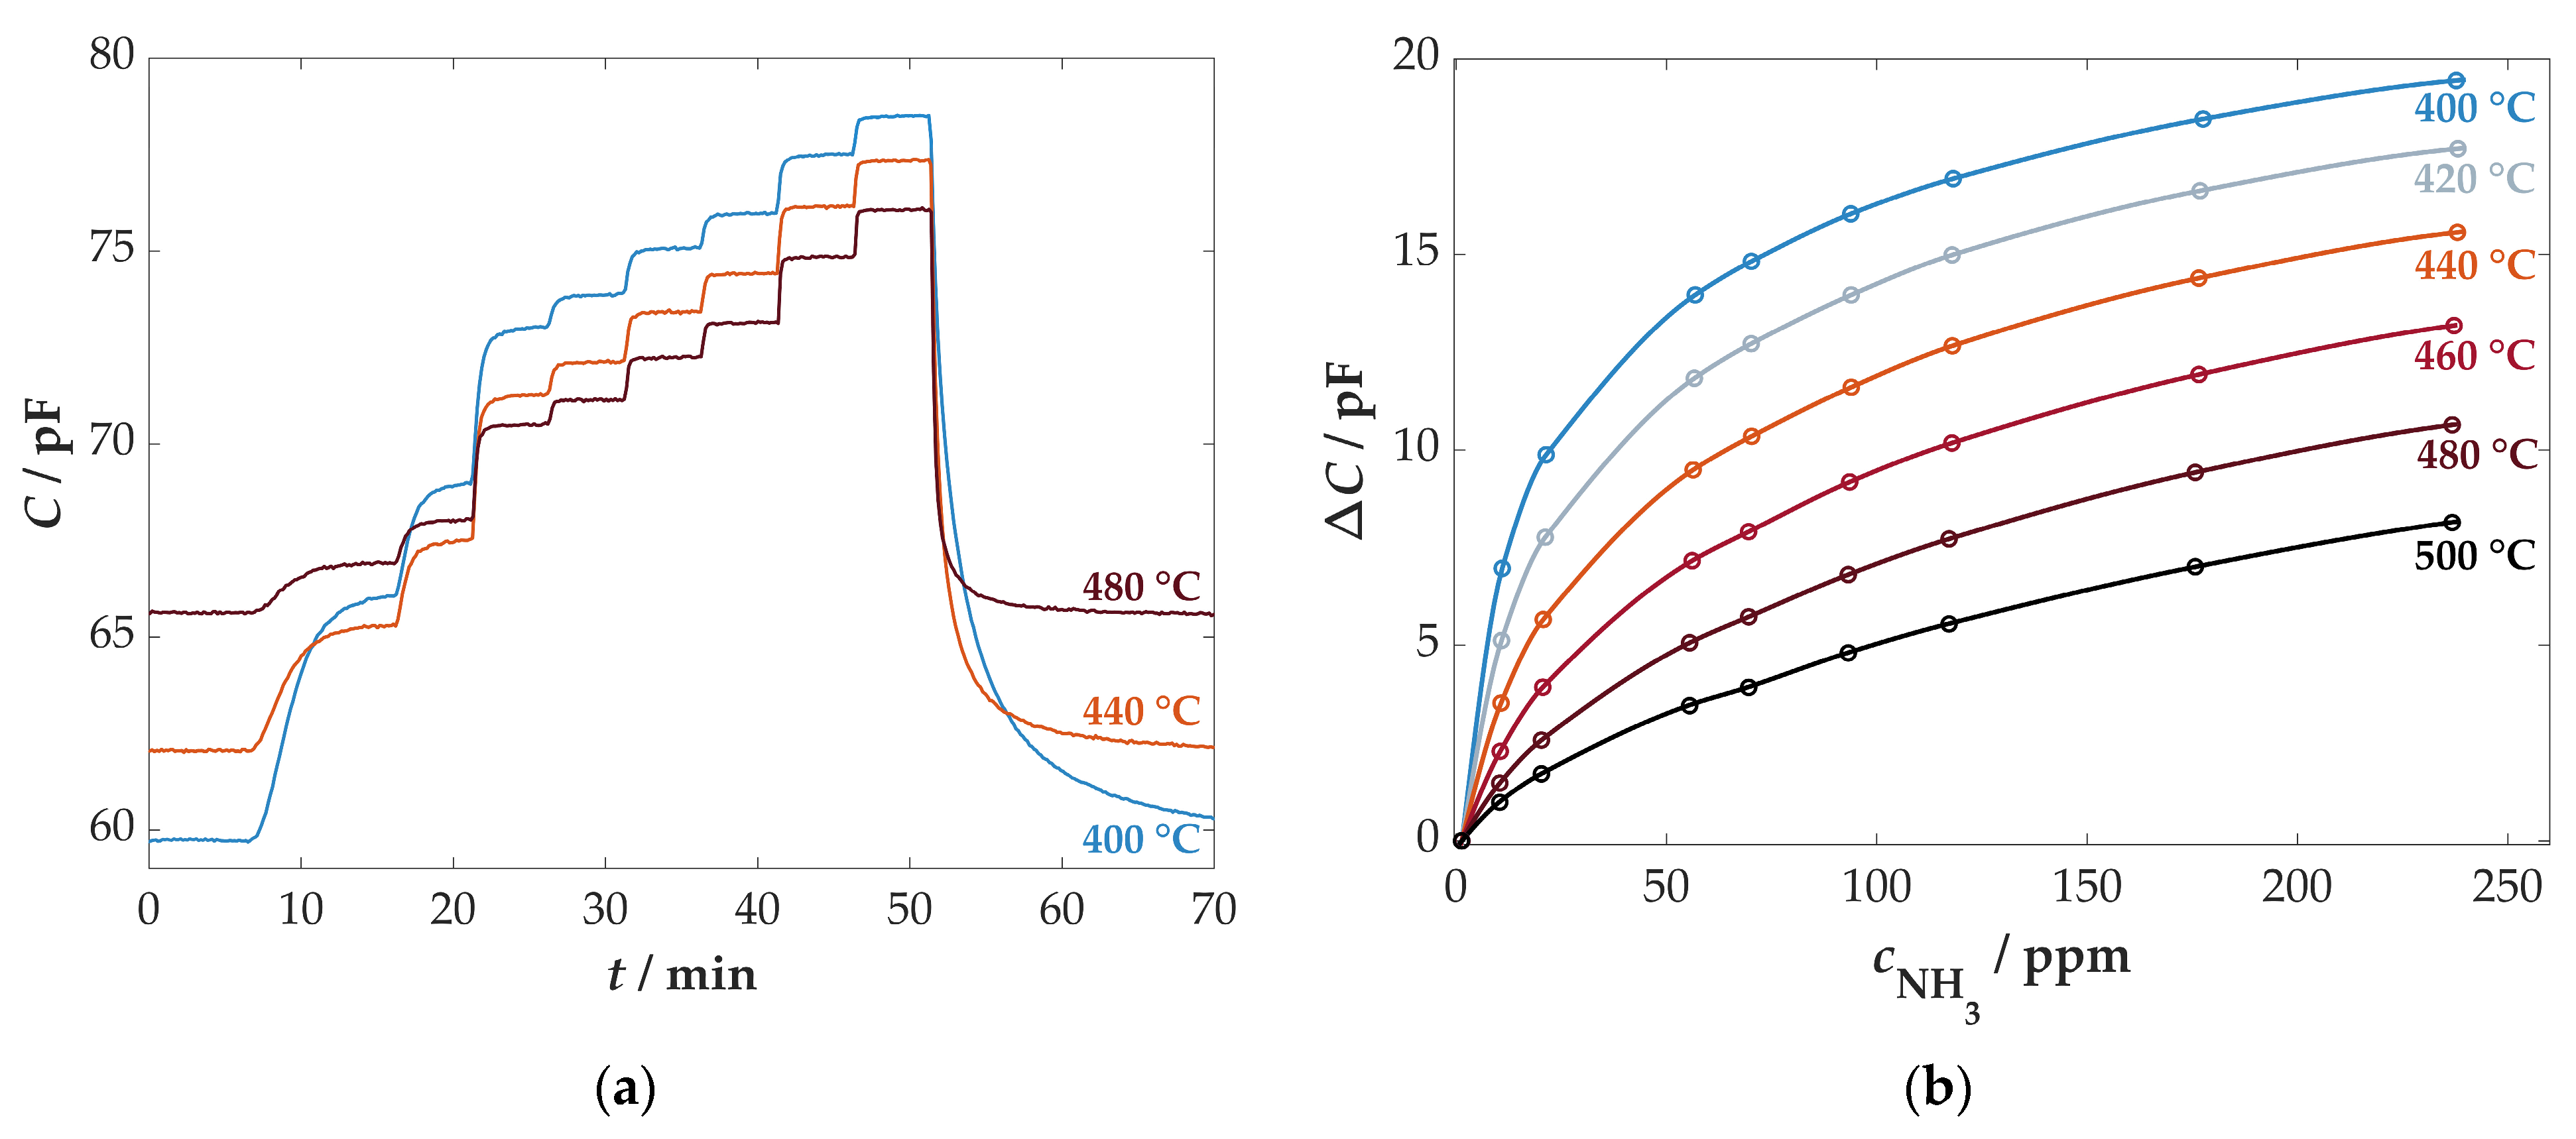
3.3.1. Influence of the Sensor Temperature

The operating temperature of the sensor influences several factors in the measurement, such as sensitivity, measuring range, and response time. For the data shown in Figure 5, Figure 6 and Figure 7, the sensor was operated at 440 °C. The influence of the operating temperature is now shown in Figure 8. A sensor was repeatedly operated at temperatures from 400 °C to 500 °C in 20 °C steps while varying the ammonia concentration from 0 to 240 ppm (same ammonia steps as in Figure 5).
In general, two effects can be observed with increased sensor temperature. In Figure 8a, only three of the six measured temperature levels are shown for clarity. It can be seen that the base capacitance of the sensor (0 ppm NH3, 0–6 min) increases with temperature. This effect can be attributed to the thermally activated mobility of the protons, which directly yields a higher capacitance of the sensor [73,78].
In contrast, the sensitivity of the sensor to ammonia decreases significantly with increasing temperature. For this purpose, Figure 8b shows the change in capacitance (i.e., the base capacitance at 0 ppm has been subtracted) for different ammonia concentrations. The sensitivity (the slope) decreased with low temperature mainly at low ammonia concentrations. This effect results from the fact that the equilibrium between adsorption and desorption shifts to the desorption side with increasing sensor temperature, which means that less ammonia is adsorbed on the zeolite at higher temperatures [73].
The decreased ammonia sensitivity with increasing sensor temperature explains the faster return to the baseline after ammonia dosing (see Figure 8a at 52 min) during the measurements at higher temperatures. Due to the lagging behavior of ammonia in the gas dosing system, as mentioned above, low concentrations (<5 ppm) remain in the gas stream even after the dosing has ended. In the measurements with lower sensor temperatures, this behavior can be detected due to the improved sensitivity at low concentrations. Accordingly, lower operating temperatures (approx. 400 °C) should be aimed for use as an ammonia slip sensor downstream of the SCR catalyst. Lower operating temperatures would be possible but are not recommended due to the potential deposition of soot particles on the sensor surface or housing during operation in flue gas exhaust.
Furthermore, during the operation of the sensor in flue gas with changing flow conditions, temperature fluctuations can occur in the gas-sensitive zeolite film. An error in the temperature of the sensor of about 20 °C leads to a maximum error in the determination of the ammonia concentration of about 5 ppm in the lower concentration range (<50 ppm) and an error of max. 40 ppm at 240 ppm NH3. This is due to the high change in sensitivity with the temperature at low concentrations. The sensor response and recovery time, on the other hand, are hardly affected by the change in the sensor operation temperature. We assume that the sensor response and recovery times are ruled by the test bench rather than by physicochemical effects, meaning that the sensor is much faster than Figure 5, Figure 6, Figure 7 and Figure 8 indicate.

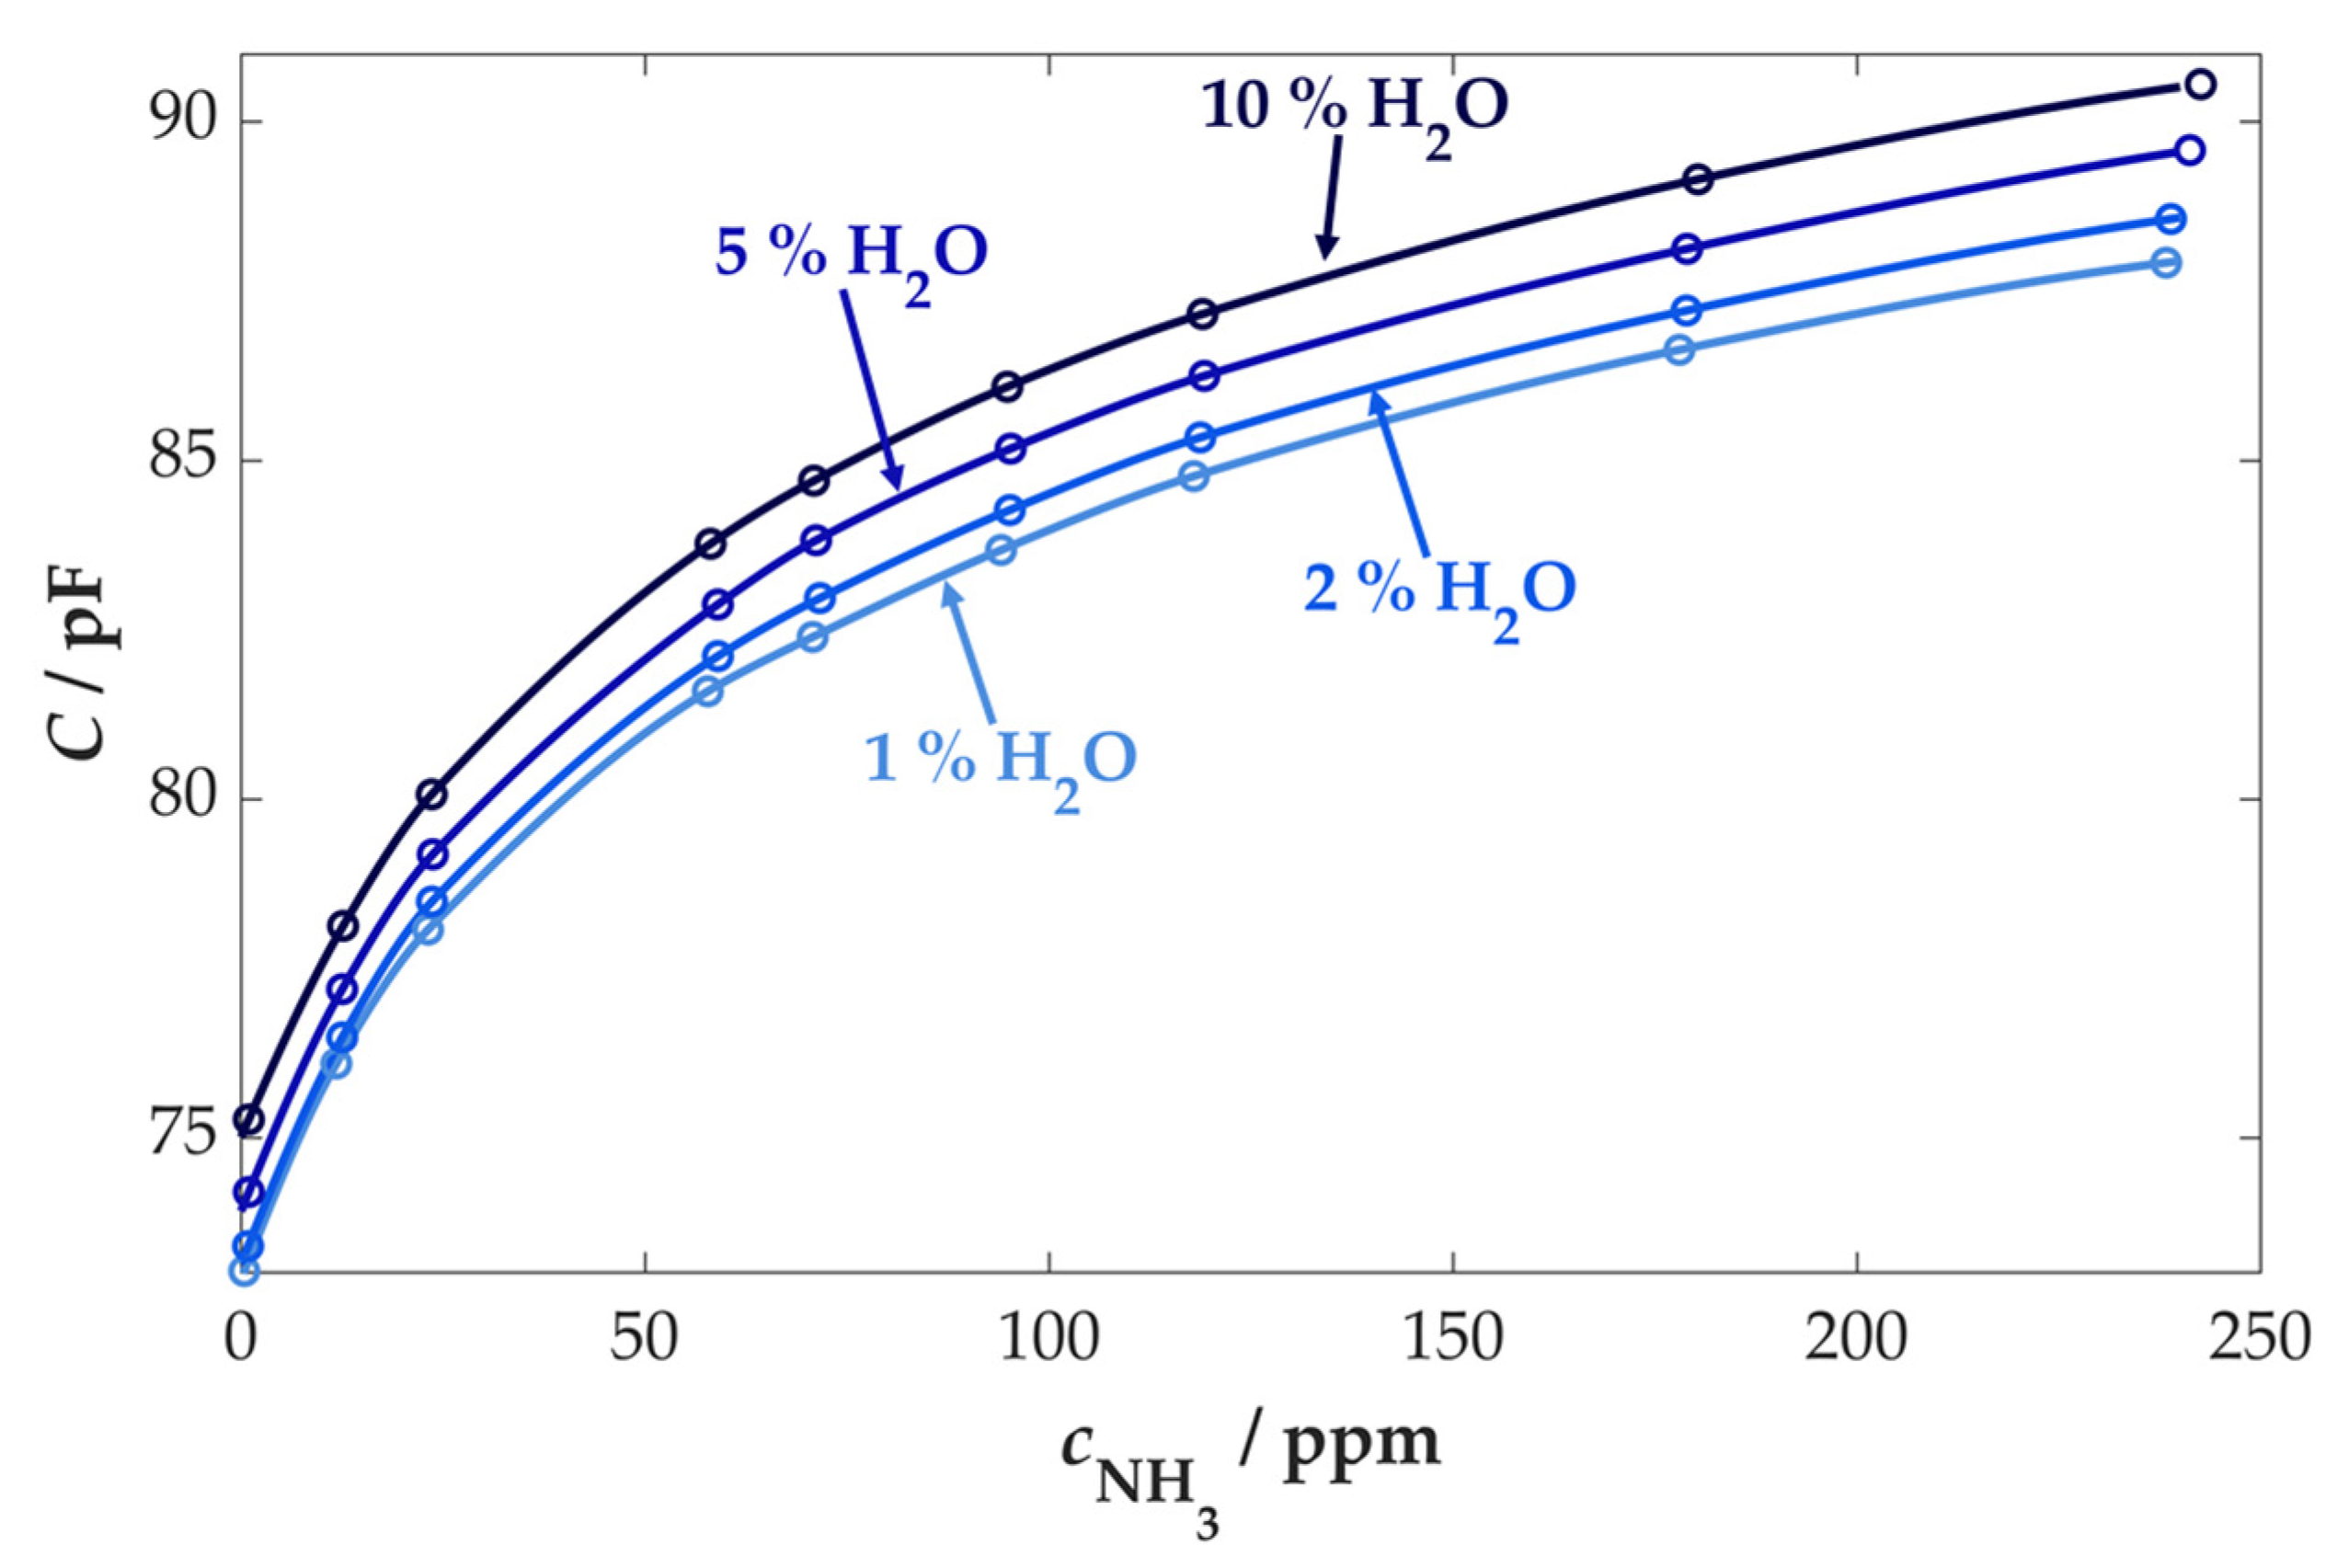
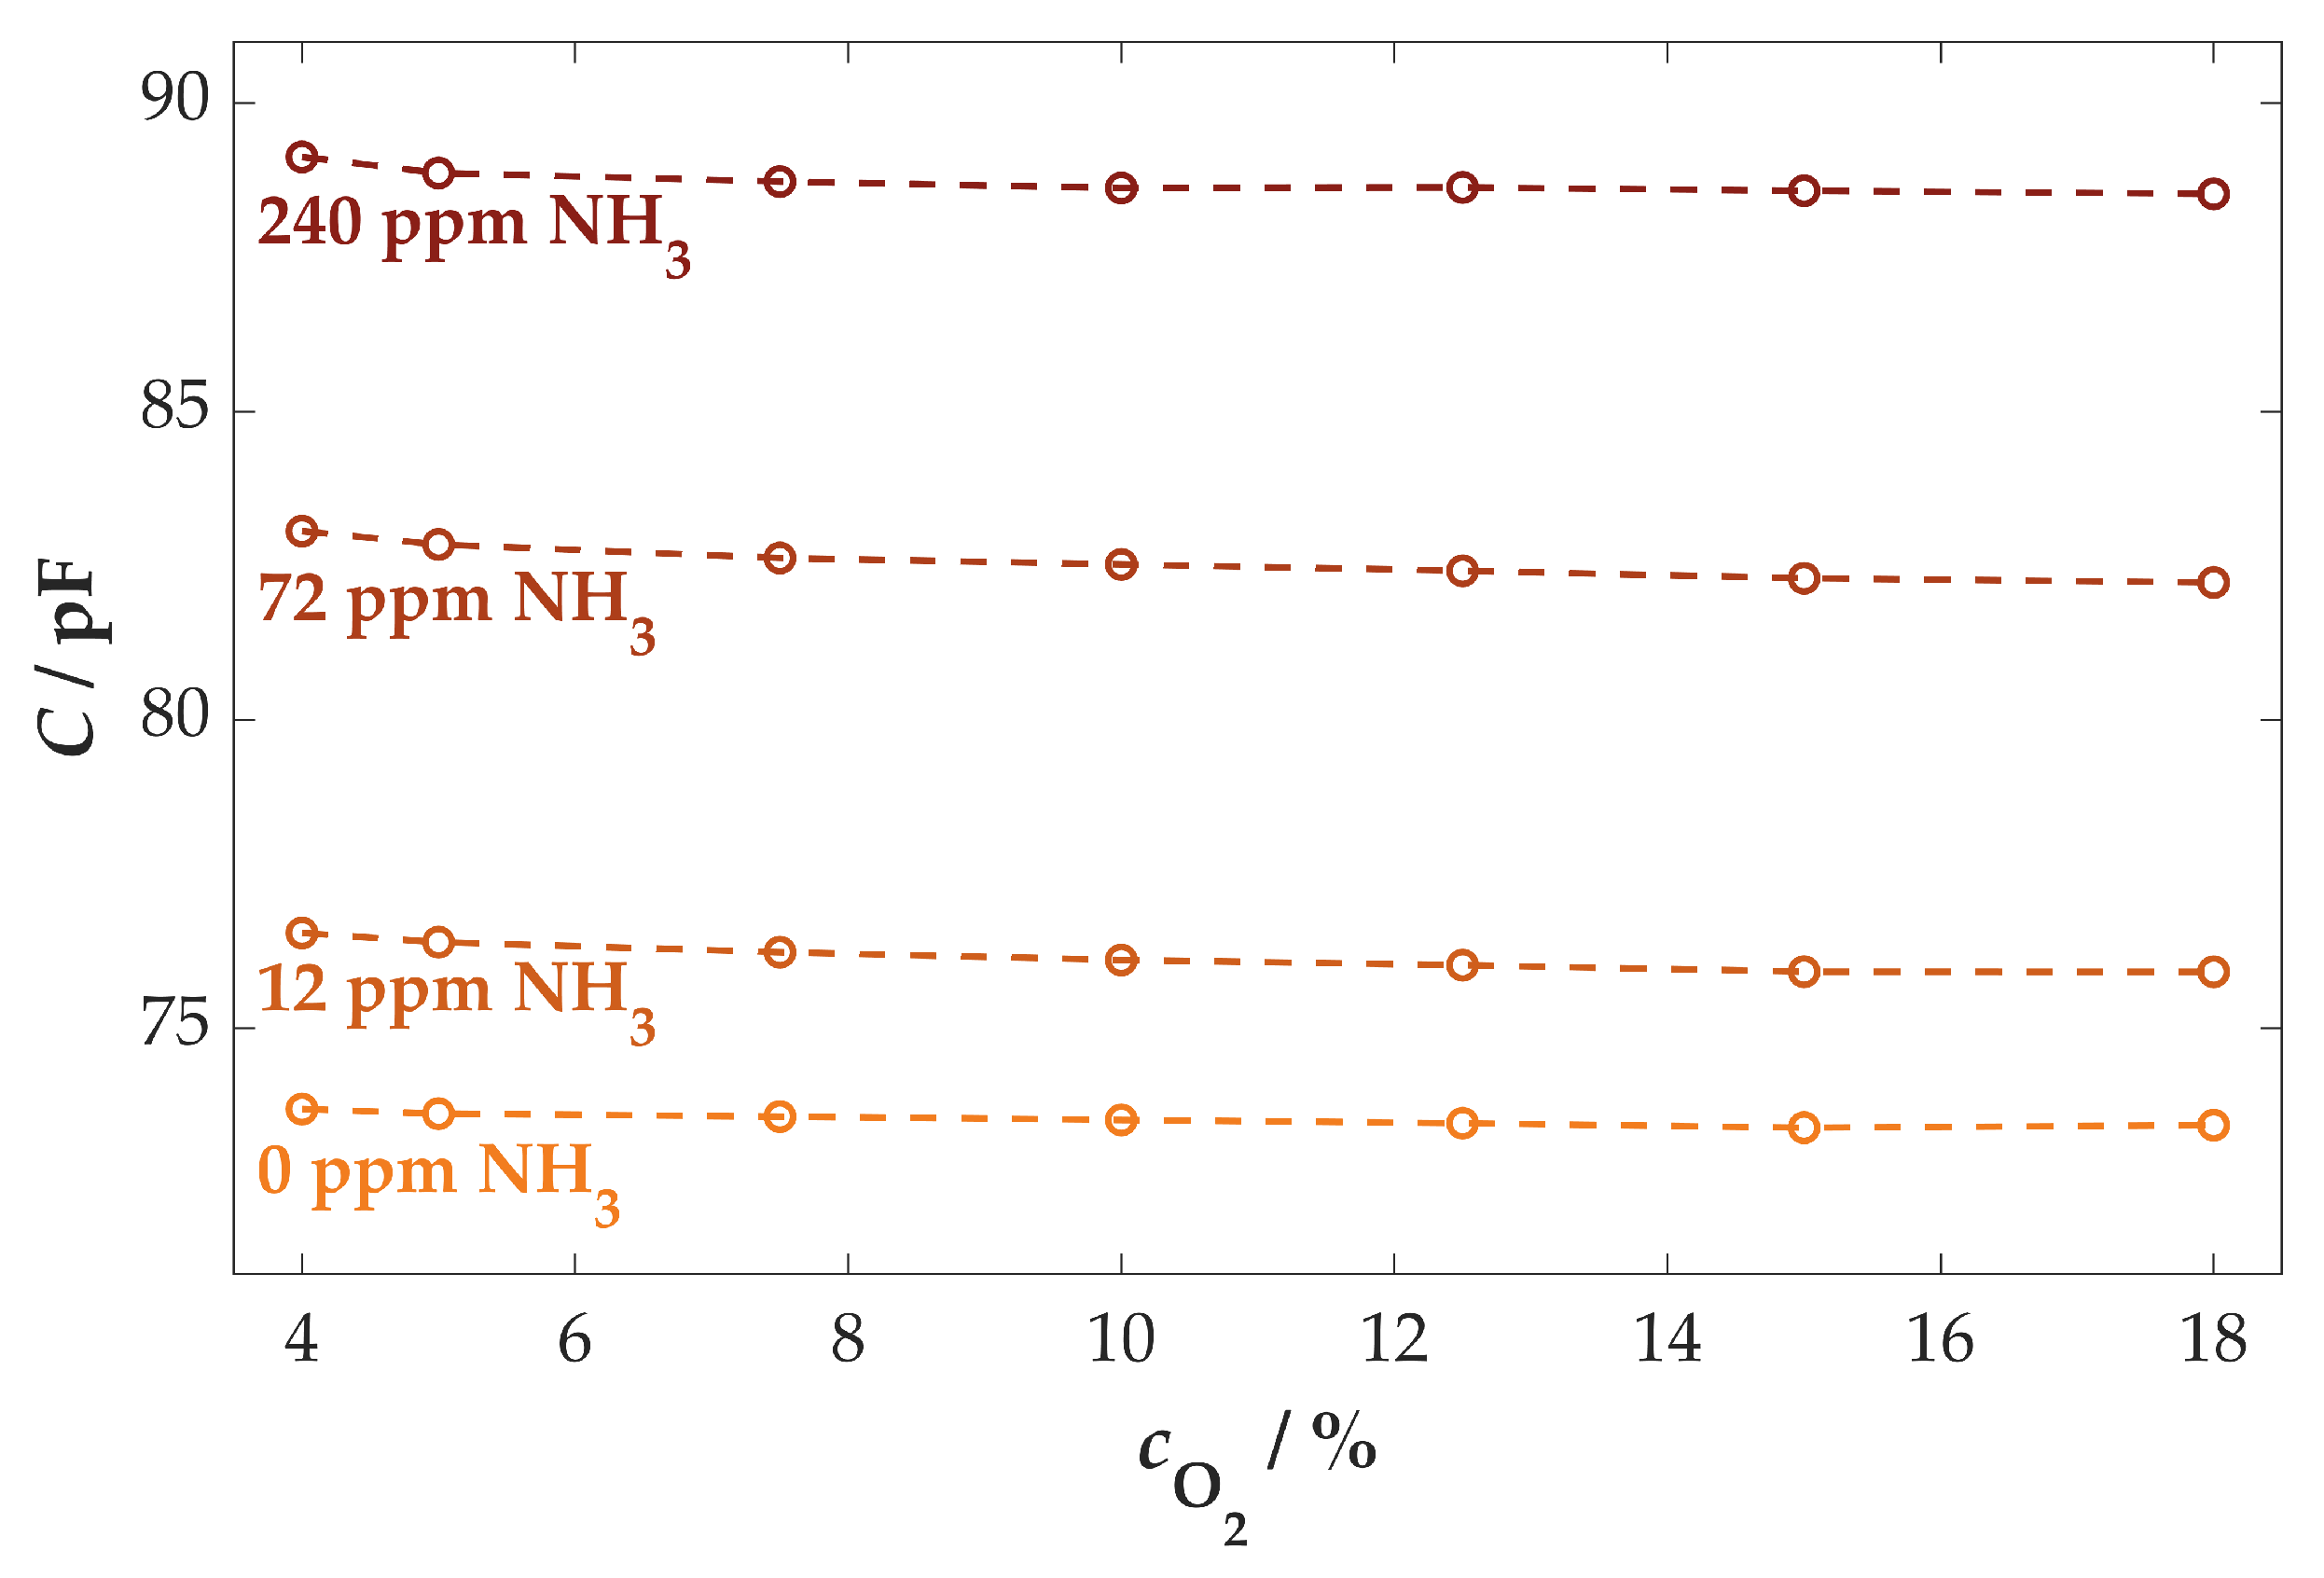
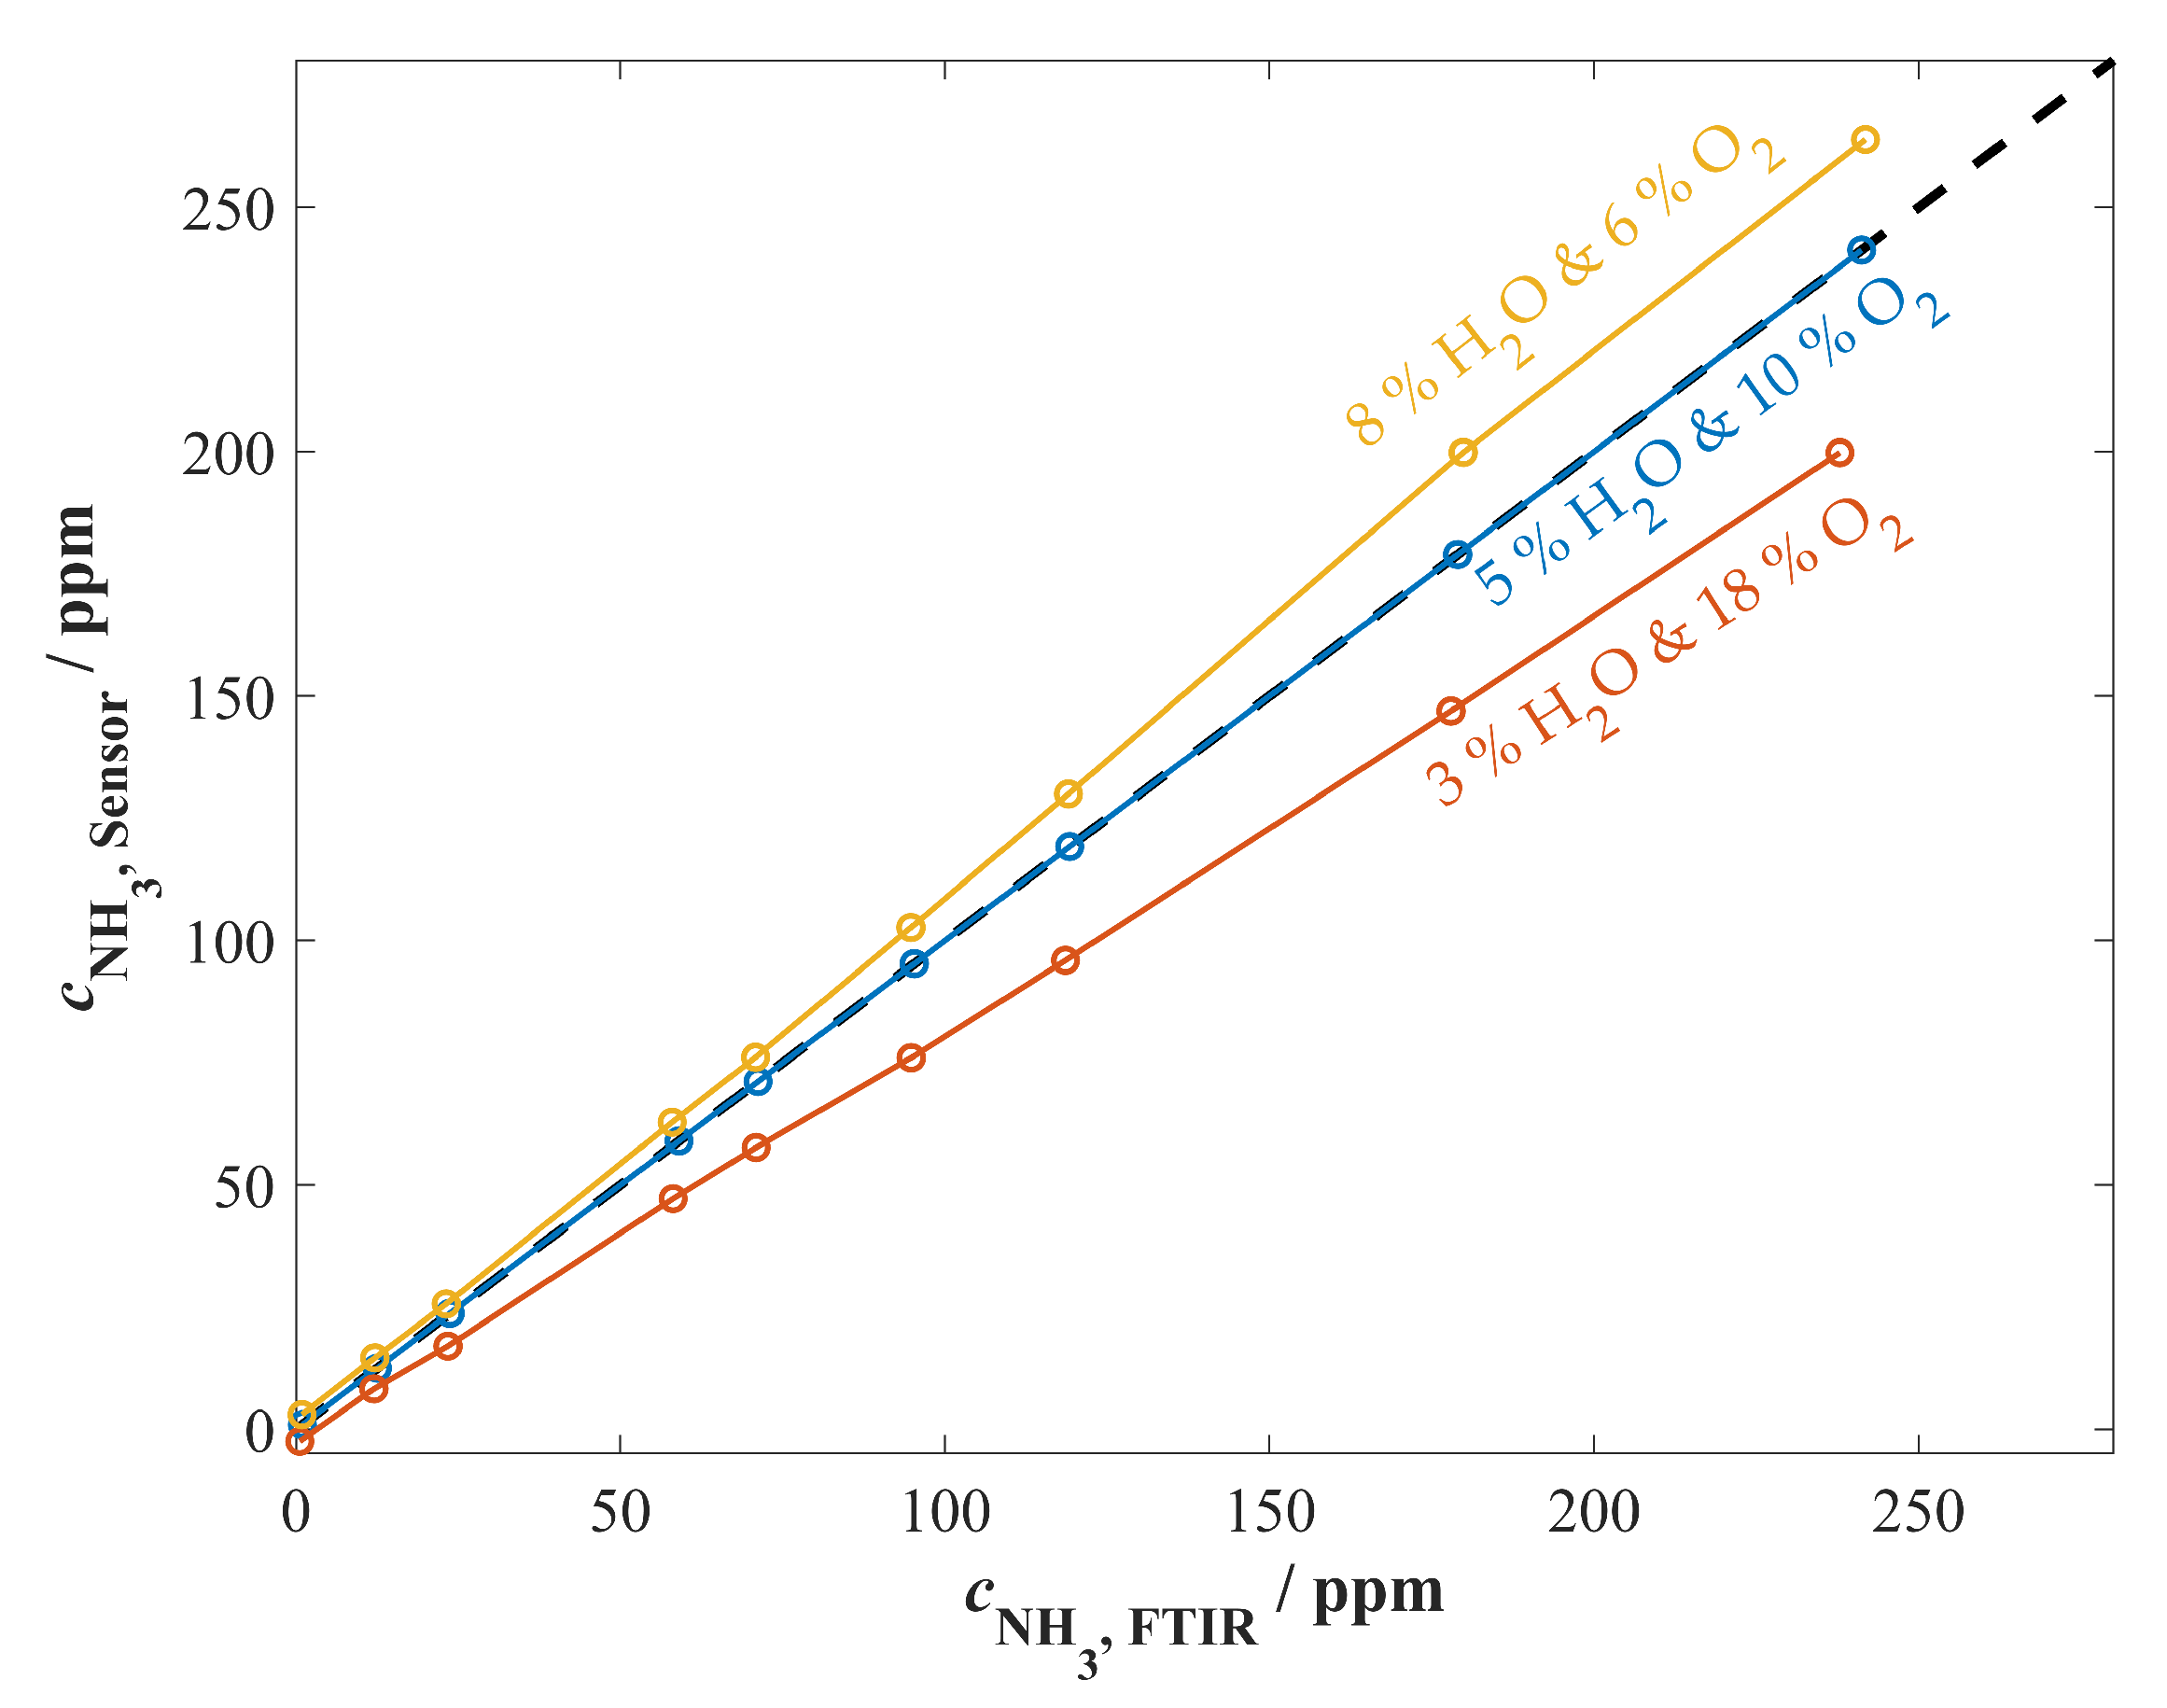
3.3.2. Cross-Sensitivity Measurements

Exhaust gases from biomass combustion contain different components that may also influence the properties of the gas-sensitive zeolite film. Due to the high water content of biogenic fuels, such as wood or straw, compared to fossil fuels, significantly higher water concentrations occur in the flue gas. Depending on the load condition and fuel, the water content can increase to more than 10 vol.% [84,85]. Accordingly, the influence of water on the zeolite film was analyzed. Zeolites are not only used as ammonia storage for SCR applications but are also often used as dehumidifiers for technical plants [86,87]. Thus, a certain water dependence of the signal could have been expected. A series of measurements with the variation of the absolute water content from 1 to 10 vol.% is shown in Figure 9.
Figure 9 shows that the sensor capacitance increased with the water content in the exhaust. Similar to ammonia, water can be adsorbed on the zeolite. This influences the permittivity and thus the capacitance of the gas-sensitive zeolite film. However, unlike ammonia, water is only electrostatically bound to the centers of the zeolite or the ammonia chains [51,88]. As a result, the binding strength and therefore the influence of water compared to ammonia is significantly reduced. This is shown by the fact that a change of 5 vol.% water corresponds to an apparent sensor response of approx. 20 ppm NH3. With respect to the output signal, the characteristic curve of the sensor shifted due to the increasing water content to higher capacitance values almost independently of the ammonia concentration. Accordingly, the sensitivity to ammonia remained at a similar level.
The effect of oxygen is also of major importance. The water and oxygen concentrations in the flue gas of combustion processes basically behave in opposite directions. The less fuel being burned at any given time, the less oxygen is required, thus approaching the ratio in the ambient air of approx. 21%. Accordingly, water is produced in small quantities during combustion. However, if effective combustion takes place in which a high mass of fuel is converted, high amounts of oxygen are required, leading to the formation of high water contents and low residual oxygen concentrations [89].
In conclusion, the influence of different oxygen concentrations was investigated in a further series of measurements. For this purpose, the previous measurement (see Figure 9) was repeated, varying the oxygen contents from 4 to 18%. This series of measurements is shown in Figure 10.
Figure 10 clearly indicates that almost no cross-sensitivity to oxygen occurred, i.e., the capacitance remained constant under varying oxygen concentrations but depended on the ammonia concentration. This can be attributed to the fact that the proton-exchanged ZSM-5 zeolite has no centers where oxygen can sorb, which is in stark contrast to water, especially at these temperatures [51]. Therefore, during combustion, only the influence of water can be seen in the sensor response.
In order to investigate this effect more precisely, a measurement with simultaneous variation of the water and oxygen content was carried out in the next step. Depending on the firing system and the fuel used, the concentrations of the two components can be in a wide range. In this series of measurements shown below, a calibration curve was determined for 5 vol.% H2O and 10% O2 so that it could be transferred to two other oxygen and water combinations (8 vol.% H2O and 6% O2 or 3 vol.% H2O and 18% O2). The corresponding concentration curves for the three combinations can be seen in Figure 11.
Identical to the measurements shown in Figure 5, Figure 6 and Figure 7, a calibration curve of the sensor was determined and used to convert the sensor capacitance values to ammonia concentrations. Using the steady-state values, a comparison of the measured FTIR and sensor concentrations can be made, and the deviation depending on the gas composition can be determined.
Due to the calibration at 5 vol.% H2O and 10% O2, the calibration curve is naturally on the bisector, i.e., the data of the sensor agree with those of the FTIR spectrometer. For the other two combinations, in accordance with the results from the previous chapter, only the influence of water can be seen. As described above, oxygen molecules cannot get sorbed at the centers of the zeolite, which is in stark contrast to water molecules. This results in an oxygen-independent signal. Considering the results from Figure 9, an increase in water content in the gas leads to an increase in sensor capacitance. Therefore, if the water content is lower than the calibration, the ammonia concentration is underestimated, and if it is higher, it is overestimated. Hence, a small correction is required, which, however, can easily be derived from the firing conditions of the biomass.
Furthermore, it can be seen that the error increases further with increasing ammonia concentration. This is due to the general characteristic curve of the sensor and the influence of varying water contents. Due to the almost constant relationship between the capacitance and the water content, the measured error is minimized in areas with high ammonia sensitivity. Thus, in absolute terms, in areas of low ammonia concentration, the change in capacitance due to ammonia is significantly higher than the change due to changes in water content. On the other hand, the error increases significantly at high ammonia concentrations, with correspondingly reduced sensitivity.
Depending on the application, however, no great change in water content takes place, since, for example, biogas cogeneration plants are usually operated at constant load conditions. In order to minimize the error due to the water content, if necessary, the data of a simultaneously operated lambda probe can be used as a secondary signal. Lambda probes or NOx sensors that measure the oxygen content are already being used in biomass firing systems, in which an SCR system is used. With the help of these, the influence of water from the ammonia sensor can be corrected.

4. Conclusions and Outlook

The detection of gaseous ammonia in the flue gas of combustion processes represents a particular challenge to the robustness of a sensor element. In the past, research has been carried out on the development of ceramic sensors with high-temperature stability [51]. In this context, the adsorption properties of ZSM5 zeolites towards ammonia were used as a sensor effect and characterized, e.g., in the form of layer resistance [36]. By applying different layers with the widespread process of screen printing and optimizing it by laser patterning of the IDE surface, a cost-effective and efficient way of sensor fabrication could be realized in this work. This in turn also ensures a robust design with a stable sensor signal. Further development of the heater structure on the reverse side of the sensor will also contribute to this since it enables uniform temperature homogeneity within the zeolite film. The determination of the electrical properties of the zeolite film by impedance spectroscopy in the first step showed a clear correlation to the ammonia concentration in the gas volume. The transition to a capacitance measurement at a single excitation frequency (>100 kHz) simplified the measurement procedure, which also improved the temporal resolution.
Further laboratory measurements shown here revealed a high sensitivity of the sensor to ammonia and a rapid response to changes in concentration. In addition, the influence of the sensor temperature was investigated. The low influence of water and oxygen on the sensor signal is impressive. An oxygen dependence could not even be determined in a typical range for flue gas application in biomass firing.
Future works aim to investigate other influences on sensor behavior. Since the flue gas from biomass firing contains other aggressive components in addition to the usual gas components of automobile exhausts, such as SO2 or HCl [53], a further series of measurements on this topic will be carried out in the future. For use in the real exhaust gas of biomass combustion, the sensors will also be installed in a housing that is intended to minimize the influence of the gas flow and prevent the deposition of soot and ash particles on the sensor surface [59]. With such devices, long-term measurements have to be carried out. The development of appropriate electronics for simultaneous control of the heater temperature and measurement of the sensor capacitance is also important. Here, integrated hot-plate setups may be of interest, for instance, as shown in [90].
In combination with these developments in the sensor periphery, SCR systems for biomass combustion are to be equipped in the future with such a measuring unit. Upcoming investigations will also be carried out on plants that will be affected by new legal regulations on the emission of certain exhaust gas components in the future. With the help of this NH3 sensor, both overdosing and slippage of ammonia should be prevented. The verification of the functionality of the SCR catalysts will make it possible to optimize nitrogen oxide emission reductions in such plants.

Author Contributions

Conceptualization, T.W., J.K., G.H. and R.M.; sensor preparation and measurements, T.W. and J.K. in close discussion with G.H.; validation, T.W. and G.H.; formal analysis, T.W.; writing—original draft preparation, T.W.; writing—review and editing, T.W., J.K., G.H. and R.M.; supervision, R.M. All authors have read and agreed to the published version of the manuscript.

Funding

This research was funded by The Federal Ministry for Economic Affairs and Climate Action, Germany, the project ”Neue Sensorik für die Prozessoptimierung von SCR-Verfahren und Partikelabscheidung an Biomasseverbrennungsanlagen (BioFeuSe)”, grant number 03EI5434B.

Institutional Review Board Statement

Not applicable.

Informed Consent Statement

Not applicable.

Data Availability Statement

All relevant data presented in the article are stored according to institutional requirements and as such are not available online. However, all data used in this paper can be made available upon reasonable request to the authors.

Conflicts of Interest

The authors declare no conflict of interest.

References

  1. Hasan, M.H.; Mahlia, T.M.I.; Mofijur, M.; Rizwanul Fattah, I.M.; Handayani, F.; Ong, H.C.; Silitonga, A.S. A Comprehensive Review on the Recent Development of Ammonia as a Renewable Energy Carrier. Energies 2021, 14, 3732. [Google Scholar] [CrossRef]
  2. Giddey, S.; Badwal, S.P.S.; Munnings, C.; Dolan, M. Ammonia as a Renewable Energy Transportation Media. ACS Sustain. Chem. Eng. 2017, 5, 10231–10239. [Google Scholar] [CrossRef]
  3. Alemu, M.A.; Ilbas, M. Direct ammonia fueled solid oxide fuel cells: A comprehensive review on challenges, opportunities and future outlooks. Int. J. Energy Technol. 2020, 2, 70–91. [Google Scholar] [CrossRef]
  4. Forzatti, P. Present status and perspectives in de-NOx SCR catalysis. Appl. Catal. A Gen. 2001, 222, 221–236. [Google Scholar] [CrossRef]
  5. Schar, C.M.; Onder, C.H.; Geering, H.P. Control of an SCR catalytic converter system for a mobile heavy-duty application. IEEE Trans. Control Syst. Technol. 2006, 14, 641–653. [Google Scholar] [CrossRef]
  6. Kröcher, O. Selective Catalytic Reduction of NOx. Catalysts 2018, 8, 459. [Google Scholar] [CrossRef] [Green Version]
  7. Chatterjee, B.; Bandyopadhyay, A. Development of Zinc Oxide Sensors for Detecting Ammonia Gas in the Ambient Air: A Critical Short Review. Environ. Qual. Manag. 2016, 26, 89–105. [Google Scholar] [CrossRef]
  8. Müller, V.; Pieta, H.; Schaub, J.; Ehrly, M.; Körfer, T. On-Board Monitoring to meet upcoming EU-7 emission standards—Squaring the circle between effectiveness and robust realization. Transp. Eng. 2022, 10, 100138. [Google Scholar] [CrossRef]
  9. Boger, T.; Rose, D.; He, S.; Joshi, A. Developments for future EU7 regulations and the path to zero impact emissions—A catalyst substrate and filter supplier’s perspective. Transp. Eng. 2022, 10, 100129. [Google Scholar] [CrossRef]
  10. Aarya, S.; Kumar, Y.; Chahota, R.K. Recent Advances in Materials, Parameters, Performance and Technology in Ammonia Sensors: A Review. J. Inorg. Organomet. Polym. Mater. 2020, 30, 269–290. [Google Scholar] [CrossRef]
  11. Nelles, M.; Deprie, K.; Jalalipour, H. The role of biogenic wastes and residues in a climate-neutral society: Carbon source, bioenergy and negative emissions. Waste Manag. Res. 2023, 41, 741–743. [Google Scholar] [CrossRef]
  12. Lauer, M.; Dotzauer, M.; Millinger, M.; Oehmichen, K.; Jordan, M.; Kalcher, J.; Majer, S.; Thraen, D. The Crucial Role of Bioenergy in a Climate-Neutral Energy System in Germany. Chem. Eng. Technol. 2023, 46, 501–510. [Google Scholar] [CrossRef]
  13. Vassilev, S.V.; Baxter, D.; Andersen, L.K.; Vassileva, C.G. An overview of the chemical composition of biomass. Fuel 2010, 89, 913–933. [Google Scholar] [CrossRef]
  14. Williams, A.; Jones, J.M.; Ma, L.; Pourkashanian, M. Pollutants from the combustion of solid biomass fuels. Prog. Energy Combust. Sci. 2012, 38, 113–137. [Google Scholar] [CrossRef]
  15. Tomlin, A.S. Air Quality and Climate Impacts of Biomass Use as an Energy Source: A Review. Energy Fuels 2021, 35, 14213–14240. [Google Scholar] [CrossRef]
  16. König, M.; Eisinger, K.; Hartmann, I.; Müller, M. Combined removal of particulate matter and nitrogen oxides from the exhaust gas of small-scale biomass combustion. Biomass Convers. Biorefinery 2019, 9, 201–212. [Google Scholar] [CrossRef]
  17. Zhu, M.; Lai, J.-K.; Tumuluri, U.; Ford, M.E.; Wu, Z.; Wachs, I.E. Reaction Pathways and Kinetics for Selective Catalytic Reduction (SCR) of Acidic NOx Emissions from Power Plants with NH3. ACS Catal. 2017, 7, 8358–8361. [Google Scholar] [CrossRef]
  18. Guan, B.; Zhan, R.; Lin, H.; Huang, Z. Review of state of the art technologies of selective catalytic reduction of NOx from diesel engine exhaust. Appl. Therm. Eng. 2014, 66, 395–414. [Google Scholar] [CrossRef]
  19. Hofmann, L.; Rusch, K.; Fischer, S.; Lemire, B. Onboard Emissions Monitoring on a HD Truck with an SCR System Using NOx Sensors; SAE International: Pittsburgh, PA, USA, 2004; Volume 113, pp. 559–572. [Google Scholar] [CrossRef]
  20. Timmer, B.; Olthuis, W.; van den Berg, A. Ammonia sensors and their applications—A review. Sens. Actuators B Chem. 2005, 107, 666–677. [Google Scholar] [CrossRef]
  21. Malins, C.; Doyle, A.; MacCraith, B.D.; Kvasnik, F.; Landl, M.; Simon, P.; Kalvoda, L.; Lukas, R.; Pufler, K.; Babusík, I. Personal ammonia sensor for industrial environments. J. Environ. Monit. 1999, 1, 417–422. [Google Scholar] [CrossRef]
  22. Karunagaran, B.; Uthirakumar, P.; Chung, S.J.; Velumani, S.; Suh, E.-K. TiO2 thin film gas sensor for monitoring ammonia. Mater. Charact. 2007, 58, 680–684. [Google Scholar] [CrossRef]
  23. Wang, Y.-D.; Wu, X.-H.; Su, Q.; Li, Y.-F.; Zhou, Z.-L. Ammonia-sensing characteristics of Pt and SiO2 doped SnO2 materials. Solid-State Electron. 2001, 45, 347–350. [Google Scholar] [CrossRef]
  24. Pijolat, C.; Pupier, C.; Sauvan, M.; Tournier, G.; Lalauze, R. Gas detection for automotive pollution control. Sens. Actuators B Chem. 1999, 59, 195–202. [Google Scholar] [CrossRef]
  25. Bannov, A.G.; Popov, M.V.; Brester, A.E.; Kurmashov, P.B. Recent Advances in Ammonia Gas Sensors Based on Carbon Nanomaterials. Micromachines 2021, 12, 186. [Google Scholar] [CrossRef]
  26. Tang, Q.B.; Guo, Y.J.; Tang, Y.L.; Long, G.D.; Wang, J.L.; Li, D.J.; Zu, X.T.; Ma, J.Y.; Wang, L.; Torun, H.; et al. Highly sensitive and selective Love mode surface acoustic wave ammonia sensor based on graphene oxides operated at room temperature. J. Mater. Sci. 2019, 54, 11925–11935. [Google Scholar] [CrossRef]
  27. Kwak, D.; Lei, Y.; Maric, R. Ammonia gas sensors: A comprehensive review. Talanta 2019, 204, 713–730. [Google Scholar] [CrossRef]
  28. Ghosh, A.; Zhang, C.; Shi, S.Q.; Zhang, H. High-Temperature Gas Sensors for Harsh Environment Applications: A Review. Clean—Soil Air Water 2019, 47, 1800491. [Google Scholar] [CrossRef]
  29. Rodríguez-González, L.; Rodríguez-Castellon, E.; Jimenez-Lopez, A.; Simon, U. Correlation of TPD and impedance measurements on the desorption of NH3 from zeolite H-ZSM-5. Solid State Ion. 2008, 179, 1968–1973. [Google Scholar] [CrossRef]
  30. Schönauer, D.; Nieder, T.; Wiesner, K.; Fleischer, M.; Moos, R. Investigation of the electrode effects in mixed potential type ammonia exhaust gas sensors. Solid State Ion. 2011, 192, 38–41. [Google Scholar] [CrossRef]
  31. Zhang, W.; Qi, S.; Pantaleo, G.; Liotta, L.F. WO3–V2O5 Active Oxides for NOx SCR by NH3: Preparation Methods, Catalysts’ Composition, and Deactivation Mechanism—A Review. Catalysts 2019, 9, 527. [Google Scholar] [CrossRef] [Green Version]
  32. Wang, C.; Li, X.; Yuan, Y.; Wang, B.; Huang, J.; Xia, F.; Zhang, H.; Xiao, J. Effects of sintering temperature on sensing properties of V2O5-WO3-TiO2 electrode for potentiometric ammonia sensor. Sens. Actuators B Chem. 2017, 241, 268–275. [Google Scholar] [CrossRef]
  33. Miura, N.; Sato, T.; Anggraini, S.A.; Ikeda, H.; Zhuiykov, S. A review of mixed-potential type zirconia-based gas sensors. Ionics 2014, 20, 901–925. [Google Scholar] [CrossRef] [Green Version]
  34. Da Wang, Y.; Yao, S.; Shost, M.; Yoo, J.-H.; Cabush, D.; Racine, D.; Cloudt, R.; Willems, F. Ammonia Sensor for Closed-Loop SCR Control. SAE Int. J. Passeng. Cars—Electron. Electr. Syst. 2009, 1, 323–333. [Google Scholar] [CrossRef] [Green Version]
  35. Franke, M.E.; Simon, U. Solvate-supported proton transport in zeolites. Chemphyschem 2004, 5, 465–472. [Google Scholar] [CrossRef]
  36. Moos, R.; Müller, R.; Plog, C.; Knezevic, A.; Leye, H.; Irion, E.; Braun, T.; Marquardt, K.-J.; Binder, K. Selective ammonia exhaust gas sensor for automotive applications. Sens. Actuators B Chem. 2002, 83, 181–189. [Google Scholar] [CrossRef]
  37. Simons, T.; Simon, U. Zeolites as nanoporous, gas-sensitive materials for in situ monitoring of DeNOx-SCR. Beilstein J. Nanotechnol. 2012, 3, 667–673. [Google Scholar] [CrossRef] [Green Version]
  38. Smit, B.; Maesen, T.L.M. Molecular simulations of zeolites: Adsorption, diffusion, and shape selectivity. Chem. Rev. 2008, 108, 4125–4184. [Google Scholar] [CrossRef]
  39. Ozin, G.A.; Kuperman, A.; Stein, A. Advanced Zeolite, Materials Science. Angew. Chem. Int. Ed. Engl. 1989, 28, 359–376. [Google Scholar] [CrossRef]
  40. Helfrecht, B.A.; Semino, R.; Pireddu, G.; Auerbach, S.M.; Ceriotti, M. A new kind of atlas of zeolite building blocks. J. Chem. Phys. 2019, 151, 154112. [Google Scholar] [CrossRef] [Green Version]
  41. Król, M. Natural vs. Synthetic Zeolites. Crystals 2020, 10, 622. [Google Scholar] [CrossRef]
  42. Bingre, R.; Louis, B.; Nguyen, P. An Overview on Zeolite Shaping Technology and Solutions to Overcome Diffusion Limitations. Catalysts 2018, 8, 163. [Google Scholar] [CrossRef] [Green Version]
  43. Devadas, M.; Kröcher, O.; Wokaun, A. Catalytic investigation of Fe-ZSM5 in the selective catalytic reduction of NOx with NH3. React. Kinet. Catal. Lett. 2005, 86, 347–354. [Google Scholar] [CrossRef]
  44. Xu, X.; Wang, J.; Long, Y. Zeolite-based Materials for Gas Sensors. Sensors 2006, 6, 1751–1764. [Google Scholar] [CrossRef] [Green Version]
  45. Sahner, K.; Hagen, G.; Schönauer, D.; Reis, S.; Moos, R. Zeolites—Versatile materials for gas sensors. Solid State Ion. 2008, 179, 2416–2423. [Google Scholar] [CrossRef]
  46. Kurzweil, P.; Maunz, W.; Plog, C. Impedance of zeolite-based gas sensors. Sens. Actuators B Chem. 1995, 25, 653–656. [Google Scholar] [CrossRef]
  47. Marr, I.; Reiss, S.; Hagen, G.; Moos, R. Planar zeolite film-based potentiometric gas sensors manufactured by a combined thick-film and electroplating technique. Sensors 2011, 11, 7736–7748. [Google Scholar] [CrossRef] [PubMed] [Green Version]
  48. Reiß, S.; Hagen, G.; Moos, R. Zeolite-based Impedimetric Gas Sensor Device in Low-cost Technology for Hydrocarbon Gas Detection. Sensors 2008, 8, 7904–7916. [Google Scholar] [CrossRef] [Green Version]
  49. Dietrich, M.; Rauch, D.; Simon, U.; Porch, A.; Moos, R. Ammonia storage studies on H-ZSM-5 zeolites by microwave cavity perturbation: Correlation of dielectric properties with ammonia storage. J. Sens. Sens. Syst. 2015, 4, 263–269. [Google Scholar] [CrossRef] [Green Version]
  50. Rauch, D.; Kubinski, D.; Cavataio, G.; Upadhyay, D.; Moos, R. Ammonia Loading Detection of Zeolite SCR Catalysts using a Radio Frequency based Method. SAE Int. J. Engines 2015, 8, 1126–1135. [Google Scholar] [CrossRef]
  51. Franke, M.E.; Simon, U.; Moos, R.; Knezevic, A.; Müller, R.; Plog, C. Development and working principle of an ammonia gas sensor based on a refined model for solvate supported proton transport in zeolites. Phys. Chem. Chem. Phys. 2003, 5, 5195–5198. [Google Scholar] [CrossRef]
  52. Yoo, Y.; Choi, B.-D. Readout Circuits for Capacitive Sensors. Micromachines 2021, 12, 960. [Google Scholar] [CrossRef]
  53. König, M.; Müller, M.; Hartmann, I. Emission reduction process for the energetic use of biogenic residues. IOP Conf. Ser. Earth Environ. Sci. 2021, 642, 012006. [Google Scholar] [CrossRef]
  54. Liu, H.; Qiu, G.; Shao, Y.; Riffat, S.B. Experimental investigation on flue gas emissions of a domestic biomass boiler under normal and idle combustion conditions. Int. J. Low-Carbon Technol. 2010, 5, 88–95. [Google Scholar] [CrossRef] [Green Version]
  55. Ritter, T.; Wiegärtner, S.; Hagen, G.; Moos, R. Simulation of a thermoelectric gas sensor that determines hydrocarbon concentrations in exhausts and the light-off temperature of catalyst materials. J. Sens. Sens. Syst. 2017, 6, 395–405. [Google Scholar] [CrossRef] [Green Version]
  56. Hagen, G.; Herrmann, J.; Zhang, X.; Kohler, H.; Hartmann, I.; Moos, R. Application of a Robust Thermoelectric Gas Sensor in Firewood Combustion Exhausts. Sensors 2023, 23, 2930. [Google Scholar] [CrossRef]
  57. Wiegärtner, S.; Hagen, G.; Kita, J.; Reitmeier, W.; Hien, M.; Grass, P.; Moos, R. Thermoelectric hydrocarbon sensor in thick-film technology for on-board-diagnostics of a diesel oxidation catalyst. Sens. Actuators B Chem. 2015, 214, 234–240. [Google Scholar] [CrossRef]
  58. Herrmann, J.; Hagen, G.; Kita, J.; Noack, F.; Bleicker, D.; Moos, R. Multi-gas sensor to detect simultaneously nitrogen oxides and oxygen. J. Sens. Sens. Syst. 2020, 9, 327–335. [Google Scholar] [CrossRef]
  59. Wöhrl, T.; Herrmann, J.; Kita, J.; Moos, R.; Hagen, G. Methods to investigate the temperature distribution of heated ceramic gas sensors for high-temperature applications. J. Sens. Sens. Syst. 2023, 12, 205–214. [Google Scholar] [CrossRef]
  60. Plog, C.; Maunz, W.; Kurzweil, P.; Obermeier, E.; Scheibe, C. Combustion gas sensitivity of zeolite layers on thin-film capacitors. Sens. Actuators B Chem. 1995, 25, 403–406. [Google Scholar] [CrossRef]
  61. Mamishev, A.; Sundara-Rajan, K.; Yang, F.; Du, Y.; Zahn, M. Interdigital sensors and transducers. Proc. IEEE 2004, 92, 808–845. [Google Scholar] [CrossRef] [Green Version]
  62. Franke, M.E.; Simon, U. Characteristics of Proton Hopping in Zeolite H-ZSM5. Phys. Status Solidi (B) 2000, 218, 287–290. [Google Scholar] [CrossRef]
  63. Simon, U.; Sanders, D.; Jockel, J.; Heppel, C.; Brinz, T. Design strategies for multielectrode arrays applicable for high-throughput impedance spectroscopy on novel gas sensor materials. J. Comb. Chem. 2002, 4, 511–515. [Google Scholar] [CrossRef]
  64. Sharma, R.K.; Chan, P.C.; Tang, Z.; Yan, G.; Hsing, I.-M.; Sin, J.K. Investigation of stability and reliability of tin oxide thin-film for integrated micro-machined gas sensor devices. Sens. Actuators B Chem. 2001, 81, 9–16. [Google Scholar] [CrossRef]
  65. Liang, T.-X.; Sun, W.Z.; Wang, L.-D.; Wang, Y.H.; Li, H.-D. Effect of surface energies on screen printing resolution. IEEE Trans. Compon. Packag. Manuf. Technol. Part B 1996, 19, 423–426. [Google Scholar] [CrossRef]
  66. Bancroft, R.C. A Survey of Laser Trimming. Microelectron. Int. 1984, 2, 18–24. [Google Scholar] [CrossRef]
  67. Wagner, R.H. Functional Laser Trimming: An Overview. Laser Process. Semicond. Hybrids 1986, 611, 8–18. [Google Scholar] [CrossRef]
  68. Vankoningsveld, H.; Jansen, J.; Vanbekkum, H. The monoclinic framework structure of zeolite H-ZSM-5. Comparison with the orthorhombic framework of as-synthesized ZSM-5. Zeolites 1990, 10, 235–242. [Google Scholar] [CrossRef]
  69. Kokotailo, G.T.; Lawton, S.L.; Olson, D.H.; Meier, W.M. Structure of synthetic zeolite ZSM-5. Nature 1978, 272, 437–438. [Google Scholar] [CrossRef]
  70. Chen, P.; Schönebaum, S.; Simons, T.; Rauch, D.; Dietrich, M.; Moos, R.; Simon, U. Correlating the Integral Sensing Properties of Zeolites with Molecular Processes by Combining Broadband Impedance and DRIFT Spectroscopy—A New Approach for Bridging the Scales. Sensors 2015, 15, 28915–28941. [Google Scholar] [CrossRef] [Green Version]
  71. Di Iorio, J.R.; Bates, S.A.; Verma, A.A.; Delgass, W.N.; Ribeiro, F.H.; Miller, J.T.; Gounder, R. The Dynamic Nature of Brønsted Acid Sites in Cu–Zeolites During NOx Selective Catalytic Reduction: Quantification by Gas-Phase Ammonia Titration. Top. Catal. 2015, 58, 424–434. [Google Scholar] [CrossRef]
  72. Kustov, A.L.; Egeblad, K.; Kustova, M.; Hansen, T.W.; Christensen, C.H. Mesoporous Fe-containing ZSM-5 zeolite single crystal catalysts for selective catalytic reduction of nitric oxide by ammonia. Top. Catal. 2007, 45, 159–163. [Google Scholar] [CrossRef] [Green Version]
  73. Jiang, T.; Göltl, F.; Bulo, R.E.; Sautet, P. Effect of Temperature on the Adsorption of Short Alkanes in the Zeolite SSZ-13—Adapting Adsorption Isotherms to Microporous Materials. ACS Catal. 2014, 4, 2351–2358. [Google Scholar] [CrossRef]
  74. Schmohl, A.; Miklos, A.; Hess, P. Effects of adsorption-desorption processes on the response time and accuracy of photoacoustic detection of ammonia. Appl. Opt. 2001, 40, 2571–2578. [Google Scholar] [CrossRef]
  75. Vaittinen, O.; Metsälä, M.; Persijn, S.; Vainio, M.; Halonen, L. Adsorption of ammonia on treated stainless steel and polymer surfaces. Appl. Phys. B 2014, 115, 185–196. [Google Scholar] [CrossRef]
  76. Hagen, G.; Schulz, A.; Knörr, M.; Moos, R. Four-Wire Impedance Spectroscopy on Planar Zeolite/Chromium Oxide Based Hydrocarbon Gas Sensors. Sensors 2007, 7, 2681–2692. [Google Scholar] [CrossRef] [Green Version]
  77. Chen, P.; Rizzotto, V.; Xie, K.; Simon, U. Tracking mobile active sites and intermediates in NH3-SCR over zeolite catalysts by impedance-based in situ spectroscopy. React. Chem. Eng. 2019, 4, 986–994. [Google Scholar] [CrossRef]
  78. Franke, M.E.; Sierka, M.; Simon, U.; Sauer, J. Translational proton motion in zeolite H-ZSM-5. Energy barriers and jump rates from DFT calculations. Phys. Chem. Chem. Phys. 2002, 4, 5207–5216. [Google Scholar] [CrossRef]
  79. Brett, C.M.A. Electrochemical Impedance Spectroscopy in the Characterisation and Application of Modified Electrodes for Electrochemical Sensors and Biosensors. Molecules 2022, 27, 1497. [Google Scholar] [CrossRef]
  80. Vermesse, J.; Vidal, D.; Malbrunot, P. Gas Adsorption on Zeolites at High Pressure. Langmuir 1996, 12, 4190–4196. [Google Scholar] [CrossRef]
  81. Mofarahi, M.; Gholipour, F. Gas adsorption separation of CO2/CH4 system using zeolite 5A. Microporous Mesoporous Mater. 2014, 200, 1–10. [Google Scholar] [CrossRef]
  82. Hayhurst, D.T. Gas adsorption by some natural zeolites. Chem. Eng. Commun. 1980, 4, 729–735. [Google Scholar] [CrossRef]
  83. Ohlin, L.; Bazin, P.; Thibault-Starzyk, F.; Hedlund, J.; Grahn, M. Adsorption of CO2, CH4, and H2O in Zeolite ZSM-5 Studied Using In Situ ATR-FTIR Spectroscopy. J. Phys. Chem. C 2013, 117, 16972–16982. [Google Scholar] [CrossRef]
  84. Kohler, H.; Ojha, B.; Illyaskutty, N.; Hartmann, I.; Thiel, C.; Eisinger, K.; Dambacher, M. In situ high-temperature gas sensors: Continuous monitoring of the combustion quality of different wood combustion systems and optimization of combustion process. J. Sens. Sens. Syst. 2018, 7, 161–167. [Google Scholar] [CrossRef] [Green Version]
  85. Zhang, X.; Ojha, B.; Bichlmaier, H.; Hartmann, I.; Kohler, H. Extensive Gaseous Emissions Reduction of Firewood-Fueled Low Power Fireplaces by a Gas Sensor Based Advanced Combustion Airflow Control System and Catalytic Post-Oxidation. Sensors 2023, 23, 4679. [Google Scholar] [CrossRef] [PubMed]
  86. Hunger, B.; Heuchel, M.; Matysik, S.; Beck, K.; Einicke, W.D. Adsorption of water on ZSM-5 zeolites. Thermochim. Acta 1995, 269–270, 599–611. [Google Scholar] [CrossRef]
  87. Mumpton, F.A. La roca magica: Uses of natural zeolites in agriculture and industry. Proc. Natl. Acad. Sci. USA 1999, 96, 3463–3470. [Google Scholar] [CrossRef]
  88. Rodríguez-González, L.; Hermes, F.; Bertmer, M.; Rodríguez-Castellón, E.; Jiménez-López, A.; Simon, U. The acid properties of H-ZSM-5 as studied by NH3-TPD and 27Al-MAS-NMR spectroscopy. Appl. Catal. A Gen. 2007, 328, 174–182. [Google Scholar] [CrossRef]
  89. Kohse-Höinghaus, K. Combustion, Chemistry, and Carbon Neutrality. Chem. Rev. 2023, 123, 5139–5219. [Google Scholar] [CrossRef]
  90. Simon, I.; Bârsan, N.; Bauer, M.; Weimar, U. Micromachined metal oxide gas sensors: Opportunities to improve sensor performance. Sens. Actuators B Chem. 2001, 73, 1–26. [Google Scholar] [CrossRef]
Figure 1. Schematic structure of the planar ammonia sensor on a ceramic substrate with heater, IDE structure, and zeolite film.
Chemosensors 11 00413 g001
Figure 2. Front side of the sensor after different processing steps: (a) Gold solid surface after screen printing step; (b) IDE structure (20/20 μm) after laser patterning; (c) Completed sensor with printed zeolite film (H-ZSM5, modulus 27); (d) Micrograph of the porous zeolite film.
Chemosensors 11 00413 g002
Figure 3. Schematic drawing of the sensor test bench in the laboratory for sensor characterization with downstream FTIR spectrometer.
Chemosensors 11 00413 g003
Figure 4. Nyquist plot of a sensor (IDE: 20/20 μm) at different ammonia concentrations (0–240 ppm) at a sensor temperature of 440 °C. Base gas concentrations: 5 vol.% H2O, 3% CO2, 10% O2 in N2.
Chemosensors 11 00413 g004
Figure 5. (a) Sensor capacitance calculated on the basis of the impedance (using Equation (3) and f = 700 kHz) during stepwise increasing ammonia concentrations (0–240 ppm); (b) dosing signal from the MFCs in the sensor test bench (black) and NH3 concentration as measured using the FTIR spectrometer (green). Sensor operating temperature TH = 440 °C. Base gas concentrations: 2 vol.% H2O, 3% CO2, 10% O2 in N2.
Chemosensors 11 00413 g005
Figure 6. Sensor calibration curve calculated on the basis of the steady state impedance values (TH = 440 °C, f = 700 kHz) underdosing of increasing ammonia concentrations (0–240 ppm), measured using the FTIR spectrometer.
Chemosensors 11 00413 g006
Figure 7. Comparison of the time courses of the determined ammonia concentration based on the sensor calibration from Figure 6 and the concentration measured by FTIR spectroscopy.
Chemosensors 11 00413 g007
Figure 8. (a) Time curve for the influence of the sensor temperature on the capacitance at 400, 440, and 480 °C; (b) Change in capacitance relative to the value at 0 ppm NH3 in dependency of the ammonia concentration for different sensor temperatures. Base gas concentrations: 2 vol.% H2O, 3% CO2, 10% O2 in N2.
Chemosensors 11 00413 g008
Figure 9. Measurement series to investigate the influence of water (1–10 vol.% H2O) on the baseline and for different ammonia concentrations 0–240 ppm) at TH = 440 °C. Base gas concentrations: 3% CO2, 10% O2 in N2.
Chemosensors 11 00413 g009
Figure 10. Measurement series to investigate the influence of the oxygen concentration in the exhaust gas (4–18%) at TH = 440 °C. Base gas concentrations: 5 vol.% H2O, 3% CO2 in N2.
Chemosensors 11 00413 g010
Figure 11. Comparison of concentrations measured by FTIR spectrometer and sensor at TH = 440 °C. Base gas concentrations: 3% CO2 in N2.
Chemosensors 11 00413 g011
Disclaimer/Publisher’s Note: The statements, opinions and data contained in all publications are solely those of the individual author(s) and contributor(s) and not of MDPI and/or the editor(s). MDPI and/or the editor(s) disclaim responsibility for any injury to people or property resulting from any ideas, methods, instructions or products referred to in the content.

