Article

Ionophore-Based Nanosphere Emulsion Incorporating Ion-Exchanger for Picogram Potentiometric Determination of HCV Drug (Daclatasvir) in Pharmaceutical Formulations and Body Fluids

by
Sayed S. Badawy
1,
Yomna M. Ahmed
1,
Fatehy M. Abdel-Haleem
1,2,* and
Ahmed Barhoum
3,4,*
1
Chemistry Department, Faculty of Science, Cairo University, Giza 12613, Egypt
2
Center for Hazards Mitigation, Environmental Studies, and Research (CHMESR), Cairo University, Giza 12613, Egypt
3
NanoStruc Research Group, Chemistry Department, Faculty of Science, Helwan University, Cairo 11795, Egypt
4
National Center for Sensor Research, School of Chemical Sciences, Dublin City University, D09 E432 Dublin, Ireland
*
Authors to whom correspondence should be addressed.
Chemosensors 2023, 11(7), 385; https://doi.org/10.3390/chemosensors11070385
Submission received: 20 June 2023 / Revised: 5 July 2023 / Accepted: 7 July 2023 / Published: 9 July 2023

Abstract

:
Daclatasvir dihydrochloride (DAC) is a drug used to treat hepatitis C virus (HCV) infection. In this study, an ionophore-based nanosphere emulsion was made of tricresyl phosphate (TCP) as the oil phase that is dispersed in water using Pluronic F-127 as an emulsifying agent. The nanospheres, consisting of the oil phase TCP, were doped with sodium tetraphenyl borate (Na-TPB) as a cation-exchanger and dibenzo-18-Crown-6 (DB18C6) as an ionophore (chelating agent) for DAC. The nanosphere emulsion was employed as a titrant in the complexometric titration of DAC (the analyte), and the DAC-selective electrode (ISE) was used as an indicator electrode to detect the endpoint. In the sample solution, DAC2+ ions diffused into the emulsified nanospheres, replaced Na+ from the ion exchanger (Na-TPB), and bonded to the ionophore (DB18C6). The DAC-selective nanospheres were successfully utilized to determine DAC in various samples, including standard solutions, commercial tablets (Daclavirocyrl®), serum, and urine. The method exhibited a linear dynamic range of 81.18 µg/mL to 81.18 pg/mL (10−4 to 10−10 M), achieved high recovery values ranging from 99.4% to 106.5%, and displayed excellent selectivity over similar interfering species (sofosbuvir and ledipasvir). The proposed method offers a new approach to determine the drug species (neutral, anionic, and cationic) without the requirement of water-soluble ligands or pH control.

1. Introduction

Complexometric potentiometric titration is a type of titration in which the analyte (anion or cation) is titrated with water-soluble ionophores (chelating agents) in the presence of working and reference electrodes to measure the potential difference during the titration process [1]. These ionophores form stable complexes with the analytes and the endpoint can be detected easily using a potentiometer [2]. The advantage of complexometric potentiometric titration over other types of titrations is the possibility of the precise determination of analytes (ions), with high selectivity over other interfering species [3]. To date, many researchers have aimed to develop new ionophores (chelating agents) to be used as modifiers for ion-selective electrodes (ISEs). The main drawback of applying these ligands as selective potentiometric titrants is that most of them are water-insoluble. The advantages of potentiometric titration include higher accuracy and precision compared to direct potentiometry [4]. During the titration, the potential break needs to be well defined, but the potential value itself is of a secondary importance and the response of the ISE need not be Nernstian or reproducible [5]. Furthermore, the titration system can be easily automated using modern technology; therefore, the analysis time can be reduced and better accuracy can be achieved [6]. However, the absence of a selective water-soluble chelating agent that can form stable complexes with the targeted analyte limits the widespread application of this valuable method.
The advantages of complexometric potentiometric titration and ISEs can be combined by a newly developed chelating system called “ionophore-based ion exchange nanosphere emulsion”, first introduced by Bakker et al. [2,7], for the determination of calcium and lead. In this system, ionophores are used for the selective binding of the analyte (ions), allowing their separation from other interfering species in the sample solution; this facilitates shifting the complexometric titration from the homogeneous aqueous phase to the heterogeneous (water/oil) phase, which extends the application of the technique to include water-insoluble/lipophilic species and allows the complexation of different analytes (ions) with different ionophores. The cleating agent (ionophore) in the nanospheres selectively binds the analyte ions, leading to changes in the optical, electrical, or mechanical properties of the nanospheres that can be detected and quantified. Recently, nanosphere emulsions containing a complexing agent and ion exchanger have been used in the extraction of target analytes (ions) in complex samples [2,7,8,9,10]. The incorporation of the ion exchanger in the nanosphere emulsion can increase the sensitivity of the emulsion as it allows its separation from other interfering species in the sample solution and facilitates the binding of the target analyte. Bakker’s titration reagent is a suspension of nanospheres consisting of a lipophilic core (plasticizer) stabilized by an amphiphilic polymer material such as Pluronic F-127 (F-127) [2,7]. However, the literature cites the limited application of this ionophore-based emulsion in potentiometric titration, which has been confined to the determination of metal ions (Pb2+ and Ca2+ [2]) and inorganic anions (ClO4, NO3 [7], and SCN [11]). To our knowledge, no reports in the literature quantify bulky organic analytes using nanosphere-based potentiometric titration. Thus, we were prompted by the need to apply nanosphere emulsions for quantitative potentiometric titration of a lipophilic organic analyte to better understand the underlying mechanism, advantages, limitations, and applicability of this new generation of titration reagents.
Daclatasvir (C40H50N8O6, Figure 1) is not an antivirus but rather an antiviral medication used in the treatment of the chronic hepatitis C virus (HCV) and severe acute respiratory syndrome coronavirus 2 (SARS-CoV-2) infection [12]. It belongs to a class of drugs known as direct-acting antivirals (DAAs), which work by blocking the replication of the hepatitis C virus in the body [12]. The recommended dose of daclatasvir for HCV infection is usually one tablet (60 mg) taken once daily with or without food. The duration of treatment may vary depending on the patient’s virus genotype and medical history. Symptoms of overdose may include nausea, vomiting, abdominal pain, headache, dizziness, and fatigue [13]. Therefore, there is a strong need for the development of a simple, sensitive, selective, and cost-effective method for the determination of DAC in serum and urine for pharmacokinetics studies and in pharmaceutical formulations for active pharmaceutical ingredients (API) routine testing. Previously reported methods for the determination of DAC include spectroscopy [14], chromatography [15,16], and voltammetry [17,18,19]; these methods are expensive, need sample preparation, and exhibit a narrow linear concentration range.
This study aimed to develop nanospheres based on ionophores for the accurate determination of DAC in pharmaceutical formulations and biofluids using complexometric potentiometric titration. To achieve this, an emulsion of ionophore-based nanospheres was prepared by combining tricresyl phosphate (TCP) as the oil phase with an emulsifier (Pluronic F-127 surfactant) and dispersed it in water. Within the oil phase, sodium tetraphenyl borate was incorporated as a cation exchanger, and dibenzo-18-crown-6 served as a chelating agent. These nanospheres were then utilized as titrants in the complexometric titration process for DAC, with the DAC-selective electrode employed as an indicator electrode to determine the endpoint. During the titration, DAC2+ ions diffused into the nanospheres, displaced the Na+ ions of the ion exchanger (Na-TPB) and complexed with the ionophore (complexing agent, DB18C6). Overall, the emulsified nanospheres offered a large surface area for extracting DAC from the sample solution, thereby enhancing the sensitivity of the complexometric potentiometric titration. The presence of the cation exchanger (Na-TPB) facilitated the formation of a stable complex between DAC2+ and the ionophore (DB18C6) within the core of the emulsified nanospheres. The emulsified nanospheres were evaluated for the picogram determination of DAC in standard solutions, tablets (Daclavirocyrl®), serum, and urine, with high sensitivity and selectivity.

2. Experimental

2.1. Materials

Pure analytical grades of daclatasvir dihydrochloride (DAC.2HCl), sofosbuvir (SOF), and ledipasvir (LED) were provided by European Egyptian Pharmaceutical Industries (Alexandria, Egypt). The pharmaceutical formulation Daclavirocyrl® was purchased from a local pharmacy. Pluronic F-127 (F-127, 99%, Sigma-Aldrich, Munich, Germany), graphite powder (ACROS organics, Morris Plains, NJ, USA), dioctyl phthalate (DOP, 97.0% Sigma-Aldrich), tricresyl phosphate (TCP, 98.0% Sigma-Aldrich), dibenzo-18-crown-6 (DB18C6, 98.0% Sigma-Aldrich), sodium tetrakis (1-imidazolyl)borate (Na-TImB, 97%, Sigma-Aldrich, Munich, Germany), sodium tetraphenyl borate (Na-TPB, 99%, Alfa Aesar, Haverhill, MA, USA), tetrahydrofuran (THF, 95%, Carlo Erba Reagents, France), Orthophosphoric acid (H3PO4, 85%, Sigma-Aldrich), glacial acetic acid (CH3CO2H, Sigma-Aldrich, St. Louis, MI, USA), boric acid (H3BO3, ACS grade, MISR-Scientific Company), hydrochloric acid (HCl, 30%, El-Nasr Pharma. Chem. Co., Cairo, Egypt), and acetonitrile (CH3CN, 99.9% Fisher Chemical, Hampton, NH, USA) were used in this study without further purification. Figure 1 shows the chemical structure of Daclatasvir, dibenzo-18-Crown-6, sodium tetraphenylborate, and Pluronic F-127.

2.2. Method

Emulsified nanospheres contained 8.0 mg TCP (oil phase), 5.0 mg F-127 (surfactant), and 1.25 mg DB18C6 (ionophore). These components were dissolved in 2.0 mL THF (organic solvent). A 1.8 mL aliquot of this solution was spiked with a calculated volume of 10−2, 10−4, 10−6, or 10−8 M Na-TPB solution (cation-exchanger) prepared in THF to prepare the desired concentration of Na-TPB in the emulsified nanospheres (see Table 1). This cocktail was then injected into 6.0 mL distilled water (aqueous phase) and dispersed via vortexing at 1000 rpm speed for 10 min. The THF was removed through the blowing of compressed air for 30 min [20].
Potentiometric and pH measurements were performed with the Jenway pH-mV Model 3510 (UK), using a Metrohm Ag-AgCl as a reference electrode. A DAC-selective carbon paste electrode served as a working electrode, and it was prepared as described elsewhere [21] with a (w/w)% composition of 69.38%:29.38%:1%:0.25% of graphite:DOP:DB18C6:Na-TimB. High-resolution transmission electron microscopy was performed at HR-TEM (JEOL, JEM -2100, Tokyo, Japan). A few drops of the nanosphere emulsion were placed on a copper grid coated with carbon and left to dry at room temperature. The sample was stained with 1% phosphotungstic acid. Camera images were taken using a Samsung cell phone. A stock solution of DAC.2HCl (10−3 M) was prepared in Britton–Robinson buffer (BR) of pH 2.47. Lower concentrations down to 10−12 M were prepared via a simple dilution series. A total of 10−3 M stock solution of SOF and LED was prepared in the BR buffer for the selectivity studies. The concentration of DAC in the test solution was 10−6 M, and the concentration of the interfering substance was 2 × 10⁻⁶ M.
For detecting DAC in body fluids [22], serum and urine samples were taken from a healthy volunteer (corresponding author) on the same day of analysis and spiked with DAC.2HCl (pure drug) to prepare 0.01 mM DAC.2HCl. Next, 3 mL of DAC-serum or DAC-urine was mixed with 3 mL of acetonitrile for protein precipitation and centrifuged at 3000 rpm for 20 min [22]. The supernatant was carefully separated, and the acetonitrile was removed with compressed air. Each aliquot of these solutions (0.01 mM DAC) was diluted 10-fold with BR buffer before performing the nanosphere titration. For the application of the emulsion titration to 100-fold diluted biological fluids, no protein precipitation was carried out. For detecting DAC in its pharmaceutical formulation, ten tablets (Daclavirocyrl®) were weighed and ground, then a weight equivalent to one tablet was dissolved in an appropriate volume of BR buffer to produce the desired concentration (~ 0.81 µg/mL). The titration of the nanosphere emulsion was performed and the result obtained was compared with that of a previous HPLC method [23].

3. Results and Discussion

3.1. Formation of the Emulsified Nanospheres

Two emulsified nanosphere solutions with different compositions were prepared (see Table 1) and used in the titration of 10−6 M DAC (corresponding to 0.81 µg/mL), and the recovery values obtained are listed in Table 1. The two emulsified nanospheres were prepared using the precipitation method in which a THF cocktail containing TCP (oil phase), F-127 (surfactant), DB18C6 (cleating agent), and Na-TPB (cation exchanger) was injected into vortexing water. When the THF evaporates, the cocktail components self-assemble into nanospheres through van der Waals forces [24].
Pluronic F-127, a nonionic surfactant, has a molecular weight of approximately 12,500 Da. Its composition consists of poly(ethylene oxide)98–poly(propylene oxide)67–poly(ethylene oxide)98 (PEO98-PPO67-PEO98). Figure 1D illustrates that the hydrophilic segment of the surfactant, which is water-soluble, is composed of the PEO blocks, while the hydrophobic portion, which is insoluble in water, corresponds to the PPO block. In the study context, Pluronic F-127 was utilized to stabilize the oil phase (TCP) droplets and prevent their coalescence or separation from the aqueous phase [25]. In the nanosphere emulsion, the hydrophobic PPO block of Pluronic F-127 comes into contact with the oil phase (TCP), whereas the hydrophilic PEO blocks of the outer shell interact with the aqueous environment. This core–shell structure is responsible for the stabilization of the nanospheres and other encapsulated molecules (e.g., ionophore and cation exchanger). By adjusting the concentration of the oil phase (TCP), emulsifier (Pluronic F-127), and the solution’s temperature, it is possible to control the size of the nanospheres [26].
The TEM image (Figure 2A) depicts the nanospheres in the emulsion, displaying their spherical shape and a particle size distribution of 90 ± 25 nm. The narrow size distribution signifies the uniformity and homogeneity of the nanospheres. Moreover, the camera image captured after one week (Figure 2B) provides evidence of the suspension’s remarkable stability, which serves as a testament to the nanosphere emulsion’s high quality and reproducibility. This stability is essential for ensuring the accurate determination of DAC within the storage period of 7 to 9 days. Figure 2C–E shows the camera images of the nanosphere emulsion at different time intervals during storage. These images reveal that, after two weeks, the emulsion starts to show signs of agglomeration, which progressively intensifies over the course of one month. Consequently, the solution takes on a yellowish appearance, possibly due to the presence of TCP. This color change suggests that the nanospheres may be rupturing or bursting.

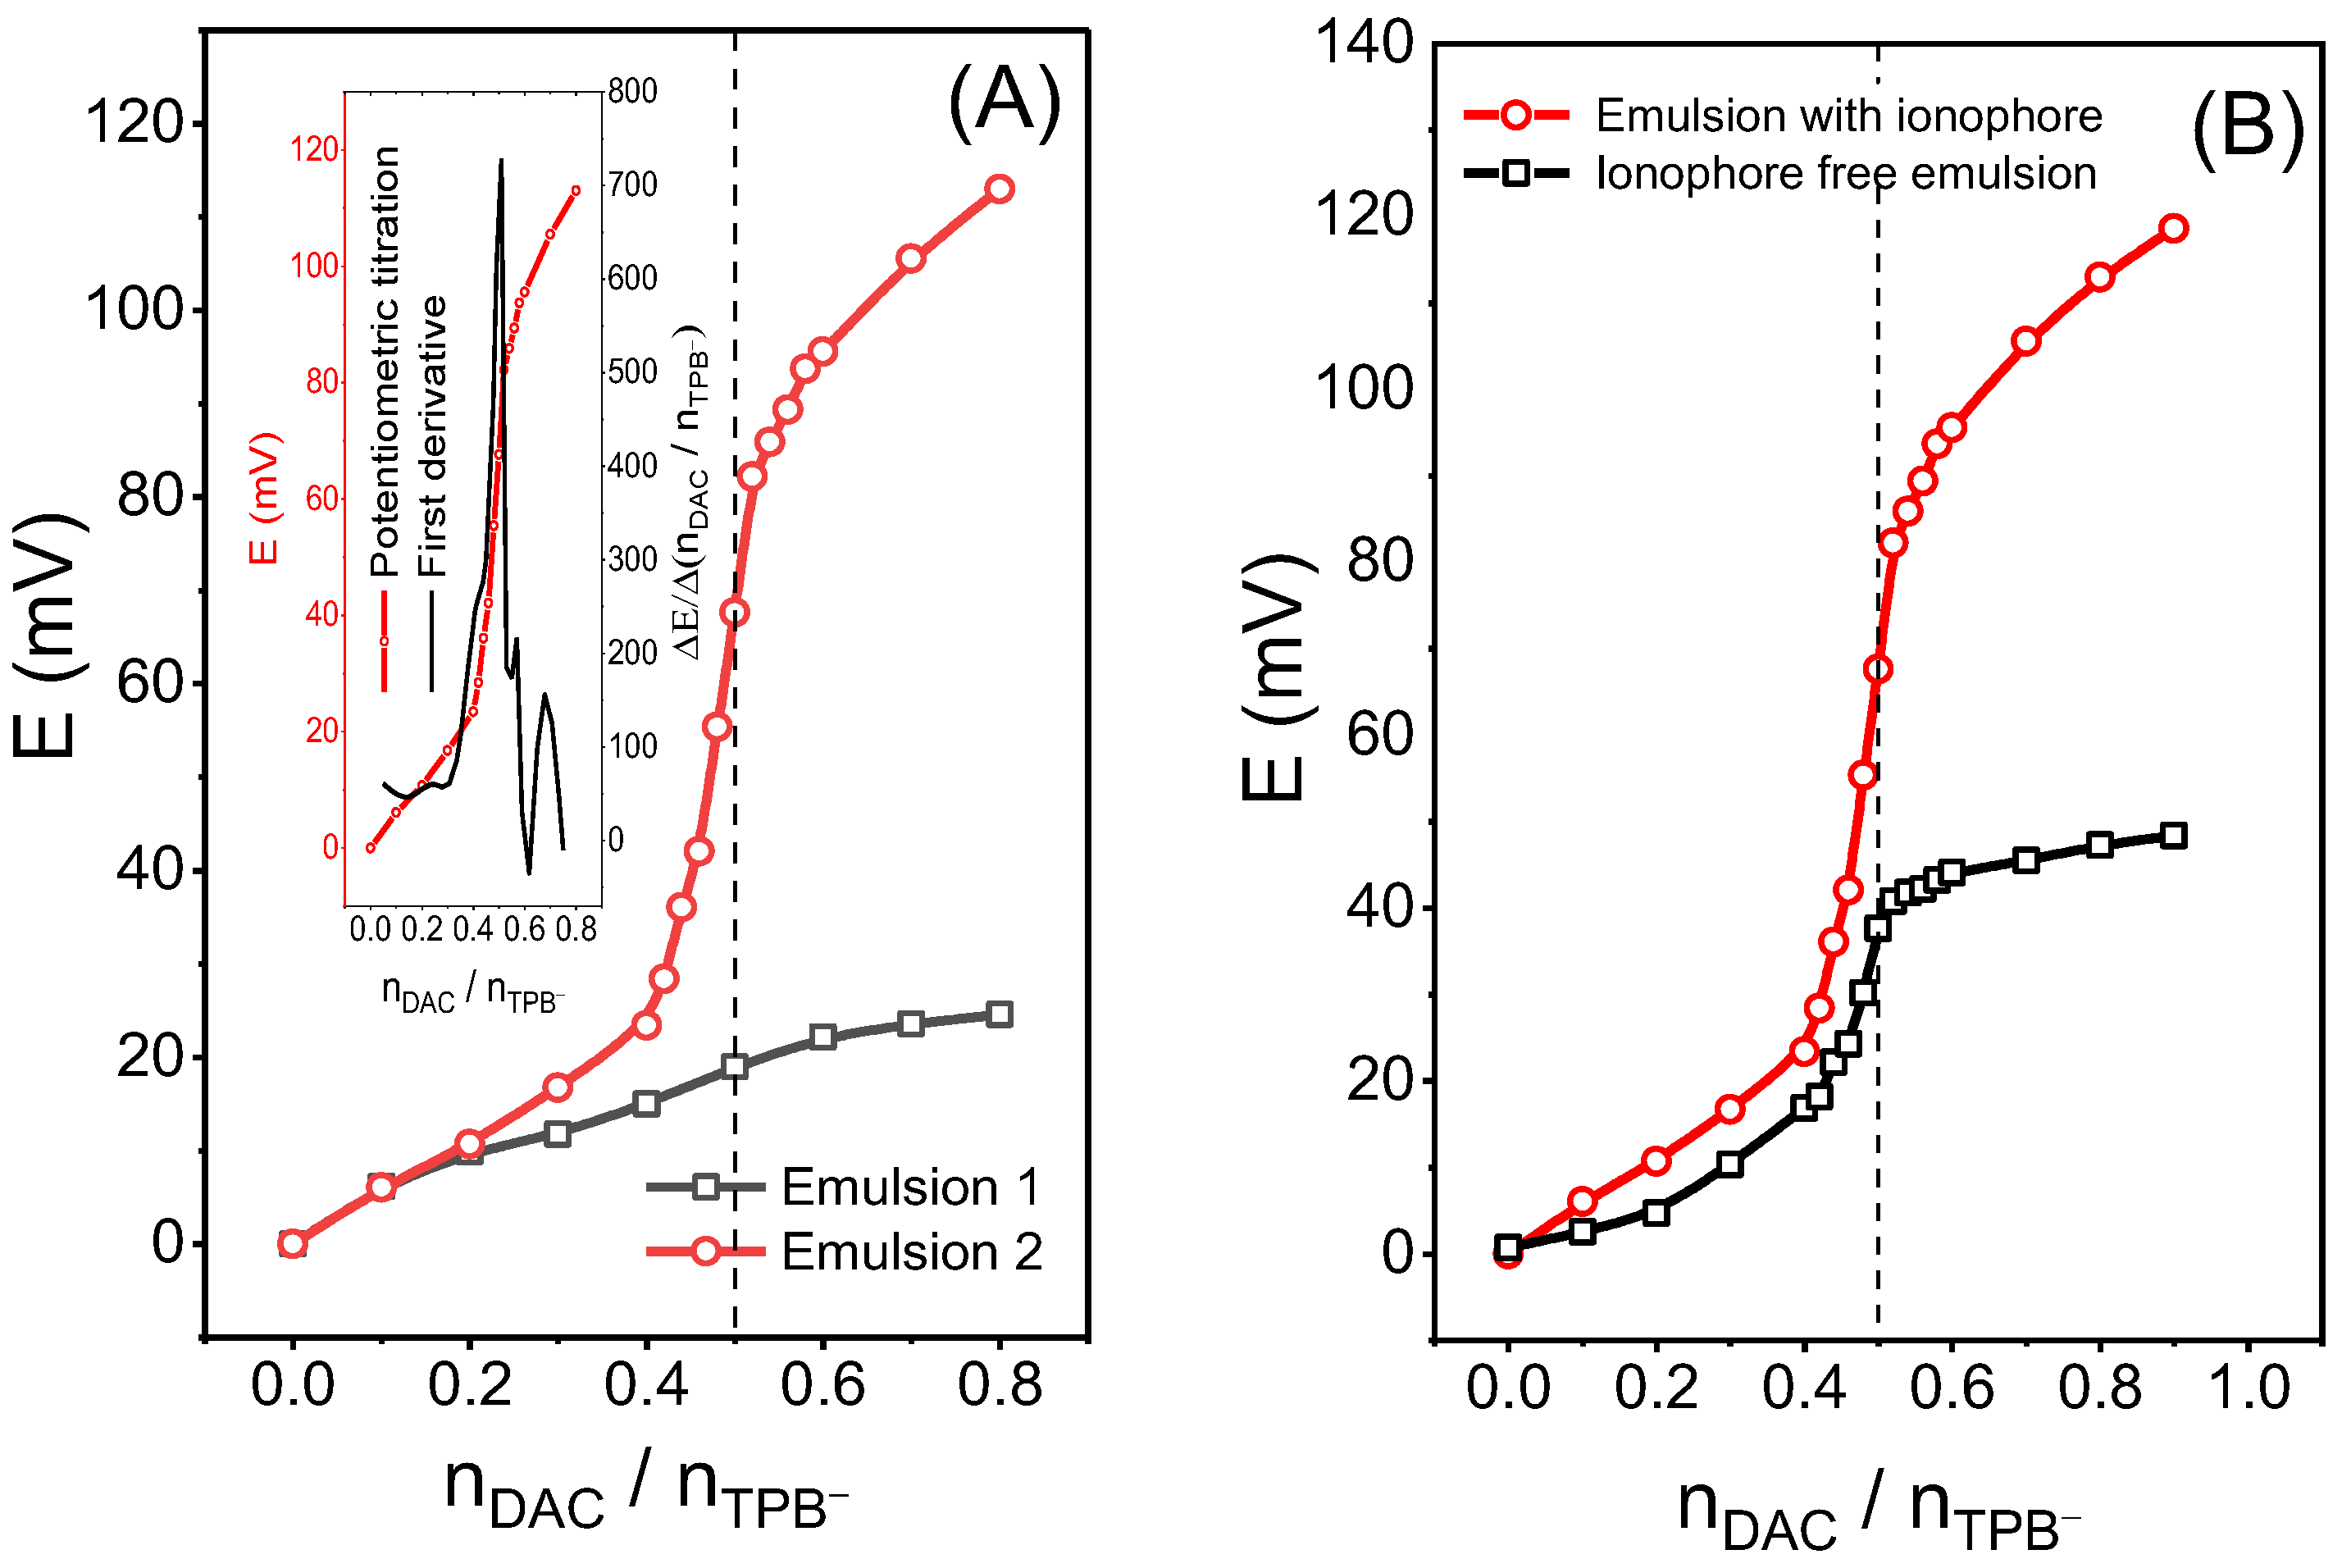
3.2. Complexometric Potentiometric Titration and Response Mechanism

A reverse titration system was employed in this work, wherein the titration cell initially contained a precise volume of the emulsion (titrant) with a known concentration of Na-TPB. Subsequently, increasing volumes of DAC (analyte) were added to the cell, and the cell potential was continuously monitored (Figure 3A). To detect the endpoint, a DAC-selective ISE was utilized as a working (indicator) electrode [21]. Before the endpoint, the nanospheres imposed a very low concentration of DAC2+ ions in the aqueous solution because it was exchanged with Na+ and entered the nanosphere’s core. Once the nanospheres were saturated with DAC2+ (i.e., 2 × number of moles of DAC2+ns = number of moles of TPBns, due to charge balance requirement), its concentration in the aqueous phase increased dramatically, causing the EMF response of the DAC-ISE to show a sudden increase (potential break), see Figure 3A. The relationship between the electromotive force (EMF) response of the ISE and the concentration of DAC in the aqueous solution can be described as EMF = E′ + s log [DAC2+]aq, where E′ is a constant, s is the electrode slope at 29.5 mV/decade, and [DAC2+]aq is the concentration of DAC in the aqueous solution.
As per Bakker et al. [2], in contrast to homogeneous titration, the stoichiometry of the ionophore–analyte complex holds little significance in terms of the amount of extractable analyte ions. Instead, the quantity of ion-exchanger present determines the amount of extractable analyte ions, as long as the ionophore is in excess molar concentration compared to the ion-exchanger. In our study, the emulsified nanosphere was doped with Na-TPB, where the counter-ions (Na+) of Na-TPB are easily displaced by DAC2+ ions in the sample solution. While the cation-exchanger (Na-TPB) governs the quantitative extraction of DAC2+ ions, the ionophore (DB18C6) forms a stable and selective complex with DAC2+ ions in a 1:1 stoichiometry, thereby controlling the selectivity of the nanospheres (refer to Figure 3). Equations (1) and (2) represent the DAC2+/Na+-exchange reaction and the expression for the exchange coefficient, respectively. These equations are analogous to the well-known extraction equilibria and extraction constants utilized in conventional titrations based on ion pair formation [27,28].
DAC2+(aq) + 2Na+(ns) ↔ DAC2+(ns) + 2Na+(aq)
K ex = K N a + D A C 2 +   = [ D A C 2 + ] n s   [ D A C 2 + ] a q     ( [ N a + ] a q [ N a + ] n s ) 2
where Kex or K N a + D A C 2 + is the exchange coefficient expressing the nanospheres’ preference for DAC2+ over Na+ (the higher the value of Kex, the more the nanospheres prefer daclatasvir ions); [DAC2+]ns and [DAC2+]aq are the concentrations of DAC2+ in the nanosphere and the aqueous phase, respectively; and [Na+]ns and [Na+]aq are the concentrations of Na+ in the nanosphere and the aqueous phase, respectively.
The determination of the endpoint was based on the first derivative curve of the plot between the potential of the solution and the mole ratio nDAC2+/nTPB (Figure 4A). Examining the figure, it is evident that the titration curves exhibited an indiscernible endpoint when utilizing Em 1. Conversely, when Em 2 was employed, a classical titration curve shape was observed. Em 2 displayed a distinct potential change near the equivalence point, making it the preferred emulsion for subsequent experiments. Em 2 with and without DB18C6 was examined in Figure 4B where the emulsion containing the ionophore exhibited a more distinct endpoint with a significantly larger potential break value, and the emulsion without the ionophore displayed a smaller potential breakage. This observation confirms the critical role of the ionophore and indicates that the mechanism is not solely reliant on ion exchange but also involves DAC–ionophore complexation. In the absence of an ionophore, the reduced response can be attributed to a lack of selectivity and, more importantly, a decrease in the driving force for the uptake of DAC2+ into the nanospheres, leading to a decrease in the K N a + D A C 2 + value. In simpler terms, DAC2+ remains in the aqueous phase for a longer duration using the ionophore-free emulsion compared to the ionophore-based emulsion. Consequently, the changes in analyte concentration at the equivalence point are not significant enough to generate a substantial EMF signal change.
In conventional titrations based on ion pair formation, the magnitude of the potential shift is determined by the solubility of the precipitated ion pair. A lower solubility product (Ksp) for the ion pair corresponds to a greater change in electromotive force at the endpoint. This occurs because the limited solubility of the ion pair enhances its lipophilicity, causing the ISE membrane solvent to exhibit higher selectivity and extractability for the ion pair. As a result, the overall potential of the sensor increases [27]. In contrast to titrations based on ion pair formation, DAC-selective titrations using nanospheres operate on the principle of exhaustive ion exchange, where, theoretically, all the analyte is consumed by the emulsion at the endpoint [29]. The concept of an exhaustive ion exchange was introduced by Bakker et al. for nano-optodes [29,30,31], and the same principle applies to the nanosphere titration employed in this study. However, the ion exchange process is reversible to some extent, and the effectiveness of the nanospheres relies on the exchange coefficient value. Specifically, a higher exchange coefficient ( K N a + D A C 2 + ) value results in the more exhaustive behavior of the nanosphere emulsion. Xie et al. indicated that a valid exhaustive mode is characterized by a negligible analyte concentration in the aqueous phase compared to the initial concentration [31]. This effect, combined with rapid exchange equilibria, leads to a significant change in the analyte’s concentration in the aqueous phase, resulting in a substantial response in the potential of the indicator electrode. Consequently, the titration reagent becomes more sensitive.
Mechanisms driving the uptake of DAC2+ by the nanospheres can be attributed to the assumption that DAC2+ attains greater stability within the core of the nanospheres. The matrix of the nanospheres primarily consists of the lipophilic phase (TCP), and due to the higher lipophilicity of DAC2+ compared to Na+, the nanospheres exhibit a relative preference for DAC2+ ions, according to the Hofmeister lipophilicity pattern. Additionally, the presence of the DAC–ionophore (DB18C6) enhances the stabilization of DAC2+ ions by forming a complex, thereby shifting the equilibrium in Equation 1 towards the right. Taking into account the formation of the DAC–ionophore complex, the overall equilibrium with the corresponding exchange coefficient is illustrated in Equations (3) and (4). To validate this assumption, a comparison was made between an ionophore-free nanosphere emulsion and nanospheres containing the ionophore, as shown in Figure 4B.
DAC 2 + ( aq ) + zL ( ns ) + 2 Na + ( ns )     [ DAC . L z ] 2 + ( ns ) + 2 Na + ( aq )
K ex = K N a + D A C 2 +   = [ D A C . L z 2 + ] n s   [ D A C 2 + ] a q   [ L ] n s z     ( [ N a + ] a q [ N a + ] n s ) 2
where L stands for DB18C6, forming a complex with DAC2+ with z stoichiometry. [DAC. L z 2 + ]ns and [L]ns are the concentrations of the DAC-DB18C6 complex and DB18C6 in the nanosphere phase, respectively.

Sensitivity of the Emulsion-Based Titration

To evaluate the method’s sensitivity, various concentrations of DAC2+ ranging from 10−2 to 10−12 M were prepared and titrated against nanosphere emulsions containing an equimolar concentration of Na-TPB to the analyte solution. The nanosphere emulsions demonstrated the accurate determination of DAC2+ within a concentration range of 10−4 to 10−10 M (equivalent to 81.18 µg/mL to 81.18 pg/mL), as shown in Table 2. The recoveries obtained ranged from 99.4% to 106.5%. It is worth noting that the recovery increased as the DAC concentration decreased. This phenomenon can be attributed to the fact that the titration takes place in a strongly acidic environment where the high concentration of H+ ions appear to compete with DAC for exchange with Na+ns. This interference becomes more noticeable at lower concentrations of DAC2+ compared to higher concentrations. The observed range of response, particularly at very low concentrations, serves as evidence of the strong binding between the ionophore and DAC2+ (analyte).
Reverse titration curves of DAC2+ in the concentration range of 10−4 M to 10−8 M are represented by solid lines shown in Figure 5A. It can be observed that the potential break of the titration curve increases as the DAC concentration decreases. Conversely, the dashed lines depict the titration curves for concentrations ranging from 10−9 M to 10−10 M, where an opposite trend is observed for the potential break values. To provide clearer representation, Figure 5B illustrates the relationship between the potential break and DAC2+ concentration. The influence of the nanospheres on cell potential is considered indirect as they operate by manipulating the aqueous concentration of DAC, which is proportional to the EMF response. The decrease in the potential break of the titration curve at high DAC2+ concentrations is likely a result of the nanosphere Donnan exclusion failure. This occurs due to the co-extraction of counter ions from the aqueous phase along with the primary ion into the nanospheres’ core, leading to a decrease in the nanospheres’ K N a + D A C 2 + value. A lower concentration of anions is expected to cause less interference, thereby causing the potential break to increase from 10−4 M to 10−8 M DAC.2HCl concentration. At concentrations below 10−8 M, the magnitude of the titration potential break is determined by the detection limit of the indicator electrode. As previously reported [21], the DAC-ISE used in this study has a detection limit of 3.2 × 10⁻⁹ M. Consequently, the potential break gradually decreases as the concentration of the analyte falls below this value.

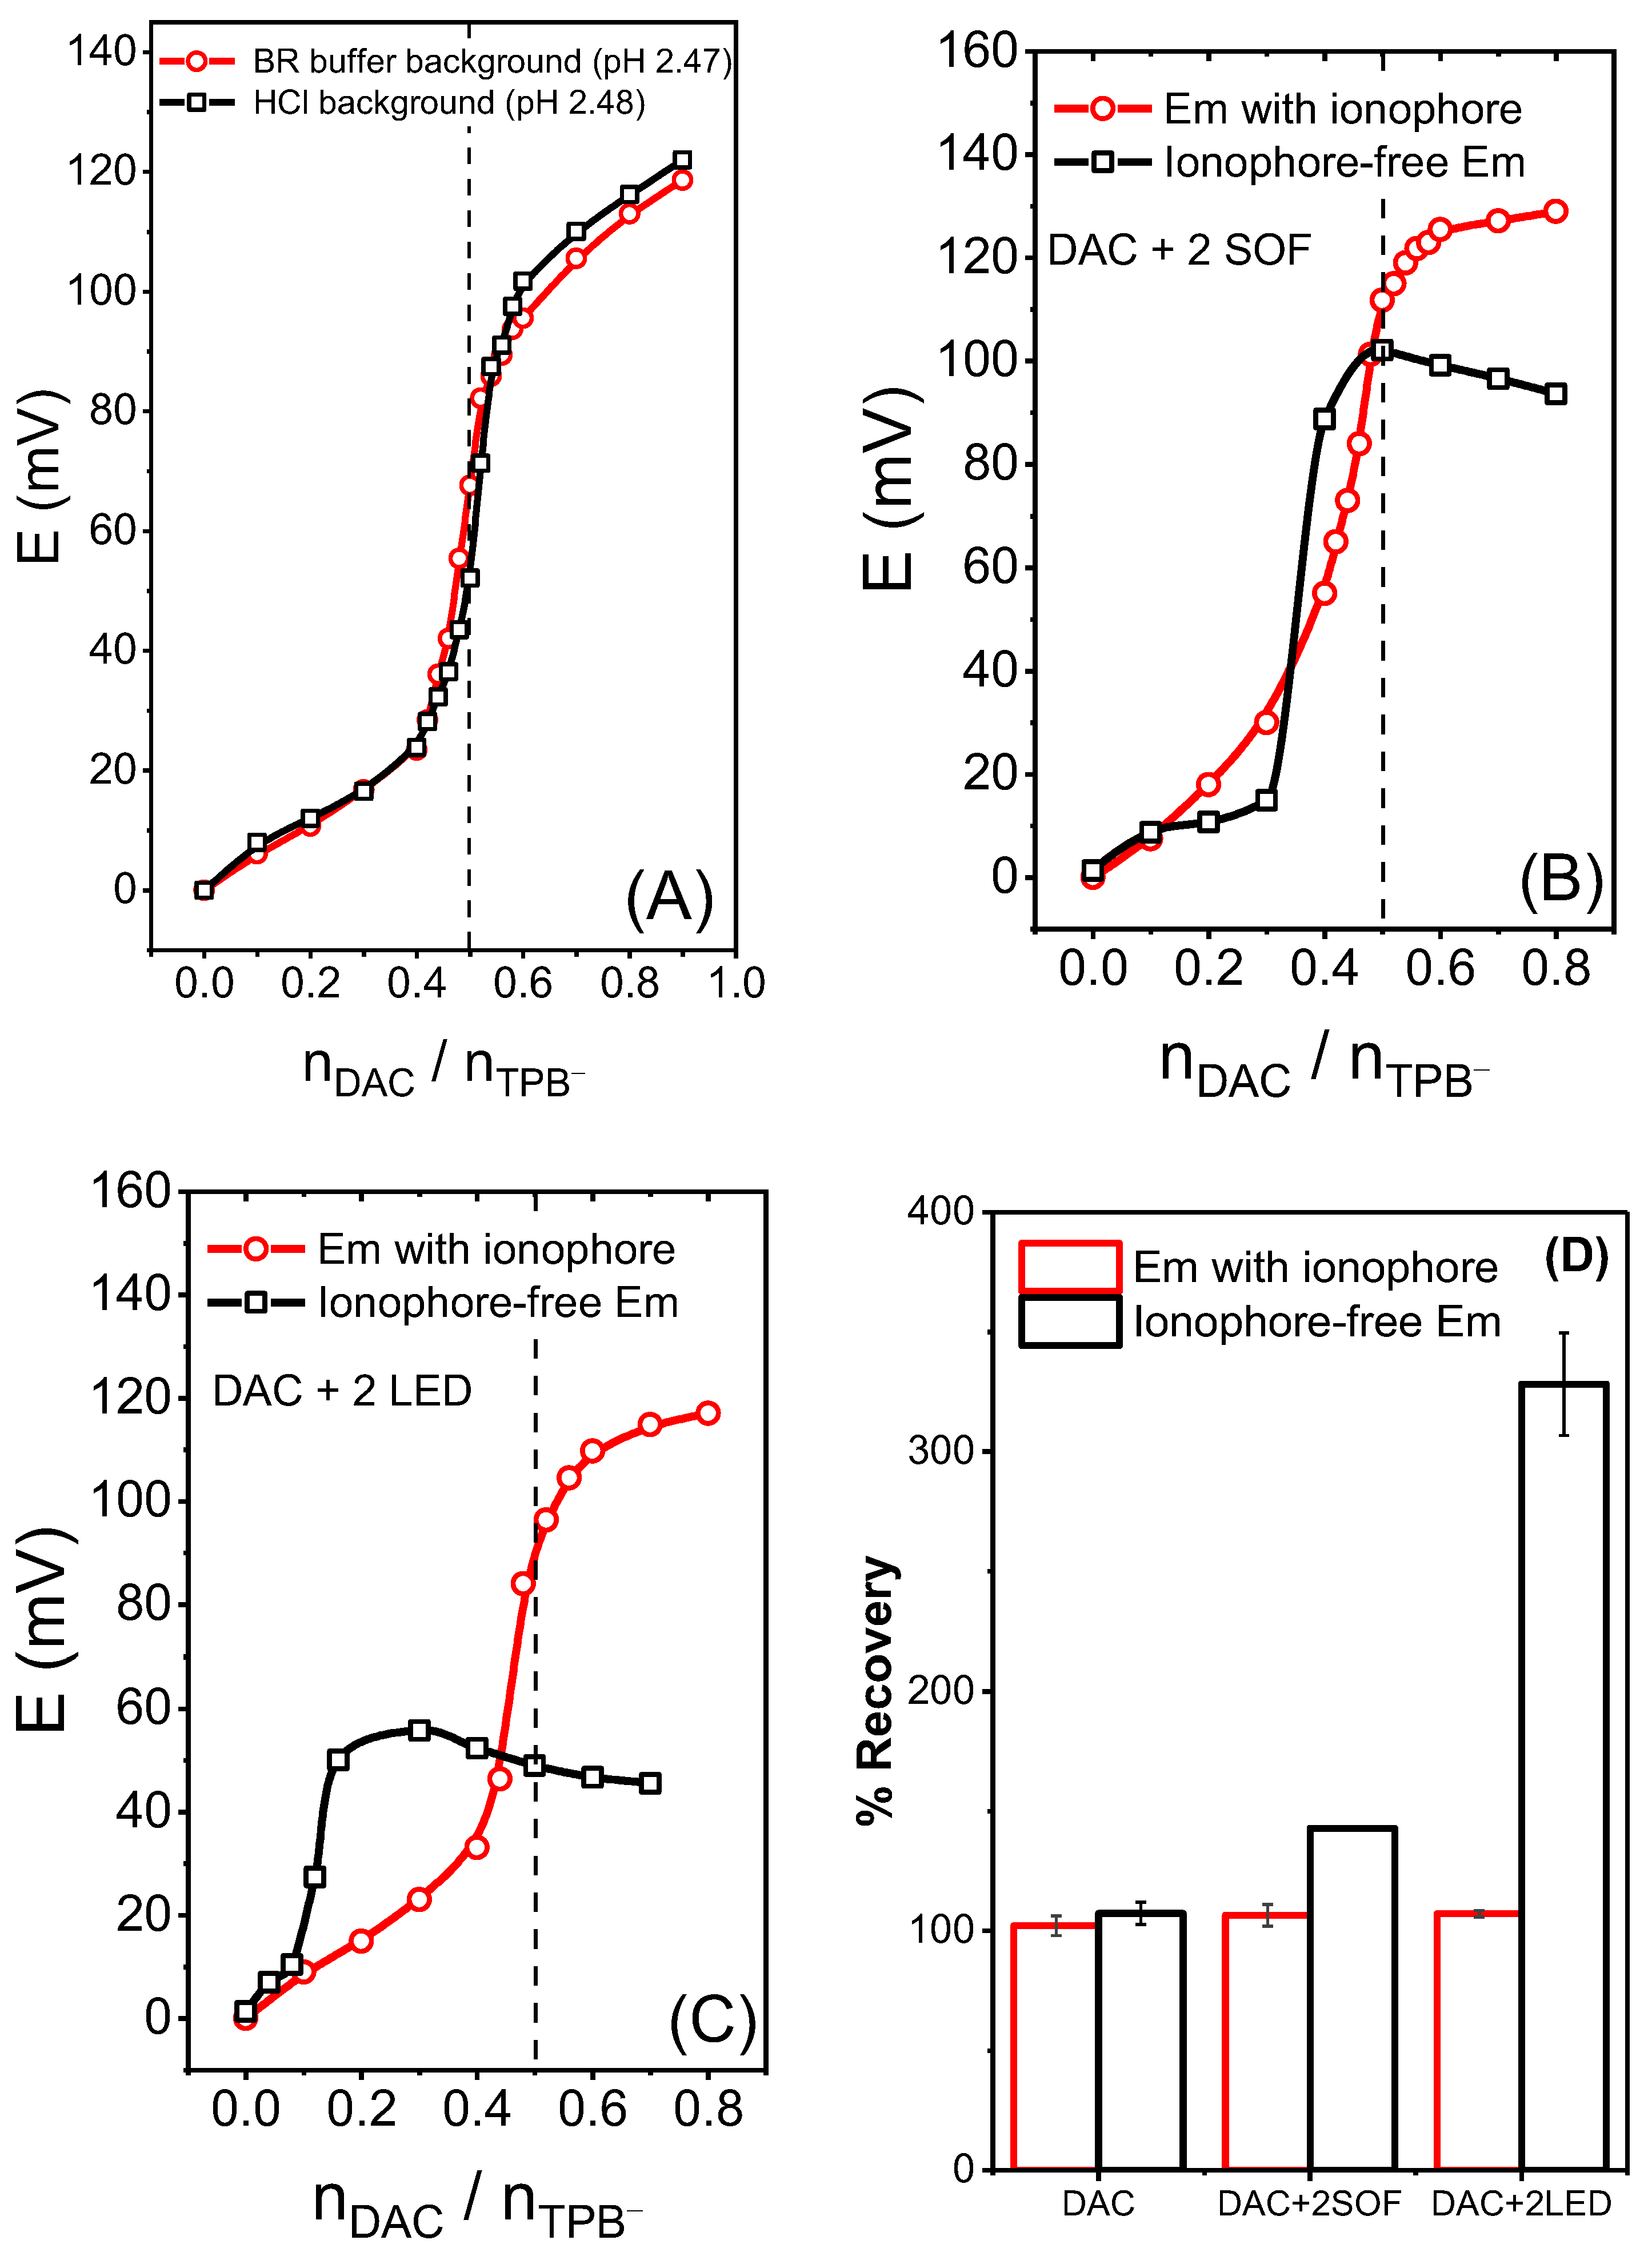
3.3. Influence of Background Solution

Ion-selective nanospheres reported in previous studies were found to be pH-independent as long as the sensing components did not contain protonatable groups. This characteristic allowed these titration reagents to be successfully used in acidic, basic, or neutral media. However, in this particular study, the solubility of the analyte is pH-dependent—DAC has a pKa1 value of 3.82, and thus titrations were conducted in a BR buffer with a pH of 2.47. In this pH range, the main species of the analyte is di-cationic and highly soluble, as depicted in Scheme 1A. A 10−6 M DAC2+ solution was prepared in HCl solution with the same pH with BR buffer, and a nanosphere titration was performed. Figure 6A demonstrates the similarity between the endpoints of the two titration curves despite the different solvent backgrounds in which the analyte is dissolved. However, the potential break of the titration performed in the BR buffer appears to be smaller compared to the one obtained in HCl. This observation could be attributed to the lipophilic nature of the anions present in the BR buffer (such as borate, phosphate, and acetate) when compared to the Cl- ions in the HCl solution, causing some interference. Nevertheless, the interference caused by the anions in the BR buffer is minimal, measuring only a few millivolts (less than 7 mV) when compared to the potential break in HCl, and it should not significantly impact the progression of the titration.

3.4. Selectivity

The impact of interference was assessed by conducting DAC-selective titrations in the presence of potentially concomitantly administered drugs namely sofosbuvir, and ledipasvir. J. Zhai et al. [2] reported that Ca2+ and Pb2+ selective emulsions displayed poor performance in the absence of ionophore due to reduced selectivity. Thus, the ionophore plays a crucial role in determining the species extracted from the sample solution, thereby influencing the selectivity of the emulsified nanospheres. This assumption is further validated by the data presented in Table 3 and illustrated in Figure 6B–D. Figure 6B,C demonstrates that the endpoint of the reverse titrations was reached earlier than the theoretical vertical line in case of ionophore-free emulsions. This indicates that the nanospheres become saturated with a smaller volume of the sample, resulting in positive errors in all the obtained recoveries, as indicated in Table 3 and Figure 6D. However, the magnitude of the error was significantly reduced in the presence of the ionophore. Specifically, the error decreased from 42.9% and 242.0% (when ionophore-free nanospheres were used) to 6.5% and 7.2% (when nanospheres containing ionophores were used) in presence of sofosbuvir and ledipasvir, respectively. This confirms that the emulsion without the ionophore exhibited a non-discriminatory response to DAC or the interfering species (sofosbuvir and ledipasvir) and that the nanospheres became selective for DAC only when the ionophore was incorporated. We propose that the observed trend in the results can be attributed to the selectivity of the nanosphere-free emulsions, which is governed by the lipophilicity of the analytes. Since DAC, SOF, and LED have higher lipophilicities compared to Na+ (the counter ion of TPB), they tend to be extracted into the nanospheres. This extraction process leads to a deviation in the DAC recovery values from 100%, as depicted in Figure 6D. This assumption is supported by J. Zhai and colleagues [7], who noted that nanospheres without ionophores exhibit selectivity according to the Hofmeister lipophilicity sequence. Furthermore, Y. M. Ahmed et al. [21] reported that carbon paste electrodes modified with DB18C6 showed a superior response and higher selectivity towards DAC compared to SOF and LED. Therefore, in the case of using ionophore-based emulsions, the reason why only DAC is extracted into the nanospheres (as evident in the recovery values) could be attributed to the stronger binding affinity of the ionophore to DAC compared to sofosbuvir and ledipasvir. It should be noted that sofosbuvir demonstrated much lower interference compared to ledipasvir. This distinction arises from the fact that ledipasvir possesses higher lipophilicity and a larger positive charge when compared to sofosbuvir.

3.5. Response Time

A 5 mL portion of the DAC-selective emulsion, containing Na-TPB at a concentration of 10−6 M, was introduced into the titration cell. The titration was carried out by adding volumes of the 10−6 M DAC2+ solution, specifically 2 × 1 mL and 5 × 200 µL, while monitoring the potential response over time. The endpoint of the titration was observed between 2.4 and 2.6 mL, as shown in Figure 7. The response time prior to reaching the endpoint exceeded 90 s, whereas after the endpoint, it was reduced to less than 20 s. This can be attributed to the fact that, theoretically, the aqueous solution before the endpoint does not contain DAC ions since they are readily extracted into the core of the nanospheres; however, after reaching the endpoint, the nanospheres become saturated with DAC, resulting in an increase in the DAC concentration in the aqueous solution. Consequently, the response time during the titration is primarily influenced by the response of the ISE.

3.6. Analysis of Biological and Pharmaceutical Samples

The developed DAC-selective emulsion was utilized to quantify DAC in various biological samples, including spiked serum and urine, as well as in a pharmaceutical dosage form (DAC content: 65.92 mg per tablet), as shown in Table 4. To analyze the spiked serum and urine samples, the same concentration was tested at two matrix dilutions, namely 10-fold and 100-fold with BR buffer. Subsequently, emulsion titration was performed, and the recoveries obtained were found to be 102.15% and 101.39% in serum and 102.81% and 102.07% in urine, for 10- and 100-fold matrix dilutions, respectively. These results highlight the successful application of the method for determining DAC in the complex matrix of biological fluids, especially at the low dilution of biological matrix. Furthermore, the DAC content in the commercial tablets was compared statistically with a reference method (HPLC [23]). The obtained t and F values were found to be below the critical values, indicating that the two methods exhibit comparable accuracy and precision.
The ionophore-based nanosphere emulsion incorporating an ion-exchanger for the potentiometric determination of drugs showed promising results. To further develop and apply this technique, several recommendations are suggested: (1) Investigating different combinations of ionophores and ion-exchangers to enhance selectivity and sensitivity for specific drug molecules. (2) The optimization of ionophores and ion-exchangers and binding capacity by exploring various ratios. (3) Testing the emulsion with a diverse range of drug molecules to assess its accuracy and applicability in determining drug concentrations in different pharmaceutical formulations. (4) Conducting long-term stability studies to determine the shelf life of the emulsion and evaluate the effects of storage conditions on its performance and integrity. (5) Performing comprehensive validation studies, including precision, accuracy, linearity, and limits of detection and quantification. (6) Comparing the results with established reference methods like HPLC to assess reliability and consistency. (7) Assessing the compatibility and effectiveness of the emulsion in complex biological matrices. (9) Developing appropriate sample preparation protocols and evaluating any potential matrix effects. (10) Exploring the application of the method in clinical settings for therapeutic drug monitoring and pharmacokinetic studies. (11) Measuring drug concentrations in patient samples to optimize dosing regimens and improve outcomes. (12) Investigate automation and miniaturization possibilities by integrating the emulsion with automated systems or microfluidic devices. (13) Exploring the development of portable and point-of-care devices for on-site drug determination.

4. Conclusions

In this study, DAC-selective ionophore-based emulsified cation exchange nanospheres were developed. These nanospheres were operated through heterogeneous ion exchange equilibria, facilitating the quantitative extraction of DAC ions. The nanosphere emulsion was employed as a titrant in the complexometric titration of DAC. For endpoint detection, the method relies on potentiometric determination, which measures the potential difference generated between an ISE and a reference electrode. The ion-selective electrode used in this case would be designed to selectively respond to DAC2+ ions. Within the concentration range of 81.18 µg/mL to 81.18 pg/mL (corresponding to 10−4 to 10−10 M), the nanospheres exhibited high selectivity for DAC-ionophore complexation, effectively discriminating against interfering species, such as sofosbuvir and ledipasvir, commonly found in pharmaceutical formulations. The integration of DB18C6 into the nanospheres contributed to this remarkable selectivity. Consequently, the accurate determination of DAC in commercial tablets, serum, and urine samples was achieved, yielding high recovery values, ranging from 99.4% to 106.5%, while minimizing interference from other species. The measurements were conducted in Britton–Robinson buffer at a pH of 2.47, and the response time ranged from approximately 90 to 20 s, depending on the stage of the titration process. The described method is a conceptual outline, and the actual implementation would require optimization, validation, and further research to ensure its applicability to different sample matrices. Additionally, regulatory guidelines and considerations should be followed for the analysis of pharmaceutical formulations.

Author Contributions

Conceptualization, S.S.B., Y.M.A., F.M.A.-H. and A.B.; methodology, S.S.B., Y.M.A., F.M.A.-H. and A.B.; validation, S.S.B., Y.M.A., F.M.A.-H. and A.B.; investigation, S.S.B., Y.M.A., F.M.A.-H. and A.B.; resources, S.S.B., Y.M.A., F.M.A.-H. and A.B.; data curation, S.S.B., Y.M.A., F.M.A.-H. and A.B.; writing—original draft preparation, S.S.B., Y.M.A., F.M.A.-H. and A.B.; writing—review and editing, S.S.B., Y.M.A., F.M.A.-H. and A.B.; supervision, S.S.B., Y.M.A., F.M.A.-H. and A.B. All authors have read and agreed to the published version of the manuscript.

Funding

A.B. thank the Irish Research Council (Grant: GOIPD/2020/340) for financial support.

Institutional Review Board Statement

Not applicable.

Informed Consent Statement

Not applicable.

Data Availability Statement

The authors confirm that the data supporting the findings of this study are available within the article.

Conflicts of Interest

The authors declare no conflict of interest.

References

  1. Zhai, J.; Xie, X.; Cherubini, T.; Bakker, E. Ionophore-Based Titrimetric Detection of Alkali Metal Ions in Serum. ACS Sens. 2017, 2, 606–612. [Google Scholar] [CrossRef]
  2. Zhai, J.; Xie, X.; Bakker, E. Ionophore-based ion-exchange emulsions as novel class of complexometric titration reagents. Chem. Commun. 2014, 50, 12659–12661. [Google Scholar] [CrossRef] [PubMed]
  3. Soda, Y.; Gao, W.; Bosset, J.; Bakker, E. Emulsion Doping of Ionophores and Ion-Exchangers into Ion-Selective Electrode Membranes. Anal. Chem. 2020, 92, 14319–14324. [Google Scholar] [CrossRef] [PubMed]
  4. Zdrachek, E.; Bakker, E. From Molecular and Emulsified Ion Sensors to Membrane Electrodes: Molecular and Mechanistic Sensor Design. Acc. Chem. Res. 2019, 52, 1400–1408. [Google Scholar] [CrossRef]
  5. Abdel-Haleem, F.M.; Gamal, E.; Rizk, M.S.; El Nashar, R.M.; Anis, B.; Elnabawy, H.M.; Khalil, A.S.G.; Barhoum, A. T-Butyl Calixarene/Fe2O3@MWCNTs Composite-Based Potentiometric Sensor for Determination of Ivabradine Hydrochloride in Pharmaceutical Formulations. Mater. Sci. Eng. C 2020, 116, 111110. [Google Scholar] [CrossRef]
  6. Barhoum, A.; Hamimed, S.; Slimi, H.; Othmani, A.; Abdel-Haleem, F.M.; Bechelany, M. Modern designs of electrochemical sensor platforms for environmental analyses: Principles, nanofabrication opportunities, and challenges. Trends Environ. Anal. Chem. 2023, 38, e00199. [Google Scholar] [CrossRef]
  7. Zhai, J.; Xie, X.; Bakker, E. Anion-Exchange Nanospheres as Titration Reagents for Anionic Analytes. Anal. Chem. 2015, 87, 8347–8352. [Google Scholar] [CrossRef] [PubMed]
  8. Soda, Y.; Robinson, K.J.; Nussbaum, R.; Bakker, E. Protamine/heparin optical nanosensors based on solvatochromism. Chem. Sci. 2021, 12, 15596–15602. [Google Scholar] [CrossRef] [PubMed]
  9. Robinson, K.J.; Soda, Y.; Bakker, E. Recent improvements to the selectivity of extraction-based optical ion sensors. Chem. Commun. 2022, 58, 4279–4287. [Google Scholar] [CrossRef]
  10. Guo, C.; Zhai, J.; Chen, Q.; Du, X.; Xie, X. Phase transfer of fatty acids into ultrasmall nanospheres for colorimetric detection of lipase and albumin. Chem. Commun. 2022, 58, 5037–5040. [Google Scholar] [CrossRef]
  11. Abdel-Haleem, F.M.; Rizk, M.S. Development of ionophore-based nanosphere emulsion incorporating ion-exchanger for complexometric titration of thiocyanate anion. J. Adv. Res. 2017, 8, 449–454. [Google Scholar] [CrossRef] [PubMed]
  12. Moyer, V.A. Screening for hepatitis C virus infection in adults: U.S. preventive services task force recommendation statement. Microchim. Acta 2013, 159, 349–357. [Google Scholar] [CrossRef] [PubMed] [Green Version]
  13. Lee, C.; Ma, H.; Hang, J.Q.; Leveque, V.; Sklan, E.H.; Elazar, M.; Klumpp, K.; Glenn, J.S. The hepatitis C virus NS5A inhibitor (BMS-790052) alters the subcellular localization of the NS5A non-structural viral protein. Virology 2011, 414, 10–18. [Google Scholar] [CrossRef] [PubMed] [Green Version]
  14. Fayed, A.S.; Hegazy, M.A.; Kamel, E.B.; Eissa, M.S. Three Smart and Original Spectrophotometric Data Processing Ratio Techniques for Resolving the Partial Overlapped Spectra of the Binary Antiviral Mixture Daclatasvir/Sofosbuvir: Application to Combined Dosage Form Darvoni® Tablets. J. AOAC Int. 2022, 105, 612–622. [Google Scholar] [CrossRef] [PubMed]
  15. Ezzeldin, E.; Abo-Talib, N.F.; Tammam, M.H.; Asiri, Y.A.; Amr, A.E.G.E.; Almehizia, A.A. Validated reversed-phase liquid chromatographic method with gradient elution for simultaneous determination of the antiviral agents: Sofosbuvir, ledipasvir, daclatasvir, and simeprevir in their dosage forms. Molecules 2020, 25, 4611. [Google Scholar] [CrossRef]
  16. Viswanath, A.; Lakshmanrao, A.; Unnisa, A.; Anupama, B.; Haritha, K. Estimation of daclatasvir in pharmaceutical dasage form by ultra performance liquid chromatography. Int. J. Pharm. Sci. Res. 2021, 12, 973–983. [Google Scholar] [CrossRef]
  17. Atta, N.F.; Ahmed, Y.M.; Galal, A. Nano-magnetite/ionic liquid crystal modifiers of carbon nanotubes composite electrode for ultrasensitive determination of a new anti-hepatitis C drug in human serum. J. Electroanal. Chem. 2018, 823, 296–306. [Google Scholar] [CrossRef]
  18. Badawy, S.S.; Ahmed, Y.M.; Sultan, M.A. Voltammetric determination of daclatasvir dihydrochloride at bimetallic Ag/Co nanoparticles modified carbon paste electrode. Microchem. J. 2023, 191, 108799. [Google Scholar] [CrossRef]
  19. Azab, S.M.; Fekry, A.M. Electrochemical design of a new nanosensor based on cobalt nanoparticles, chitosan and MWCNT for the determination of daclatasvir: A hepatitis C antiviral drug. RSC Adv. 2017, 7, 1118–1126. [Google Scholar] [CrossRef] [Green Version]
  20. Apichai, S.; Wang, L.; Pankratova, N.; Grudpan, K.; Bakker, E. Ion-exchange Microemulsions for Eliminating Dilute Interferences in Potentiometric Determinations. Electroanalysis 2018, 30, 2462–2466. [Google Scholar] [CrossRef]
  21. Ahmed, Y.M.; Badawy, S.S.; Abdel-Haleem, F.M. Dibenzo-18-crown-6-based carbon paste sensors for the nanomolar potentiometric determination of daclatasvir dihydrochloride: An anti-HCV drug and a potential candidate for treatment of SARS-CoV-2. Microchem. J. 2022, 177, 107276. [Google Scholar] [CrossRef] [PubMed]
  22. Niu, Z.; Zhang, W.; Yu, C.; Zhang, J.; Wen, Y. Recent advances in biological sample preparation methods coupled with chromatography, spectrometry and electrochemistry analysis techniques. TrAC Trends Anal. Chem. 2018, 102, 123–146. [Google Scholar] [CrossRef]
  23. Hassib, S.T.; Taha, E.A.; Elkady, E.F.; Barakat, G.H. Reversed-Phase Liquid Chromatographic Method for Determination of Daclatasvir Dihydrochloride and Study of Its Degradation Behavior. Chromatographia 2017, 80, 1101–1107. [Google Scholar] [CrossRef]
  24. Xie, X.; Bakker, E. Ion selective optodes: From the bulk to the nanoscale. Anal. Bioanal. Chem. 2015, 407, 3899–3910. [Google Scholar] [CrossRef]
  25. Li, M.; Jiang, W.; Chen, Z.; Suryaprakash, S.; Lv, S.; Tang, Z.; Chen, X.; Leong, K.W. A versatile platform for surface modification of microfluidic droplets. Lab Chip 2017, 17, 635–639. [Google Scholar] [CrossRef] [Green Version]
  26. Kabong, M.A.; Focke, W.W.; Du Toit, E.L.; Rolfes, H.; Ramjee, S. Breakdown mechanisms of oil-in-water emulsions stabilised with Pluronic F127 and co-surfactants. Colloids Surf. A Physicochem. Eng. Asp. 2020, 585, 124101. [Google Scholar] [CrossRef]
  27. Nikolskii, B.P.; Materova, E.A. Ion-Selective Electrode Reviews; Thomas, J.D.R., Ed.; Pregamon Press: Oxford, UK, 1989; ISBN 0080341500. [Google Scholar]
  28. Mikysek, T.; Stočes, M.; Vytřas, K. Two Novelties in Ion-pair Formation-based Potentiometric Titrations of Anionic Surfactants. Electroanalysis 2016, 28, 2688–2691. [Google Scholar] [CrossRef]
  29. Xie, X.; Zhai, J.; Bakker, E. PH independent nano-optode sensors based on exhaustive ion-selective nanospheres. Anal. Chem. 2014, 86, 2853–2856. [Google Scholar] [CrossRef]
  30. Xie, X.; Crespo, G.A.; Zhai, J.; SzilÁgyi, I.; Bakker, E. Potassium-selective optical microsensors based on surface modified polystyrene microspheres. Chem. Commun. 2014, 50, 4592–4595. [Google Scholar] [CrossRef] [PubMed]
  31. Xie, X.; Zhai, J.; Crespo, G.A.; Bakker, E. Ionophore-based ion-selective optical nanosensors operating in exhaustive sensing mode. Anal. Chem. 2014, 86, 8770–8775. [Google Scholar] [CrossRef]
Figure 1. Chemical Structure of (A) Daclatasvir. (B) Ionophore (dibenzo-18-Crown-6). (C) Cation-exchanger (sodium tetraphenylborate, Na-TPB). (D) Structure of the emulsifier (triblock copolymer Pluronic F-127).
Chemosensors 11 00385 g001
Figure 2. Formation of the emulsified nanospheres: (A) TEM image of DAC-selective nanospheres showing their average size distribution; (B) camera image of the emulsion after one week. Top view camera images of the nanosphere emulsion after: (C) one day, (D) two weeks, and (E) one month.
Chemosensors 11 00385 g002
Figure 3. Ionophore-based nanosphere emulsion incorporating ion-exchanger for potentiometric determination of Daclatasvir. (A) Explanation of source of potential difference in the measurement cell and endpoint detection. (B) Illustration of the complexation mechanism of the prepared DAC-selective emulsion.
Chemosensors 11 00385 g003
Figure 4. Complexometric potentiometric titration using the DAC-selective emulsion: (A) Titration curves of 10−6 M (0.81 µg/mL) DAC titrated against different compositions of emulsions. The dashed vertical line represents the expected theoretical endpoint. The start potential of all plots in this and all subsequent figures was set to start from zero for the sake of clarity. Inset represents the potentiometric titration and first derivative curves for Emulsion 2. (B) The titration curve of 10−6 M (0.81 µg/mL) DAC.2HCl titrated with nanosphere Em 2 containing the ionophore and nanosphere Em 2 free of the ionophore. The dashed vertical line represents the theoretical endpoint.
Chemosensors 11 00385 g004
Figure 5. Complexometric potentiometric titration using the DAC-selective emulsion. (A) Titration curves for different concentrations of DAC2+ versus the nanosphere emulsion. The vertical line represents the theoretical endpoint. (B) Relationship between the analyte concentration (pDAC) and the potential break of the titration curve.
Chemosensors 11 00385 g005
Figure 6. Influence of the interfering species. (A) Comparison between nanosphere emulsion titration of 10−6 M (0.81) µg/mL DAC2+ in BR buffer and HCl. Potentiometric titration curves for 10−6 M (0.81 µg/mL) DAC in presence of a two-fold interferent concentration of SOF (B) and LED (C). The dashed vertical line represents the expected theoretical endpoint. (D) Comparison between the selectivity of ionophore-based and ionophore-free emulsions for the determination of DAC in absence and presence of interfering species (error bars represent an average of three titrations).
Chemosensors 11 00385 g006
Figure 7. Time trace during the potentiometric titration of 10−6 M (0.81 µg/mL) DAC.2HCl. In the titration cell, a 5 mL aliquot of DAC-selective emulsion contains 10−6 M ion-exchanger (Na-TPB). The volumes of the added DAC solution were 2 × 1 mL and 5 × 200 µL, respectively.
Chemosensors 11 00385 g007
Table 1. Composition of the DAC-selective nanospheres emulsion and the corresponding recovery.
F-127 (mg)TCP (mg)DB18C6 (mg)THF (mL)Na-TPB Aliquot *
(mg)
H2O (mL)Recovery % ± SERef.
Em 13.008.002.242.001.006.00No response[2]
Em 25.008.001.252.001.806.00102.15 ± 4.17[20]
* Each THF aliquot was spiked with a suitable volume of 10−4 M Na-TPB solution, prepared in THF, to yield a final ion-exchanger concentration of 10−6 M.
Table 2. Potentiometric reverse titration of DAC in pure solutions.
Amount of DACRecovery %RSD * %
mol/Lµg/mL
1.00 × 10−481.1899.372.32
1.00 × 10−58.12100.712.29
1.00 × 10−60.81102.154.09
ng/mL
1.00 × 10−781.18103.492.42
1.00 × 10−88.12103.604.65
1.00 × 10−90.81106.514.26
5.00 × 10−100.41104.414.73
pg/mL
1.00 × 10−1081.18104.942.39
* Average of three determinations.
Table 3. Recovery values for determination of DAC in presence of two-fold interfering levels of sofosbuvir and ledipasvir.
SampleEm with IonophoreIonophore-Free Em
Recovery %RSD * %Recovery % RSD * %
10−6 M DAC102.154.09107.284.70
10−6 M DAC + two-fold SOF106.514.26142.86 0
10−6 M DAC + two-fold LED107.151.25341.96 6.66
* Average of three determinations.
Table 4. Analytical application to biological samples (spiked serum and urine) and statistical comparison between the determination of DAC in pharmaceutical dosage form (Daclavirocyrl-65.92 mg/tab) using HPLC and potentiometric reverse titration.
MethodSampleTakenFound ± SEF-Value t-Value
HPLC [23]Daclavirocyrl a µg/mL4.064.07 ± 0.01 16.04 c2.57 c
Potentiometric reverse titrationDaclavirocyrl b µg/mL4.064.11 ± 0.03 4.9441.744
mg/mL0.660.66 ± 0.006 --
Spiked serum b, µg/mL0.81 d0.82 ± 0.01 --
0.81 e0.83 ± 0.02 --
Spiked urine b, µg/mL0.81 d0.83 ± 0.01 --
0.81 e0.84 ± 0.02 --
a,b Average of three and four determinations, respectively. c The tabulated t value and F value at p = 0.05. Dilution of biological matrix: 100-fold d and 10-fold e.
Disclaimer/Publisher’s Note: The statements, opinions and data contained in all publications are solely those of the individual author(s) and contributor(s) and not of MDPI and/or the editor(s). MDPI and/or the editor(s) disclaim responsibility for any injury to people or property resulting from any ideas, methods, instructions or products referred to in the content.

