Article

An Innovative Electrochemical Immuno-Platform for Monitoring Chronic Conditions Using the Biosensing of Hyaluronic Acid in Human Plasma Samples

by
Ahmad Mobed
1,2,3,
Fereshteh Kohansal
4,
Sanam Dolati
2,*,
Mohammad Hasanzadeh
3,4,* and
Seyed Kazem Shakouri
1,2
1
Aging Research Institute, Faculty of Medicine, Tabriz University of Medical Sciences, Tabriz 5166-15731, Iran
2
Physical Medicine and Rehabilitation Research Center, Aging Research Institute, Faculty of Medicine, Tabriz University of Medical Sciences, Tabriz 5166-15731, Iran
3
Pharmaceutical Analysis Recent Center, Tabriz University of Medical Sciences, Tabriz 5166-15731, Iran
4
Nutrition Research Center, Tabriz University of Medical Sciences, Tabriz 5166-15731, Iran
*
Authors to whom correspondence should be addressed.
Chemosensors 2023, 11(7), 367; https://doi.org/10.3390/chemosensors11070367
Submission received: 30 January 2023 / Revised: 14 February 2023 / Accepted: 28 June 2023 / Published: 29 June 2023

Abstract

:
Hyaluronic acid (HA) is the main non-sulfated glycosaminoglycan of the extracellular matrix that is synthesized by fibroblasts and other specialized connective tissue cells. The accumulation of HA on different tissues is a characteristic of disorders that are associated with progressive tissue fibrosis. HA is also known to play a critical role in tumorigenesis and tumor metastasis. It is overproduced by many types of tumors and promotes tumor progression and multidrug resistance. There is a great necessity for the development of an easy and cost-effective detection method for the monitoring of HA for both the diagnosis and efficient treatment of related disorders. In the present study, an innovative immune device was designed for the rapid and sensitive recognition of HA in human plasma samples. For this purpose, an efficient alloy (Pt@Au) was fabricated on the surface of the gold electrode. Thus, a novel substrate was used for the preparation of an efficient transducer, which is necessary for the immobilization of biotinylated antibodies. CHA was applied for the electrochemical deposition of Pt@Au nano-alloy on Au electrodes. Additionally, the morphological study of the used nanocomposite was assessed using FESEM at a working voltage of 3 kV, and the chemical structures of the electrode were analyzed using the EDS apparatus. For the first time, a biocompatible alloy-based substrate was prepared for the study of antigen–antibody identification. The developed immunosensor has a linear response within the range of 0.156–160 ng.mL−1 with a limit of detection of 0.039 ng.mL−1 in human plasma samples. This research study offers a novel promising technique for HA analyses and is anticipated to be used in the early diagnosis of some disorders related to abnormal levels of HA in human bio-fluids. Thus, a constructed (pt@Au) nano-alloy provides a useful interface for the dense loading of AB. This excellent design loads high sensations of the biosensor for the selective detection of HA in real samples (human bio-fluids).

1. Introduction

Hyaluronic acid (HA), also known as hyaluronan or hyaluronate, is an anionic high molecular weight linear polymer of repeating units of disaccharides consisting of N-acetyl-D-glucosamine and D-glucuronic acid (between 1000 and 10,000 kDa) [1]. HA is produced in connective tissue cells and is existent as a significant constituent of the extracellular matrix (ECM) in many tissues and fluids. Its action is mediated by its cell surface receptor CD44 [2,3,4].
HA plays critical a role in inflammation, wound healing, mitosis, migration, adhesion, tumor development, cancer proliferation, and metastasis [5]. The serum level of HA has shown its potential to be a diagnostic and/or prognostic biomarker in several clinical and pathological parameters of liver diseases (hepatic fibrosis); inflammatory diseases (rheumatoid arthritis); uremia; myelofibrosis; systemic sclerosis; and several types of solid tumors, such as bladder, prostate, breast, ovarian, lung, and colon cancer [6,7]. Also, HA is considered a good biomarker for cartilage damage and synovitis in patients with osteoarthritis (OA) [8]. The increase in the concentration of serum hyaluronic acid (sHA) with age could be a result of progressive age-related hepatic and renal impairment [9]. The mean levels of baseline sHA were 55.7 ± 27.6 (ng.mL−1) in the participants without hand osteoarthritis (HOA) and 92.3 ± 52.1 (ng.mL−1) in the patients with HOA [10]. In addition, mean HA levels in patients with knee OA was 41.94 + 68.79 ng/dl [11]. Moreover, HA is a non-invasive marker of liver fibrosis in chronic liver diseases, and it is considered the gold standard in the evaluation of fibrosis [12,13]. Measuring the HA level in biofluids is important in distinguishing advanced fibrosis/cirrhosis from absent or mild fibrosis [14]. Additionally, HA is a promising acceptable biomarker for diagnosing endometriosis [15,16,17,18].
Several studies have demonstrated that HA is a potentially accurate biomarker for cancer diagnosis, including prostate, bladder, breast, and colorectal cancer as well as for predicting disease recurrence and progression [19,20,21,22,23,24].
Therefore, the quantitative detection of HA concentrations in serum or tissues is evaluated for disease diagnosis and prognosis [25]. The conventional methods used for the bioassay of HA mainly include enzyme-linked immunosorbent assays [21], noncompetitive ELISA-like assays [26] a competitive fluorescence-based assay [27], plasmonic mass spectrometry [28], colorimetry, and immuno-electrophoresis [29,30]. However, these methods take a lot of time and also need strict laboratory conditions (Table 1). Therefore, efforts to design and study a novel detecting method are necessary. Thus, emerging suitable, fast, and sensitive HA detection methods are importance. Biosensors have the advantages of high sensitivity, low cost, low background noise, a broader dynamic range, potential and spatial controllability, and a much lower detection limit [31,32]. In the present study, an innovative electrochemical immunosensor was fabricated for rapid scanning with respect to human plasma samples and the appropriate sensitive detection of HA. The created system showed acceptable stability and selectivity, with a wide linearity range. In this research study, a reduced graphene oxide-ZnO nanorod (RGO-ZnO) composite was produced by means of a facile one-pot method. An optical biosensor based on room-temperature phosphorescent (RTP) PDAD–Mn–ZnS QDs was planned for the identification of HA in body fluids. The developed system presented good sensitivity and broad linearity without complicated pretreatment [33]. Interestingly, high-performance capillary electrophoresis was used in research for the determination of HA. The developed method was expensive and time-consuming [34]. Also, size exclusion chromatography/multi-angle laser light scattering (SEC/MALLS) was developed for the determination of HA in biological samples [34,35]. A colorimetric enzyme-linked method has been proposed for HA determination in complex samples. The envisioned technique was evaluated in an industrial setting for the online validation of HA loss during downstream processes and the detection of veterinary medications [30]. Some important and widely used methods for the detection of HA are summarized in Table 1.
Modern and advanced methods have been developed in recent years to overcome the limitations of routine and old methods. Biosensors are analytical tools that have expanded rapidly over the past two decades. In the present study, an innovative immune device was designed for the rapid and sensitive recognition of HA in human plasma samples. For this purpose, an efficient alloy (Pt@Au) was fabricated on the surface of a gold electrode. Thus, a novel substrate was used for the preparation of an efficient transducer, which is necessary for the immobilization of biotinylated antibodies. The CHA was applied for the electrochemical deposition of the Pt@Au nano-alloy on Au electrodes. For the first time, a biocompatible alloy-based substrate was prepared for the study of antigen–antibody identification. This research study offers a novel promising technique for HA analyses and is anticipated to be used in the early diagnosis of some disorders related to abnormal levels of HA in human bio-fluids. Thus, constructed (pt@Au) nano-alloys provide a useful interface for the dense loading of AB. This excellent design uses highly sensitive biosensors for the selective detection of HA in real samples.

2. Experimental Section

2.1. Materials

An HA kit comprising biotinylated antibodies and antigens was acquired from ZellBio GmbH (Lonsee, Germany). For the electrochemical test, a ferricyanide/ ferrocyanide solution comprising 0.5 mM of K4Fe (CN)6/K3Fe (CN)6 and 0.1 M KCl was applied for the study of the microscopic surface areas of working electrodes. Hydrogen tetrachloroaurate (III) hydrate (HAuCl4-3H2O), platinum (IV)-chloride (57.5% Pt) (PtCl4), polyethylene glycol, and sulfuric acid 98% were obtained from Sigma-Aldrich (Oakville, ON, Canada). EDC (1-Ethyl-3-(3-dimethylaminopropyl) carbodiimide) and NHS (N-Hydroxysuccinimide) were purchased from Sigma-Aldrich (Oakville, ON, Canada). Also, alumina was used for the polishing of gold electrodes. Fresh frozen plasma samples were acquired from the Iranian Blood Transfusion Research Center (Tabriz, Iran). The current study was approved by the Research Ethics Committee of the Tabriz University of Medical Science (No: IR.TBZMED.REC.1399.807).

2.2. Instrumentations

In this study, electrochemical quantities included a predictable three-electrode cell (Metrohm) comprising a Pt wire as the counter electrode and gold (Au) (d = 2 mm) as the working electrode with a capacity of Ag/AgCl. The PalmSens system was run on a PS4. KCl as a reference electrode was powered using an electrochemical method, and it was linked to F1.05 (Palm Instruments, Utrecht, The Netherlands). The system was installed on a PC with PSTrance 5.3 software. The AC amplitude was 10 mV, and the equilibration time was 5 s. In this study, cyclic voltammetry (CV) techniques were used for the initial evaluation of electrode performance. In this research study, CV techniques were used for the preliminary assessment of electrode performance, where the following values were used: CV (Tequilibration: 0 s; Ebegin: −1.0 V; Evertex1: 1.0 V; Evertex2: −1.0 V; Estep: 0.01 V; scan rate: 0.1 V.s), SWV (Tequilibration: 0 s; Ebegin: −1.0 V; −Eend: 1.0 V; Estep: 0.005 V; amplitude: 0.02 V; frequency: 10 Hz); and DPV (Tequilibration: 2 s; Ebegin: −1.0 V; Eend: 1.0 V; Estep: 0.1 V; Epulse: 0.005 V; Tpulse: 0.2 s; scan rate: 0.1 V.s).
The CHA was applied for the electrochemical deposition of Pt@Au nano-alloy on Au electrodes (T equilibration: 2 s; Edc: −0.23 V; t interval: 0.1 s; t run: 100 s). The morphological study of the used nanocomposite was assessed by FESEM (Hitachi-Su8020, Czech) with a working voltage of 3 kV, and the chemical structures of the electrode were analyzed using the EDS apparatus.

2.3. Preparation of the Pt@Au Nanoparticle Deposition Solution

A solution of a mixture of 10 mM HAuCl4-3H2O and 10 mM platinum (IV)-chloride (57.5% Pt) (PtCl4) (1:1 measurements) was dissolved in sulfuric acid at a concentration of 200 mM (previously prepared) containing PEG at a concentration of 100 mM. Therefore, the required amount of salt to prepare this solution was used.

2.4. Gold Electrode Pre-Treatment before the Electrodeposition of Pt@Au Alloys

The first and most important requirement in electrochemical experiments that affects the recognition process is the quality and clarity of the active surface of the gold electrode. The frequency response in electrochemical impedance spectroscopy and the peak current in cyclic voltammetry depend on the gold’s surface composition. In an unsuitable and unclean laboratory, the gold’s surface is exposed to many environmental pollutants, and as a result, it affects electrochemical reactions. Therefore, a clean, mirror-smooth surface is essential prior to modification and bioanalysis. For this purpose, the electrochemical method cycled the electrode potential in a weak sulfuric acid solution until a stable CV scan was performed. The applied potential ranged from −400 to 1400 mV (vs. Ag/AgCl) at a scan rate of 100 mV.s in sulfuric acid (50 mM) until the CVs become stable (12 cycles). Thus, the gold electrode surface was pre-cleaned and prepared for possible modification using nanoparticle nano-alloy.

2.5. (Pt@Au)-Based Gold Electrodes Preparation via the CHA Technique

The chronoamperometry technique (CHA) was used for the electrogeneration of the Pt@Au nano-alloy on Au electrodes. For this purpose, the gold electrode was transformed into an electrochemical cell containing a Pt@Au nano-alloy solution. Afterward, the desired nano-alloy was deposited on the surface of gold electrodes using a chronoamperometry technique with the following data: tequilibration = 2 s; Edc = −0.23 V; tinterval = 0.1 s; trun =100 s.

3. Characterization

3.1. Fabrication of Immunosensor

In the present work, field emission scanning electron microscopy (FESEM) was applied to the morphological study of used nanocomposites in different steps, including the following: (A) AuE-(Au@Pt), (B) AuE-(Au@Pt)-Ab-BSA, and (C) AuE-(Au@Pt)-Ab-BSA-Ag. As shown in Figure 1, the HA antibody-BSA was revealed at the nanoscale, and specific morphology was observed. In the continuation of the project, after the successful synthesis of the nanocomposite, the nanocomposite was deposited on the gold electrode for biosensor engineering (Figure 1). As shown, the nanocomposite (Pt@Au) formed flower-like structures and is uniformly deposited on the surface of the gold electrode (Figure 1A). The next step involves adding the antibody to the previous compound. The FESEM was recorded in this step, and the morphology of the nanocomposite did not change much; the nanostructures of the previous stage are visible (Figure 1B). Afterward, Ag was added to the surface of a (Pt@Au)-Ab-BSA-modified gold electrode (Figure 1C).
After Pt@Au deposition on the surface of the gold electrode, 5 µL of HA biotinylated antibody was activated by 10 µL of EDC/NHS solution. Then, 10 µL of activated and biotinylated antibodies was immobilized and incubated on the modified electrode’s surface for one hour at room temperature. EDC-NHS chemistry was employed to activate the -COOH groups of antibodies, with EDC acting as a coupling agent and NHS acting as an activator [39] to provide a suitable surface for the antibody with respect to its binding with the gold electrode matrix.
There are biotinylated reagents available for certain functional groups or residues, such as primary amines, sulfhydryls, carboxyls, and carbohydrates. An EDC/NHS-activated biotin is the most often used biotinylated reagent, which combines primary amine groups from the side chain of Lysine residues and the N-terminus of each polypeptide chain in the antibody. DC crosslinking procedures frequently contain N-hydroxysuccinimide (NHS) or its water-soluble analog for greater coupling efficiency and more stable amine-reactive intermediates (Sulfo-NHS). EDC, in combination with NHS, enables two-step protein coupling without altering the carboxyls of the second protein. First, EDC activates carboxyl groups, resulting in the formation of an amine-reactive O-acylisourea intermediate, which spontaneously interacts with primary amines to create an amide bond and an isourea byproduct. EDC combines NHS with carboxyls, forming an NHS ester that is far more stable than the O-acylisourea intermediate and allows for effective conjugation to primary amines at a physiological pH (Scheme 1) [40].
Afterward, the electrode was washed with DW to eliminate possible contaminations during incubation. After that, the electrode’s surface was washed with a special washing buffer, and then 10 µL of bovine serum (BSA) albumin solution was added to the modified electrode to block non-reacted Pt@Au sites with Ab. The incubation of this step lasted for 40 min. Finally, 10 µL of HA antigen was immobilized on the electrode’s surface and incubated for 1 h, and after washing with washing DW, the modified gold electrode transformed into an electrochemical cell containing K4Fe (CN)6/K3Fe (CN)6 (0.5 mM)/KCl (0.1 M) for electrochemical evaluation. Scheme 2 summarizes all fabrication processes of the HA immunosensor.

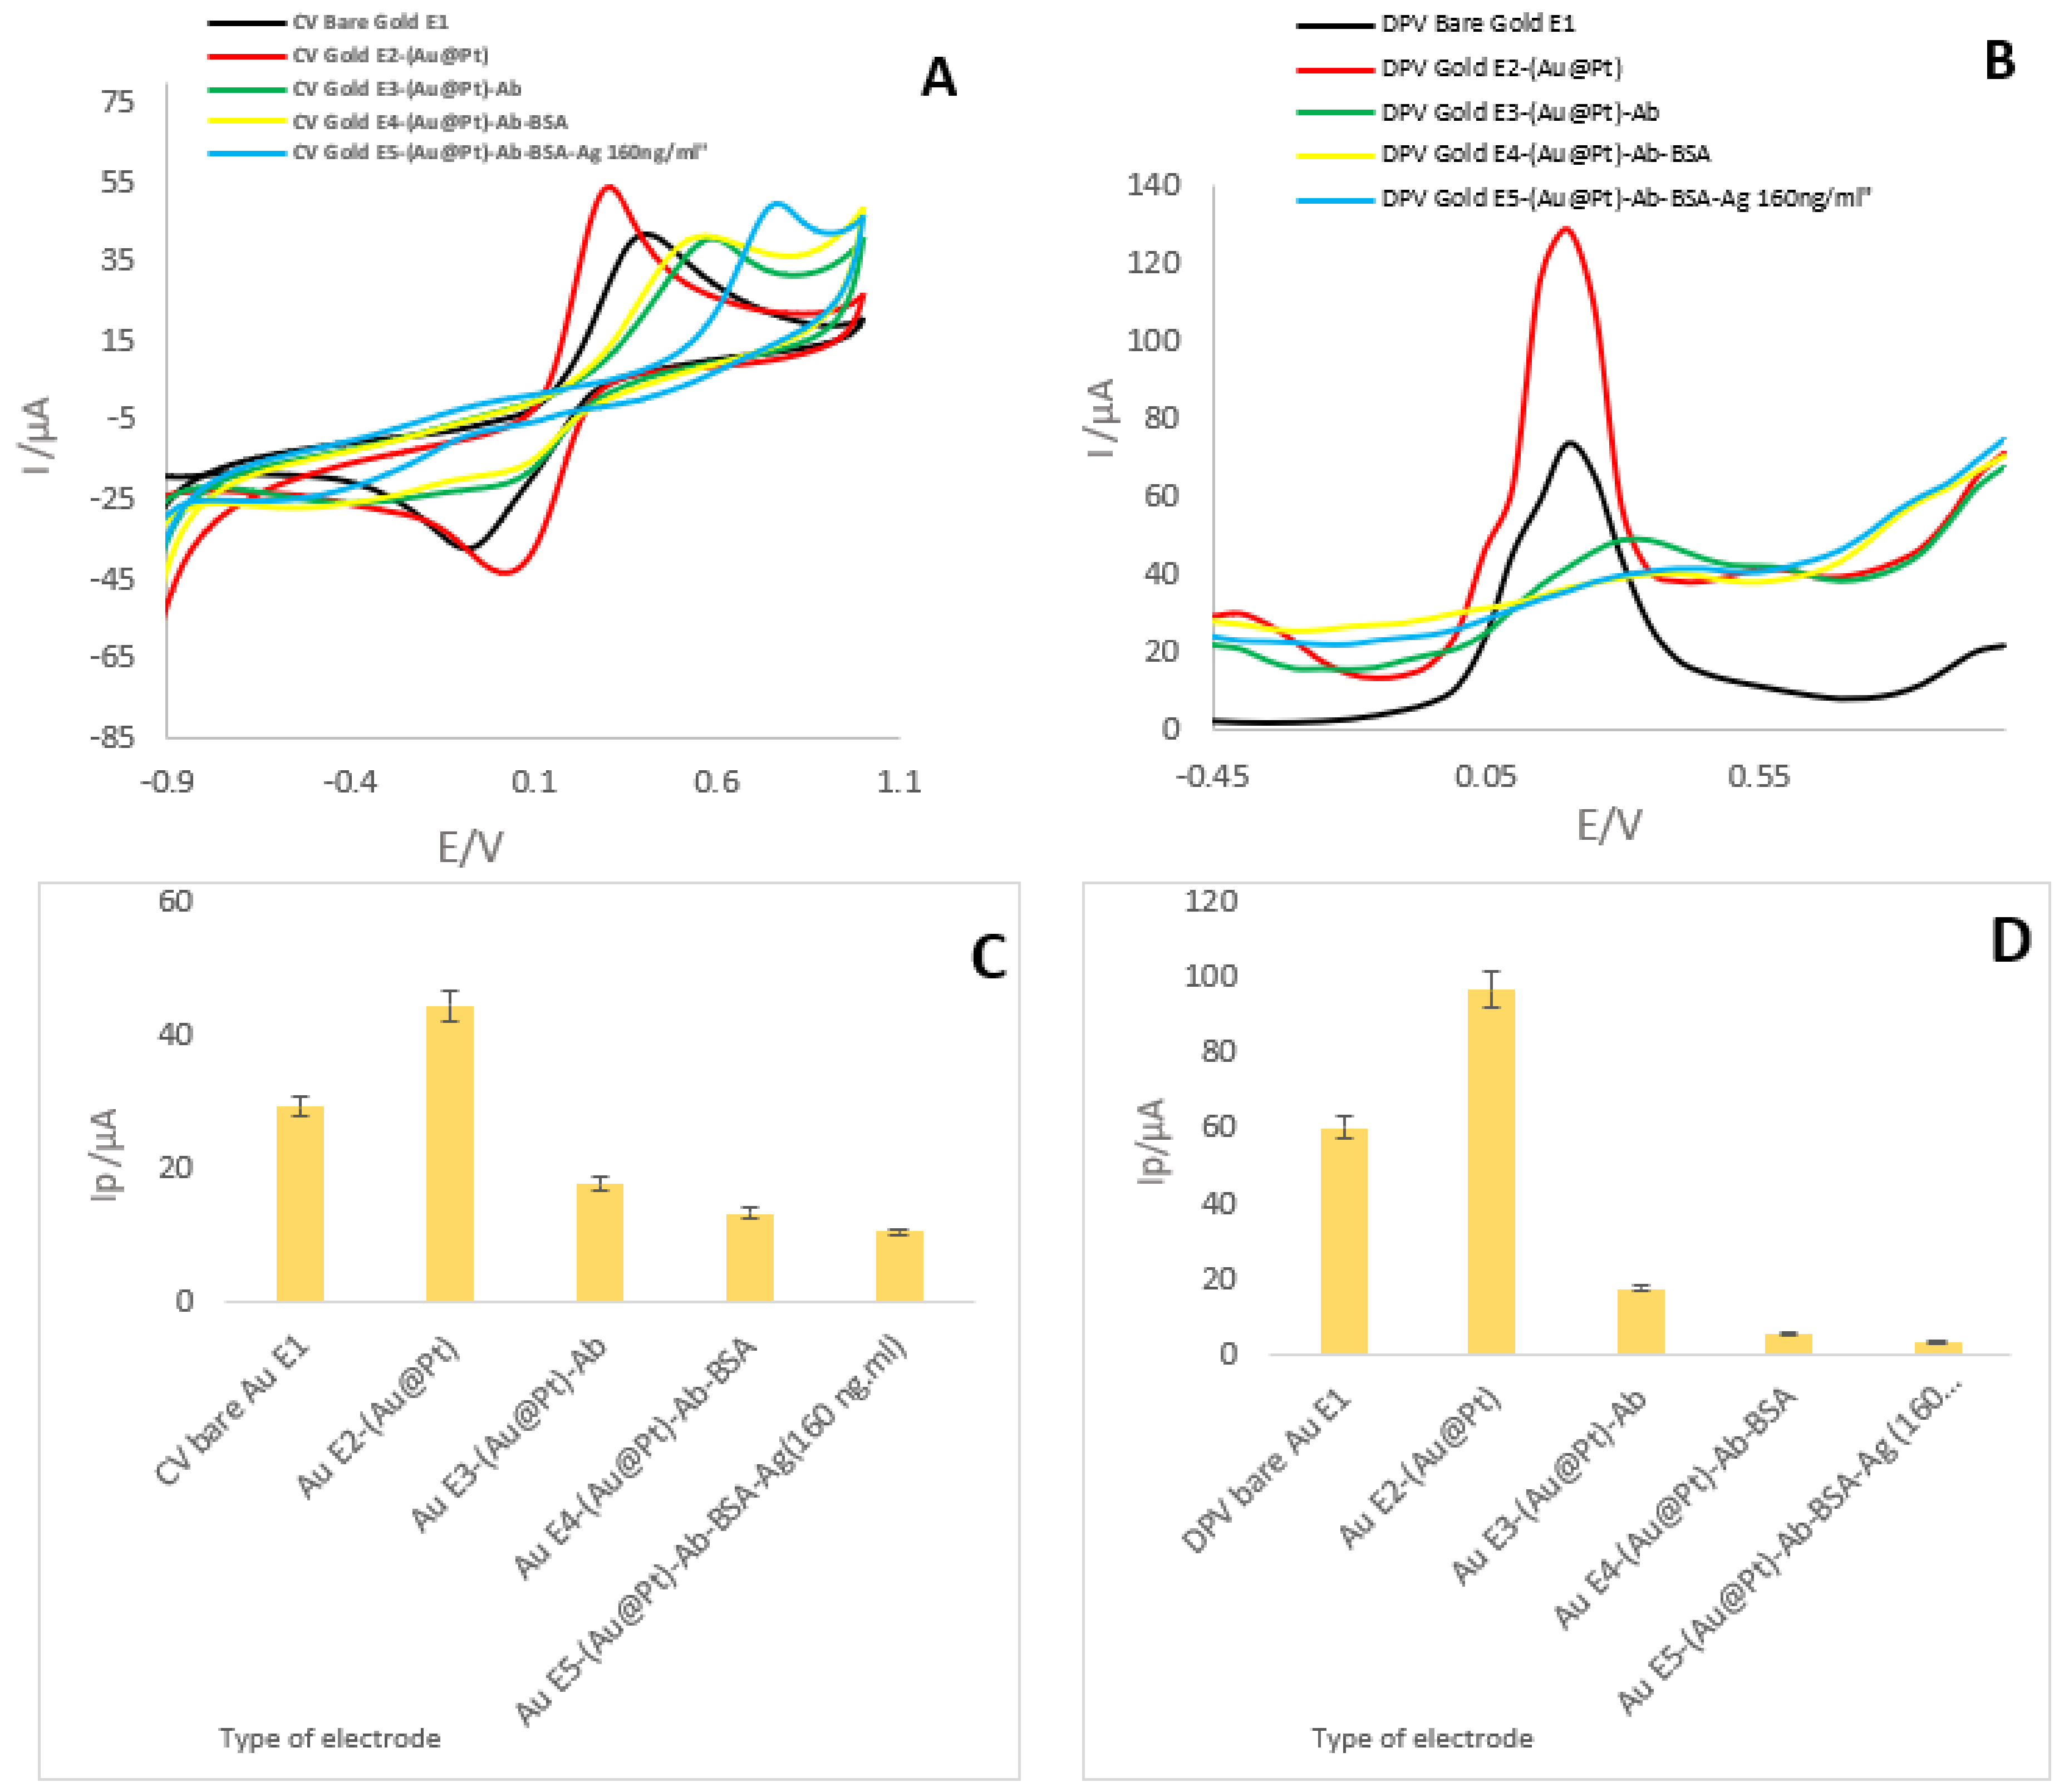
3.2. Investigation of the Electrochemical Behaviors of the Immunosensor during Different Stages of the Preparation

For the electrochemical investigation during the different stages of immunosensor fabrication, DPV and CV techniques were accurately applied. K4Fe(CN)6/K3Fe(CN)6(0.5 mM)/KCl (0.1 M) was used as a supporting electrolyte for electroanalysis.
First of all, the CVs of (bare Au electrode, Pt@Au), (Pt@Au)-Ab, and Pt@Au-Ab-BSA-(Ag) were recorded. As shown in Figure 2A, different results were recorded, including current intensity, peak height, and peak location. The results show that the highest current intensity is related to Electrode 2 (Pt@Au; 44 µA). Also, the current intensity of electrode (Pt@Au)-Ab-BSA-(Ag) is lower (10 µA). Therefore, according to the results obtained from the CV technique, it has different electrochemical behaviors in different conditions. But as it turned out, no specific trend was recorded in the graphs. The DPV technique was used to achieve a possible specific behavior. In the recorded DPV technique, Ep and Ip results related to bare gold electrodes were 0.199 V and 60 µA, respectively. Secondly, the mentioned techniques were applied for the modified electrodes (Pt@Au). It is crucial to point out that gold and platinum nanoparticles are effective in increasing current intensity (96.54 µA) but did not change the position of graphs (Ep = 0.199 V). In the following, the CV and DPV of the gold electrode (Pt@Au)–biotinylated Ab were recorded.
As observed in Figure 2, Ep and Ip dropped to 0.56 V at 17.70 µA of CV and 0.299 V and 17.41 µA of DPV. After adding BSA to the nanocomposite, the peak current decreased to 13.34 µA and 5.07 µA; Ep was 0.51 V and 0.34 in CV and DPV, respectively. Finally, the hyaluronic acid antigen was immobilized on the modified gold electrode (Gold E5-(Pt@Au)-BSA-Ag), and the DPV and CV recording techniques are shown in Figure 2; the peak current of CV and DPV decreased to 10.53 µA and 3.13 µA and Ep = 0.74 V and 0.29 V, respectively.

4. Results and Discussion

4.1. Analytical Study

Specifically, analytical efficiency is the most important factor for evaluating the function of an immunosensor. For this purpose, different concentrations (160, 80, 40, 20, 10, 5, 2.5, 1.25, 0.625, 0.312, and 0.156 ng.mL−1) of the antigen were prepared and incubated on the surface of the modified gold electrode—(Pt@Au)-Ab-BSA. For the recognition of the HA antigen in different concentrations, the SWV technique was used appropriately.
As shown in Figure 3, the recorded peak heights follow a precise trend (0.156–1.25 ng.mL−1). As the analyte concentration decreases, the current decreases accordingly. That is, the highest peak refers to the highest concentration. Thus, a linear relationship was observed between the immunosensor’s peak current and the HA concentration within the range of 0.156–10 ng.mL−1; at 0.156 to 10 ng.mL−1, its LOD was about 0.156 ng.mL−1. Analytical studies on real samples were also evaluated in this study. For this purpose, the concentrations generated in the previous step were analyzed in a plasma medium.
Table 2 demonstrated the analytical results of all biosensors developed for the detection of HA in recent years. For example, high-performance liquid chromatography (HPLC) is a versatile tool for separating and analyzing pharmaceutical and biological compounds. Even in complex systems, the analysis of several trace analytes can be accomplished with the effective use of HPLC and the appropriate selection of sensitive detection techniques. Various detection systems are currently used in HPLC, including the refractive index, UV-Vis absorption, fluorescence, mass spectrometry (MS), nuclear magnetic resonance (NMR), and pulsed electrochemical detection (PED). Analytical size exclusion chromatography (SEC) is commonly used to determine the molecular weight of protein–protein complexes and proteins in solution. SEC is a relative technique that relies on an analyte elution volume to determine the molecular weight. Multi-angle light scattering (MALS) is an absolute method for determining the molecular weight of analytes in solutions using basic physical equations. Combined MALS and SEC separation has been used as a versatile and reliable tool for determining the solutions of one or more protein species, including monomers, native oligomers, aggregates, and heterocomplexes. Since measurements are performed at each elution volume, SEC-MALS can determine whether elution peaks are homogeneous or heterogeneous and distinguish between fixed molecular weight distributions and dynamic equilibria. The analysis of modified proteins, such as glycoproteins and lipoproteins, and conjugates, such as detergent-solubilized membrane proteins, is also possible. SEC-MALS is therefore an important tool for protein chemists who need to confirm the biophysical properties and solution behavior of molecules prepared for biological or biotechnological research. Colorimetric assays allow the sensitive detection of enzyme activity using an optical density. For instance, peroxidase activity is determined by the reduction of the substrate in the presence of hydrogen peroxide, producing a soluble chromogen that is evaluated using a spectrophotometer.
To date, few biosensors have been developed for the nanoscale detection of HA. Based on the results listed in the table, the sensitivity of the introduced systems is within the micromolar range, while the engineered platform in this study has a sensitivity in the range of ng.mL−1 (developed biosensors (160, 80, 40, 20, 10, 5, 2.5, 1.25, 0.625, 0.312 and 0.156 ng.mL−1) ≥ present study (0.156 ng.mL−1)) and shows the highest sensitivity compared to similar systems. According to Table 2, routine diagnostic methods have relatively low sensitivity and specificity despite their high cost. The present study shows that very few biosensors have been developed to date for the detection of HA and that the studies presented in the table have more favorable analytical properties than routine methods. As shown in the table, the immunosensor developed in this study has a higher sensitivity than routine methods and developed biosensors. On the other hand, the system designed in this study can be used in conjunction with real samples.
According to obtained results, the high sensitivity of the engineered immunosensor is related to the high performance of the nano-alloy on the structure of the transducer. As we know, the highly catalytical properties of Pt@Au produced the large surface area needed for the immobilization of Ab and its ability to become an immunocomplex with HA (antigen). This ability is related to the highly dense loading of the Ab interface.
As shown in Figure S4, the proposed immunosensor platform has good performance in human plasma. Therefore, the designed biosensor can detect HA in real samples such as blood, plasma, and serum. The developed immunosensor has a linear response within the range of 0.039 to 0.312 ng.mL−1 with a low limit of quantification of 0.039 ng.mL−1 in human plasma samples.

4.2. Investigation of Selectivity

Consequently, the selectivity of the developed immunosensor was investigated using the DPV technique in the presence of PSA, CEA, CA15-3, and SNCA.
As shown in Figure S5, the location and height of the peak corresponding to the target antigen (hyaluronic acid) are quite different from other antigens. In other words, the selectivity of the designed immunosensor is appropriate and acceptable. Also, according to the recorded histogram, the peak height of the target antigen is well known. In detail, the recorded peak current for HA was 9.025 µA, whereas SNCA, PSA, CEA, and CA15-3 were 10.88, 8.96, 8.51, and 10.27 µA, respectively. In other words, there is a significant numerical difference between the interfering antigens and HA antigens.

4.3. Stability of Immunosensor’s Substrate

The cyclic stability of the constructed substrate of the immunosensor (AuE-(Pt@Au)) was investigated as well. The stability of the designed sensor during different cycles was evaluated using the CV technique. As observed in Figure S6, the current intensity, location, and peak height between cycles 1 to 173 show slight changes. In other words, the cyclic stability of the substrate is obvious and desirable. The calculated RSD value (0.024%) also proves the appropriate cyclic stability of the engineered electrode substrate.
In this study, inter-day stability was also measured, the results of which are shown in Figure S7. In the evaluation of inter-day stability, it was observed that the proposed substrate has desirable stability within a period of 0–5 h. As observed in the second part of the image (Figure S7B), the height of the peaks is almost equal at different times. Therefore, the stability of the applied substrate (Pt@Au) nano-alloy was appropriated for long-term studies. The obtained RSD value (0.091%) indicated the appropriate stability of the applied substrate.

4.4. Investigation of Reproducibility

The meaning of reproducibility for electrochemical biosensors is the same as for other analytical devices. Reproducibility is a measure of the variability or drifts in a set of observations or results made over a period of time. It is generally determined for analyte concentrations within the usable range. In the present work, reproducibility was measured by using the CV technique appropriately. As revealed in Figure S8, the developed immunosensor showed acceptable reproducibility in the same condition. In other words, the generated immunosensor exhibits almost identical electrochemical behavior in four similar electrodes, as the RSD value (0.019%) approved this fact.

5. Conclusions

Nowadays, simple, rapid, sensitive, and specific diagnostic tests hold promise for the improved diagnosis of diseases. In summary, a novel electrochemical immune device was proposed for the recognition of HA using Pt@Au nano-alloys and immunological strategies. Interestingly, a green method was used for the preparation of Pt@Au as an efficient substrate for antibody immobilization. According to the high performance of Pt@Au as a transducer and its application in the dense loading of biotinylated Ab, the created immunosensor demonstrated excellent selectivity responses and acceptable stability with respect to the recognition of HA in human plasma. In the optimized condition, the linear range of the immunosensor for the detection of HA is between 0.156 and 160 ng.mL−1. Also, LLOQ and LOD were obtained as 0.156 ng.mL−1 and 0.039 ng, respectively. Furthermore, the developed platform had improved specificity for HA in the presence of various interfering agents. These results reveal that the Pt@Au nano-alloy has great potential to be a stable and inexpensive sensing substrate for efficient and sensitive HA detection. It is expected that the proposed method can be easily reformed to detect other biomarkers. The performance of the developed biosensor in this work will continuously progress, and the advanced sensor’s structure, which is associated with original biofunctionalized surface immunity, will lead to a robust biosensor that has the ability to be ultra-sensitive, specific, and able to rapidly determine HA in complex samples. The biosensors will benefit diverse sectors such as environmental monitoring, clinical drug discovery, diagnostics, and food quality control.

Supplementary Materials

The following supporting information can be downloaded at https://www.mdpi.com/article/10.3390/chemosensors11070367/s1, Table S1: Some important and widely used methods for the detection of HA; Figure S1: FE-SEM of synthesized nanocomposite (Au@Pt) on the surface of gold electrodes at different magnifications; Figure S2: FE-SEM of the HA antibody-BSA at different magnifications; Figure S3: FE-SEM of the HA Antibody-BSA-Ag at different magnifications; Figure S4: (A) SWVs of the engineered immune-platform in the presence of various concentrations (0.312, 0.156, 0.078, and 0.039 ng.mL−1) of HA in human plasma samples. (B) Histogram of the peak current of various concentrations of HA. (C) Calibration curve (n = 3; SD = 3.68); Figure S5: (A) DPV of the immunosensor in the presence of various interfering agent (PSA, CEA, CA15-3, and SNCA) techniques for the investigation of selectivity (Tequilibration: 2 s; Ebegin: −1.0 V; Eend: 1.0 V; Estep: 0.1 V; Epulse: 0.005 V; Tpulse: 0.2 s; scan rate: 0.1 V.s). (B) Histogram of the peak current of the immunosensor versus interfering species (n = 3; SD = 0.99); Figure S6: (A) CV of the Au-(Pt@Au) nano-alloy technique for the investigation of stability (1–173 cycles). CV technique with data of the following: Equilibration: 0 s; Ebegin: −1.0 V; Evertex1: 1.0 V; Evertex2: −1.0 V; Estep: 0.01 V; scan rate: 0.1 V.s. (B) Histogram of the peak current of the Au-(Pt@Au) nano-alloy (n = 3; SD = 0.74); Figure S7: (A) CVs of Au-(Pt@Au) nano-alloy when using different storage techniques for the investigation of stability (0–5 h). CV technique with data of the following: Tequilibration: 0 s; Ebegin: −1.0 V; Evertex1: 1.0 V; Evertex2: −1.0 V; Estep: 0.01 V; scan rate: 0.1 V.s. (B) Histogram of inter-day stability. Supporting electrolyte is 0.5 mM of K4Fe (CN)6/K3Fe (CN)6 (n = 3; SD = 3.21); Figure S8: (A) CVs of the Au-(Pt@Au) nano-alloy at the same concentration of Ag for the investigation of reproducibility. CV technique with data of the following: Tequilibration: 0 s; Ebegin: −1.0 V; Evertex1: 1.0 V; Evertex2: −1.0 V; Estep: 0.01 V; scan rate: 0.1 V.s. (B) Histogram of reproducibility. Supporting electrolyte is 0.5 mM of K4Fe (CN)6/K3Fe (CN)6 (n = 3; SD = 0.74). References [35,36,37] are cited in the Supplementary Materials.

Author Contributions

Conceptualization: S.D. and M.H.; data curation: F.K.; formal analysis: F.K.; funding acquisition: S.D.; investigation: A.M.; methodology: M.H.; project administration: S.D.; software: F.K.; supervision: S.D. and M.H.; validation: S.K.S.; writing—original draft: A.M. and S.D.; writing—review and editing: S.K.S. and M.H. All authors have read and agreed to the published version of the manuscript.

Funding

This research received funding from Tabriz University of Medical Sciences, Tabriz, Iran (Grant number: 66061).

Institutional Review Board Statement

Not applicable.

Informed Consent Statement

Not applicable.

Data Availability Statement

Not applicable.

Acknowledgments

This study was supported by the Aging Research Institute, Tabriz University of Medical Sciences, Tabriz, Iran (Grant number: 66061), and the Pharmaceutical Analysis Research Center, Tabriz, University of Medical Science, Tabriz, Iran.

Conflicts of Interest

The authors declare that they have no known competing financial interest or personal relationship that could have appeared to influence the work reported in this paper.

References

  1. Zhai, P.; Peng, X.; Li, B.; Liu, Y.; Sun, H.; Li, X. The application of hyaluronic acid in bone regeneration. Int. J. Biol. Macromol. 2019, 151, 1224–1239. [Google Scholar] [CrossRef] [PubMed]
  2. Velesiotis, C.; Vasileiou, S.; Vynios, D.H. A guide to hyaluronan and related enzymes in breast cancer: Biological significance and diagnostic value. FEBS J. 2019, 286, 3057–3074. [Google Scholar] [CrossRef] [PubMed] [Green Version]
  3. Spadea, A.; de la Rosa, J.M.R.; Tirella, A.; Ashford, M.B.; Williams, K.J.; Stratford, I.J.; Tirelli, N.; Mehibel, M. Evaluating the Efficiency of Hyaluronic Acid for Tumor Targeting via CD44. Mol. Pharm. 2019, 16, 2481–2493. [Google Scholar] [CrossRef]
  4. Gupta, R.C.; Lall, R.; Srivastava, A.; Sinha, A. Hyaluronic Acid: Molecular Mechanisms and Therapeutic Trajectory. Front. Veter- Sci. 2019, 6, 192. [Google Scholar] [CrossRef] [Green Version]
  5. Neuman, M.G.; Cohen, L.B.; Nanau, R.M. Hyaluronic acid as a non-invasive biomarker of liver fibrosis. Clin. Biochem. 2016, 49, 302–315. [Google Scholar] [CrossRef]
  6. Schwertfeger, K.; Cowman, M.; Telmer, P.; Turley, E.; McCarthy, J. Hyaluronan, inflammation, and breast cancer progression. Front. Immunol. 2015, 6, 236. [Google Scholar] [CrossRef]
  7. Misra, S.; Hascall, V.C.; Markwald, R.R.; Ghatak, S. Interactions between Hyaluronan and Its Receptors (CD44, RHAMM) Regulate the Activities of Inflammation and Cancer. Front. Immunol. 2015, 6, 201. [Google Scholar] [CrossRef] [Green Version]
  8. Mobed, A.; Dolati, S.; Shakouri, S.; Eftekharsadat, B.; Izadseresht, B. Recent advances in biosensors for detection of Osteoar-thritis and Rheumatoid Arthritis biomarkers. Sens. Actuators A Phys. 2021, 331, 112975. [Google Scholar] [CrossRef]
  9. Sasaki, E.; Tsuda, E.; Yamamoto, Y.; Maeda, S.; Inoue, R.; Chiba, D.; Fujita, H.; Takahashi, I.; Umeda, T.; Nakaji, S.; et al. Serum hyaluronic acid concentration predicts the progression of joint space narrowing in normal knees and established knee osteoarthritis—A five-year prospective cohort study. Thromb. Haemost. 2015, 17, 283. [Google Scholar] [CrossRef] [PubMed] [Green Version]
  10. Saruga, T.; Sasaki, E.; Inoue, R.; Chiba, D.; Ota, S.; Iwasaki, H.; Uesato, R.; Nakaji, S.; Ishibashi, Y. Usefulness of serum hyaluronic acid levels as a predictor of incidence of hand osteoarthritis analyzed by longitudinal analysis from the Iwaki cohort. Sci. Rep. 2021, 11, 4074. [Google Scholar] [CrossRef] [PubMed]
  11. Singh, S.; Kumar, D.; Sharma, N. Role of hyaluronic acid in early diagnosis of knee osteoarthritis. J. Clin. Diagn. Res. 2014, 8, LC04. [Google Scholar] [CrossRef] [PubMed]
  12. Verhoeven, C.J.; Farid, W.R.; de Jonge, J.; Metselaar, H.J.; Kazemier, G.; van der Laan, L.J. Biomarkers to assess graft quality during conventional and machine preservation in liver transplantation. J. Hepatol. 2014, 61, 672–684. [Google Scholar] [CrossRef] [PubMed] [Green Version]
  13. Gudowska, M.; Cylwik, B.; Chrostek, L. The role of serum hyaluronic acid determination in the diagnosis of liver diseases. Acta Biochim. Pol. 2017, 64, 451–457. [Google Scholar] [CrossRef] [PubMed]
  14. Orasan, O.H.; Ciulei, G.; Cozma, A.; Sava, M.; Dumitrascu, D.L. Hyaluronic acid as a biomarker of fibrosis in chronic liver diseases of different etiologies. Med. Pharm. Rep. 2016, 89, 24–31. [Google Scholar] [CrossRef] [Green Version]
  15. Rostved, A.A.; Ostrowski, S.R.; Peters, L.; Lundgren, J.D.; Hillingsø, J.; Johansson, P.I.; Rasmussen, A. Hyaluronic Acid Is a Biomarker for Allograft Dysfunction and Predicts 1-Year Graft Loss After Liver Transplantation. Transplant. Proc. 2018, 50, 3635–3643. [Google Scholar] [CrossRef]
  16. Haserodt, S.; Aytekin, M.; Dweik, R.A. A comparison of the sensitivity, specificity, and molecular weight accuracy of three different commercially available Hyaluronan ELISA-like assays. Glycobiology 2010, 21, 175–183. [Google Scholar] [CrossRef] [Green Version]
  17. Suzuki, A.; Angulo, P.; Lymp, J.; Li, D.; Satomura, S.; Lindor, K. Hyaluronic acid, an accurate serum marker for severe hepatic fibrosis in patients with non-alcoholic fatty liver disease. Liver Int. 2005, 25, 779–786. [Google Scholar] [CrossRef]
  18. Cao, Y.; Liu, X.; Guo, S.-W. Plasma High Mobility Group Box 1 (HMGB1), Osteopontin (OPN), and Hyaluronic Acid (HA) as Admissible Biomarkers for Endometriosis. Sci. Rep. 2019, 9, 9272. [Google Scholar] [CrossRef] [Green Version]
  19. Li, Y.; Jiang, D.; Liang, J.; Meltzer, E.B.; Gray, A.; Miura, R.; Wogensen, L.; Yamaguchi, Y.; Noble, P.W. Severe lung fibrosis requires an invasive fibroblast phenotype regulated by hyaluronan and CD44. J. Exp. Med. 2011, 208, 1459–1471. [Google Scholar] [CrossRef] [Green Version]
  20. Peng, C.; Wallwiener, M.; Rudolph, A.; Ćuk, K.; Eilber, U.; Celik, M.; Modugno, C.; Trumpp, A.; Heil, J.; Marmé, F. Plasma hyaluronic acid level as a prognostic and monitoring marker of metastatic breast cancer. Int. J. Cancer 2016, 138, 2499–2509. [Google Scholar] [CrossRef] [Green Version]
  21. Skarmoutsos, I.; Skarmoutsos, A.; Katafigiotis, I.; Tataki, E.; Giagini, A.; Adamakis, I.; Alamanis, C.; Duvdevani, M.; Sitaras, N.; Constantinides, C. Hyaluronic acid and hyaluronidase as possible novel urine biomarkers for the diagnosis of prostate cancer. Med. Oncol. 2018, 35, 97. [Google Scholar] [CrossRef]
  22. Morera, D.; Hennig, M.S.; Talukder, A.; Lokeshwar, S.D.; Wang, J.; Garcia-Roig, M.; Ortiz, N.; Yates, T.J.; Lopez, L.E.; Kallifatidis, G.; et al. Hyaluronic acid family in bladder cancer: Potential prognostic biomarkers and therapeutic targets. Br. J. Cancer 2017, 117, 1507–1517. [Google Scholar] [CrossRef]
  23. Yahya, R.; El-Bindary, A.; El-Mezayen, H.; Abdelmasseh, H.; Eissa, M. Biochemical Evaluation of Hyaluronic Acid in Breast Cancer. Clin. Lab. 2014, 60, 1115–1121. [Google Scholar] [CrossRef] [PubMed]
  24. Schmaus, A.; Klusmeier, S.; Rothley, M.; Dimmler, A.; Sipos, B.; Faller, G.; Thiele, W.; Allgayer, H.; Hohenberger, P.; Post, S. Accumulation of small hyaluronan oligosaccharides in tumour interstitial fluid correlates with lymphatic invasion and lymph node metastasis. Br. J. Cancer 2014, 111, 559–567. [Google Scholar] [CrossRef] [PubMed] [Green Version]
  25. Aghcheli, K.; Parsian, H.; Qujeq, D.; Talebi, M.; Mosapour, A.; Khalilipour, E.; Islami, F.; Semnani, S.; Malekzadeh, R. Serum hyaluronic acid and laminin as potential tumor markers for upper gastrointestinal cancers. Eur. J. Intern. Med. 2012, 23, 58–64. [Google Scholar] [CrossRef] [PubMed] [Green Version]
  26. Stern, M.; Stern, R. An ELISA-like assay for hyaluronidase and hyaluronidase inhibitors. Matrix 1992, 12, 397–403. [Google Scholar] [CrossRef]
  27. Ge, M.; Bai, P.; Chen, M.; Tian, J.; Hu, J.; Zhi, X.; Yin, H.; Yin, J. Utilizing hyaluronic acid as a versatile platform for fluorescence resonance energy transfer-based glucose sensing. Anal. Bioanal. Chem. 2018, 410, 2413–2421. [Google Scholar] [CrossRef]
  28. Liu, X.; Huang, R.; Su, R.; Qi, W.; Wang, L.; He, Z. Grafting Hyaluronic Acid onto Gold Surface to Achieve Low Protein Fouling in Surface Plasmon Resonance Biosensors. ACS Appl. Mater. Interfaces 2014, 6, 13034–13042. [Google Scholar] [CrossRef]
  29. Eliezer, M.; Sculean, A.; Miron, R.J.; Nemcovsky, C.; Weinberg, E.; Weinreb, M.; Zoabi, H.; Bosshardt, D.D.; Fujioka-Kobayashi, M.; Moses, O. Hyaluronic acid slows down collagen membrane degradation in uncontrolled diabetic rats. J. Periodontal Res. 2019, 54, 644–652. [Google Scholar] [CrossRef]
  30. Pepeliaev, S.; Hrudíková, R.; Jílková, J.; Pavlík, J.; Smirnou, D.; Černý, Z.; Franke, L. Colorimetric enzyme-coupled assay for hyaluronic acid determination in complex samples. Eur. Polym. J. 2017, 94, 460–470. [Google Scholar] [CrossRef]
  31. Buledi, J.A.; Mahar, N.; Mallah, A.; Solangi, A.R.; Palabiyik, I.M.; Qambrani, N.; Karimi, F.; Vasseghian, Y.; Karimi-Maleh, H. Electrochemical quantification of mancozeb through tungsten oxide/reduced graphene oxide nanocomposite: A potential method for environmental remediation. Food Chem. Toxicol. 2022, 161, 112843. [Google Scholar] [CrossRef] [PubMed]
  32. Cheraghi, S.; Taher, M.A.; Karimi-Maleh, H.; Karimi, F.; Shabani-Nooshabadi, M.; Alizadeh, M.; Al-Othman, A.; Erk, N.; Raman, P.K.Y.; Karaman, C. Novel enzymatic graphene oxide based biosensor for the detection of glutathione in biological body fluids. Chemosphere 2021, 287, 132187. [Google Scholar] [CrossRef] [PubMed]
  33. Li, D.; Qin, J.; Lv, J.; Yang, J.; Yan, G. “Turn on” room-temperature phosphorescent biosensors for detection of hyaluronic acid based on manganese-doped ZnS quantum dots. RSC Adv. 2018, 8, 2873–2879. [Google Scholar] [CrossRef] [Green Version]
  34. Hayase, S.; Oda, Y.; Honda, S.; Kakehi, K. High-performance capillary electrophoresis of hyaluronic acid: Determination of its amount and molecular mass. J. Chromatogr. A 1997, 768, 295–305. [Google Scholar] [CrossRef] [PubMed]
  35. Hokputsa, S.; Jumel, K.; Alexander, C.; Harding, S.E. A comparison of molecular mass determination of hyaluronic acid using SEC/MALLS and sedimentation equilibrium. Eur. Biophys. J. 2003, 32, 450–456. [Google Scholar] [CrossRef]
  36. Ahmed, S.; Ning, J.; Peng, D.; Chen, T.; Ahmad, I.; Ali, A.; Lei, Z.; Shabbir, M.A.B.; Cheng, G.; Yuan, Z. Current advances in immunoassays for the detection of antibiotics residues: A review. Food Agric. Immunol. 2020, 31, 268–290. [Google Scholar] [CrossRef]
  37. Gonzales, W.V.; Mobashsher, A.; Abbosh, A. The progress of glucose monitoring—A review of invasive to minimally and non-invasive techniques, devices and sensors. Sensors 2019, 19, 800. [Google Scholar] [CrossRef] [Green Version]
  38. Kangas, M.J.; Burks, R.M.; Atwater, J.; Lukowicz, R.M.; Williams, P.; Holmes, A.E. Colorimetric Sensor Arrays for the Detection and Identification of Chemical Weapons and Explosives. Crit. Rev. Anal. Chem. 2017, 47, 138–153. [Google Scholar] [CrossRef] [Green Version]
  39. Kumar, S.; Sharma, J.G.; Maji, S.; Malhotra, B.D. Nanostructured zirconia decorated reduced graphene oxide based efficient biosensing platform for non-invasive oral cancer detection. Biosens. Bioelectron. 2015, 78, 497–504. [Google Scholar] [CrossRef]
  40. Vashist, S.K. Comparison of 1-Ethyl-3-(3-Dimethylaminopropyl) Carbodiimide Based Strategies to Crosslink Antibodies on Amine-Functionalized Platforms for Immunodiagnostic Applications. Diagnostics 2012, 2, 23–33. [Google Scholar] [CrossRef] [Green Version]
Figure 1. FESEM images related to (A) AuE-(Au@Pt), (B) AuE-(Au@Pt)-Ab-BSA, and (C) AuE-(Au@Pt)-Ab-BSA-Ag.
Chemosensors 11 00367 g001
Scheme 1. EDC/NHS conjugation with biotinylated antibody/antigen.
Chemosensors 11 00367 sch001
Scheme 2. Schematic illustration of the engineered immunosensor toward the recognition of HA.
Chemosensors 11 00367 sch002
Figure 2. (A,B) CVs and DPVs of bare Au, Au-(Pt@Au), Au-(pt@Au)/biotinylated Ab, Au-(pt@Au)-biotinylated Ab-BSA, and Au-(pt@Au)-biotinylated Ab-BSA-HA (Antigen) gold bare electrode modified with Pt@Au-(Ab/ Ab-BSA/ Ab-BSA-HA): tequilibration: 2 s; Ebegin: −1.0 V; Eend: 1.0 V; Estep: 0.1 V; Epulse: 0.005 V; Tpulse: 0.2 s; scan rate: 0.1 V.s. CV technique with the data of the following: Tequilibration: 0 s; Ebegin: −1.0 V; Evertex1: 1.0 V; Evertex2: −1.0 V; Estep: 0.01 V; scan rate: 0.1 V.s. (C) and (D): Histograms of peak current versus type of electrodes (n = 3, SD = 1.79; n = 3, SD = 1.94, respectively). The supporting electrolyte is K4Fe(CN)6/K3Fe(CN)6/KCl.
Chemosensors 11 00367 g002
Figure 3. (A,C): SWVs of the engineered immune platform in the presence of various high-concentration (160, 80, 40, and 20 ng.mL−1) and low-concentration (10, 5, 2.5, 1.25, 0.625, 0.312, and 0.156 ng.mL−1) HA in K4Fe (CN)6/K3Fe (CN)6 (0.5 mM) and KCl 0.1 M environment. (B,D) Calibration curve of Ip vs. Log C (ng.mL−1). n = 3 and SD = 1.15 for the standard concentrations of antigens included in the ELISA Kit; n = 3 and SD = 1.46 for lower concentrations.
Chemosensors 11 00367 g003
Table 1. Some important and widely used methods for the detection of HA.
TechniqueAdvantagesDisadvantage and LimitationRef.
RadioimmunoassaySimple, convenient, noninvasive credible, low-cost method, small sample volumeLow specificity, low automation, absence of separation step, short half-life label, high health hazards due to the radioactivity[36]
Fluorescent-Based ImmunoassaysHigh specificity due to the exceptional optical properties of the molecules, measurement of analyte concentration using fluorescence and decay time, excellent reproducibilitySusceptible to interference due to pH changes and oxygen levels, costs are substantially high, skilled personnel, fluorescent labeling[37]
ELISASensitive, rapid, low-cost method, time saving, strong affinityNeed a large sample size, antibody variability, cross reactivity, time consuming, not sensitive enough to detect sample volumes that are too small, false positive[36]
ColorimetricFast, low-cost method, small sample size, ability to customize array for specific analyte, flexible array size, potential to analyze liquid samplesLow reproducibility of imaging and printing, sample application may vary, low selectivity, low stability[38]
Table 2. Developed methods for the detection of HA.
Platform/TechniqueSample/ModelElectrodeLinear RangeLODRef.
EC/CVAnimalGCE1–800 μM0.42 μM[32]
HPLCBiologicalNA0.01 mg/mL to 3.3 mg/mL1.0 μg/mL[34]
SEC/MALLSSyntheticNA(16.5–21.1) × 104Unavailable[35]
ColorimetricComplex samplesNA_3–2000 mg/L0.3 mg/L[30]
RTP/QDsReal samplesNP0.08–2.8 μg mL−10.03 μg mL−1[33]
EC/Pt@Au NanoReal samplesGold0.156–160 ng.mL−10.039 ng.mL−1This work
(SEC/MALLS): Size exclusion chromatography/multi-angle laser light scattering; NA: not applicable.
Disclaimer/Publisher’s Note: The statements, opinions and data contained in all publications are solely those of the individual author(s) and contributor(s) and not of MDPI and/or the editor(s). MDPI and/or the editor(s) disclaim responsibility for any injury to people or property resulting from any ideas, methods, instructions or products referred to in the content.

