

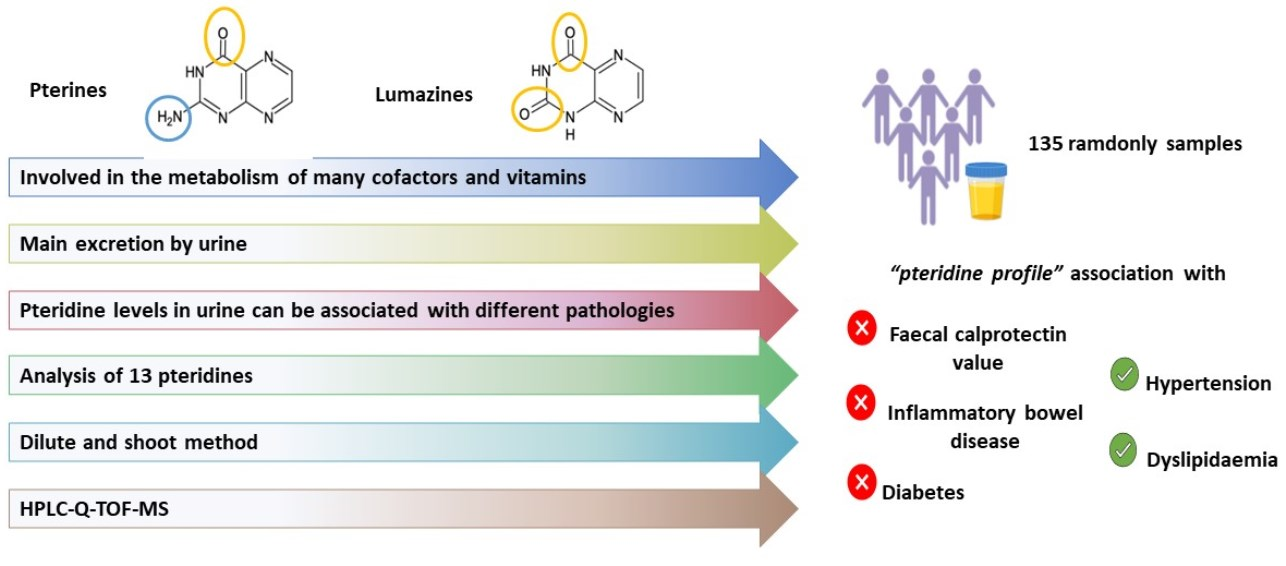
Dilute-and-Shoot-Liquid Chromatography-Quadrupole Time of Flight-Mass Spectrometry for Pteridine Profiling in Human Urine and Its Association with Different Pathologies

 , , ,
, , ,
Abstract
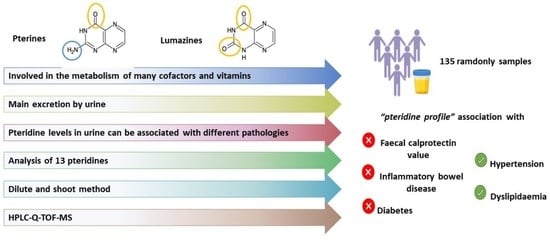
1. Introduction
2. Materials and Methods
2.1. Reagents
2.2. Instrumentation
2.3. Samples and Analytical Procedure
3. Results and Discussion
3.1. Optimization of Separation and Detection Conditions
3.2. Method Validation
3.3. Analysis of Urine Samples and Occurrence Study
4. Conclusions
Supplementary Materials
Author Contributions
Funding
Institutional Review Board Statement
Informed Consent Statement
Data Availability Statement
Acknowledgments
Conflicts of Interest
References
- Daniels, B.J.; Li, F.F.; Furkert, D.P.; Brimble, M.A. Naturally Occurring Lumazines. J. Nat. Prod. 2019, 82, 2054–2065. [Google Scholar] [CrossRef]
- Burton, C.; Ma, Y. The role of urinary pteridines as disease biomarkers. Pteridines 2017, 28, 1–21. [Google Scholar] [CrossRef]
- Carmona-Martínez, V.; Ruiz-Alcaraz, A.J.; Vera, M.; Guirado, A.; Martínez-Esparza, M.; García-Peñarrubia, P. Therapeutic potential of pteridine derivatives: A comprehensive review. Med. Res. Rev. 2019, 39, 461–516. [Google Scholar] [CrossRef] [PubMed]
- Plata-Nazar, K.; Jankowska, A. Clinical usefulness of determining the concentration of neopterin. Pteridines 2011, 22, 77–89. [Google Scholar] [CrossRef]
- Scholl-Buergi, S.; Neurauter, G.; Karall, D.; Fuchs, D. Serum phenylalanine concentrations in patients post trauma and burn correlate to neopterin concentrations. J. Inherit. Metab. Dis. 2009, 32, 587–588. [Google Scholar] [CrossRef]
- Ozkan, Y.; Mete, G.; Sepici-Dincel, A.; Sepici, V.; Simsek, B. Tryptophan degradation and neopterin levels in treated rheumatoid arthritis patients. Clin. Rheumatol. 2012, 31, 29–34. [Google Scholar] [CrossRef] [PubMed]
- Ma, Y.; Burton, C. Pteridine detection in urine: The future of cancer diagnostics? Biomark. Med. 2013, 7, 679–681. [Google Scholar] [CrossRef] [PubMed]
- Murr, C.; Widner, B.; Wirleitner, B.; Fuchs, D. Neopterin as a Marker for Immune System Activation. Curr. Drug Metab. 2005, 3, 175–187. [Google Scholar] [CrossRef]
- Kośliński, P.; Daghir-Wojtkowiak, E.; Szatkowska-Wandas, P.; Markuszewski, M.; Markuszewski, M.J. The metabolic profiles of pterin compounds as potential biomarkers of bladder cancer—Integration of analytical-based approach with biostatistical methodology. J. Pharm. Biomed. Anal. 2016, 127, 256–262. [Google Scholar] [CrossRef]
- Burton, C.; Shi, H.; Ma, Y. Normalization of urinary pteridines by urine specific gravity for early cancer detection. Clin. Chim. Acta 2014, 435, 42–47. [Google Scholar] [CrossRef]
- Saw, A.C. Serum C-reactive protein and neopterin concentrations in patients with viral or bacterial infections. J. Clin. Pathol. 1991, 44, 596–599. [Google Scholar] [CrossRef] [PubMed]
- Gürcü, S.; Girgin, G.; Yorulmaz, G.; Kılıçarslan, B.; Efe, B.; Baydar, T. Neopterin and biopterin levels and tryptophan degradation in patients with diabetes. Sci. Rep. 2020, 10, 17025. [Google Scholar] [CrossRef] [PubMed]
- Cieślewicz, A.; Korzeniowska, K.; Bogdański, P.; Jabłecka, A. Increased neopterin concentration in patients with primary arterial hypertension. J. Med. Sci. 2015, 4, 213–217. [Google Scholar] [CrossRef]
- Nielsen, O.H.; Vainer, B.; Madsen, S.M.; Seidelin, J.B.; Heegaard, N.H.H. Established and emerging biological activity markers of inflammatory bowel disease. Am. J. Gastroenterol. 2000, 95, 359–367. [Google Scholar] [CrossRef]
- Husain, N.; Tokoro, K.; Popov, J.M.; Naides, S.J.; Kwasny, M.J.; Buchman, A.L. Neopterin concentration as an index of disease activity in Crohn’s disease and ulcerative colitis. J. Clin. Gastroenterol. 2013, 47, 246–251. [Google Scholar] [CrossRef]
- Forrest, C.M.; Youd, P.; Kennedy, A.; Gould, S.R.; Darlington, L.G.; Stone, T.W. Purine, kynurenine, neopterin and lipid peroxidation levels in inflammatory bowel disease. J. Biomed. Sci. 2002, 9, 436–442. [Google Scholar] [CrossRef]
- Propst, A.; Propst, T.; Herold, M.; Vogel, W.; Judmaier, G. Interleukin-1 receptor antagonist in differential diagnosis of inflammatory bowel diseases. Eur. J. Gastroenterol. Hepatol. 1995, 7, 1031–1036. [Google Scholar] [CrossRef]
- Duclos, B.; Reimund, J.M.; Lang, J.M.; Coumaros, G.; Chamouard, P.; Lehr, L.; Baumann, R.; Koehl, C.; Weill, J.P. Mononuclear cell activation in Crohn’s disease. Evaluation using serum assay of neopterin and interleukin-2 soluble receptors. Gastroenterol. Clin. Biol. 1990, 14, 22–27. [Google Scholar]
- Prior, C.; Bollbach, R.; Fuchs, D.; Hausen, A.; Judmaier, G.; Niederwieser, D.; Reibnegger, G.; Rotthauwe, H.W.; Werner, E.R.; Wachter, H. Urinary neopterin, a marker of clinical activity in patients with Crohn’s disease. Clin. Chim. Acta 1986, 155, 11–21. [Google Scholar] [CrossRef]
- Bjarnason, I. The use of fecal calprotectin in inflammatory bowel disease. Gastroenterol. Hepatol. 2017, 13, 53–56. [Google Scholar]
- Sacco, A.J.; Mayhew, J.A.; Watsa, M.; Erkenswick, G.; Binder, A.K. Detection of neopterin in the urine of captive and wild platyrrhines. BMC Zool. 2020, 5, 1–8. [Google Scholar] [CrossRef]
- Gibbons, S.E.; Stayton, I.; Ma, Y. Optimization of urinary pteridine analysis conditions by CE-LIF for clinical use in early cancer detection. Electrophoresis 2009, 30, 3591–3597. [Google Scholar] [CrossRef] [PubMed]
- Durán Merás, I.; Espinosa Mansilla, A.; Rodríguez Gómez, M.J. Determination of methotrexate, several pteridines, and creatinine in human urine, previous oxidation with potassium permanganate, using HPLC with photometric and fluorimetric serial detection. Anal. Biochem. 2005, 346, 201–209. [Google Scholar] [CrossRef] [PubMed]
- Culzoni, M.J.; Mancha De Llanos, A.; De Zan, M.M.; Espinosa-Mansilla, A.; Cañada-Cañada, F.; Muñoz De La Peña, A.; Goicoechea, H.C. Enhanced MCR-ALS modeling of HPLC with fast scan fluorimetric detection second-order data for quantitation of metabolic disorder marker pteridines in urine. Talanta 2011, 85, 2368–2374. [Google Scholar] [CrossRef]
- Ormazabal, A.; García-Cazorla, A.; Fernández, Y.; Fernández-Álvarez, E.; Campistol, J.; Artuch, R. HPLC with electrochemical and fluorescence detection procedures for the diagnosis of inborn errors of biogenic amines and pterins. J. Neurosci. Methods 2005, 142, 153–158. [Google Scholar] [CrossRef]
- De Llanos, A.M.; Espinosa-Mansilla, A.; Cañada-Cañada, F.; De La Peńa, A.M. Separation and determination of 11 marker pteridines in human urine by liquid chromatography and fluorimetric detection. J. Sep. Sci. 2011, 34, 1283–1292. [Google Scholar] [CrossRef]
- Tomšíková, H.; Solich, P.; Nováková, L. Sample preparation and UHPLC-FD analysis of pteridines in human urine. J. Pharm. Biomed. Anal. 2014, 95, 265–272. [Google Scholar] [CrossRef]
- Xiong, X.; Zhang, Y.; Zhang, W. Simultaneous determination of twelve polar pteridines including dihydro- and tetrahydropteridine in human urine by hydrophilic interaction liquid chromatography with tandem mass spectrometry. Biomed. Chromatogr. 2018, 32, e4244. [Google Scholar] [CrossRef]
- Tomandl, J.; Tallova, J.; Tomandlova, M.; Palyza, V. Determination of total oncopterin, neopterin and biopterin in human urine by high performance liquid chromatography with solid phase extraction. J. Sep. Sci. 2003, 26, 674–678. [Google Scholar] [CrossRef]
- Burton, C.; Shi, H.; Ma, Y. Development of a High-Performance Liquid Chromatography—Tandem Mass Spectrometry Urinary Pterinomics Workflow. Anal. Chim. Acta 2016, 927, 72–81. [Google Scholar] [CrossRef]
- Lindsay, A.; Healy, J.; Mills, W.; Lewis, J.; Gill, N.; Draper, N.; Gieseg, S.P. Impact-induced muscle damage and urinary pterins in professional rugby: 7,8-dihydroneopterin oxidation by myoglobin. Scand. J. Med. Sci. Sports 2016, 26, 329–337. [Google Scholar] [CrossRef] [PubMed]
- Jiménez Girón, A.; Martín-Tornero, E.; Hurtado Sánchez, M.C.; Durán Merás, I.; Espinosa Mansilla, A. A simple HPLC-ESI-MS method for the direct determination of ten pteridinic biomarkers in human urine. Talanta 2012, 101, 465–472. [Google Scholar] [CrossRef] [PubMed]
- Burton, C.; Shi, H.; Ma, Y. Simultaneous detection of six urinary pteridines and creatinine by high-performance liquid chromatography-tandem mass spectrometry for clinical breast cancer detection. Anal. Chem. 2013, 85, 11137–11145. [Google Scholar] [CrossRef] [PubMed]
- Burton, C.; Weng, R.; Yang, L.; Bai, Y.; Liu, H.; Ma, Y. High-throughput intracellular pteridinic profiling by liquid chromatography-quadrupole time-of-flight mass spectrometry. Anal. Chim. Acta 2015, 853, 442–450. [Google Scholar] [CrossRef]
- Tomšíková, H.; Tomšík, P.; Solich, P.; Nováková, L. Determination of pteridines in biological samples with an emphasis on their stability. Bioanalysis 2013, 5, 2307–2326. [Google Scholar] [CrossRef]
- Deventer, K.; Pozo, O.J.; Verstraete, A.G.; Van Eenoo, P. Dilute-and-shoot-liquid chromatography-mass spectrometry for urine analysis in doping control and analytical toxicology. TrAC Trends Anal. Chem. 2014, 55, 1–13. [Google Scholar] [CrossRef]
- Greer, B.; Chevallier, O.; Quinn, B.; Botana, L.M.; Elliott, C.T. Redefining dilute and shoot: The evolution of the technique and its application in the analysis of foods and biological matrices by liquid chromatography mass spectrometry. TrAC Trends Anal. Chem. 2021, 141, 116284. [Google Scholar] [CrossRef]
- Dahlin, J.L.; Palte, M.J.; LaMacchia, J.; Petrides, A.K. A rapid dilute-and-shoot UPLC-MS/MS assay to simultaneously measure 37 drugs and related metabolites in human urine for use in clinical pain management. J. Appl. Lab. Med. 2019, 3, 974–992. [Google Scholar] [CrossRef]
- Tudela, E.; Deventer, K.; Geldof, L.; Van Eenoo, P. Urinary detection of conjugated and unconjugated anabolic steroids by dilute-and-shoot liquid chromatography-high resolution mass spectrometry. Drug Test. Anal. 2015, 7, 95–108. [Google Scholar] [CrossRef]
- Görgens, C.; Guddat, S.; Orlovius, A.K.; Sigmund, G.; Thomas, A.; Thevis, M.; Schänzer, W. “Dilute-and-inject” multi-target screening assay for highly polar doping agents using hydrophilic interaction liquid chromatography high resolution/high accuracy mass spectrometry for sports drug testing. Anal. Bioanal. Chem. 2015, 407, 5365–5379. [Google Scholar] [CrossRef]
- Kwok, W.H.; Choi, T.L.S.; Kwok, K.Y.; Chan, G.H.M.; Wong, J.K.Y.; Wan, T.S.M. Doping control analysis of 46 polar drugs in horse plasma and urine using a “dilute-and-shoot” ultra high performance liquid chromatography-high resolution mass spectrometry approach. J. Chromatogr. 2016, 1451, 41–49. [Google Scholar] [CrossRef] [PubMed]
- Alcántara-Durán, J.; Moreno-González, D.; Beneito-Cambra, M.; García-Reyes, J.F. Dilute-and-shoot coupled to nanoflow liquid chromatography high resolution mass spectrometry for the determination of drugs of abuse and sport drugs in human urine. Talanta 2018, 182, 218–224. [Google Scholar] [CrossRef] [PubMed]
- Espinosa-Mansilla, A.; Durán-Merás, I. Pteridine determination in human serum with special emphasis on HPLC methods with fluorimetric detection. Pteridines 2017, 28, 67–81. [Google Scholar] [CrossRef]
- Kozlík, P.; Krajíček, J.; Kalíková, K.; Tesařová, E.; Čabala, R.; Exnerová, A.; Štys, P.; Bosáková, Z. Hydrophilic interaction liquid chromatography with tandem mass spectrometric detection applied for analysis of pteridines in two Graphosoma species (Insecta: Heteroptera). J. Chromatogr. B Anal. Technol. Biomed. Life Sci. 2013, 930, 82–89. [Google Scholar] [CrossRef]
- Commission Decision 2002/657/EC Commission Decision 2002/657/EC of 12 August 2002 implementing Council Directive 96/23/EC concerning the performance of analytical methods and the interpretation of results. Off. J. Eur. Union 2002, L221, 8–36.
- European Medicines Agency. Guideline on Bioanalytical Method Validation; Committee for Medicinal Products for Human Use: Amsterdam, The Netherlands, 2009; pp. 1–26. [Google Scholar]
- Beckman Coulter Ireland Inc. Cretinine Instructions for Use; Beckman Coulter, Inc.: Brea, CA, USA, 2021. [Google Scholar]
- Fengming, Y.; Jianbing, W. Biomarkers of inflammatory bowel disease. Dis. Markers 2014, 2014, 710915. [Google Scholar] [CrossRef]


| Compound | tR (min) | Formula | m/z Theoretical | m/z Experimental | Error (ppm) |
|---|---|---|---|---|---|
| 7,8-DHNEO | 5.13 | C9H13N5O4 | 256.1040 | 256.1047 | 2.73 |
| MON | 5.69 | C9H11N5O4 | 254.0884 | 254.0890 | 2.36 |
| NEO | 6.45 | C9H11N5O4 | 254.0884 | 254.0889 | 1.97 |
| 6,7-DMPT | 6.77 | C8H9N5O | 192.0880 | 192.0883 | 1.56 |
| 7,8-DHBIO | 8.04 | C9H13N5O3 | 240.1091 | 240.1096 | 2.08 |
| 6-BIO | 9.10 | C9H11N5O3 | 238.0935 | 238.0941 | 2.52 |
| LEU | 9.41 | C6H5N5O3 | 196.0465 | 196.0472 | 3.57 |
| PT | 9.58 | C6H5N5O | 164.0568 | 164.0571 | 2.44 |
| 6-OHMPT | 10.28 | C7H7N5O2 | 194.0673 | 194.0677 | 2.06 |
| 7,8-DHXAN | 10.45 | C6H7N5O2 | 182.0673 | 182.0681 | 4.39 |
| LU | 10.59 | C6H4N4O2 | 165.0407 | 165.0412 | 3.03 |
| 6-HLU | 11.31 | C6H4N4O3 | 181.0356 | 181.0359 | 1.66 |
| 7-HLU | 13.19 | C6H4N4O3 | 181.0356 | 181.0362 | 1.56 |
| IS | 16.35 | C7H7N5O | 178.0723 | 178.0727 | 2.25 |
| Sensitivity | Precision | |||||||
|---|---|---|---|---|---|---|---|---|
| Compound | LOD a, (ng mL−1) | LOQ b, (ng mL−1) | Repeatability c, (%) | Intermediate Precision d, (%) | ||||
| QC1 | QC2 | QC3 | QC1 | QC2 | QC3 | |||
| 7,8-DHNEO | 0.40 | 1.3 | 5.9 | 5.0 | 4.3 | 8.3 | 7.4 | 6.3 |
| MON | 0.45 | 1.5 | 6.7 | 5.4 | 4.6 | 8.5 | 7.8 | 6.8 |
| NEO | 0.33 | 1.0 | 7.2 | 4.9 | 4.4 | 9.6 | 8.3 | 7.3 |
| 6,7-DMPT | 3.3 | 11 | 6.9 | 5.5 | 4.8 | 8.9 | 7.7 | 6.5 |
| 7,8-DHBIO | 1.0 | 3.3 | 8.6 | 7.3 | 5.4 | 10.5 | 8.8 | 7.1 |
| 6-BIO | 0.70 | 2.3 | 7.5 | 6.4 | 5.1 | 9.8 | 8.4 | 7.4 |
| LEU | 0.75 | 2.5 | 7.2 | 6.6 | 5.2 | 10.1 | 8.5 | 6.9 |
| PT | 0.16 | 0.54 | 7.7 | 5.9 | 4.7 | 9.5 | 7.4 | 6.5 |
| 6-OHMPT | 0.81 | 2.7 | 8.2 | 6.1 | 4.6 | 9.2 | 7.5 | 6.2 |
| 7,8-DHXAN | 9.0 | 30 | 8.4 | 5.8 | 4.3 | 11.3 | 9.1 | 7.9 |
| LU | 1.3 | 4.4 | 7.9 | 6.3 | 4.7 | 10.4 | 8.7 | 7.2 |
| 6-HLU | 13 | 43 | 8.3 | 6.6 | 5.4 | 11.6 | 9.6 | 8.0 |
| 7-HLU | 3.2 | 11 | 7.5 | 6.2 | 4.9 | 10.6 | 9.4 | 7.7 |
| Number of Pteridines | Sample Preparation | Instrumental Analysis | LOQ, (ng mL−1) | Reference |
|---|---|---|---|---|
| 8 | Oxidation I2/I− and dilution | HPLC-MS/MS | 0.08–1.7 | [33] |
| 10 | DS | HPLC-ESI-MS | 5.7–166 | [32] |
| 4 | SPE | UHPLC-FD | 1.0–25 | [27] |
| 8 | Oxidation I2/I− and dilution | CE-LIF | 0.13–0.33 | [22] |
| 13 | Oxidation I2/I− or KMnO4 and dilution | HPLC-FD | 0.67–20.3 | [26] |
| 13 | DS | UHPLC-Q-TOF-MS | 0.54–43 | This work |
| LIF: Laser induced fluorescence. | ||||
| Compound | Range (ng mL−1) a | Range (ng mg−1) b | Mean ± SD (ng mg−1) b | Occurrence (%) | Median (ng mg−1) b |
|---|---|---|---|---|---|
| 7,8-DHNEO | 5.4–455 | 10.7–279 | 88.8 ± 51.5 | 100 | 78.0 |
| MON | 14.2–210 | 8.8–213 | 55.1 ± 38.9 | 100 | 43.7 |
| NEO | 1.0–77.7 | 0.54–33.3 | 4.4 ± 4.7 | 100 | 3.0 |
| 6,7-DMPT | ND | ND | - | - | - |
| 7,8-DHBIO | 15.4–686 | 10.7–388 | 119 ± 82.5 | 100 | 103 |
| 6-BIO | 8.6–723.5 | 12.8–469 | 89.8 ± 80.3 | 100 | 62.8 |
| LEU | ND–14.6 | ND–19.8 | 2.3 ± 3.5 | 79.3 | 0.90 |
| PT | ND–80.0 | ND–66.7 | 16.4 ± 12.2 | 99.3 | 13.7 |
| 6-OHMPT | ND–90.1 | ND–59.7 | 13.8 ± 10.3 | 93.3 | 9.7 |
| 7,8-DHXAN | ND | ND | - | - | - |
| LU | ND | ND | - | - | - |
| 6-HLU | ND | ND | - | - | - |
| 7-HLU | ND-20.6 | ND-18.4 | 5.2 ± 3.8 | 60 | 4.1 |
Disclaimer/Publisher’s Note: The statements, opinions and data contained in all publications are solely those of the individual author(s) and contributor(s) and not of MDPI and/or the editor(s). MDPI and/or the editor(s) disclaim responsibility for any injury to people or property resulting from any ideas, methods, instructions or products referred to in the content. |
© 2023 by the authors. Licensee MDPI, Basel, Switzerland. This article is an open access article distributed under the terms and conditions of the Creative Commons Attribution (CC BY) license (https://creativecommons.org/licenses/by/4.0/).
Share and Cite
Giménez-Campillo, C.; Pastor-Belda, M.; Arroyo-Manzanares, N.; Campillo, N.; Oliver, B.d.V.; Zarauz-García, J.; Sáenz, L.; Viñas, P. Dilute-and-Shoot-Liquid Chromatography-Quadrupole Time of Flight-Mass Spectrometry for Pteridine Profiling in Human Urine and Its Association with Different Pathologies. Chemosensors 2023, 11, 324. https://doi.org/10.3390/chemosensors11060324
Giménez-Campillo C, Pastor-Belda M, Arroyo-Manzanares N, Campillo N, Oliver BdV, Zarauz-García J, Sáenz L, Viñas P. Dilute-and-Shoot-Liquid Chromatography-Quadrupole Time of Flight-Mass Spectrometry for Pteridine Profiling in Human Urine and Its Association with Different Pathologies. Chemosensors. 2023; 11(6):324. https://doi.org/10.3390/chemosensors11060324
Chicago/Turabian StyleGiménez-Campillo, Claudia, Marta Pastor-Belda, Natalia Arroyo-Manzanares, Natalia Campillo, Blanca del Val Oliver, José Zarauz-García, Luis Sáenz, and Pilar Viñas. 2023. "Dilute-and-Shoot-Liquid Chromatography-Quadrupole Time of Flight-Mass Spectrometry for Pteridine Profiling in Human Urine and Its Association with Different Pathologies" Chemosensors 11, no. 6: 324. https://doi.org/10.3390/chemosensors11060324
APA StyleGiménez-Campillo, C., Pastor-Belda, M., Arroyo-Manzanares, N., Campillo, N., Oliver, B. d. V., Zarauz-García, J., Sáenz, L., & Viñas, P. (2023). Dilute-and-Shoot-Liquid Chromatography-Quadrupole Time of Flight-Mass Spectrometry for Pteridine Profiling in Human Urine and Its Association with Different Pathologies. Chemosensors, 11(6), 324. https://doi.org/10.3390/chemosensors11060324