Article

Functionalized Three–Dimensional Graphene Containing Chitosan and Bovine Serum Albumin for Recognizing Chiral Drug Intermediates

1
Jiangsu Key Laboratory of Advanced Catalytic Materials and Technology, Changzhou University, Changzhou 214500, China
2
Huaide College, Changzhou University, Jingjiang 214500, China
*
Authors to whom correspondence should be addressed.
Chemosensors 2023, 11(4), 243; https://doi.org/10.3390/chemosensors11040243
Submission received: 21 March 2023 / Revised: 11 April 2023 / Accepted: 12 April 2023 / Published: 14 April 2023

Abstract

:
Chiral enantiomer recognition has important research significance in the field of analytical chemistry research. At present, most prepared chiral sensors are used for recognizing amino acids, while they are rarely used in the identification of drug intermediates. This work found that combining CS and reduced graphene oxide can enhance conductivity, increasing the recognition effect by connecting CS with BSA. Based on the above preparation, a new type of chiral sensor (3D–rGO–CS–BSA) was synthesized for the identification of drug intermediates, including the 1–Boc–3–hydroxypyrrolidine enantiomer. An obvious difference was achieved (IR/IS = 2.82) in the oxidation peak currents between the two enantiomers. The detection limits of the R–enantiomer and S–enantiomer were 4.85 nM and 11.76 nM, respectively. The proposed electrochemical sensing platform also has better potential for detecting the percentage content of mixed chiral enantiomer drugs.

1. Introduction

Chirality is one of the fundamental properties of natural substances, and there are a lot of chiral molecules in nature and in living organisms [1]. Chirality means that an object and its mirror image cannot be superimposed, just like the left and right hand are mirror images of each other and cannot be superimposed. A chiral object and its mirror image are called enantiomers. Many biological macromolecules, such as proteins, polysaccharides, and nucleic acids, have chirality, which is a significant foundation of life activities. Certainly, science, pharmaceutical, and food science processes are influenced by chirality [2,3]. From a medical point of view, there are obvious differences between drug properties and toxicity, only one enantiomer is associated with their pharmacological activity, while the other enantiomer has no effect or has toxic side effects [4]. such as diazepam, where the S–configuration has a sedative effect and the R–configuration has serious teratogenic reactions with the fetus [5], which has aroused widespread concern in the study of enantiomeric configurations. Controlling the chiral purity of drugs and intermediates is conducive to the safety and effectiveness of drugs [6,7]. There are many kinds of existing methods for analyzing enantiomers, including chromatographic techniques [8,9,10], spectrometry [11], electroanalysis methods [12,13], and so on. Electrochemical enantioselective recognition has become a research hotspot because of its simplicity and rapidity in the fields of medicine and biotechnology [14].
The 1–Boc–3–hydroxymethylpyrrolidine is an essential pharmaceutical intermediate. As with the R–configuration, which can be used as an intermediate of a selective estrogen receptor degradant (SERD) for treating estrogen receptor body–positive breast cancer [15], the S–configuration can be used as an intermediate in the development of bis((isopropoxycarbonyl)oxy) methyl ester prodrugs for anti–platelet aggregation [16]. Thereby, the intermediates introduce chiral raw materials and chiral centers in the synthesis, which need to be controlled in purity to achieve the best effectiveness. Hence, developing a simple and fast identification method becomes vitally important.
Graphene is a 2D single–layer carbon with a hexagonal honeycomb structure composed of sp2 hybrid orbitals [17]. It has broad application prospects in optical, electrical, and mechanical properties, with potential applications in materials science, energy, biomedicine, and drug delivery [18]. As an electrode material, reduced graphene oxide (3D–rGO) has a large specific surface area as well as extraordinary mechanical, thermal, and electrical properties. This kind of material is beneficial to the loading of chiral selective agents, which are characterized by a large number of active sites and high conductivity to improve sensitivity [19,20,21].
Polysaccharides have an extended double–helix conformation and many chiral sites. There are two types of chitosan (CS), namely crustacean deacetylated CS and fungal deacetylated CS [22]. CS has a relatively stable structure and is biocompatible; it has been used in the treatment of skin tissue damage with biomaterials [23] and drug delivery systems [24]. The advantage of containing a large amount of chirality [25,26] has become important for chiral selectivity. In the biochemistry and electrochemistry fields, it is widely used in amino acids [27], food [28], pesticides [29], immunosensors [30], etc., whereas, due to its dielectric and insulation properties, it is rarely used alone for chiral recognition [31]. For example, Pei et al. used CS and sodium alginate (SA) self–assembly to detect tyrosine isomers with a peak current of 7 μA. Jing et al. [13] reported that ptca–functionalized multi–walled carbon nanotubes (MWCNTs) were cross–linked with CS to recognize tryptophan, with a peak current of 35 μA. In this study, the peak current of 3D–rGO–CS/GCE was significantly increased compared with that of 3D–rGO/GCE in 0.1 M KCl containing 5 mM [Fe(CN)6]4−/3− solution.
Bovine serum albumin (BSA) is a natural protein that contains plentiful chiral sites [32]. Moreover, the surface of BSA is rich in various functional groups, such as amino and carboxyl [33], which can be easily combined with different substances through different forces. For example, see Yao et al. [34]. conjugation of ammonium persulfate–doped polyaniline to BSA, which recognizes tryptophan enantiomers, the peak current ratio is 1.95. Lu et al. [6] used BSA, methylene blue (MB), and MWCNT as the components of the prepared electrode for recognizing amine enantiomers; the peak current ratio was 1.56.
In this work, the modified electrode was constructed by hydrogen bonding between CS and BSA on the rGO, which was used as an electrochemical sensing platform to identify the drug intermediate 1–Boc–3–Hydroxypyrrolidine enantiomer. RGO as the substrate has good conductivity, and connecting with CS can strengthen conductivity and amplify the electrochemical signal. CS and BSA are linked by hydrogen bonds, increasing the sensor recognition effect. In the enantiomer mixed solution, different percentages of R–enantiomer were also detected. The modified electrode possesses excellent stability, high reproducibility, and a low detection line. The electrochemical sensor can be used for simple, fast, and efficient chiral recognition.

2. Experimental Section

2.1. Reagents and Apparatus

R–1–Boc–3–hydroxypyrrolidine (98%) and S–1–Boc–3–hydroxypyrrolidine (98%), N–hydroxysuccinimide (NHS, 98%) were prepared by Aladdin chemical reagents Co., Ltd., Shanghai, China; graphene oxide (GO, analytically pure) was obtained from Suzhou Hengqiu Technology Co., Ltd., Suzhou, China; L–cysteine (L–Cys, 98.5%) and ammonia water (NH3·H2O, 25~28%) were acquired from Sinopharm Chemical Reagent Co., Ltd., Shanghai, China; (1–ethyl–(3–dimethylaminopropyl) carbodiimide hydrochloride (EDC·HCl, 95%) was obtained from Shanghai Macklin Biochemical Technology Co., Ltd., Shanghai, China; acetic acid (CH3COOH, 99.5%) was obtained from Shanghai Shenbo Chemical Co., Ltd., Shanghai, China; CS (98%) was received from Aladdin Biochemical Technology Co., Ltd., Shanghai, China; and BSA (analytically pure) was purchased from Shanghai Jinsui Biotechnology Co., Shanghai, China. All solutions were prepared using deionized water.
Cyclic voltammetry (CV), differential pulse voltammetry (DPV), and electrochemical impedance (EIS) were measured using an electrochemical workstation with three electrodes (CHI920C, Shanghai Chenhua Instrument Co., Ltd., Shanghai, China). As the counter electrode, the platinum electrode is used, while the reference electrodes are saturated calomel electrodes, and the working electrode is 3D–rGO–CS–BSA. Scanning electron microscope (SEM) to obtain the morphology characteristics of 3D–rGO–CS–BSA on SUPRA55 Germany. Analysis GO and rGO data were obtained using a UV–visible spectrophotometer (UV–2450, Shanghai Prism Technology Co., Ltd., Shanghai, China). Different sample spectra were acquired using Fourier transform infrared spectroscopy (Nicolet FTIR–8400S spectrometer, Shimadzu). Raman spectroscopy was performed on LabRAM UV–VIS–NIR. X-ray photoelectron energy spectroscopy (XPS, ESCALAB250Xi, Thermo Fisher) measured the 3D–rGO–CS–BSA spectrum. Theta Flex water contact angle instrument (Dahang (Shanghai, China) Co., Ltd.) to test the water contact angle of different samples.

2.2. Preparation of 3D–rGO–CS–BSA/GCE

The preparation process of the modified electrode and enantiomeric recognition are shown in Scheme 1. GO prepared by the improved Hummers method was ultrasonically treated for 30 min to obtain a homogeneous suspension with a concentration of 2 mg/mL. After using EDC·HCl and NHS to activate the carboxylic acid groups in GO, L–Cys was added to the above solution, then add quantitative ammonia solution. Next, the mixture was placed in an oil bath for about 4 h. Finally, the prepared 3D–rGO was rinsed with deionized water and dried [35,36].
A 100 mg sample of CS was diffused in 20 mL of a 2% acetic acid aqueous solution. 100 mg of BSA was dispersed in 20 mL of deionized water. Then mix the above solutions in equal volumes. Then 3D–rGO was ultrasonically treated with a small amount of deionized water for 15 min. After EDC·HCl and NHS were added to the above solution. Finally, add the CS and BSA mixture solutions to obtain a homogeneous suspension with a concentration of 1 mg/mL.
Polish the GCE with 1.0 μm, 0.3 μm, 0.05 μm alumina powder, rinse with water, and air dry naturally. An 8 μL sample of the suspension was drop–coated on the surface of the GCE and dried under an infrared lamp. This modified GCE was called 3D–rGO–CS–BSA/GCE. Electrodes in control experiments were prepared similarly, including CS–BSA/GCE, 3D–rGO/GCE, and 3D–rGO–CS/GCE.

2.3. Electrochemical Chiral Discrimination of 1–Boc–3–Hydroxypyrrolidine Enantiomers

At room temperature, CV, DPV, and EIS were used to electrochemically characterize the prepared electrode, which was performed in 0.1 M KCl containing 5 mM [Fe(CN)6]4−/3− solution with a test current of −0.2–0.6 V and a scan speed of 100 mV/s. The 3D–rGO/GCE, 3D–rGO–CS/GCE, 3D–rGO–CS–BSA/GCE, CS–BSA/GCE, and bare GCE were soaked in 25 mL of 0.1 M phosphate–buffered saline (PBS) containing 0.05 M R–1–Boc–3–Hydroxypyrrolidine and S–1–Boc–3–Hydroxypyrrolidine, respectively. After incubation at room temperature for 20 min, the DPVs of the R–enantiomer and S–enantiomer were recorded, respectively. The recognition efficiency was evaluated by the peak current ratio (IR/IS).

2.4. Preparation of Samples for Characterization

The 3D–rGO was ultrasonically treated for 15 min to obtain a homogeneous suspension with a concentration of 1 mg/mL, add CS and BSA, stir for 24 h, and then dry to obtain FT–IR, Raman, XPS, and water contact angle characterization samples.

3. Results and Discussion

3.1. SEM Images of 3D–rGO and 3D–rGO–CS–BSA

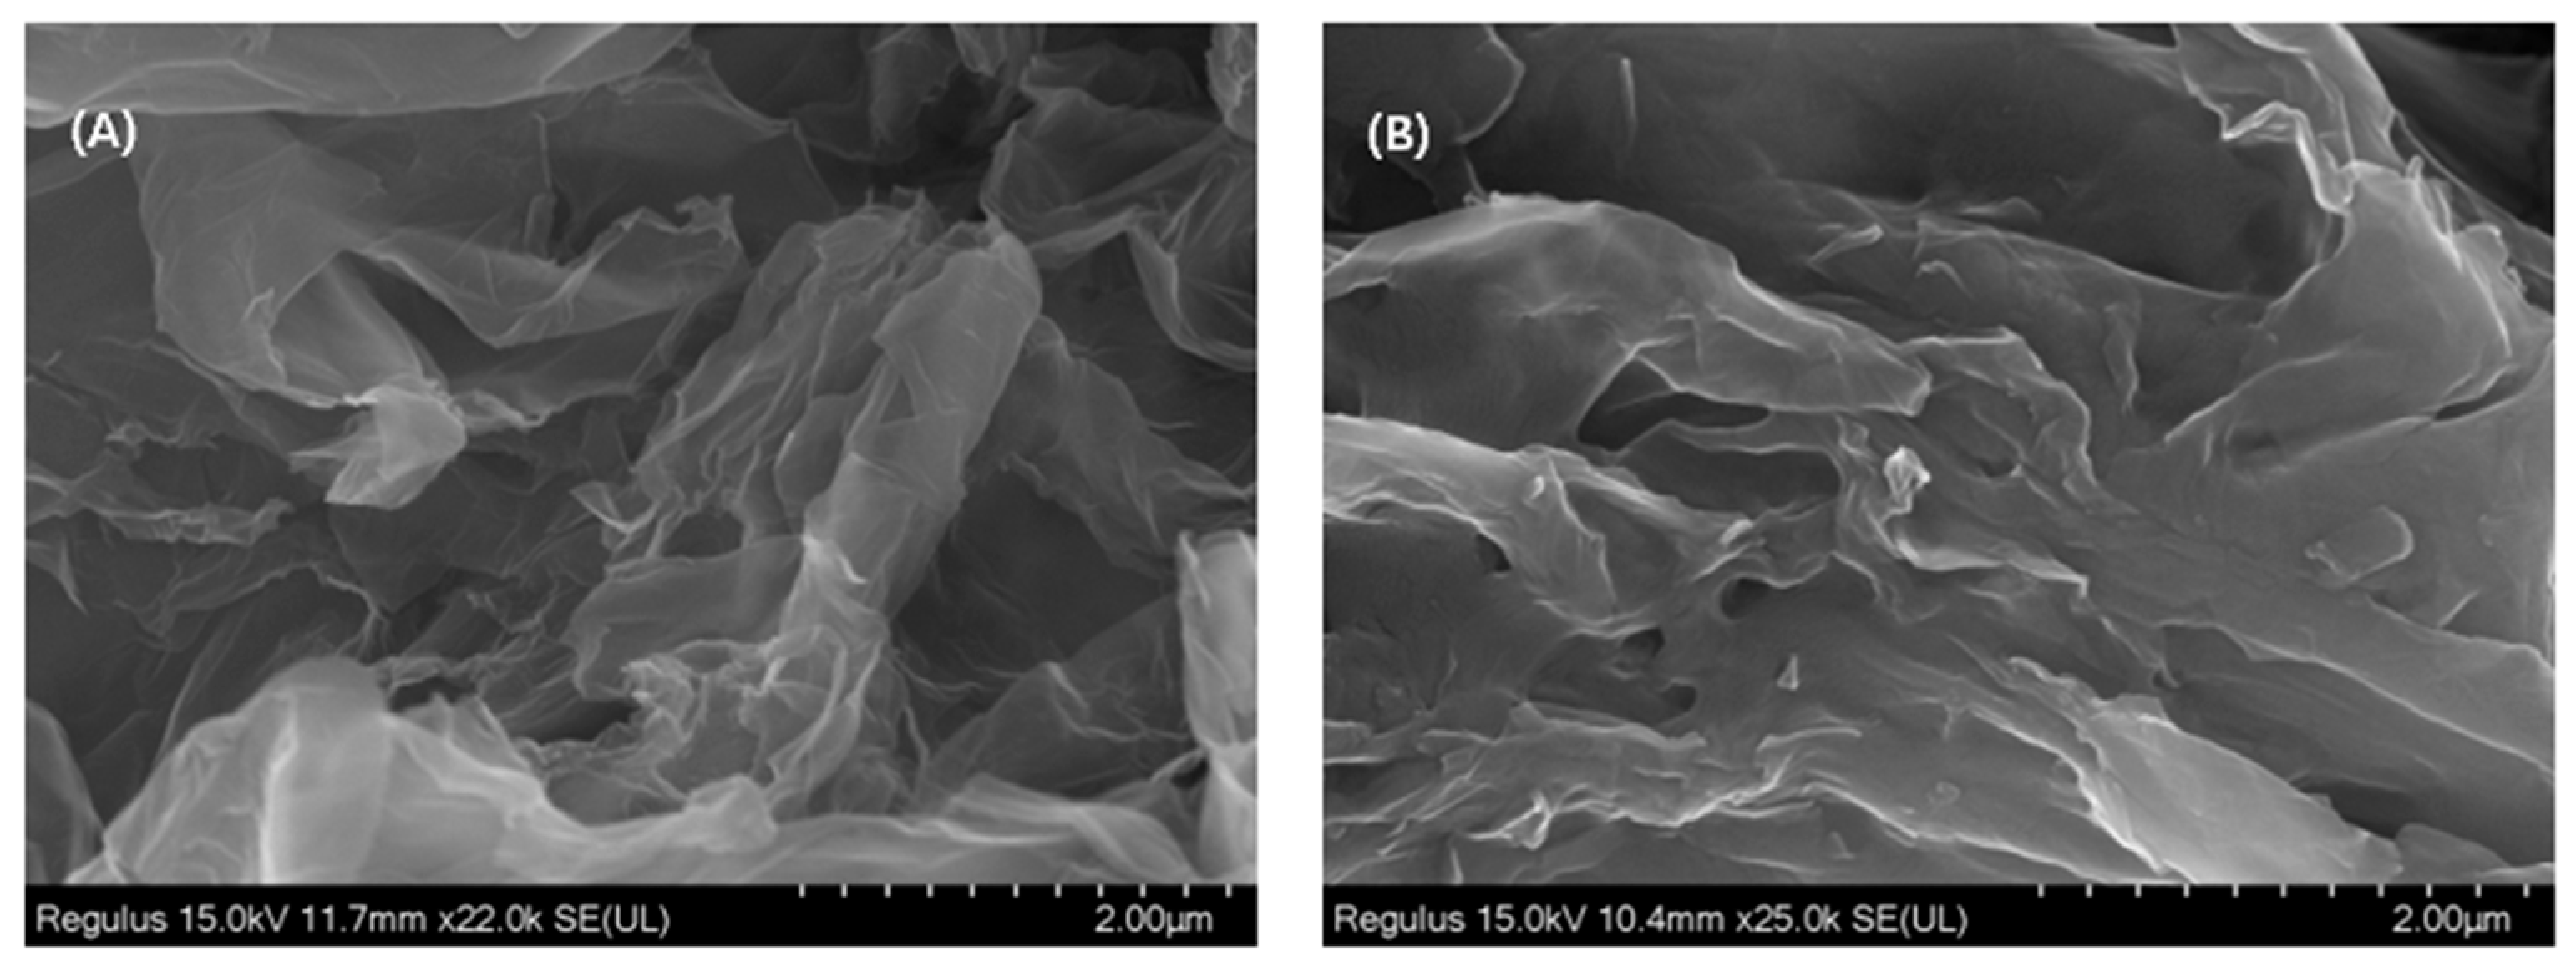
The surface morphology of the composites needs to be observed by the SEM characterization (Figure 1). As can be seen in Figure 1A, the random crosslinking of 3D–rGO nanosheets presents large wavy folds and a three–dimensional porous framework structure. After loading CS and BSA on the 3D–rGO, it looks slightly smooth, the pores reducing. Meanwhile, it can be clearly seen that there is a layer of membrane on the 3D–rGO, which may be due to the interaction between CS and BSA on the 3D porous framework through hydrogen bonds, further indicating that the 3D–rGO–CS–BSA modified electrode was successfully prepared.

3.2. UV Spectra of GO and 3D–rGO

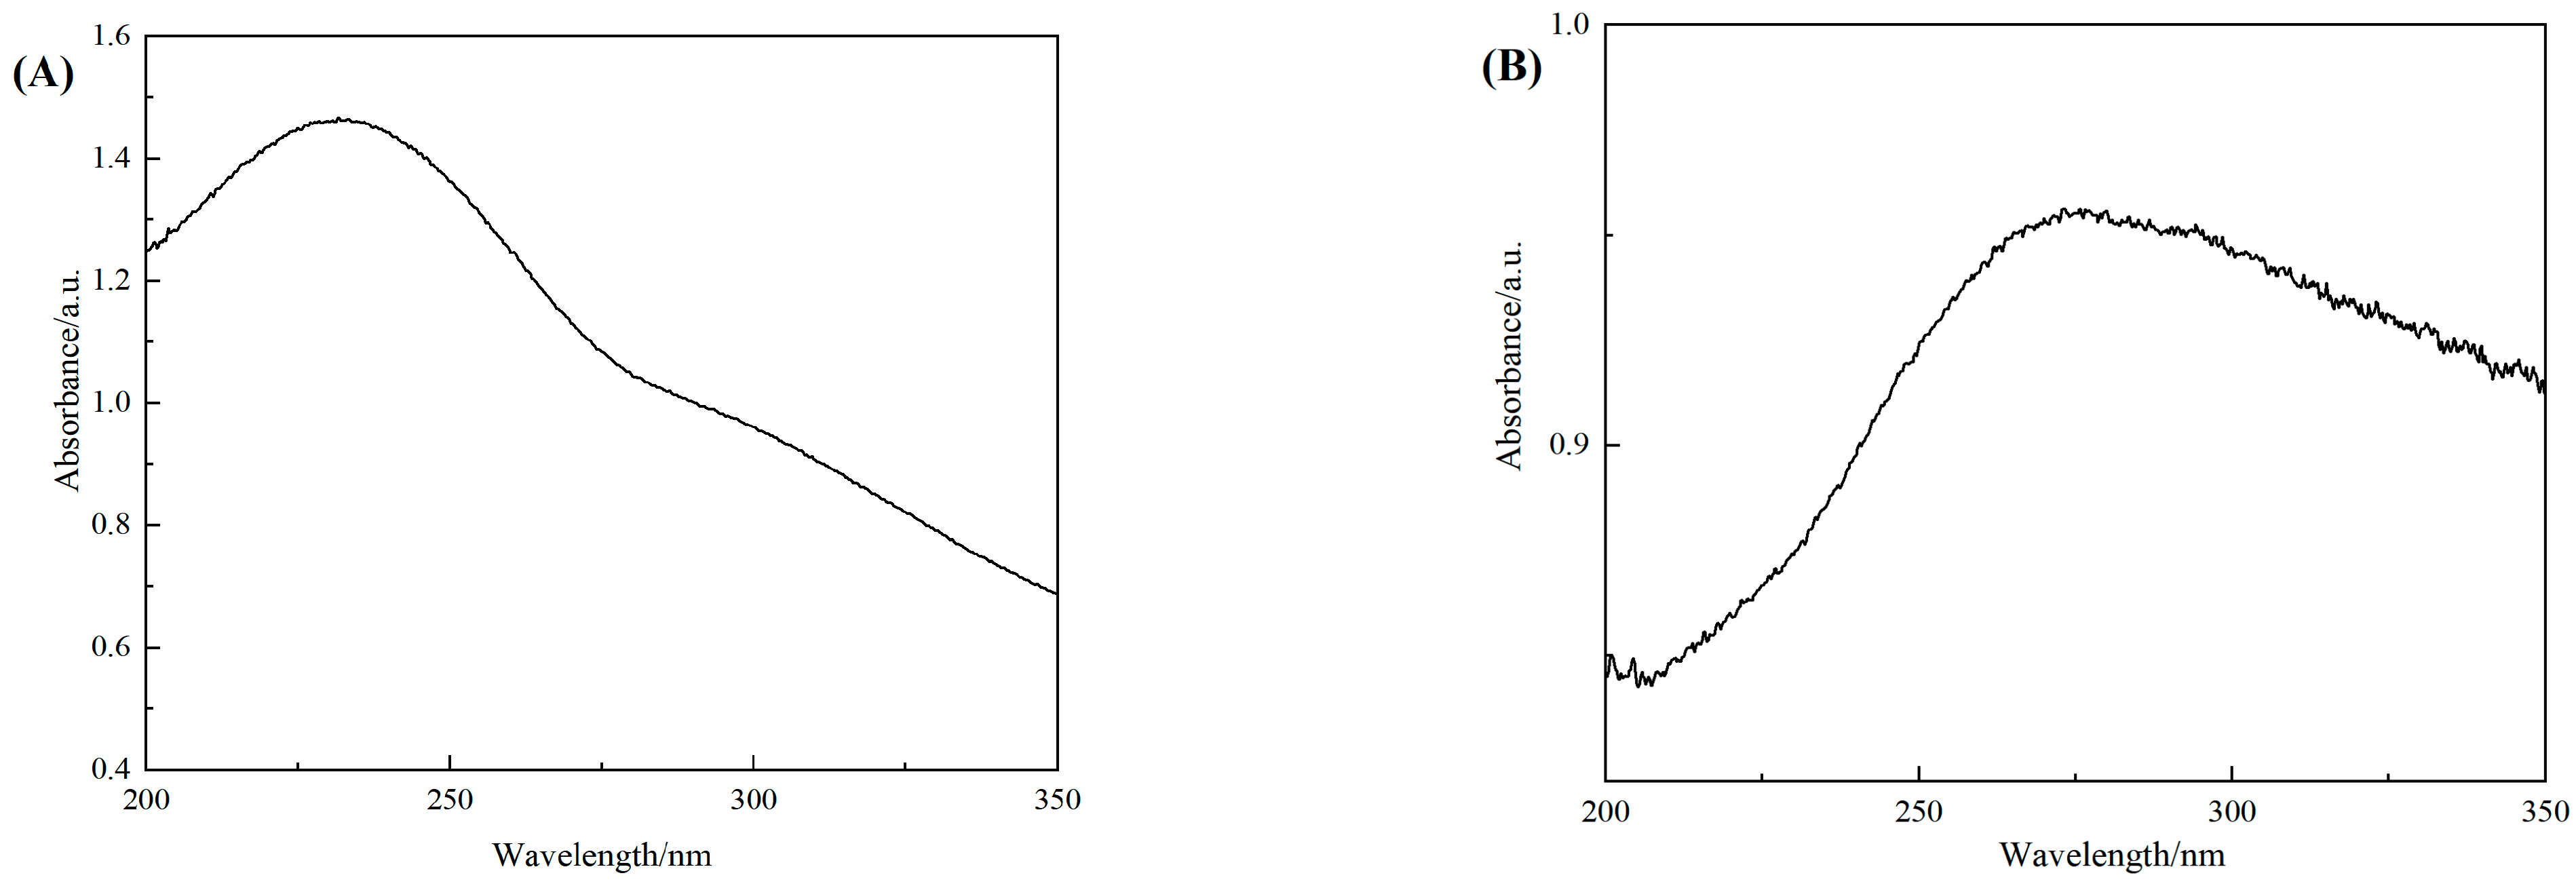
GO and 3D–rGO were further characterized by UV spectroscopy (Figure 2). According to the result from Figure 2A, the strong absorption peak of GO at 230 nm could be caused by the π to π* transition of unsaturated C=C, and a weak absorption peak at 300 nm is due to the n to π* transition of C=O. It is noteworthy from Figure 2B that the peak of 3D–rGO has a significant red shift compared with that of GO, which may be due to the conjugation between C=C groups, and the disappearance of the peak at 300 nm indicates the disappearance of oxygen–containing groups, indicating that GO was successfully reduced to 3D–rGO.

3.3. FT–IR and Raman Spectra of GO, 3D–rGO, and 3D–rGO–CS–BSA

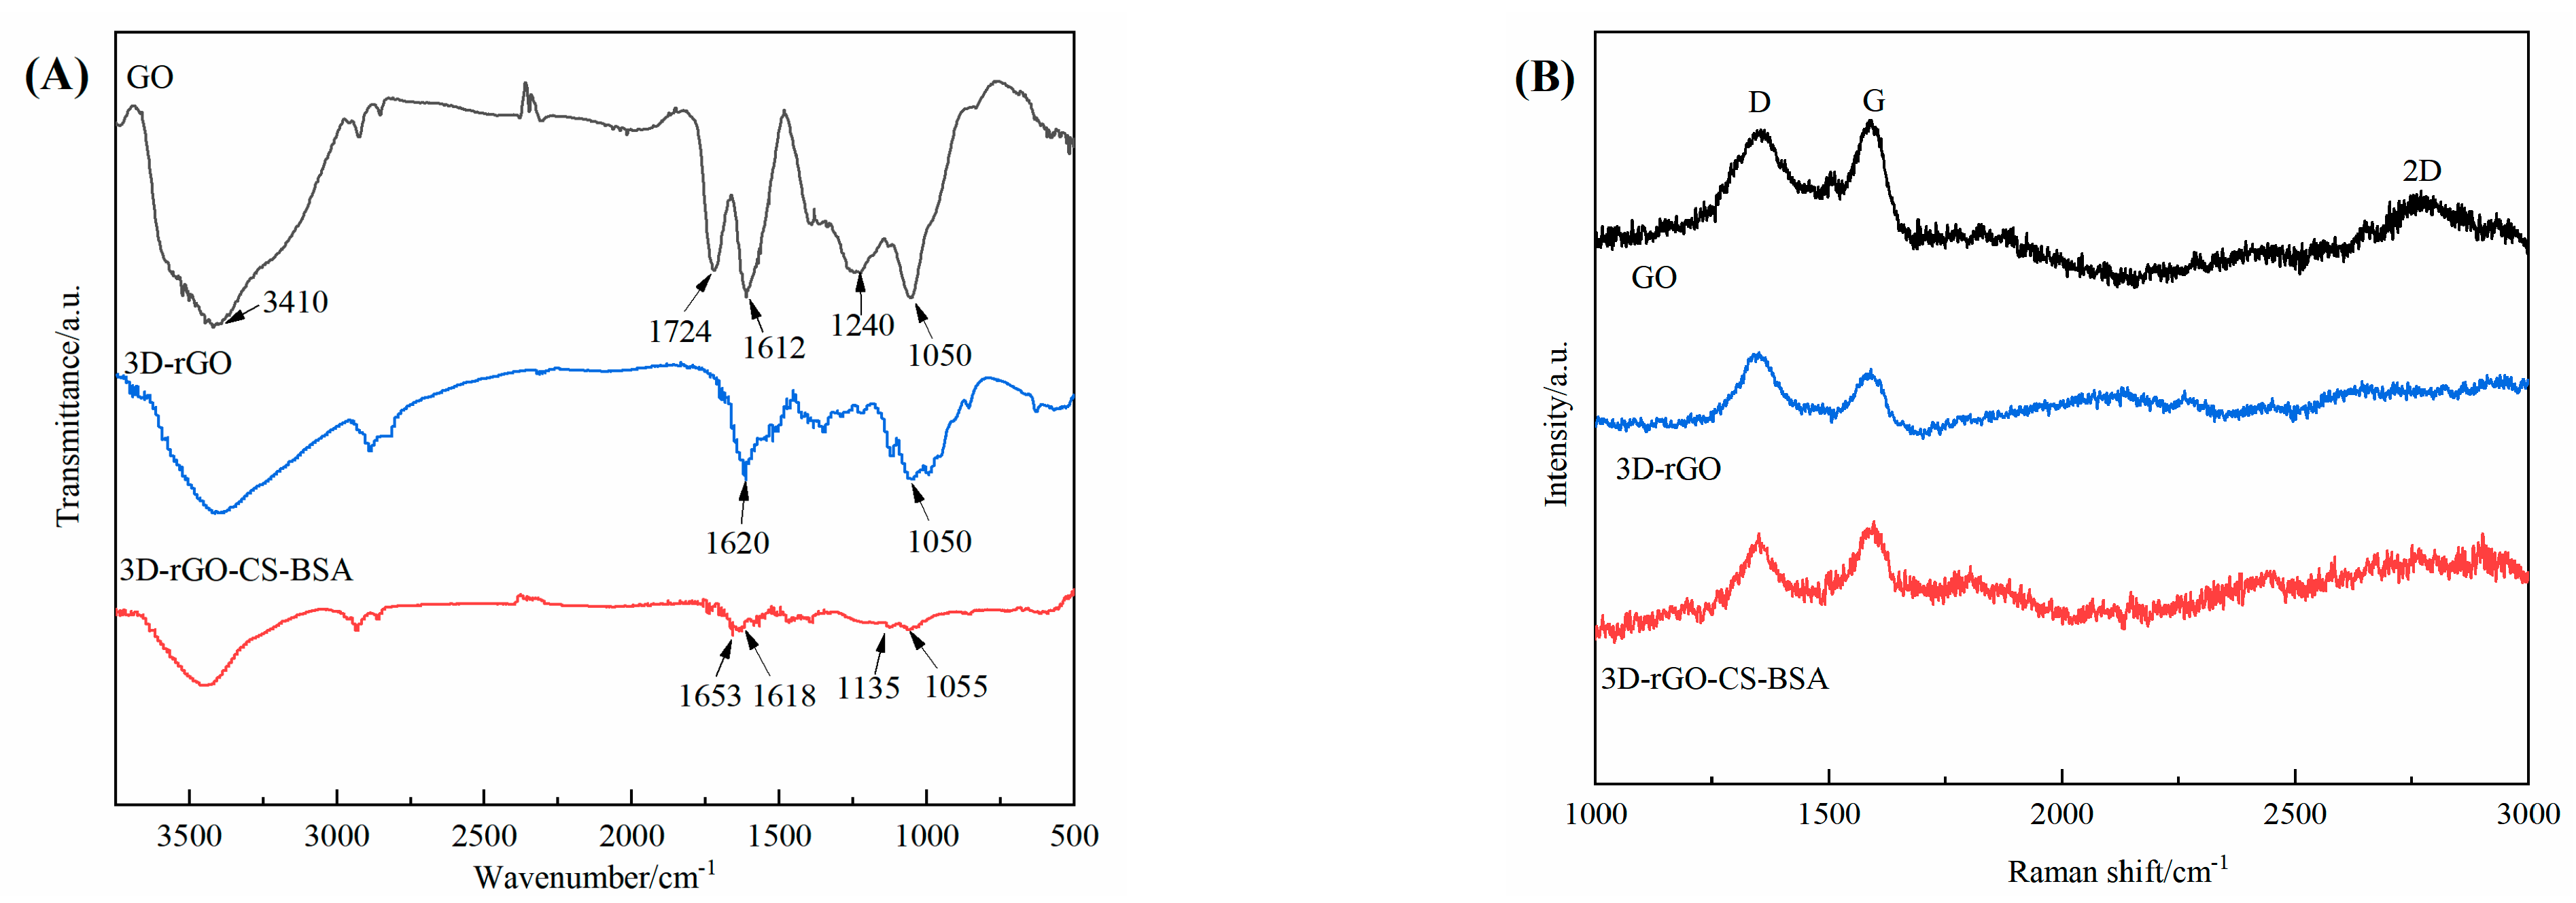
FT–IR spectroscopy was used to further demonstrate the successful cross–connection between the complexes (Figure 3A). The GO spectrum indicates that the stretching vibration peaks at 1612 cm−1 and 1726 cm−1 pertain to C=C and C=O, the absorption peaks at 1050 cm−1 and 1240 cm−1 pertain to C–O–C and –OH, and the characteristic peak at 3410 cm−1 pertains to the stretching vibration of –OH. Compared to GO, the disappearance of C=O at 1726 cm−1 for 3D–rGO indicates that GO was successfully reduced [37,38]. Curve 3D–rGO–CS–BSA showed the bending vibration of –NH and the stretching vibration of –CN have two absorption peaks at 1650 cm−1 and 1135 cm−1, respectively. These peaks are characteristic peaks of CS and BSA. The results show the successful generation of 3D–rGO–CS–BSA.
Raman spectroscopy is an important technique for analyzing crystal structural information. Figure 3B, 1346 cm−1 and 1585 cm−1 are associated with D and G bands, respectively. The degree of disorder is represented by the intensity ratio of ID/IG in graphene. The ID/IG ratio was counted at 0.99 for GO. For 3D–rGO, the higher ID/IG (1.17) value demonstrated the increase in carbon disorder degree owing to the 3D–rGO formation of the porous structure. In addition, the ratio of ID to I2D is greater than 1, indicating that 3D–rGO is multilayered. On curve 3D–rGO–CS–BSA, the decreasing ID/IG ratio (0.96) of 3D–rGO–CS–BSA confirms the partial disappearance of defects on the surface due to the successful construction of 3D–rGO–CS–BSA composites.

3.4. XPS of 3D–rGO–CS–BSA

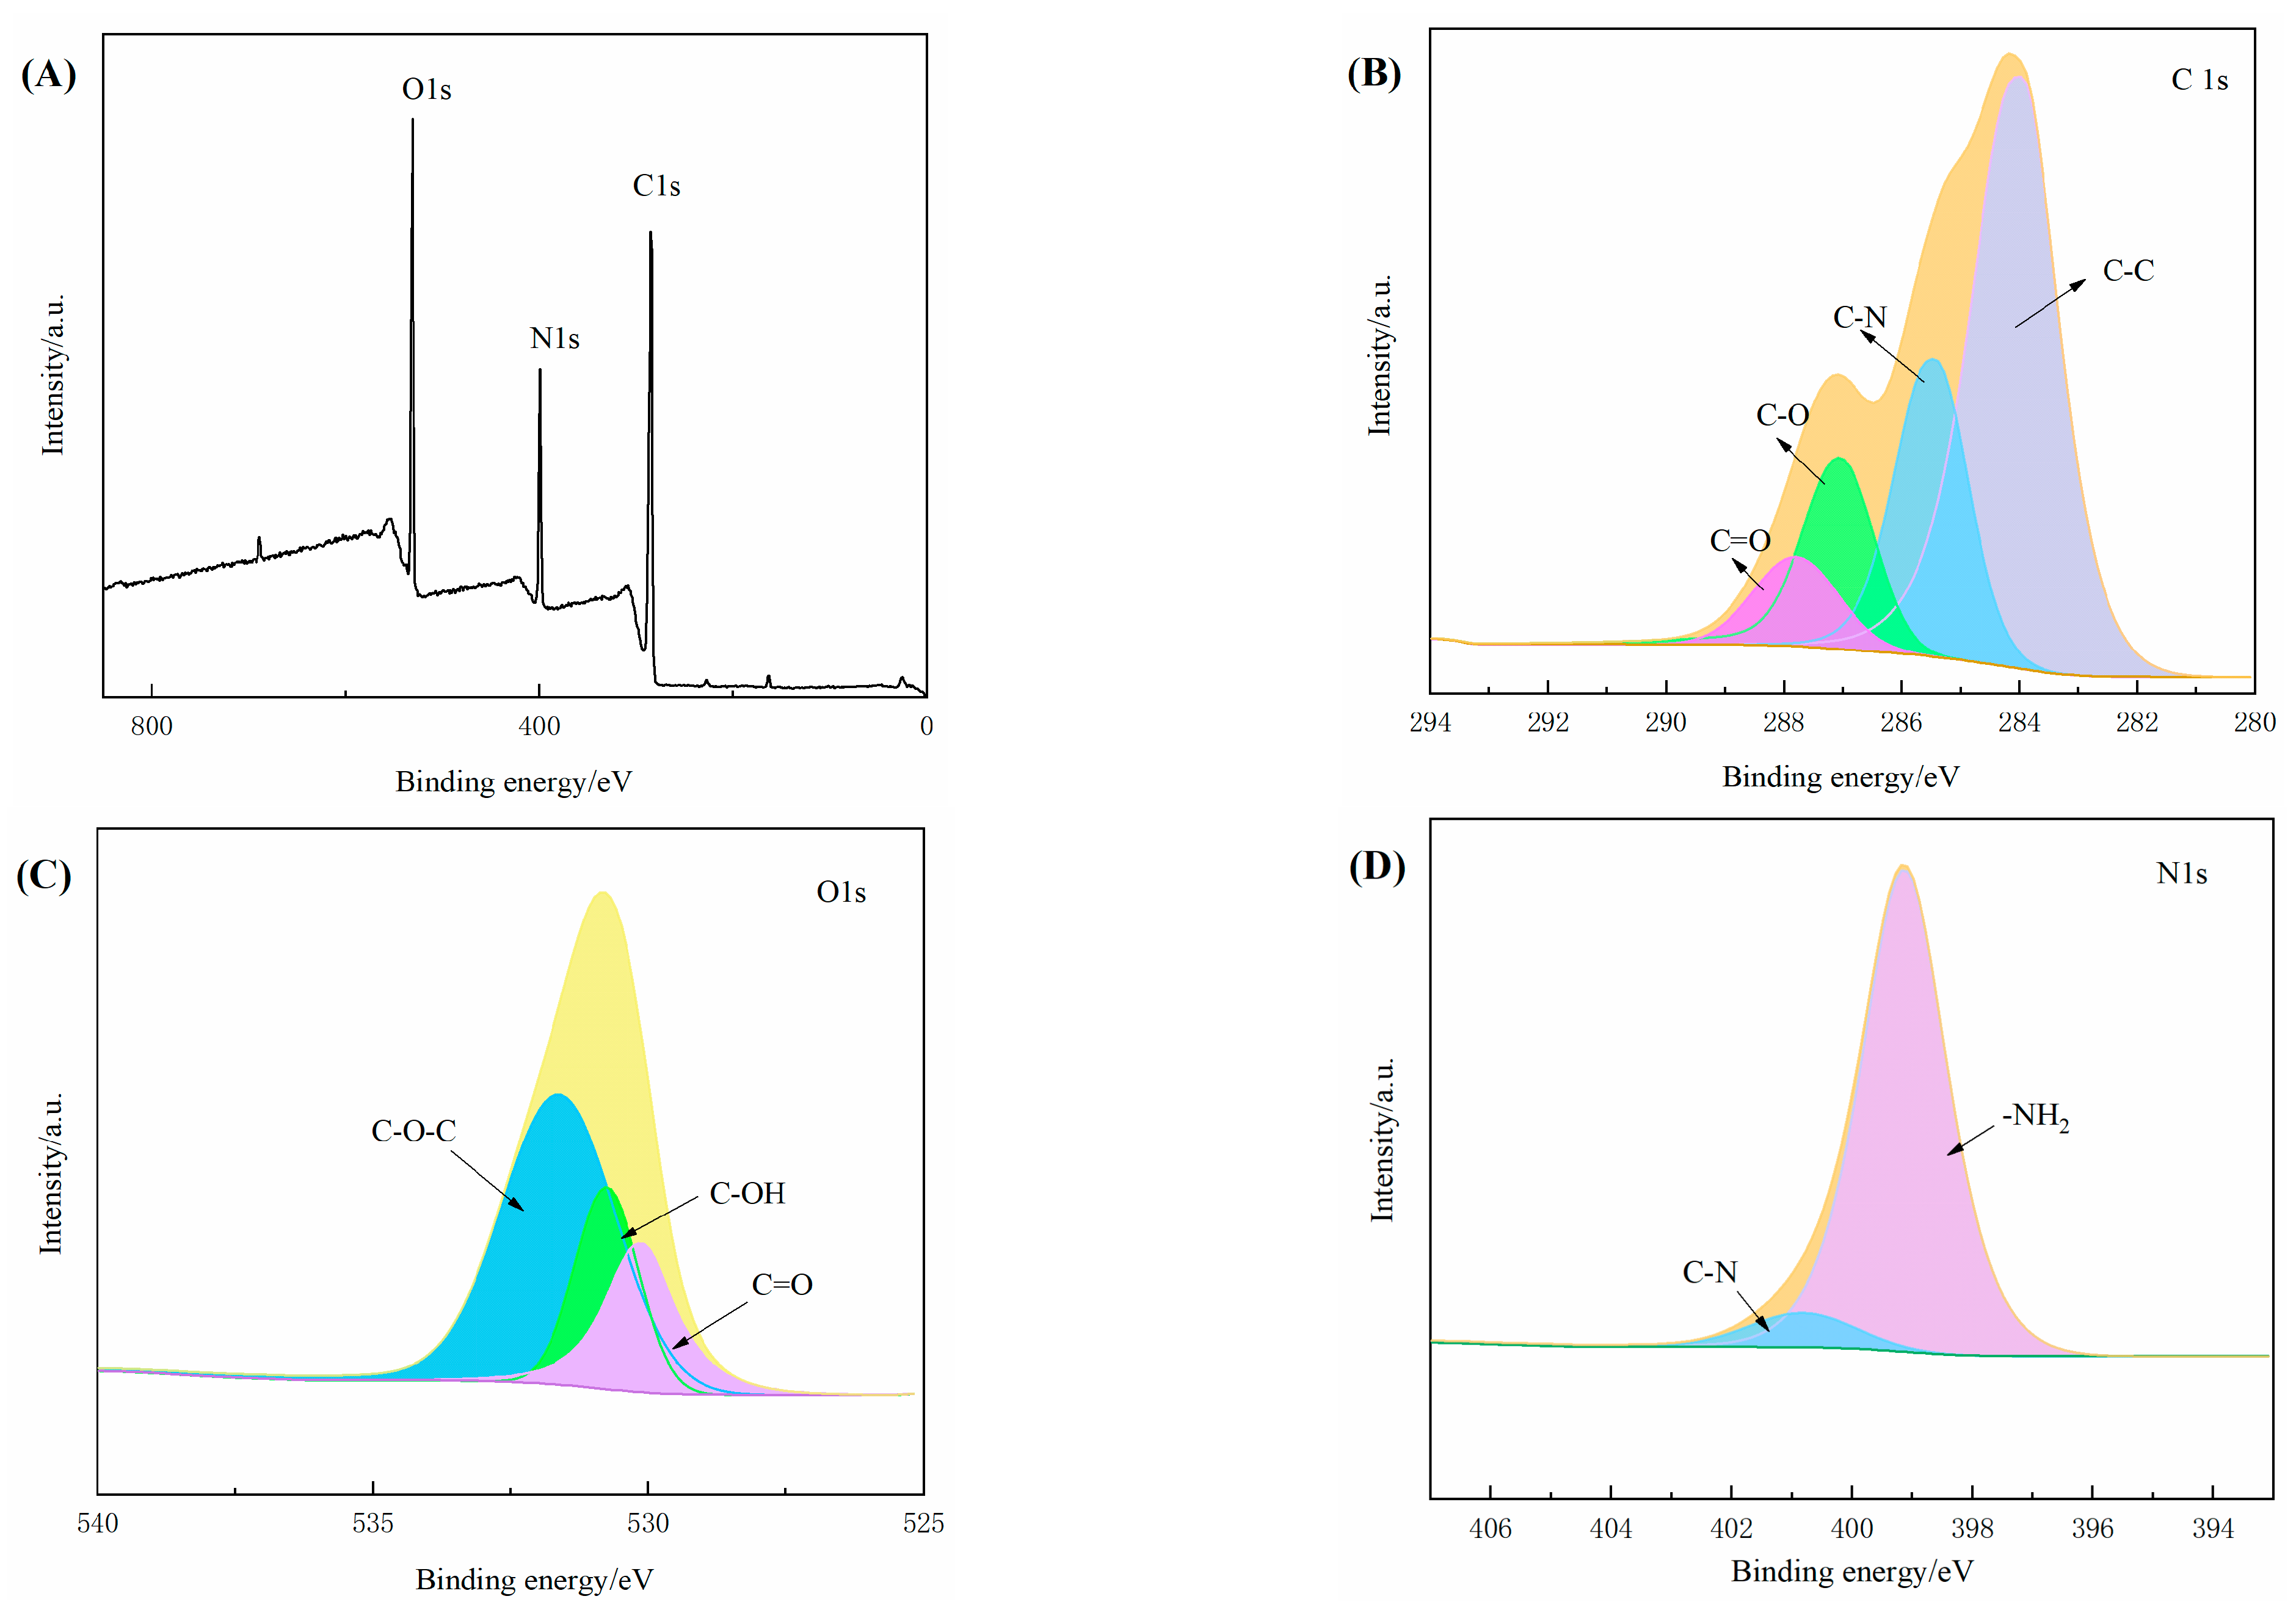
XPS was used to further study the chemical bond information and elemental composition of chiral surface materials [39]. Figure 4A is the full spectrum of 3D–rGO–CS–BSA, which clearly shows the peaks of C1s at 285.08 eV, N 1s at 399.08 eV, and O 1s at 531.08 eV. The C 1s spectrum has four peaks associated with C–C, C–N, C–O, and C=O at 283.98 eV, 285.48 eV, 287.08 eV, and 287.88 eV, respectively. The O 1s spectrum has three peaks related to C=O, C–OH, and C–O–C at 530.18 eV, 530.78 eV, and 531.68 eV, respectively. The N 1s spectrum has two peaks related to –NH2 and C–N at 399.18 eV and 401.08 eV [40]. These results have confirmed that CS and BSA were successfully loaded into the three–dimensional graphene structure.

3.5. Electrochemical Characterization

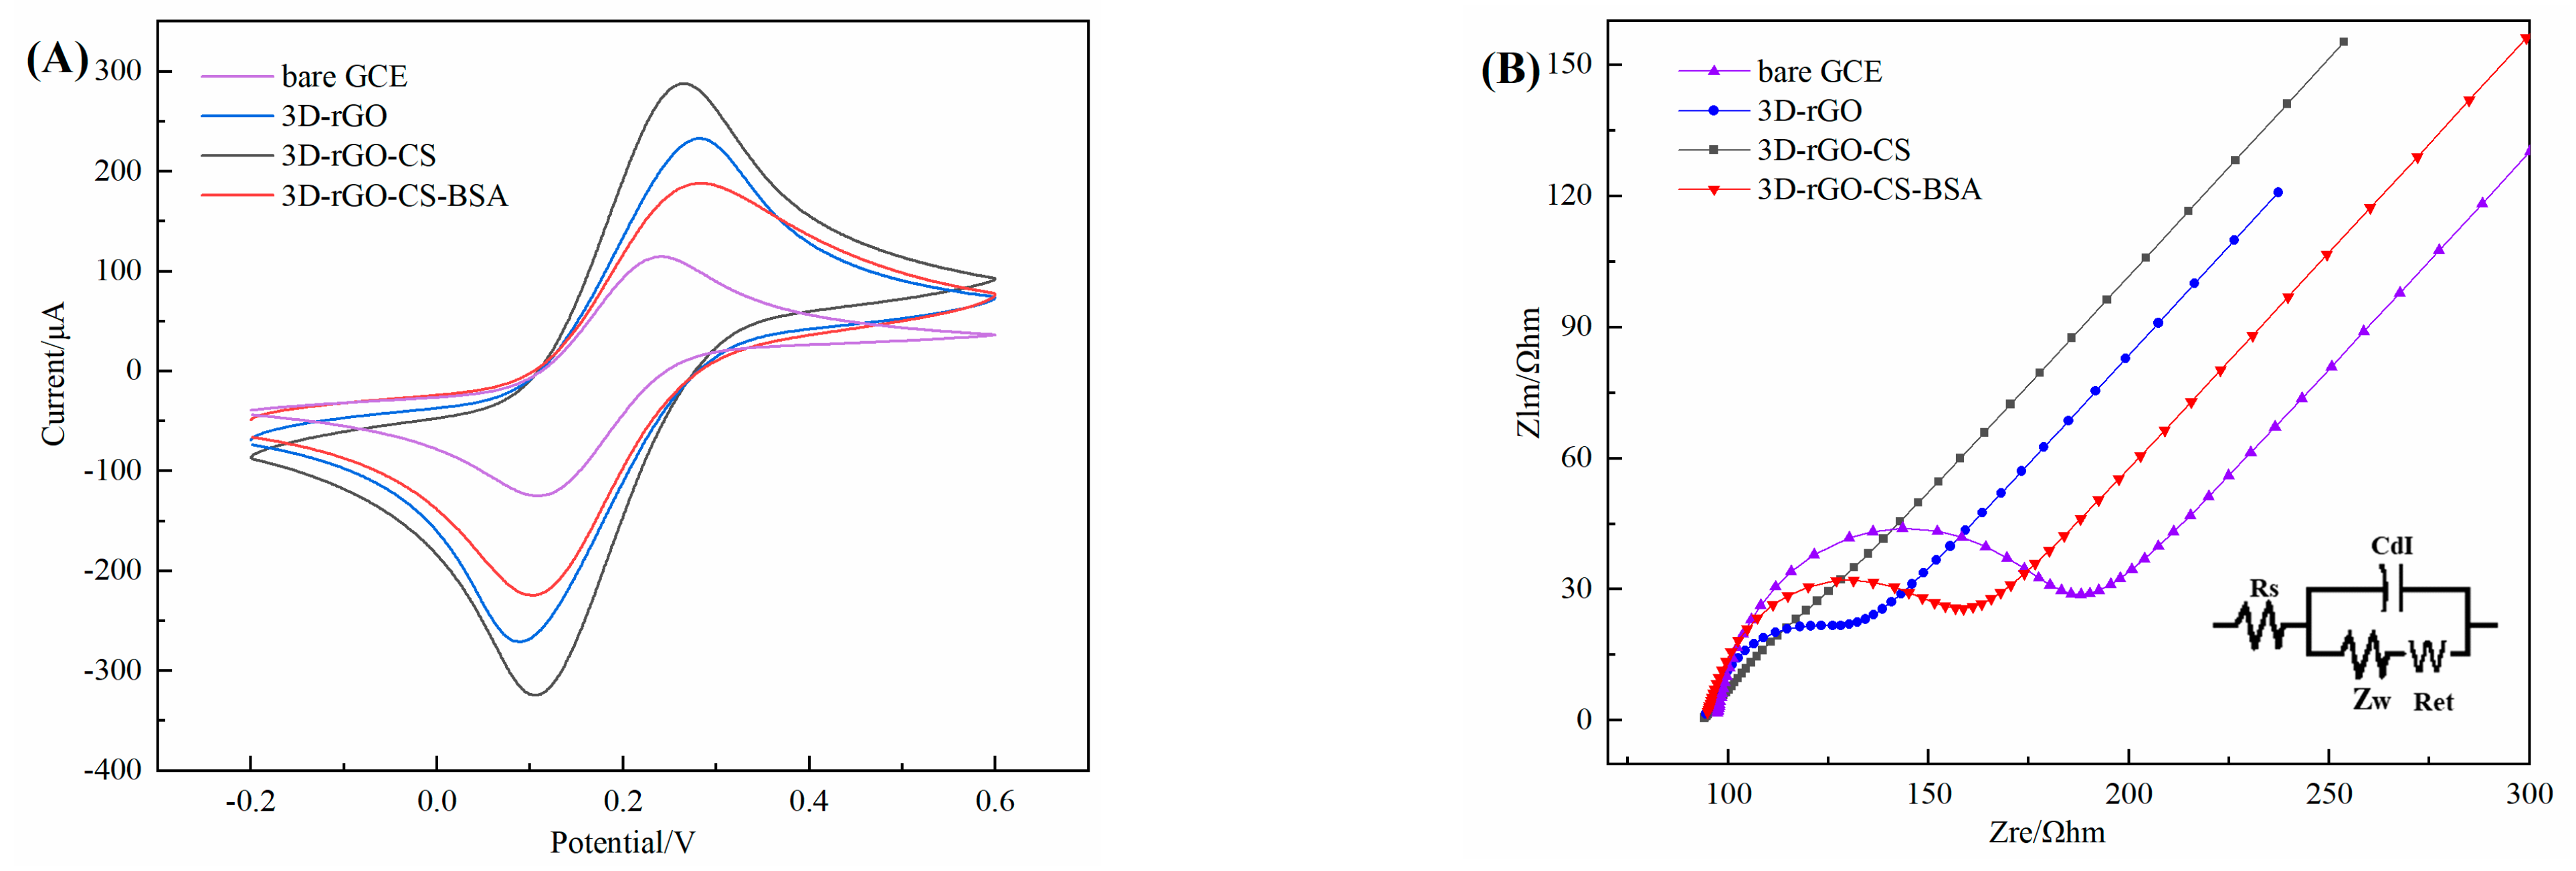
To study the sensing performance of the modified electrode, using CV with the bare glass, 3D–rGO, 3D–rGO–CS, and 3D–rGO–CS–BSA. As shown in Figure 5A, This is due to the redox reaction between [Fe(CN)6]4− and [Fe(CN)6]3−, which causes all tested working electrodes to have a pair of reversible redox peaks. In comparison with bare GCE, 3D–rGO noticeably increased the peak current value (233 μA), which might be due to the rGO’s high conductivity and accelerating the transfer of electrons. The higher peak current value (282 μA) of 3D–rGO–CS might be due to the electrostatic attraction between the negatively charged probe ([Fe(CN)6]4−/3−) and the positive group NH4+ of CS. It was noted that the peak currents decreased at the 3D–rGO–CS–BSA, which might be due to the hindrance of electron transport by the BSA.
EIS is used to represent the electron conduction ability of [Fe(CN)6]4−/3− on the surface of the modified electrode, studying the kinetics of the electrode process, the electric double layer, the electron diffusion ability, etc., using the Nyquist diagram (Nyquist) to represent. It can be concluded from Figure 5B that the order of the four samples Ret values is as follows: 3D–rGO–CS (5.01 Ω) < 3D–rGO (14.46 Ω) < 3D–rGO–CS–BSA (49.23 Ω) < bare glass (73.63 Ω). Those results are consistent with the CV measurements.

3.6. Electrochemical Kinetics of 3D–rGO–CS–BSA/GCE

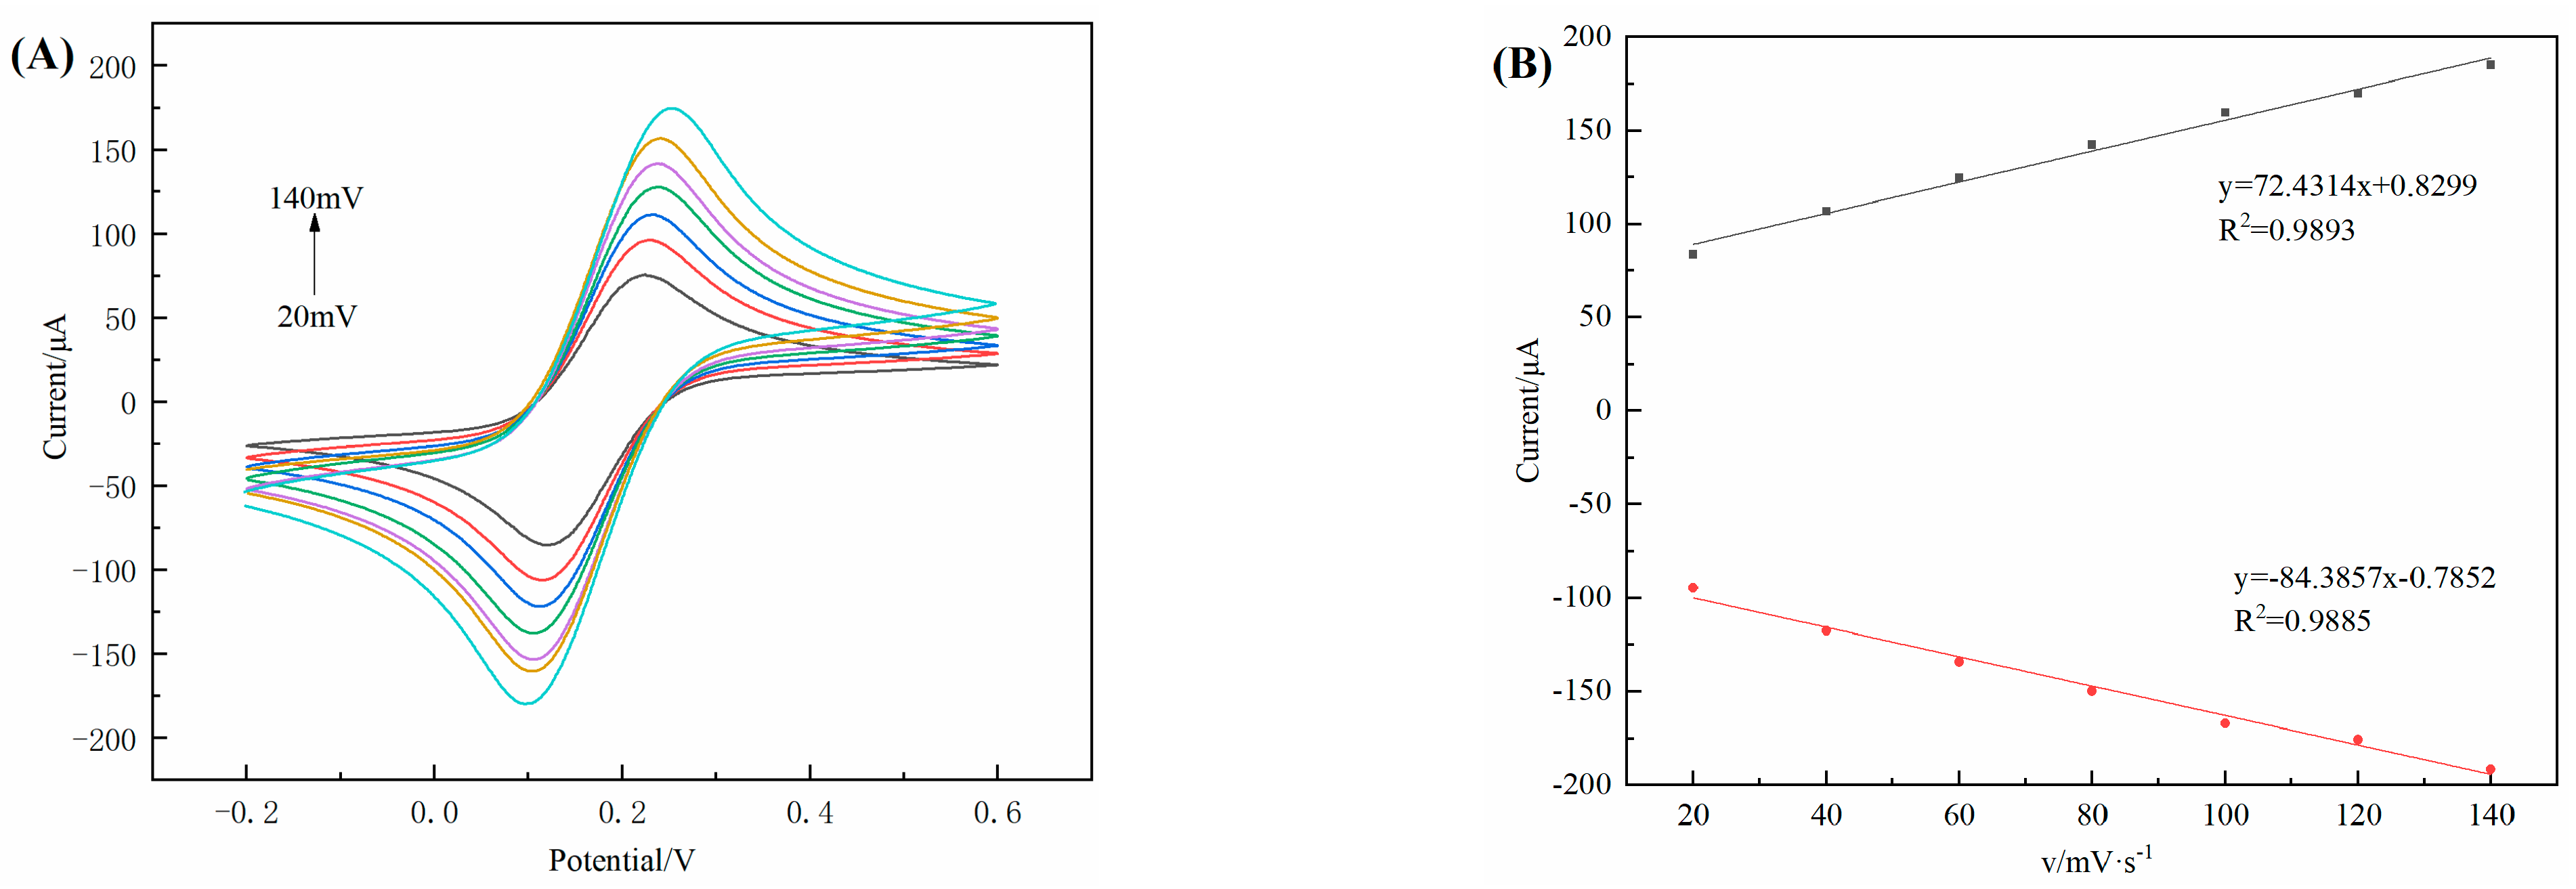
The electrochemical behavior of 3D–rGO–CS–BSA under different scan rates was studied [41]. The results show that in Figure 6A, with the scanning speed increasing, the peak current value continues to increase, indicating that the chiral sensing platform has good stability and reversibility. As shown in Figure 6B, the current response has a linear relationship with the scanning speed, showing that the process is adsorption–controlled. The linear regression equations of the oxidation peak current can be depicted as y = 72.4314x + 0.8299 (R2 = 0.9893), and the reduction peak current can be depicted as y = −84.3857x − 0.7852 (R2 = 0.9885).

3.7. Electrochemical Chiral Discrimination of Enantiomers

The electrochemical recognition ability of diversely modified electrodes for chiral enantiomers was assessed by DPV, and the results are shown in Figure 7. Furthermore, it can be displayed that the oxidation peak currents of the enantiomer almost overlap on bare GCE (Figure 7A). Compared with the bare GCE electrode, the peak currents are all significantly enhanced on the 3D–rGO/GCE electrode (Figure 7B), and there is a tiny difference between the chiral enantiomers in the peak current. Despite the presence of the chiral selector CS, enantiomers could be distinguished on 3D–rGO–CS/GCE (Figure 7C), but the low IR/IS (1.10) leads to a recognition effect that is not very satisfactory. Figure 7D shows that CS and BSA are used as modified electrodes, and the IR/IS reaches 1.64, which is attributed to the fact that CS and BSA include plenty of chiral sites that interact with enantiomers. That is to say, the S–enantiomer can present three groups that perfectly match the three sites of CS–BSA/GCE. The R–enantiomer has at most two groups capable of interacting with the two sites of CS–BSA/GCE. When using the 3D–rGO–CS–BSA/GCE electrode (Figure 7E), the IR/IS is 2.82, and the recognition capability is greatly improved, which can be attributed to the fact that adding 3D–rGO can strengthen the conductivity. Amplifies the electrochemical signal for improved sensitivity. It is worth noting that the peak currents of the R–enantiomer are always higher than those of the S–enantiomer at both 3D–rGO–CS/GCE (Figure 7C), 3D–rGO–CS/GCE (Figure 7D), and 3D–rGO–CS–BSA/GCE (Figure 7E), so chiral selectors can preferentially combine with the R–enantiomer.

3.8. Water Contact Angle on Different Samples

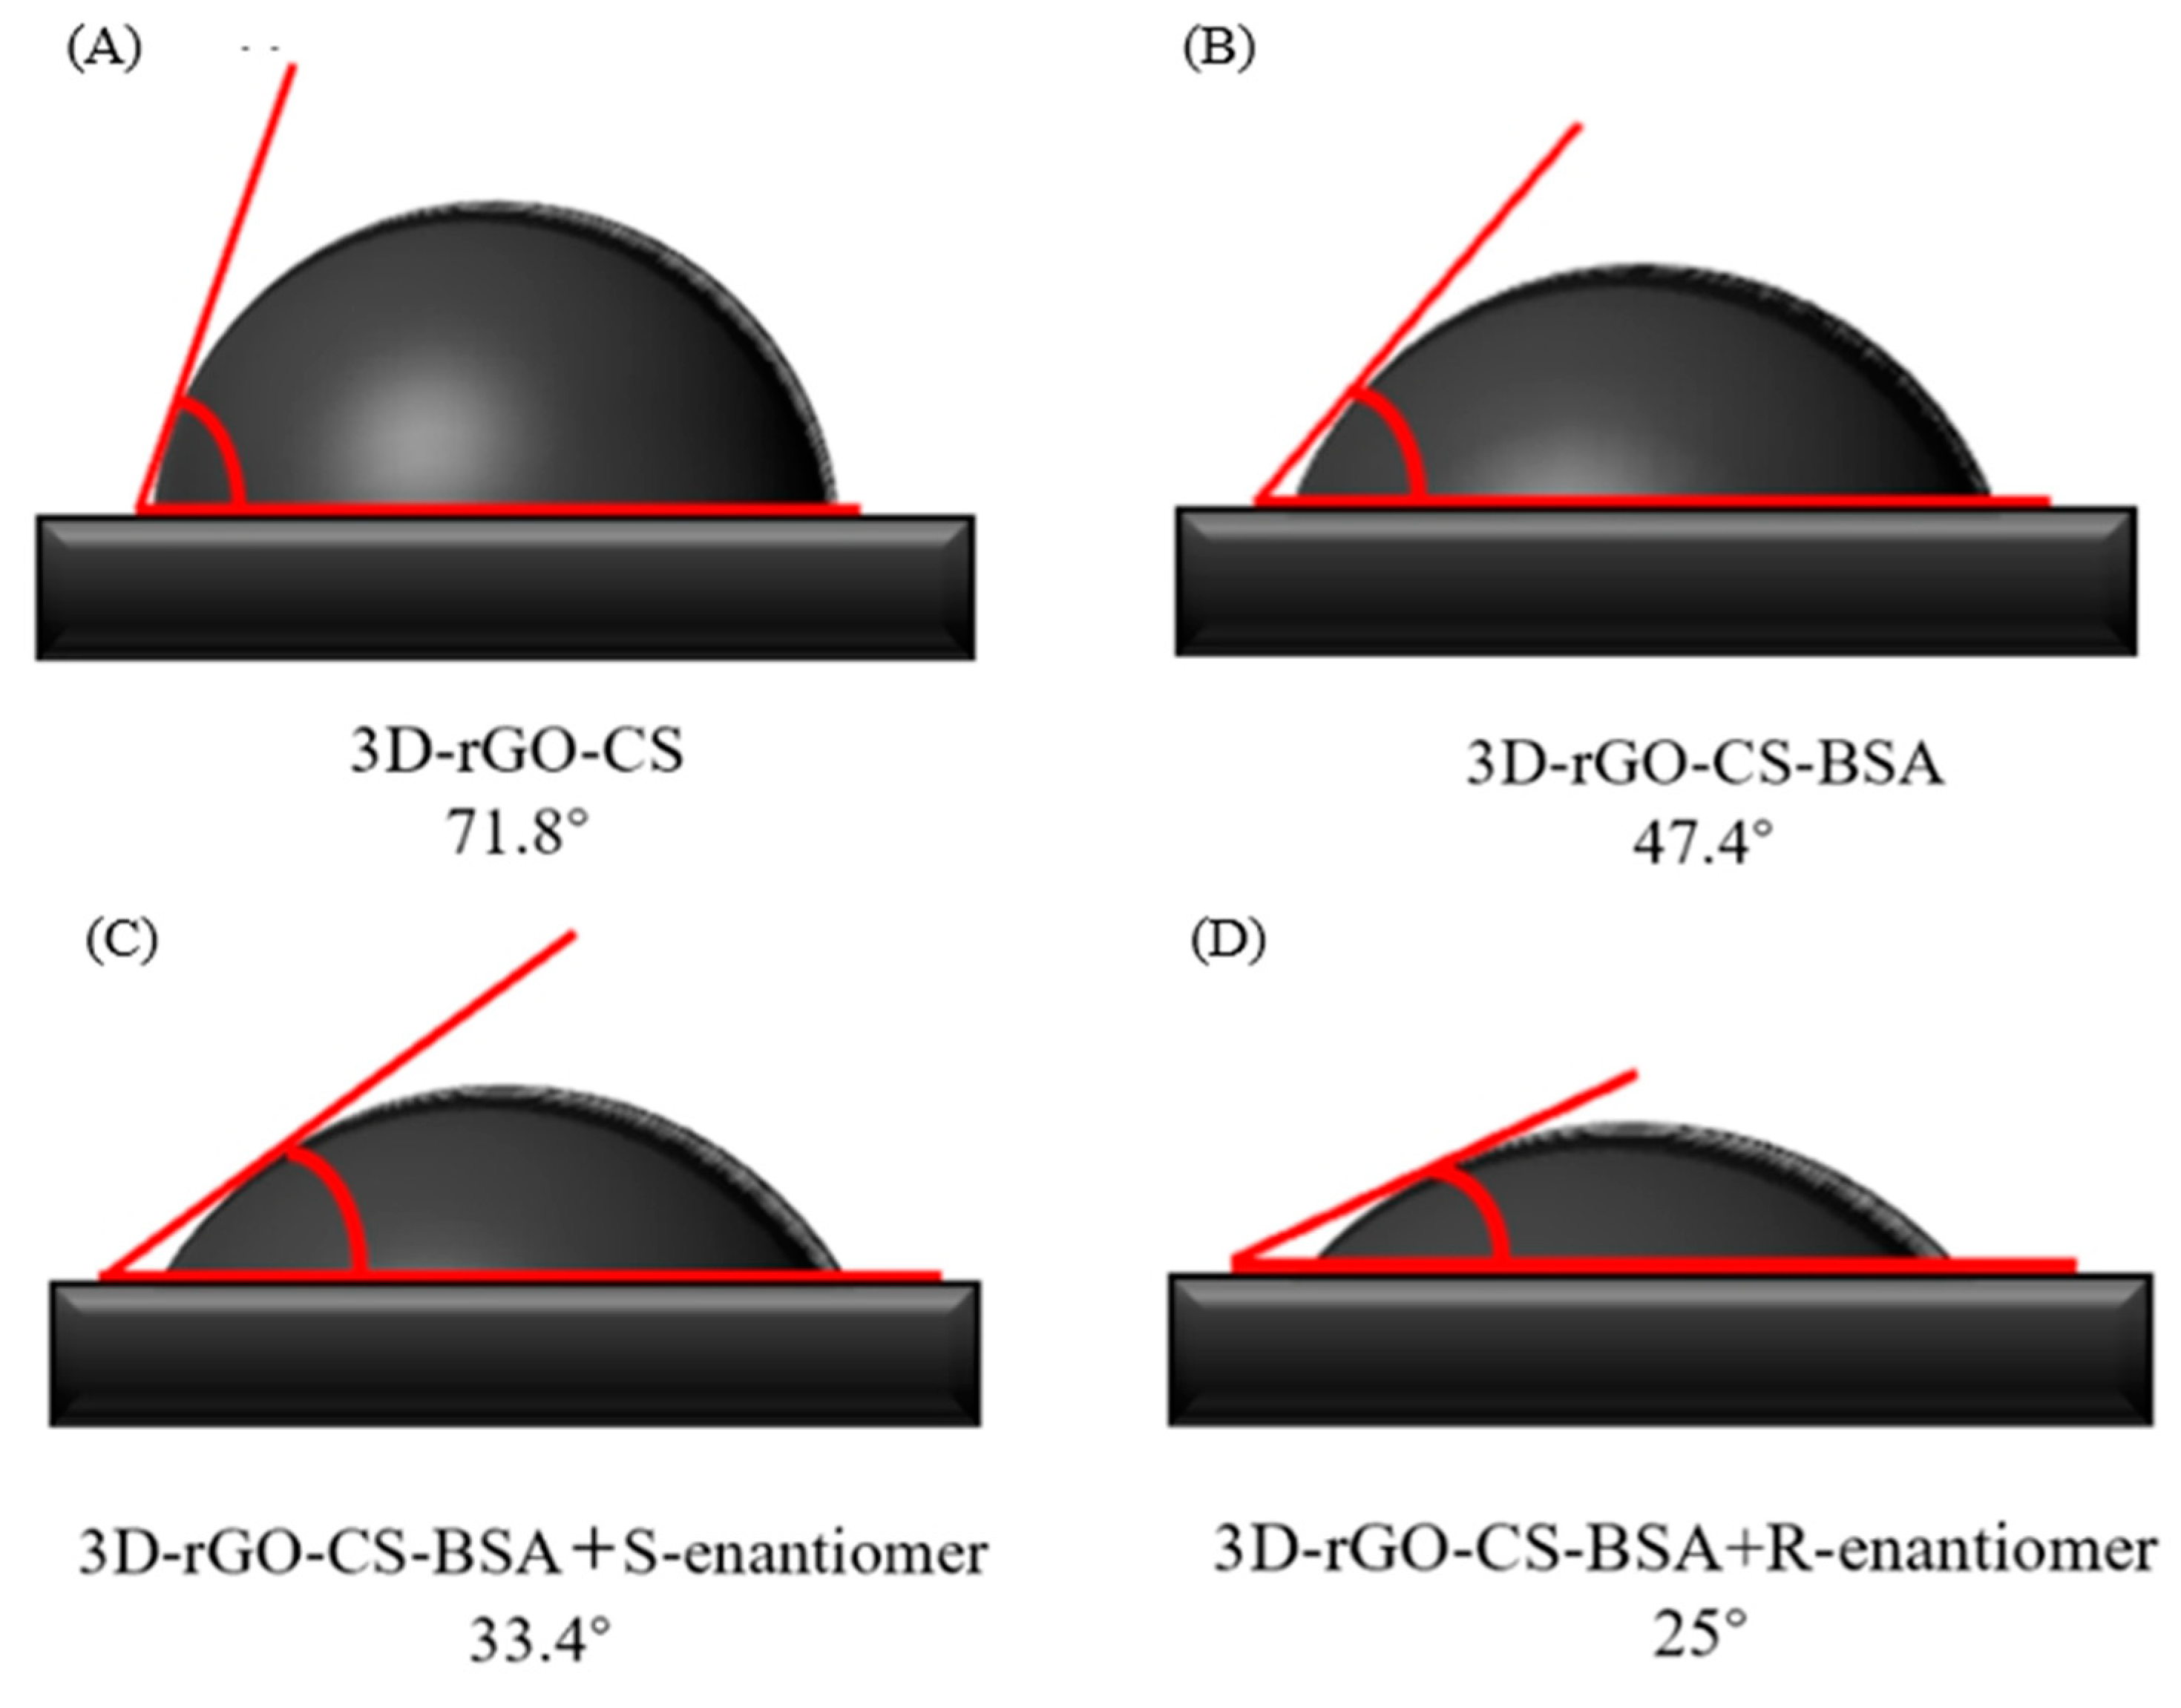
To further confirm the affinity of the modified electrode for the S–enantiomer over the R–enantiomer [42], the water contact angle on unalike samples is tested. Compared with 3D–rGO–CS (71.8°, Figure 8A), the contact angle on 3D–rGO–CS–BSA decreases to 47.4° (Figure 8B), indicating that 3D–rGO–CS–BSA has good hydrophilicity, which could be due to the introduction of BSA and CS with a large number of hydrophilic groups (–NH2 and –OH groups). After 3D–rGO–CS–BSA was incubated in 0.1 M PBS containing 0.05 M S–enantiomer or R–enantiomer, respectively. Interestingly, containing both S–enantiomer and R–enantiomer, the solutions water contact angles of 3D–rGO–CS–BSA were 33.4° (Figure 8C) and 25.0° (Figure 9D), respectively. This indicated that 3D–rGO–CS–BSA hybrids have a higher affinity for the R–enantiomer than the S–enantiomer.

3.9. The Calculation of the Binding Constant

In order to research the inclusion behaviors during the enantioselective recognition of R–enantiomer and S–enantiomer, various concentrations of 3D–rGO–CS–BSA from 0.1 mM to 0.6 mM were added to the R–/S–enantiomers (0.2 mM) and the corresponding UV spectra were recorded. For Figure 9A,B, the absorbance intensities of the R–enantiomer+3D–rGO–CS–BSA and the S–enantiomer+3D–rGO–CS–BSA increased with the concentration of 3D–rGO–CS–BSA, indicating that the R– and S–enantiomers were closely related to 3D–rGO–CS–BSA through host–guest interaction.
1 A A 0 = 1 ε × [ C e n a n t i o m e r ] + 1 ( ε × [ C e n a n t i o m e r ] × K × [ 3 D r G O C S B S A ] n
Calculating the binding constants of the inclusion complexes and using the equation proposed by Benesi and Hildebrand. Where A is the absorbance of 3D–rGO–CS–BSA at different concentrations of R– or S–enantiomers, A0 represents the absorbance of only the R– or S–enantiomers, and K is the binding constant for complex 3D–rGO–CS–BSA and enantiomer binding. [3D–rGO–CS–BSA]n and [Cenantiomer] indicate the initial concentration of 3D–rGO–CS–BSA and enantiomers. The n is the stoichiometric ratio. Δε is the differential molar extinction coefficient of the R–/S–enantiomer in the absence and presence of 3D–rGO–CS–BSA. The K value is obtained from the double reciprocal graph and calculated by dividing the intercept by the slope of the line. The linear analysis of the UV absorption changes at 278 nm showed an excellent linear relationship, indicating that a 1:1 inclusion complex was formed between the enantiomers and 3D–rGO–CS–BSA. The calculated binding constant K values were 311.47 (Figure 9C) for the R–enantiomer and 214.86 (Figure 9D) for the S–enantiomer. The results showed that the K value of the R–enantiomer was larger, suggesting that the binding affinity of the complex 3D–rGO–CS–BSA to the R–enantiomer was higher than that of the S–enantiomer.

3.10. Chiral Condition Optimization

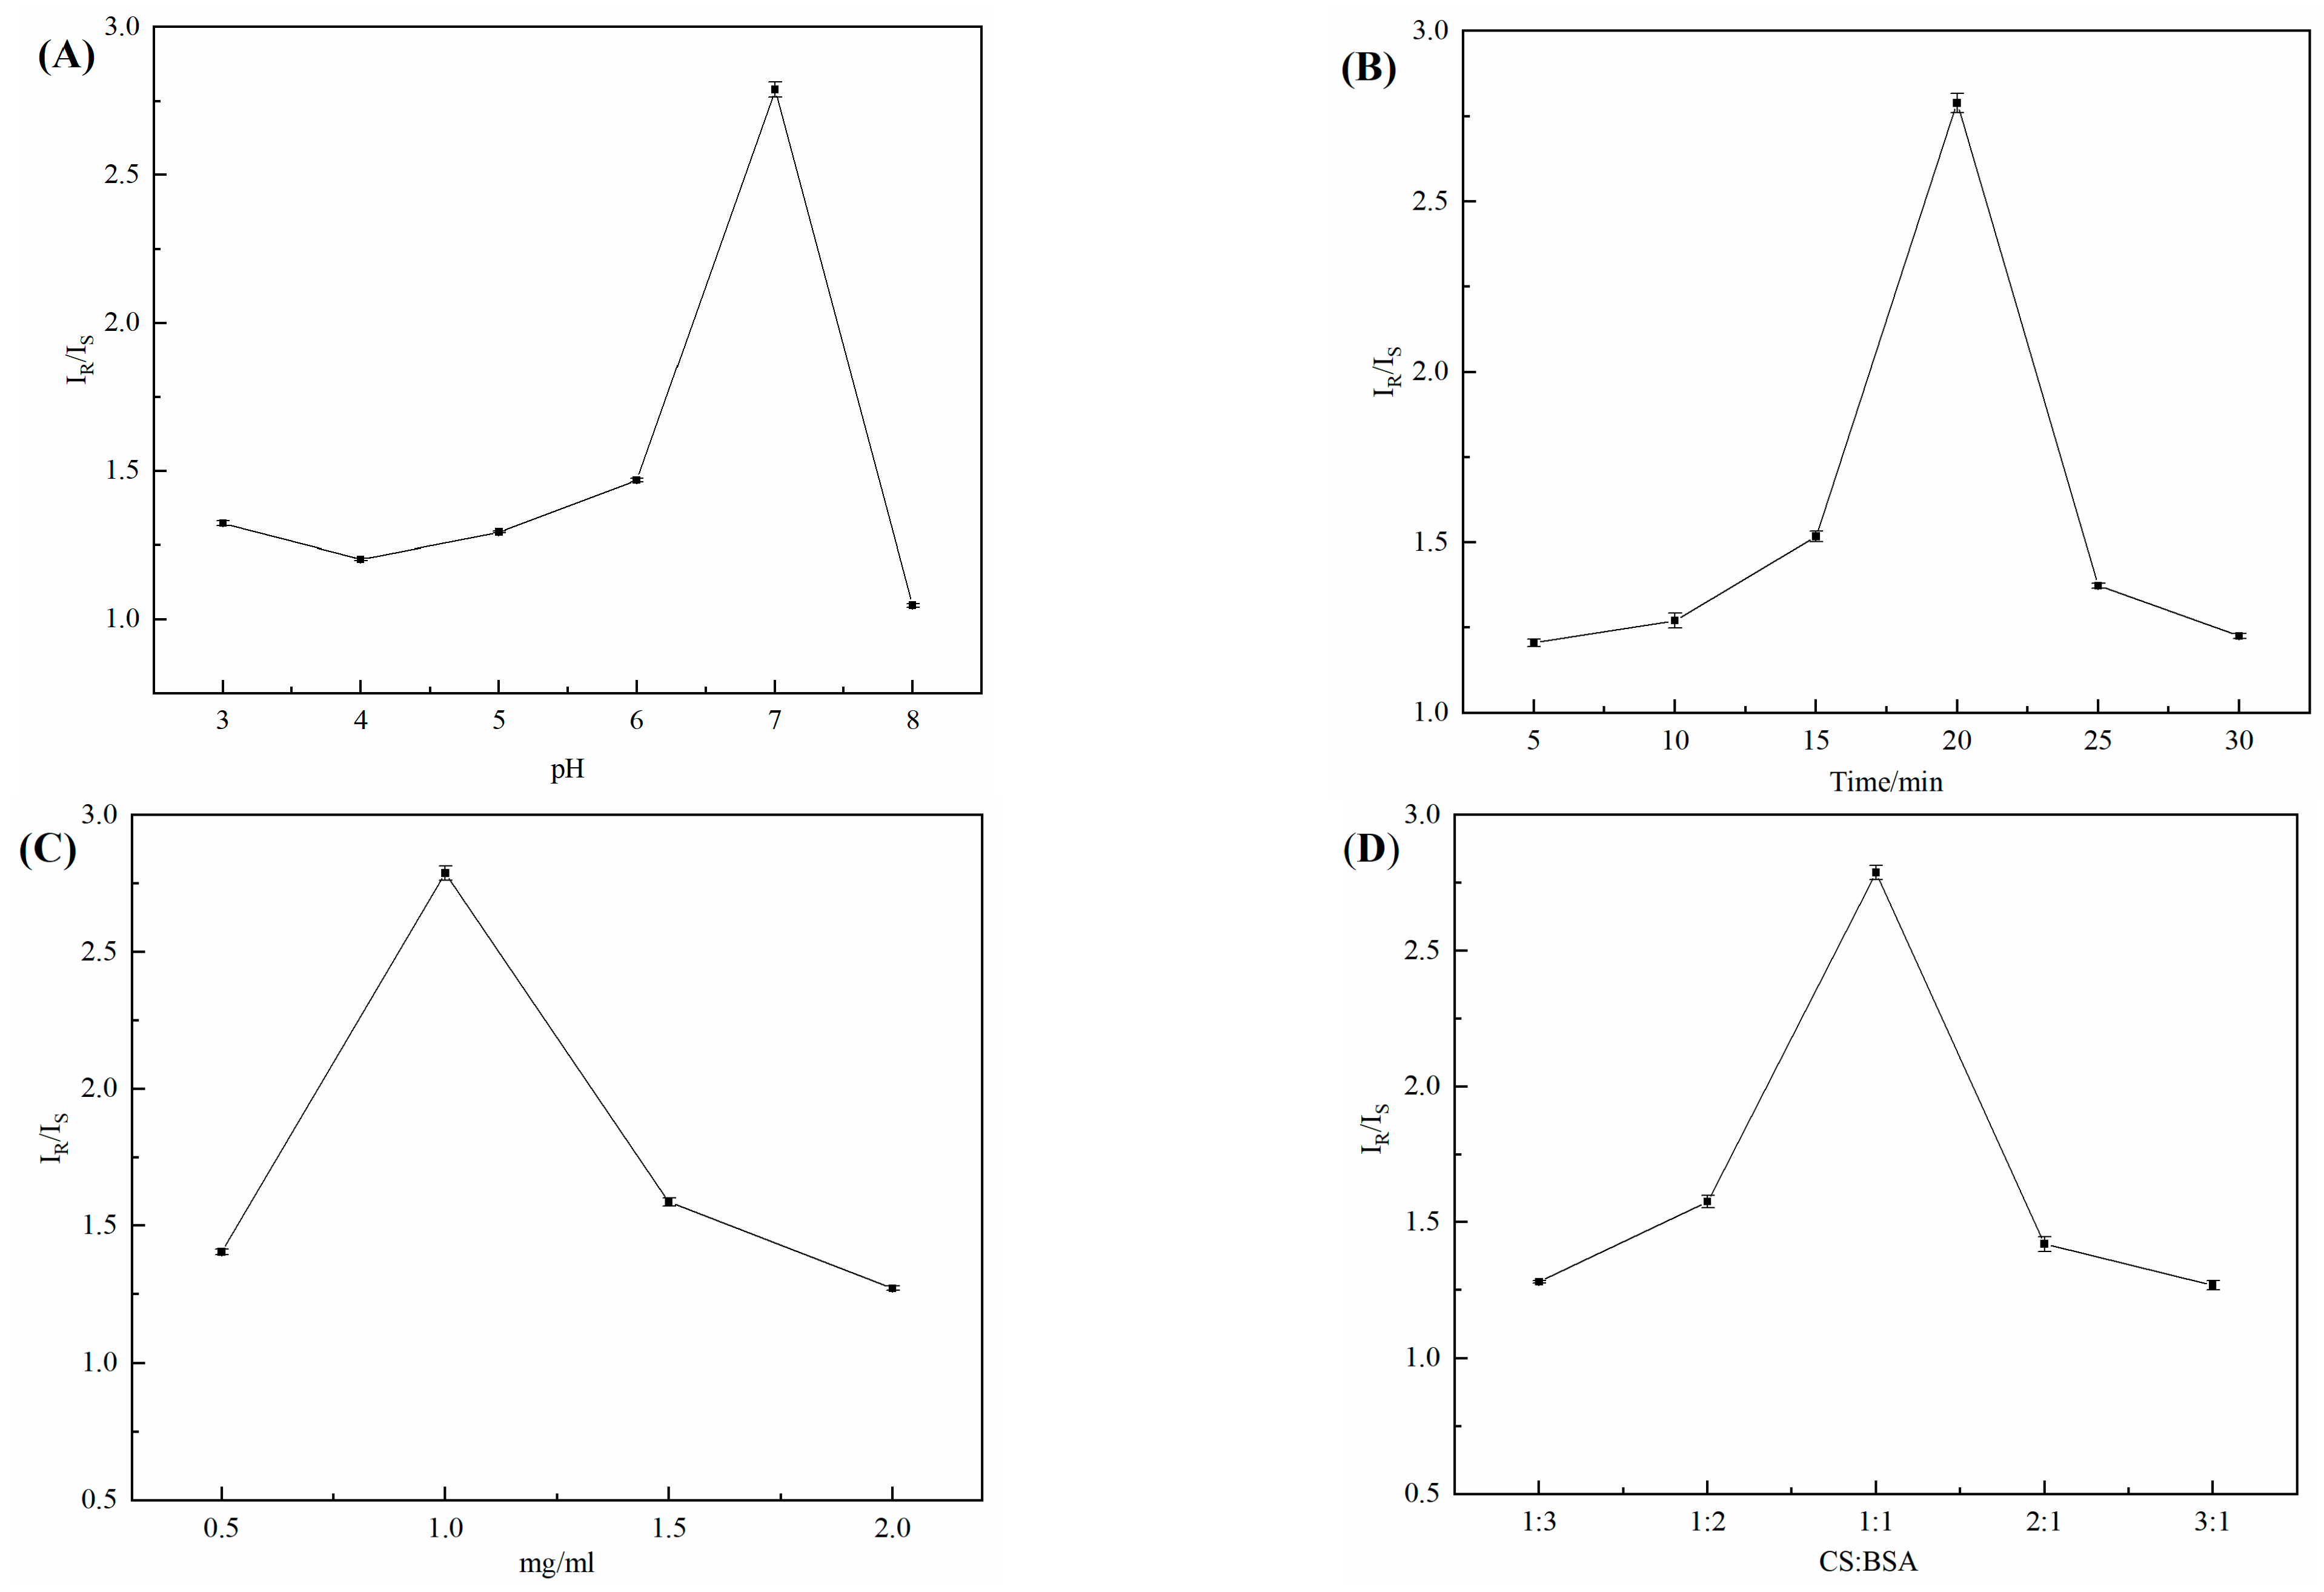
In order to achieve the best discrimination and identification effect, the interaction effect of dissimilar pH between enantiomer solutions and the modified electrode was researched on the peak current [43]. For electrochemical identification of enantiomers, the pH ranges from 3.0 to 8.0 (Figure 10A). The recognition efficiency continued to increase in the range of pH < 7. However, decreased in the pH > 7 range and the recognition efficiency was the best at pH = 7, which could be due to pH 7 or pH > 7 caused by electrostatic interaction, as pH = 7 is dominated by hydrogen bonds A pH of 7 was chosen as the optimum recognition concentration.
The length of interaction between the modified electrode and the enantiomer will also affect the recognition effect. From Figure 10B, it can be observed that the recognition effect is gradually enhanced from 5 min to 30 min; at 20 min, the peak current value IR/IS reaches the highest. Possibly because the enantiomer bound to the surface of the modified electrode had reached saturation. The IR/IS ratio and the recognition efficiency are significantly reduced when the incubation time is higher than 20 min. The results showed that enantiomeric stability decreased with time. Therefore, choose 20 min for the best recognition.
The amount of rGO directly affects the chirality recognition ability and conductivity of the sensor. Setting a series of concentrations to 0.5–2 mg/mL, the results are shown in Figure 10C; a load of 1 mg/mL of rGO can achieve the largest difference in peak current. By continuing to increase the amount of rGO, the difference in peak current decreases. It might be due to the amount of 3D–rGO being too low that the sensitivity of the chiral surface will decrease, resulting in a decline in the IR/IS. When the amount of 3D–rGO is too high, the relative content of the chiral selector in 3D–rGO–CS–BSA/GCE decreases, and the recognition effect is lowered. Selecting a loading concentration of 1 mg/mL as the better experimental condition.
The amount of chiral selectors CS and BSA directly affects the recognition performance of the electrochemical sensor. Prepare the mass concentration ratios of CS and BSA, which were 1:3, 1:2, 1:1, 2:1, and 3:1, respectively. Results of Figure 10D show that the mass concentration ratio of CS to BSA is 1:1 and the IR/IS is the highest. It may be due to the excessive amount of BSA decreasing the viscosity of the electrode surface, which reduces the stability of 3D–rGO–CS–BSA and makes the recognition effect less than ideal. At the same time, the exorbitant amount of CS will lead to more CS being exposed, which will hinder the combination of the chiral selector BSA and the enantiomer and decrease the recognition effect. When the concentration is 1:1, the peak current difference is the most obvious and the recognition effect is the best, so BSA and CS 1:1 were chosen as the experimental conditions.

3.11. Detection Line of 3D–rGO–CS–BSA/GCE

In order to further explore the effect between the concentrations of enantiomers and the 3D–rGO–CS–BSA/GCE alterations in peak current, DPV was performed, and the peak currents of different concentrations of enantiomers were noted. The peak current variation trends of R–enantiomer and S–enantiomer in the concentration range of 20–50 mM (20, 25, 30, 35, 40, 45, and 50 mM) were researched, respectively. It is worth noting that in Figure 11, the peak current of 3D–rGO–CS–BSA/GCE is proportional to the enantiomer concentration, which follows a linear relationship. The linear equation can be expressed as IP = 3.0651 CR + 10.4481, R2 = 0.9967, and IP = 1.2649 Cs − 5.4855, R2 = 0.9997. The LODs for R–enantiomer and S–enantiomer (S/N = 3) were calculated as 4.85 nM and 11.76 nM, respectively. This detection line was contrasted with previously reported ones (Table 1), and it outperformed most previously reported composites. The results show that the 3D–rGO–CS–BSA/GCE chiral sensor had better sensitivity and detection ability.

3.12. Stability and Reproducibility

Stability inspection is particularly important in enantiomer recognition. The storage stability of the modified electrodes was tested at 4 °C for 15 days, and the results are shown in Figure 12A. Compared with the current response of the first measurement, the peak current was 97.24% of the initial value at 15 days, illustrating its good stability. Next, we used the same method to prepare 6 3D–rGO–CS–BSA/GCE sensors and tested the R–/S–enantiomeric solutions. The results are shown in Figure 12B, and the relative standard deviation (RSD) equals 1.64%. These results prove that the electrode has good reproducibility.

3.13. Chiral Recognition of R–Enantiomers in Mixture Solutions

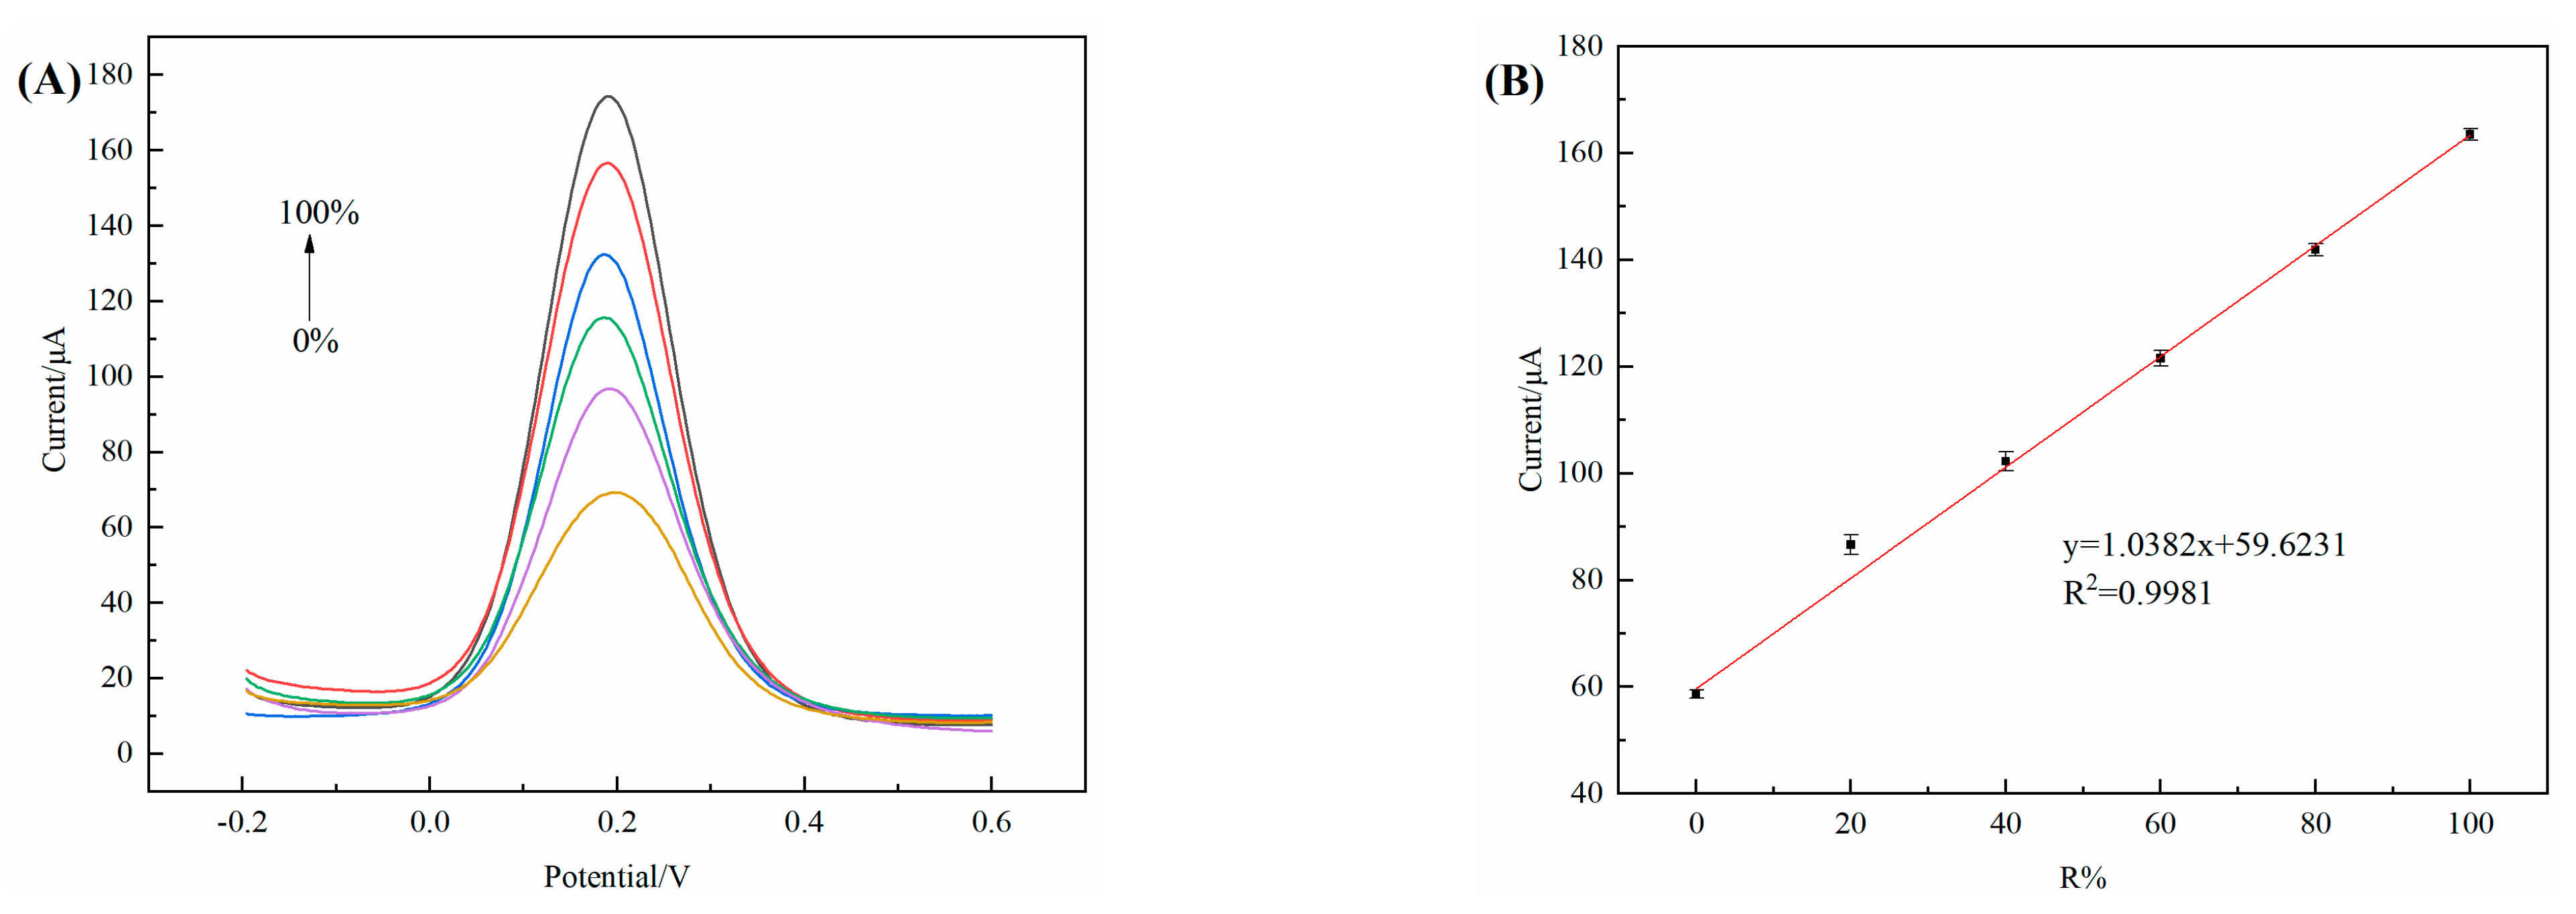
To further verify the practicability of the proposed sensor, it is also important to detect the enantiomer ratio by mixing the R–/S– enantiomers in different ratios. The total concentration of the enantiomer mixture solution was kept at 0.05 M, and the concentration ratios of the R–enantiomers in the mixture solution were 0%, 20%, 40%, 60%, 80%, and 100%, respectively. As shown in Figure 13A, when the R–enantiomer concentration is 100%, the peak current reaches its maximum value, indicating that the peak current has a certain linear relationship with the enantiomer concentration. Figure 13B shows that the linear relationship of the mixed solution is y = 1.0382x + 59.6231 and R2 = 0.9981, which proves that the electrode can be applied to detect the ratio of enantiomers in the R–/S–enantiomers mixture solution.
In order to test the practical application ability of 3D–rGO–CS–BSA/GCE. preparing 5 groups of enantiomeric mixed solutions for DPV detection. All examined results are shown in Table 2. The recovery rate of the 5 groups is 96.7–99.3%, RSD = 1.04%, and the developed 3D–rGO–CS–BSA/GCE has a good detection ability for the R–enantiomer.

3.14. Specificity of 3D–rGO–CS–BSA/GCE

Under the same conditions, we compared the three chiral drug intermediates R–/S–1–Boc–3–hydroxypyrrolidine, R–/S–2–amino–1–(4–nitrophenyl)–1–3–propanediol, and L–/D–phenylalanine (Phe) enantiomers and researched their selection specificities. The results shown in Figure 14 show peak current ratios of 1.28 and 1.51, respectively. whereas the IR/IS (2.82) of R–/S–1–Boc–3–hydroxypyrrolidine was higher than the other two chiral enantiomers, certifying the 3D–rGO–CS–BSA/GCE has high selectivity for enantiomers.

4. Conclusions

In conclusion, a novel chiral sensing platform was constructed by the process of hydrogen bonding between CS and BSA on rGO. The modified electrodes were characterized by SEM, UV, FT–IR, Raman spectroscopy, XPS, water contact angle, and electrochemical experiments. It was successfully applied to chiral recognition for the drug intermediate 1–Boc–3–hydroxypyrrolidine enantiomer. An obvious difference was achieved (IR/IS = 2.82) in the oxidation peak currents between the two enantiomers. The detection limits of the R–enantiomer and S–enantiomer were 4.85 nM and 11.76 nM, respectively. A better linear relationship (y = 1.0382x + 59.6231, R2 = 0.9981) exists in an enantiomer mixture solution. Under optimized conditions, the sensor exhibited excellent sensitivity and selectivity for enantiomer detection. It was calculated that the peak current still retains 97.24% of the initial current after 15 days, and the reproducibility and stability of the chiral sensor also provided satisfying results. These results confirm that the electrode modified by 3D–rGO–CS–BSA may be a promising candidate for constructing chiral drug identification and detection sensors.

5. Patents

Preparation and application of a 3D–rGO–CS–BSA composite modified electrode for electrochemical chiral recognition.

Author Contributions

Conceptualization, Y.J., S.L. and L.X.; methodology, Y.J. and S.L.; formal analysis, S.L., W.Y. and L.X.; investigation, Y.J., W.Y. and L.X.; writing—original draft preparation, S.L.; writing—review and editing, S.L., W.Y. and Y.J.; funding acquisition, Y.J. All authors have read and agreed to the published version of the manuscript.

Funding

This research was funded by the Jiangsu Key Laboratory of Advanced Catalytic Materials and Technology, Changzhou University, Changzhou, China, grant numbers ACGM2018-03-05.

Institutional Review Board Statement

Not applicable.

Informed Consent Statement

Not applicable.

Data Availability Statement

Not applicable.

Conflicts of Interest

The authors declare no conflict of interest.

References

  1. Zhang, Y.; Liu, G.; Yao, X.; Gao, S.; Xie, J.; Xu, H.; Lin, N. Electrochemical chiral sensor based on cellulose nanocrystals and multiwall carbon nanotubes for discrimination of tryptophan enantiomers. Cellulose 2018, 25, 3861–3871. [Google Scholar] [CrossRef]
  2. Rutkowska, M.; Plotka-Wasylka, J.; Morrison, C.; Wieczorek, P.P.; Namieanik, J.; Marc, M. Application of molecularly imprinted polymers in analytical chiral separations and analysis. TrAC Trends Anal. Chem. 2018, 102, 91–102. [Google Scholar] [CrossRef] [Green Version]
  3. Huang, X.-Y.; Quan, K.-J.; Pei, D.; Liu, J.-F.; Di, D.-L. The development of biphasic chiral recognition in chiral separation. Chirality 2018, 30, 974–981. [Google Scholar] [CrossRef] [PubMed]
  4. Zhu, G.; Kingsford, O.J.; Yi, Y.; Wong, K.-Y. Review—Recent Advances in Electrochemical Chiral Recognition. J. Electrochem. Soc. 2019, 166, H205–H217. [Google Scholar] [CrossRef]
  5. Chen, Q.; Zhou, J.; Han, Q.; Wang, Y.; Fu, Y. A new chiral electrochemical sensor for the enantioselective recognition of penicillamine enantiomers. J. Solid State Electrochem. 2012, 16, 2481–2485. [Google Scholar] [CrossRef]
  6. Lu, Q.; Chen, L.; Meng, Q.; Jiang, Y.; Xie, L. A biomolecule chiral interface base on BSA for electrochemical recognition of amine enantiomers. Chirality 2021, 33, 385–396. [Google Scholar] [CrossRef]
  7. Yang, S.; Wang, Y.; Jiang, Y.; Li, S.; Liu, W. Molecularly Imprinted Polymers for the Identification and Separation of Chiral Drugs and Biomolecules. Polymers 2016, 8, 216. [Google Scholar] [CrossRef]
  8. Harada, N. HPLC Separation of Diastereomers: Chiral Molecular Tools Useful for the Preparation of Enantiopure Compounds and Simultaneous Determination of Their Absolute Configurations. Molecules 2016, 21, 1328. [Google Scholar] [CrossRef] [Green Version]
  9. Wang, J.; Huang, S.H.; Chen, W.; Bai, Z.W. Eluent Tolerance and Enantioseparation Recovery of Chiral Packing Materials Based on Chitosan Bis(Phenylcarbamate)-(n-Octyl Urea)s for High Performance Liquid Chromatography. Molecules 2016, 21, 1528. [Google Scholar] [CrossRef] [Green Version]
  10. Behrendt, R.; White, P.; Offer, J. Advances in Fmoc solid-phase peptide synthesis. J. Pept. Sci. 2016, 22, 4–27. [Google Scholar] [CrossRef] [Green Version]
  11. Monteagudo, E.; Virgili, A.; Parella, T.; Pérez-Trujillo, M. Chiral Recognition by Dissolution DNP NMR Spectroscopy of 13C-Labeled DL-Methionine. Anal. Chem. 2017, 89, 4939–4944. [Google Scholar] [CrossRef]
  12. Li, T.; Wang, Y.; Kan, X. Electrochemical chiral recognition of tryptophan enantiomers based on copper-modified β-cyclodextrin. J. Electroanal. Chem. 2021, 902, 115817. [Google Scholar] [CrossRef]
  13. Jing, P.; Yin, Z.-Z.; Cai, W.; Li, J.; Wu, D.; Kong, Y. The hybrids of perylene tetracarboxylic acid functionalized multi-walled carbon nanotubes and chitosan for electrochemical chiral sensing of tryptophan enantiomers. Bioelectrochemistry 2022, 146, 108110. [Google Scholar] [CrossRef]
  14. Dong, L.; Zhang, Y.; Duan, X.; Zhu, X.; Sun, H.; Xu, J. Chiral PEDOT-Based Enantioselective Electrode Modification Material for Chiral Electrochemical Sensing: Mechanism and Model of Chiral Recognition. Anal. Chem. 2017, 89, 9695–9702. [Google Scholar] [CrossRef]
  15. Caroff, E.; Hubler, F.; Meyer, E.; Renneberg, D.; Gnerre, C.; Treiber, A.; Rey, M.; Hess, P.; Steiner, B.; Hilpert, K.; et al. 4-((R)-2-{[6-((S)-3-Methoxypyrrolidin-1-yl)-2-phenylpyrimidine-4-carbonyl]amino}-3-phosphonopropionyl)piperazine-1-carboxylic Acid Butyl Ester (ACT-246475) and Its Prodrug (ACT-281959), a Novel P2Y12 Receptor Antagonist with a Wider Therapeutic Window in the Rat Than Clopidogrel. J. Med. Chem. 2015, 58, 9133–9153. [Google Scholar] [CrossRef]
  16. El-ahmad, Y.; Tabart, M.; Halley, F.; Certal, V.; Thompson, F.; Filcoche-romme, B.; Gruss-leleu, F.; Muller, C.; Brollo, M.; Fabien, L.; et al. Discovery of 6-(2,4-Dichlorophenyl)-5-[4-[(3S)-1-(3-fluoropropyl)pyrrolidin-3-yl]oxyphenyl]-8,9-dihydro-7H-benzo[7]annulene-2-carboxylic acid (SAR439859), a Potent and Selective Estrogen Receptor Degrader (SERD) for the Treatment of Estrogen-Receptor-Positive Breast Cancer. J. Med. Chem. 2020, 63, 512–528. [Google Scholar] [CrossRef] [Green Version]
  17. Ge, Z.; Yang, L.; Xiao, F.; Wu, Y.; Yu, T.; Chen, J.; Lin, J.; Zhang, Y. Graphene Family Nanomaterials: Properties and Potential Applications in Dentistry. Int. J. Biomater. 2018, 2018, 1539678. [Google Scholar] [CrossRef] [Green Version]
  18. Saleem, H.; Haneef, M.; Abbasi, H.Y. Synthesis route of reduced graphene oxide via thermal reduction of chemically exfoliated graphene oxide. Mater. Chem. Phys. 2018, 204, 1–7. [Google Scholar] [CrossRef]
  19. Li, C.; Shi, G. Three-dimensional graphene architectures. Nanoscale 2012, 4, 5549–5563. [Google Scholar] [CrossRef]
  20. Tarcan, R.; Todor-Boer, O.; Petrovai, I.; Leordean, C.; Astilean, S.; Botiz, I. Reduced graphene oxide today. J. Mater. Chem. C 2020, 8, 1198–1224. [Google Scholar] [CrossRef]
  21. Wang, H.D.; Chu, L.Y.; Song, H.; Yang, J.P.; Xie, R.; Yang, M. Preparation and enantiomer separation characteristics of chitosan/β-cyclodextrin composite membranes. J. Membr. Sci. 2007, 297, 262–270. [Google Scholar] [CrossRef]
  22. Huq, T.; Khan, A.; Brown, D.; Dhanyagude, N.; He, Z.; Ni, Y. Sources, production and commercial applications of fungal chitosan: A review. J. Bioresour. Bioprod. 2022, 7, 85–98. [Google Scholar] [CrossRef]
  23. Madni, A.; Kousar, R.; Naeem, N.; Wahid, F. Recent advancements in applications of chitosan-based biomaterials for skin tissue engineering. J. Bioresour. Bioprod. 2021, 6, 11–25. [Google Scholar] [CrossRef]
  24. Grant, J.J.; Pillai, S.C.; Perova, T.S.; Hehir, S.; Hinder, S.J.; McAfee, M.; Breen, A. Electrospun Fibres of Chitosan/PVP for the Effective Chemotherapeutic Drug Delivery of 5-Fluorouracil. Chemosensors 2021, 9, 70. [Google Scholar] [CrossRef]
  25. Ardean, C.; Davidescu, C.M.; Nemes, N.S.; Negrea, A.; Ciopec, M.; Duteanu, N.; Negrea, P.; Duda-seiman, D.; Musta, V. Factors Influencing the Antibacterial Activity of Chitosan and Chitosan Modified by Functionalization. Int. J. Mol. Sci. 2021, 22, 7449. [Google Scholar] [CrossRef]
  26. Mabrouk, M.; Hammad, S.F.; Abdella, A.A.; Mansour, F.R. Enantioselective chitosan-based racemic ketoprofen imprinted polymer: Chiral recognition and resolution study. Int. J. Biol. Macromol. 2022, 200, 327–334. [Google Scholar] [CrossRef]
  27. Cai, W.R.; Zhu, W.K.; Yang, B.Z.; Wu, D.T.; Li, J.Y.; Yin, Z.Z.; Kong, Y. Porphyrin-Based Metal–Organic Frameworks for Efficient Electrochemiluminescent Chiral Recognition of Tyrosine Enantiomers. Chemosensors 2022, 10, 519. [Google Scholar] [CrossRef]
  28. Petrucci, R.; Pasquali, M.; Scaramuzzo, F.A.; Curulli, A. Recent Advances in Electrochemical Chitosan-Based Chemosensors and Biosensors: Applications in Food Safety. Chemosensors 2021, 9, 254. [Google Scholar] [CrossRef]
  29. Mashuni, M.; Ritonga, H.; Jahiding, M.; Rubak, B.; Hamid, F.H. Highly Sensitive Detection of Carbaryl Pesticides Using Potentiometric Biosensor with Nanocomposite Ag/r-Graphene Oxide/Chitosan Immobilized Acetylcholinesterase Enzyme. Chemosensors 2022, 10, 138. [Google Scholar] [CrossRef]
  30. Gu, Y.; Gong, G.; Jiang, Y.; Qin, J.; Mei, Y.; Han, J. Electrochemical Immunosensor Modified with Nitrogen-Doped Reduced Graphene Oxide@Carboxylated Multi-Walled Carbon Nanotubes/Chitosan@Gold Nanoparticles for CA125 Detection. Chemosensors 2022, 10, 272. [Google Scholar] [CrossRef]
  31. Pei, H.; Chen, F.; Niu, X.; Jia, Q.; Guo, R.; Liu, N.; Mo, Z. Self-assembled chitosan-sodium alginate composite material for electrochemical recognition of tyrosine isomers. J. Electroanal. Chem. 2021, 895, 115525. [Google Scholar] [CrossRef]
  32. Wei, X.; Chen, Y.; He, S.; Lian, H.; Cao, X.; Liu, B. Bovine serum albumin-coated titanium dioxide modified electrochemical interface for enantioselective discrimination of D/L-aspartic acid. Chirality 2021, 33, 731–744. [Google Scholar] [CrossRef]
  33. Huang, Y.; Deng, S.; Luo, X.; Liu, Y.; Xu, W.; Pan, J.; Wang, M.; Xia, Z. Evaluation of Intestinal Absorption Mechanism and Pharmacokinetics of Curcumin-Loaded Galactosylated Albumin Nanoparticles. Int. J. Nanomed. 2019, 14, 9721–9730. [Google Scholar] [CrossRef] [Green Version]
  34. Yao, W.; Li, S.; Xie, L.; Jiang, Y. Chiral recognition of tryptophan enantiomer based on the electrode modified by polyaniline adsorption bovine serum albumin complex. Chirality 2023, 35, 129–144. [Google Scholar] [CrossRef]
  35. Singh, R.; Ullah, S.; Rao, N.; Singh, M.; Patra, I.; Darko, D.A.; Issac, C.P.J.; Esmaeilzadeh-Salestani, K.; Kanaoujiya, R.; Vijayan, V. Synthesis of Three-Dimensional Reduced-Graphene Oxide from Graphene Oxide. J. Nanomater. 2022, 2022, 8731429. [Google Scholar] [CrossRef]
  36. Chen, Z.; Jin, L.; Hao, W.; Ren, W.; Cheng, H.-M. Synthesis and applications of three-dimensional graphene network structures. Mater. Today Nano 2019, 5, 100027. [Google Scholar] [CrossRef]
  37. Liang, W.; Rong, Y.; Fan, L.; Zhang, C.; Dong, W.; Li, J.; Niu, J.; Yang, C.; Shuang, S.; Dong, C.; et al. Simultaneous electrochemical sensing of serotonin, dopamine and ascorbic acid by using a nanocomposite prepared from reduced graphene oxide, Fe3O4 and hydroxypropyl-β-cyclodextrin. Microchim. Acta 2019, 186, 751. [Google Scholar] [CrossRef]
  38. Zagitova, L.; Yarkaeva, Y.; Zagitov, V.; Nazyrov, M.; Gainanova, S.; Maistrenko, V. Voltammetric chiral recognition of naproxen enantiomers by N-tosylproline functionalized chitosan and reduced graphene oxide based sensor. J. Electroanal. Chem. 2022, 922, 116744. [Google Scholar] [CrossRef]
  39. Niu, Q.; Jin, P.; Huang, Y.; Fan, L.; Zhang, C.; Yang, C.; Dong, C.; Liang, W.; Shuang, S. A selective electrochemical chiral interface based on a carboxymethyl-β-cyclodextrin/Pd@Au nanoparticles/3D reduced graphene oxide nanocomposite for tyrosine enantiomer recognition. Analyst 2022, 147, 880–888. [Google Scholar] [CrossRef]
  40. Chen, F.; Niu, X.; Yang, X.; Pei, H.; Guo, R.; Liu, N.; Mo, Z. Self-assembled reduced graphene oxide/polyaniline/sodium carboxymethyl cellulose nanocomposite for voltammetric recognition of tryptophan enantiomers. J. Mater. Sci. Mater. Electron. 2021, 32, 11791–11804. [Google Scholar] [CrossRef]
  41. Yang, J.; Wu, D.; Fan, G.-C.; Ma, L.; Tao, Y.; Qin, Y.; Kong, Y. A chiral helical self-assembly for electrochemical recognition of tryptophan enantiomers. Electrochem. Commun. 2019, 104, 106478. [Google Scholar] [CrossRef]
  42. Gou, H.; He, J.; Mo, Z.; Wei, X.; Hu, R.; Wang, Y.; Guo, R. A Highly Effective Electrochemical Chiral Sensor of Tryptophan Enantiomers Based on Covalently Functionalize Reduced Graphene Oxide with L-Lysine. J. Electrochem. Soc. 2016, 163, B272–B279. [Google Scholar] [CrossRef]
  43. Li, H.; Wang, L.; Yan, S.; Chen, J.; Zhang, M.; Zhao, R.; Niu, X.; Wang, K. Fusiform-like metal-organic framework for enantioselective discrimination of tryptophan enantiomers. Electrochim. Acta 2022, 419, 140409. [Google Scholar] [CrossRef]
  44. Yao, W.; Li, S.; Kong, Y.; Xie, L.; Jiang, Y. Chiral Recognition of Phenylglycinamide Enantiomer Based on Electrode Modified by Silver-Ammonia Ion-Functionalized Carbon Nanotubes Complex. Chemosensors 2023, 11, 86. [Google Scholar] [CrossRef]
  45. Pei, H.; Wang, J.; Jin, X.; Zhang, X.; Liu, W.; Guo, R.; Liu, N.; Mo, Z. An electrochemical chiral sensor based on glutamic acid functionalized graphene-gold nanocomposites for chiral recognition of tryptophan enantiomers. J. Electroanal. Chem. 2022, 913, 116283. [Google Scholar] [CrossRef]
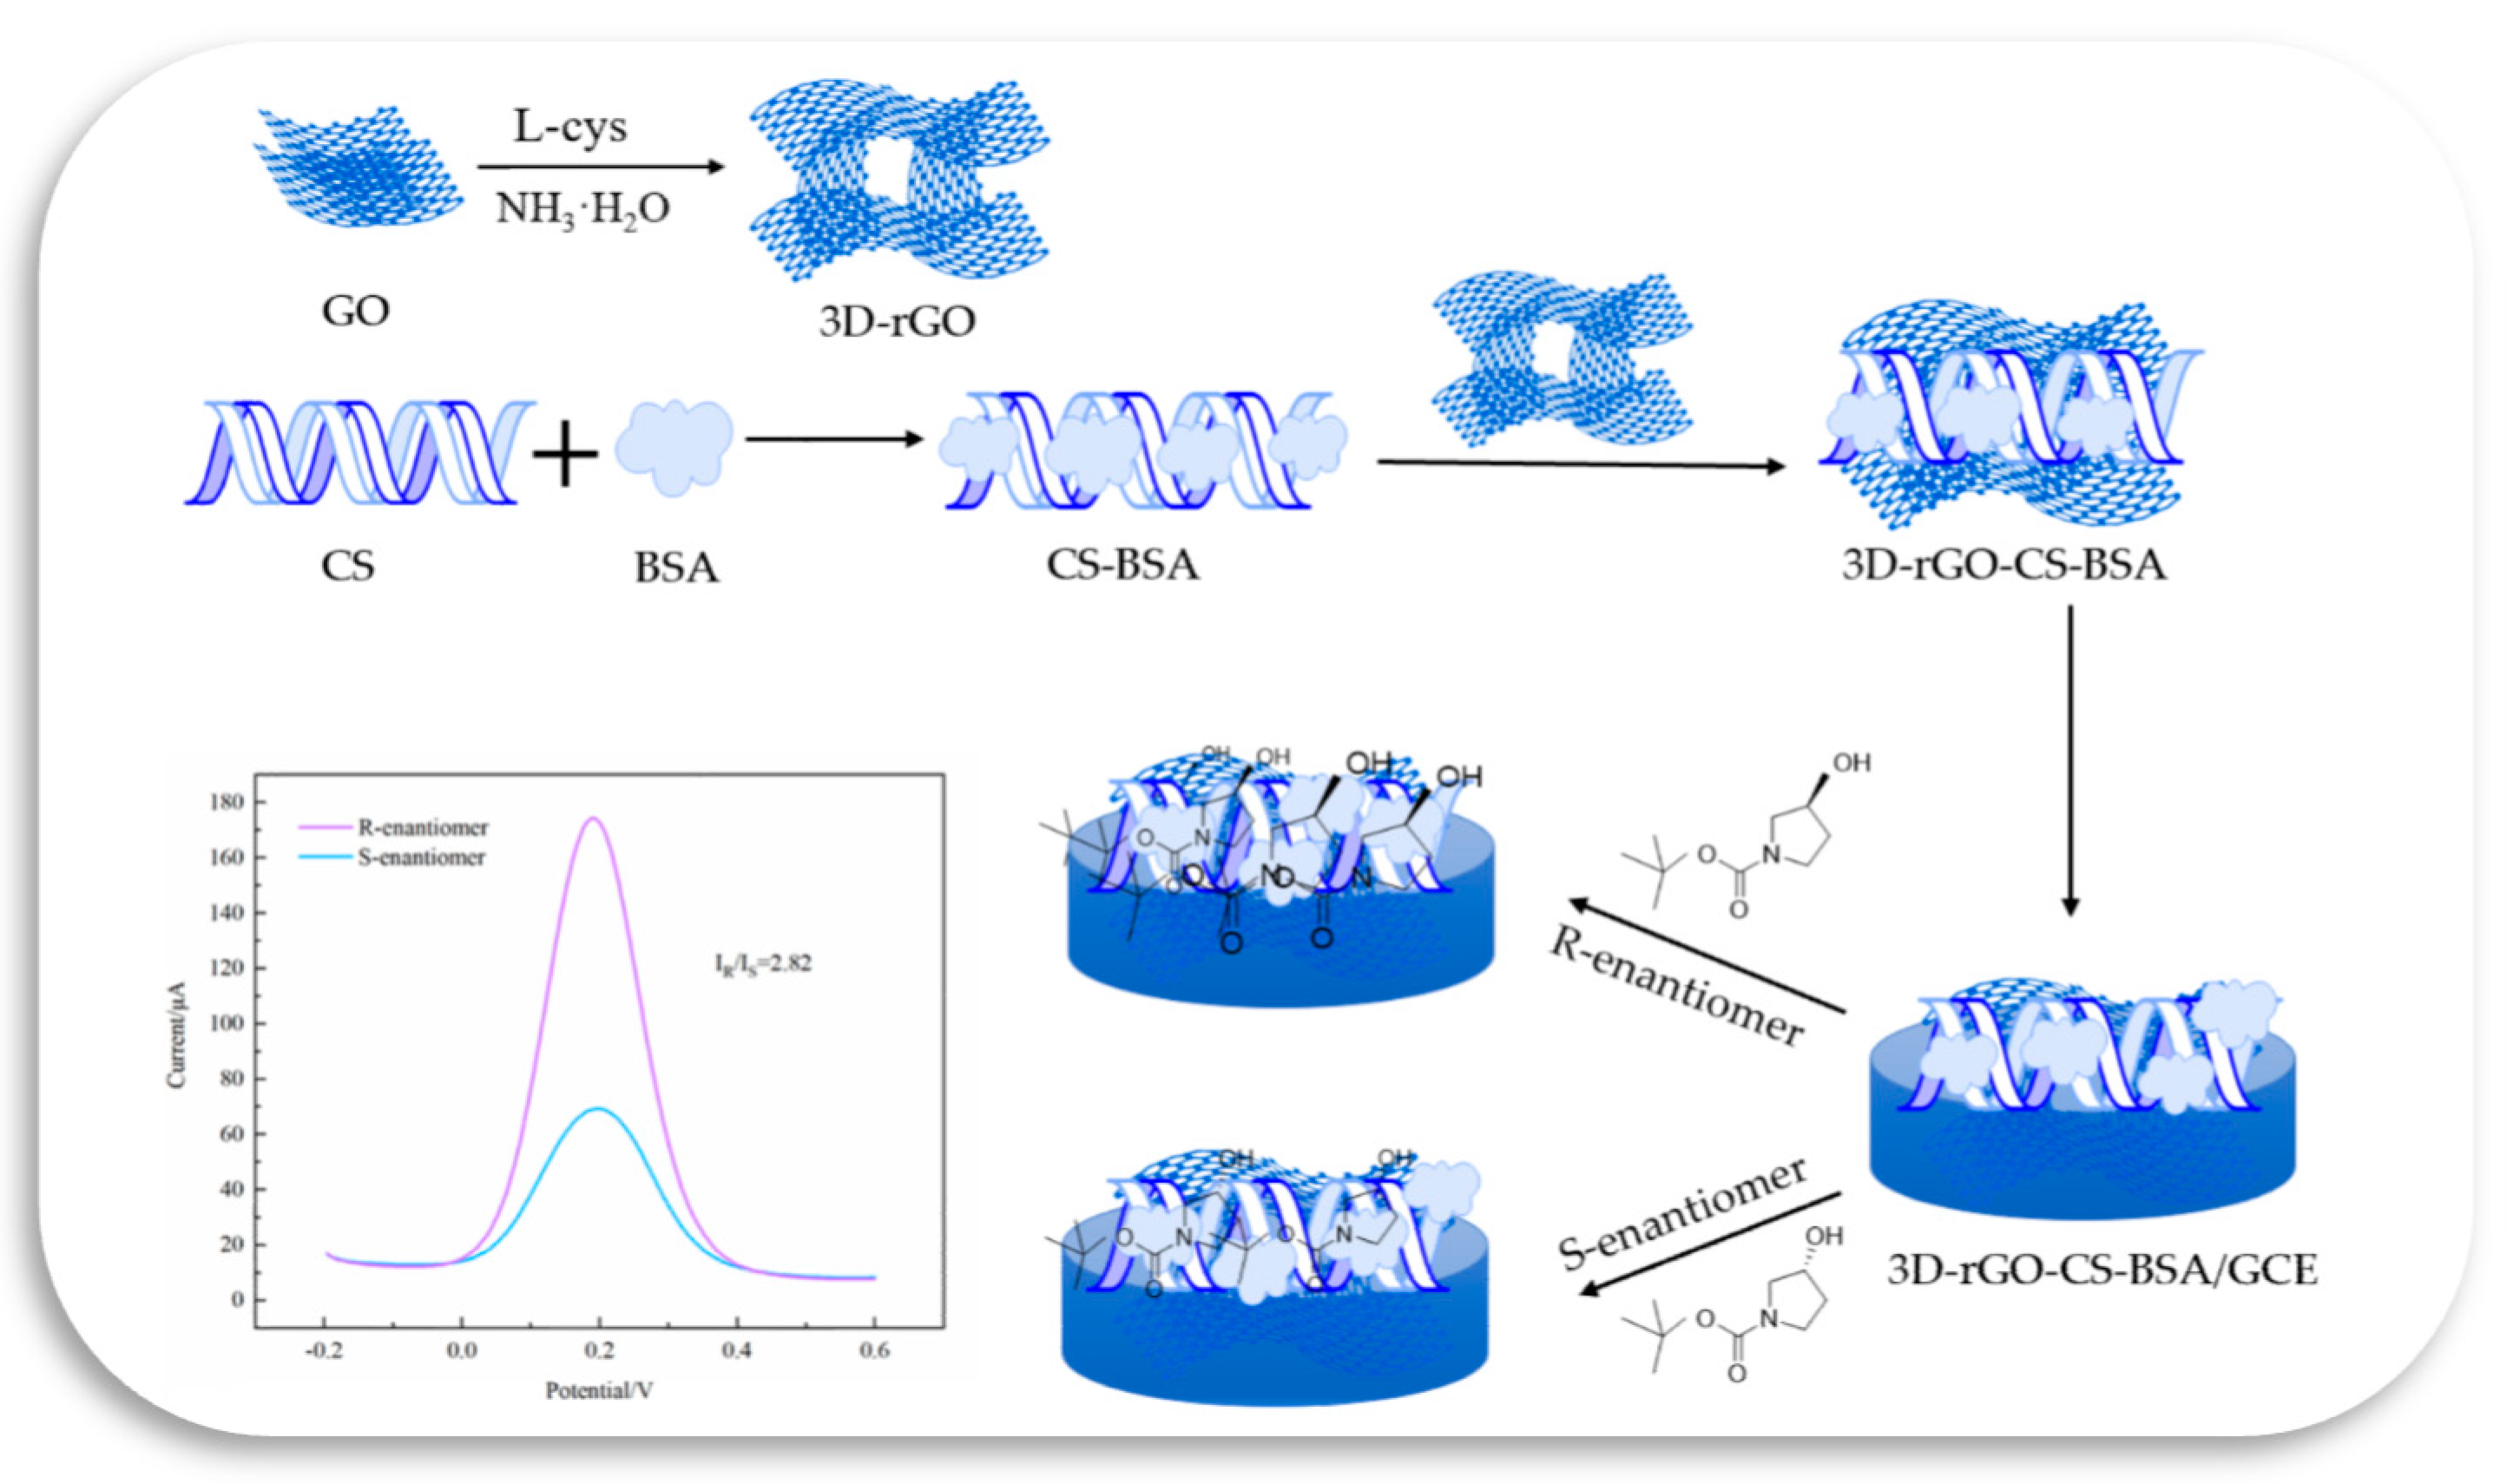
Scheme 1. Preparation of 3D–rGO–CS–BSA/GCE modified electrode and enantiomeric recognition.
Chemosensors 11 00243 sch001
Figure 1. SEM images of (A) 3D–rGO and (B) 3D–rGO–CS–BSA.
Chemosensors 11 00243 g001
Figure 2. UV spectra of (A) GO and (B) 3D–rGO.
Chemosensors 11 00243 g002
Figure 3. (A) FT–IR and (B) Raman spectra of GO, 3D–rGO, and 3D–rGO–CS–BSA.
Chemosensors 11 00243 g003
Figure 4. XPS survey spectra of (A) 3D–rGO–CS–BSA, (B) C 1s, (C) O 1s, and (D) N 1s.
Chemosensors 11 00243 g004
Figure 5. (A) CV and (B) EIS of bare GCE,3D–rGO,3D–rGO–CS,3D–rGO–CS–BSA in 0.1 M KCl containing 5 mM [Fe(CN)6]4−/3− solution.
Chemosensors 11 00243 g005
Figure 6. (A) CV of 3D–rGO–CS–BSA at scan rates of the different scan speeds in 0.1 M KCl containing 5 mM [Fe(CN)6]4−/3− solution; (B) linear relevance between scan rate and peak current.
Chemosensors 11 00243 g006
Figure 7. DPV curves of 0.05 M R–enantiomer or S–enantiomer at the (A) bare GCE, (B) 3D–rGO/GCE, (C) 3D–rGO–CS/GCE, (D) CS–BSA/GCE, and (E) 3D–rGO–CS–BSA/GCE were recorded in 0.1 M KCl containing 5 mM [Fe(CN)6]4−/3− solution, respectively.
Chemosensors 11 00243 g007
Figure 8. Water contact angles of (A) 3D–rGO–CS, (B) 3D–rGO–CS–BSA, (C) 3D–rGO–CS–BSA+S–enantiomer, and (D) 3D–rGO–CS–BSA+R–enantiomer.
Chemosensors 11 00243 g008
Figure 9. UV spectra of 0.2 mM R–enantiomer (A) and S–enantiomer (B) after adding distinct concentrations of 3D–rGO–CS–BSA (the amount–of–substance concentration of 3D–rGO–CS–BSA is replaced by the concentration of CS); double reciprocal plots of R–enantiomer (C) and S–enantiomer (D).
Chemosensors 11 00243 g009
Figure 10. (A) At pH 3–8, the IR/IS of the R–/S–enantiomer; (B) the R–/S–enantiomer IR/IS at various times; (C) the IR/IS of the R–/S–enantiomer at a diverse concentration of rGO; (D) the IR/IS of the R–/S–enantiomers at different concentrations of CS and BSA. The optimized conditions were tested in a 0.1 M KCl solution containing 5 mM [Fe(CN)6]4−/3− solution.
Chemosensors 11 00243 g010
Figure 11. DPV of R–enantiomer (A) and S–enantiomer (B) at various concentrations in 0.1 M KCl containing 5 mM [Fe(CN)6]4−/3− solution; (C) linearity of peak current versus concentration of R–enantiomer and S–enantiomer at different concentrations.
Chemosensors 11 00243 g011
Figure 12. (A) The stability investigation and (B) the reproducibility investigation of the 3D–rGO–CS–BSA modified electrode in 0.1 M KCl containing 5 mM [Fe(CN)6]4−/3− solution.
Chemosensors 11 00243 g012
Figure 13. (A) DPV of 0.05 M R–/S–enantiomeric mixed solution containing diverse content of R–enantiomeric with 3D–rGO–CS–BSA/GCE in 0.1 M KCl containing 5 mM [Fe(CN)6]4−/3− solution; (B) linear relationship between Ip and R–enantiomeric% in the enantio–enriched solution.
Chemosensors 11 00243 g013
Figure 14. Interaction of different chiral enantiomers with 3D–rGO–CS–BSA/GCE, (A) R–/S–2–amino–1–(4–nitrophenyl)–1,3–propanediol, (B) L–/D–Phenylalanine (Phe) in 0.1 M KCl containing 5 mM [Fe(CN)6]4−/3− solution.
Chemosensors 11 00243 g014
Table 1. A comparison of the detection limits of the diversely modified electrodes.
ElectrodeDetection ObjectLODReferences
APS–DPANI–BSAL–/D–Tryptophan0.071 mM (L)0.0478 mM (D)[33]
PAA–MWCNTs–Ag–SCSL–/D–Phenylglycinamide0.015 mM (L)0.036 mM (D)[44]
RGO–Au/L–GluL–/D–Tryptophan0.28 mM (L)0.86 mM (D)[45]
Pt–CLMOFL–/D–Methionine0.33 μM (L)0.60 μM (D)[41]
3D–rGO/Pd@Au/CM–β–CDL–/D–Tryptophan52 nM (L)96 nM (D)[38]
3D–rGO–CS–BSAR–/S–1–Boc–3–hydroxypyrrolidine4.85 nM (R)11.76 nM (S)This work
Table 2. Determination of R–enantiomers at different concentrations (total concentration: 0.05 M).
NumberAdded (mM)Peak Current (μA)Actual (mM)Recovery (%)RSD
16.6873.276.5798.351.04%
214.4388.6113.9696.74
321.39103.721.2299.20
436.90135.336.4498.75
541.71145.641.4099.26
Disclaimer/Publisher’s Note: The statements, opinions and data contained in all publications are solely those of the individual author(s) and contributor(s) and not of MDPI and/or the editor(s). MDPI and/or the editor(s) disclaim responsibility for any injury to people or property resulting from any ideas, methods, instructions or products referred to in the content.