Abstract
A non-contact method for detecting salt concentration in water using a microstrip patch sensor is presented in this work. The microstrip patch sensor, which has a low cost and simple build process, consists of a circular split ring resonator (SRR) with a hole drilled through the substrate in the middle area, and a microstrip patch antenna. The sensor was designed and fabricated using a printed circuit board (PCB) technique based on a negative dry film photoresist and photolithography method. It was built on an Arlon DiClad 880 substrate with a thickness of 1.6 mm and a relative permittivity of 2.2. The resonant frequencies (Fr) and reflection coefficients (S11) in the frequency range from 0.5 GHz to 0.8 GHz were recorded for analysis, both through simulation and experiment. The concentration of chloride and carbonate salts was varied from 0 mg/mL to 20 mg/mL in the tests using the sensor. The statistical analyses of S11 and Fr data obtained from measurements of five different salts at seven different concentrations (using the Shapiro–Wilk test, Bartlett test, and Kruskal–Wallis H test) were conducted using R version 4.2.0 to determine the relationship between the individual salts. The experimental results showed that the frequency response and resonance amplitude are functions of the concentration of each salt. The proposed method has the potential to be used for the non-contact measurement of industrial products, food quality, and health in the future.
1. Introduction
Planar microwave sensors are a very good choice for physical, chemical, and biological measurements, such as angular displacement and velocity [1,2], linear displacement and rotation [3,4], strain [5,6,7], pressure [8], ultraviolet [9], humidity [10,11], temperature [12], and the characterization of matter and materials in gas [13,14,15], liquid [16,17,18,19,20,21,22,23,24,25,26,27,28,29,30,31,32,33,34,35], and solid states [36,37]. An important reason for this is that planar microwave sensors are highly sensitive to the properties of matter and the materials they interact with, and they feature a low cost, design simplicity, ease of fabrication, compact size, robustness, and compatibility with other technologies, such as integration with the associated circuits and electronic devices, they can be implemented in flexible and compostable substrates, and they work with microfluidic systems. They have been applied in fields such as agriculture [38], health [39], food [40], pharmaceutical [40], medical [22,41], environmental [42,43], and energy [22], among others. Microwave sensors have many advantages such as being simple and easy to design, compact size, wide dynamic range, high linearity, low cost, high resolution and sensitivity, resistant to the environment, non-invasive and non-destructive, wireless sensing, good compatibility with other technologies, etc. Planar microwave resonant sensors can be classified into several groups according to different conditional criteria such as variation in frequency, variation in phase, splitting in frequency, coupling-modulation, and differential-mode [40]. Humans have known and interacted with salt for a long time [44]. Salt is considered to be an important ingredient in cooking, whether used to add a salty flavor to the food menu or for use in fermentation for food preservation. In addition, salt has many benefits, such as it can be used to preserve fruit and reduce the bitterness of vegetables, to remove stains and prevent color from staining clothes, and elimination of odors. It is used to preserve the freshness of flowers and to get rid of weeds, and contains elemental iodine to help stimulate the metabolism of energy in the body to work better; iodine is an essential element vital to human life. Sodium chloride (chemical formula: NaCl) is commonly known as table salt or halite. NaCl is a salt that plays a role in the salinity of the ocean and the extracellular fluid of multicellular organisms. It is the main ingredient in seasoning and as a preservative of food in the household and in the food industry [45]. However, it should be eaten in moderation because excess consumption can increase the risk of the occurrence of various diseases [46]. Therefore, in the production of certain foods and beverages, salt content must be controlled and measured during the production process. In addition to the food sector, salt measurements continue to have an important impact on other sectors such as agriculture [47], public health [48], environmental management [49], and energy production [50]. Salt concentration measurements can be performed via a number of methods [51,52]. There are two types of microwave sensors for measuring the concentration of salt in water: contact [27,46,51,52,53,54,55,56,57] and non-contact [29]. Contact sensors require physical contact with the water to measure the concentration of salt. These sensors use electrodes to measure the conductivity of the water, which is directly related to the concentration of salt. Contact sensors are accurate, but they can be cumbersome to use because they require the sensor to be submerged in the water. This can be inconvenient if the water is difficult to access or if the sensor needs to be moved frequently. Additionally, contact sensors can be damaged if they are not properly protected from water damage or if they are subjected to rough handling. Another disadvantage of using a contact microwave sensor is that the accuracy of the measurement may be affected by the presence of other substances in the water. For example, the presence of other ions or contaminants can interfere with the accuracy of the measurement. Non-contact sensors, on the other hand, do not require physical contact with the water. These sensors use microwaves to measure the concentration of salt in the water from a distance. Non-contact sensors, which are convenient to use but may not be as accurate as contact sensors, have shown promise for measuring the concentration of salt in water. However, past research has only studied and measured concentrations ranging from 40 mg/mL to 200 mg/mL [29], leaving a gap in data and analysis for lower concentrations. Moreover, large sample volumes are used in measurements. In order to improve the accuracy and reliability of non-contact microwave sensors for measuring salt concentration in water with measurements that use a smaller sample volume, further research and development is necessary. This work presents a non-contact detection method based on dielectric properties using a microstrip patch sensor. The method is capable of detecting concentrations lower than 40 mg/mL and reducing the sample volume for measurement by 50% compared to past research.
2. Materials and Methods
2.1. Microstrip Patch Sensor Design and Fabrication
The microstrip patch sensor used in this work is shown in Figure 1 and is based on the structure described in our previous work [29]. It consists of a feed line, a microstrip patch, and a circular split ring resonator (SRR) with a hole drilled through the center area. The sensor is fabricated on an Arlon DiClad 880 dielectric substrate with a relative permittivity of 2.2, a loss tangent of 0.0009, and a thickness of 1.6 mm. Figure 1a,b shows the top and bottom schematic views of the microwave sensor, respectively, with inset figures showing the fabricated sensor using a negative dry film lithographic process. The geometrical parameter values of the microwave sensor are provided in Table 1. The proposed sensor has a width (W) of 70 mm and a length (L) of 75 mm, resulting in a total size area of 5250 mm2. The ground plane has a size (WG × LG) of 875 mm2. The microstrip line width and length are represented by WFL and FL, respectively. The width and length of the patch are represented by WP and LP, respectively. The width of the SRR, inner diameter of the SRR, diameter of the hole, and the slot of the SRR are represented by d, DSRR, DHole, and s, respectively. An SRR is needed in the antenna sensor because it helps to resonate the radio frequency (RF) energy at the desired frequency of operation. This allows the antenna to have a higher gain and better directivity, which results in improved sensitivity and selectivity. An SRR is preferred in the proposed sensors because it has a compact size, which allows for a smaller overall traditional antenna sensor size. Additionally, SRRs have a higher quality factor than traditional resonators, which results in a higher selectivity and a sharper resonance peak. In this work, a circular SRR was selected for its application in measuring solutions filled in plastic centrifugal tubes commonly used in chemical and biochemical research. The researchers designed a hole in the center of the SRR to accommodate the insertion of a plastic centrifugal tube of 50 mL or less. The use of a circular SRR allows for non-contact measurements to be performed, providing several advantages such as increased safety and reduced wear and tear. Non-contact measurement methods can also measure a wide range of materials and objects and provide faster measurements in real-time. Additionally, many non-contact measurement methods are not affected by environmental factors such as temperature, pressure, and humidity.
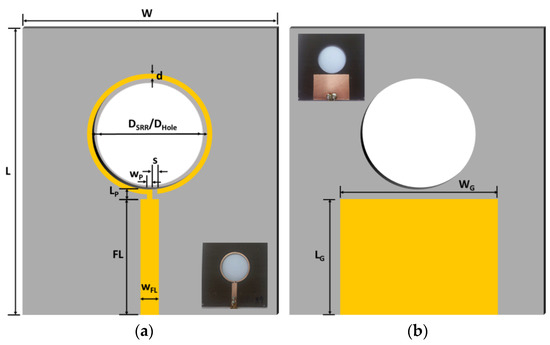
Figure 1.
Microstrip patch sensor geometry and dimensions: (a) top view and (b) bottom view.

Table 1.
Geometrical parameters of a microwave sensor.
2.2. Salt Concentration Preparation
Analytical grade chlorides and carbonate salts including NaCl, KCl, MgCl2, CaCl2, and Na2CO3 were used in the experiment and were obtained from Ajax Finechem. The salts were dissolved in DI water to a concentration range of 0.625–20 mg/mL, which consists of 0.625, 1.25, 2.5, 5, 10, and 20 mg/mL.
2.3. Measurement Setup
Figure 2 shows a device installation to test the sensor’s response to various salts. The plastic centrifuge tube was filled with 25 mL of salt solutions. Each salt was prepared in six concentrations, with three replications of each concentration. The sensor was mounted on a plastic test tube rack, with the sensor hole precisely aligned with the hole in the test tube rack. The vector network analyzer (VNA) was connected to the sensor using a high frequency cable. The VNA was set to measure the sensor’s resonance peaks in three frequency ranges: 0.5 GHz to 0.6 GHz for the first resonance peak, 0.6 GHz to 0.7 GHz for the second resonance peak, and 0.7 GHz to 0.8 GHz for the third resonance peak. For each frequency range, 1601 data points were recorded.
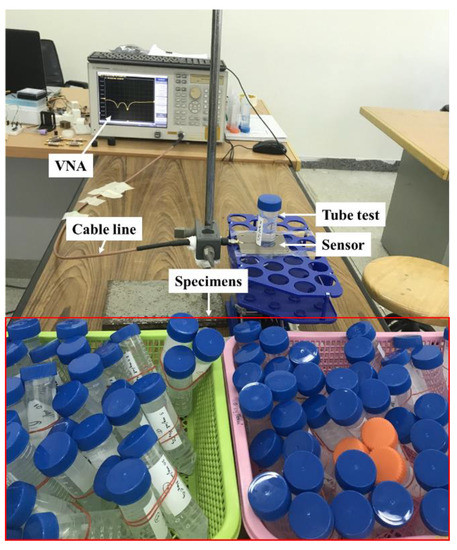
Figure 2.
The experimental setup.
3. Results
3.1. Reflection Coefficient of Sensor Response
Figure 3 illustrates the reflection coefficient spectra of various salt types and DI water in the frequency range of 0.5–0.8 GHz, which is divided into three ranges: 0.5–0.6 GHz for the first resonance peak, 0.6–0.7 GHz for the second resonance peak, and 0.7–0.8 GHz for the third resonance peak. It was found that for both S11 and Fr, the response of each frequency range of the sensor to the change in salt concentration was different when considering the graph. Therefore, to clarify and facilitate analysis, the reflection coefficient spectra for each peak were extracted and plotted on the graph. Figure 4, Figure 5 and Figure 6 display the reflection coefficient spectra of different salt types and DI water in the first resonance peak (Figure 4), second resonance peak (Figure 5), and third resonance peak (Figure 6), respectively. Each salt was prepared in six concentrations, ranging from 0.625 to 20 mg/mL with an increment of two times at each step. The measurements indicated that the S11 and Fr values changed with the changing concentrations of the individual salts. The result of observing the reflection coefficient spectra of the DI water (gray dotted line) measurements was that three peaks were found to occur at the frequencies of 0.577 GHz, 0.633 GHz, and 0.703 GHz, with S11 values of −26.65 dB, −15.58 dB, and −36.18 dB, respectively, for each peak. When measuring each salt at different concentrations, it was found that the pattern of change for S11 and Fr in each peak was different. As shown in Figure 3, as the salt concentration increases, the values of S11 and Fr change in both increasing and decreasing ways.
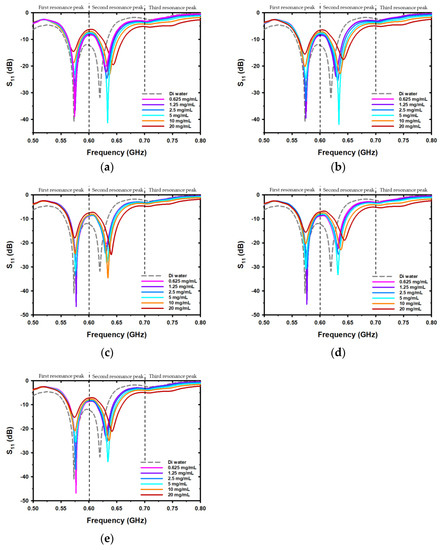
Figure 3.
The reflection coefficient spectra in the frequency range of 0.5 GHz to 0.8 GHz are divided into three ranges, consisting of the first, second, and third resonance peaks for different concentrations of (a) sodium chloride (NaCl), (b) potassium chloride (KCl), (c) magnesium chloride (MgCl2), (d) calcium chloride (CaCl2), and (e) sodium carbonate (Na2CO3).
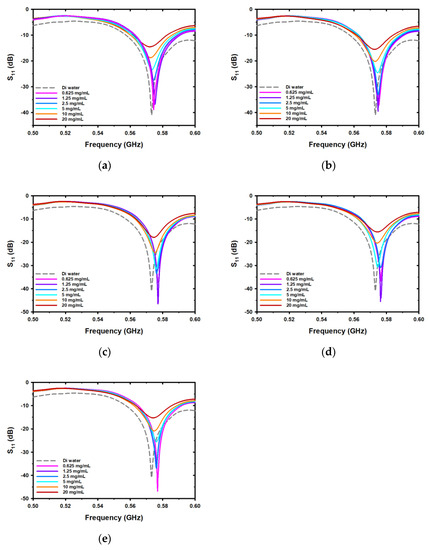
Figure 4.
The reflection coefficient spectra in the frequency range from 0.5 GHz to 0.6 GHz for the first resonance peak for different concentrations of (a) sodium chloride (NaCl), (b) potassium chloride (KCl), (c) magnesium chloride (MgCl2), (d) calcium chloride (CaCl2), and (e) sodium carbonate (Na2CO3).
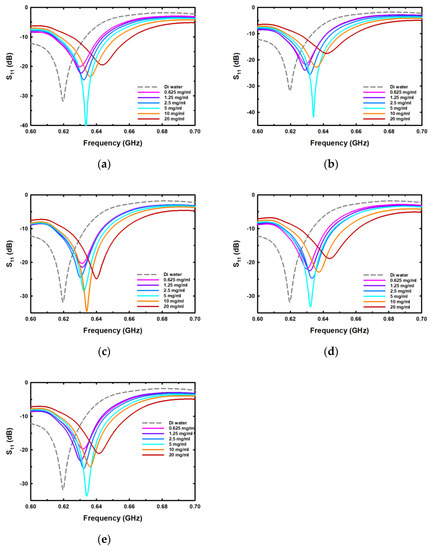
Figure 5.
The reflection coefficient spectra in the frequency range from 0.6 GHz to 0.7 GHz for the second resonance peak for different concentrations of (a) sodium chloride (NaCl), (b) potassium chloride (KCl), (c) magnesium chloride (MgCl2), (d) calcium chloride (CaCl2), and (e) sodium carbonate (Na2CO3).
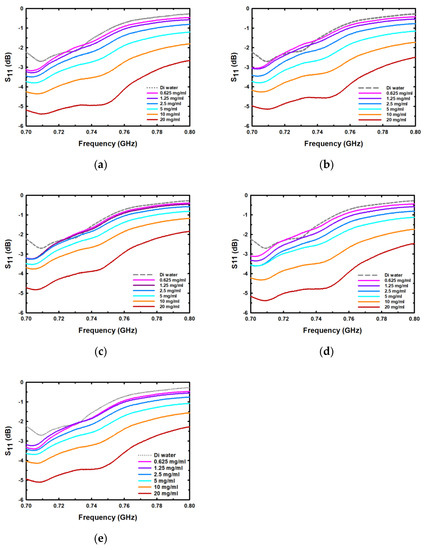
Figure 6.
The reflection coefficient spectra in the frequency range from 0.7 GHz to 0.8 GHz for the third resonance peak for different concentrations of (a) sodium chloride (NaCl), (b) potassium chloride (KCl), (c) magnesium chloride (MgCl2), (d) calcium chloride (CaCl2), and (e) sodium carbonate (Na2CO3).
For the first resonance peak obtained from the detection of each salt type at various concentrations, Figure 4 shows the reflection coefficient spectra in the frequency range from 0.5 GHz to 0.6 GHz. The measurement results show that, when measuring all salts used in the experiment, the Fr increased from the Fr obtained from the DI water measurement. However, it was found that Fr tended to decrease with increasing salt concentration when considering only the concentration range between 0.625–20 mg/mL. When considering the S11 value, it was found that the S11 value tended to increase as the salt concentration increased.
Figure 5 presents the reflection coefficient spectra in the frequency range from 0.6 GHz to 0.7 GHz for the second resonance peak after measuring each salt with different concentrations. When measuring all salts used in the experiment, the Fr increased from the Fr obtained from the DI water measurement, as shown by the measurement results. The measurement results clearly show that, in the measurement of NaCl, KCl, CaCl2, and Na2CO3 within the concentration range of 0.625–5 mg/mL, the S11 value decreases and then increases again at concentrations greater than 5 mg/mL. The MgCl2 measurements showed that the S11 value continued to decrease from 0.625 to 10 mg/mL and increased again after the concentration was greater than 10 mg/mL.
The reflection coefficient spectra for the third resonance peak, after measuring each salt with different concentrations, are presented in Figure 6 within the frequency range from 0.7 GHz to 0.8 GHz. The third peak has a lower notch than the first and second peaks, but it can still be measured and observed, as found. The measurement results indicate that the relationship between S11 and Fr when the salt concentration was changed tended to be inverse, as S11 decreased while Fr increased with increasing salt concentration. There was a relatively small change in S11 and Fr in the low concentration range and a more pronounced change with an increase in concentration. The next section will provide detailed information on the analysis of the correlation between salt concentration, S11, and Fr in each peak, to see details and clear information. The S11 and Fr values of each salt were then extracted separately, and a correlation equation with each salt concentration was constructed using the S11 and Fr data, as shown in Table 2, Table 3 and Table 4.

Table 2.
The equations and parameters of this relationship for each salt in the frequency range of the first resonance peak.

Table 3.
The equations and parameters of this relationship for each salt in the frequency range of the second resonance peak.

Table 4.
The equations and parameters of this relationship for each salt in the frequency range of the third resonance peak.
3.2. The Relationship between the Concentration of Salt in Water and the Resulting Values of S11 and Fr
The relationship between the concentrations of salt in the range of 0.625–20 mg/mL and the S11 and Fr in the first resonance peak is shown in Figure 7. Figure 7a,b shows the non-linear correlation between the concentration of salt and the S11 and Fr, with the equations and parameters of this relationship for each salt provided in Table 2. The relationship between the concentrations of salt and the S11 and Fr can be described using the power equation and exponential decay equation with three constant parameters, respectively. It was found that the relationship between the measurement results of S11 and Fr of each salt at various concentrations was the same, which is that as the salt concentration increases, S11 increases as a power function and Fr decreases as an exponential decay function. In this study, it was found that measurement results at low salt concentrations have a higher tolerance than in the case of high concentrations. This may be attributed to the variable energy loss in the electric field caused by the unsteady movement of free ions in the water.
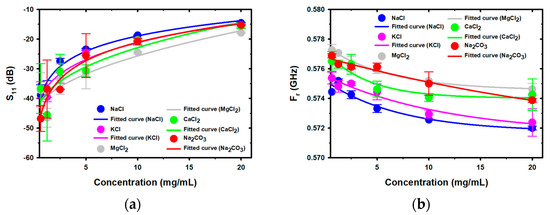
Figure 7.
The relationship between the concentration of salt in water in the frequency range of the first resonance peak and the resulting values of (a) S11 and (b) Fr.
The relationship between the S11 and Fr and the concentrations of salt in the range of 0.625–20 mg/mL in the second resonance peak is shown in Figure 8. Figure 8a shows the non-linear correlation between the S11 and the concentration of salt, with the equations and parameters of this relationship for each salt provided in Table 3. The results showed that the relationship can be divided into two ranges at concentrations of 0.625–5 mg/mL and 5–20 mg/mL for NaCl, KCl, CaCl2, and Na2CO3, while the MgCl2 sample is divided into two ranges between 0.625–10 mg/mL and 10–20 mg/mL. Figure 8b shows the linear correlation between the Fr and the concentration of salt. The equations and parameters of the relationship between Fr and the concentration of each salt are shown in Table 3. The relationship between the S11 and Fr and the concentrations of salt can be described using the power (symmetric, four parameter) and polynomial (linear) equations, respectively. The results showed that all tested salts (NaCl, KCl, MgCl2, CaCl2, and Na2CO3) had a similar pattern of reduction and increase in S11 in the concentration range from 0.625 to 20 mg/mL. NaCl, KCl, CaCl2, and Na2CO3 had a transition point of 5 mg/mL. However, MgCl2 had a transition point of 10 mg/mL. In this study, it was found that the low concentration of MgCl2 has a different transition range to the other salts. This may be due to the formation of the solvent-separated ion pair (SSIP) configuration of MgCl2 at a higher concentration than the other salts used in the study.
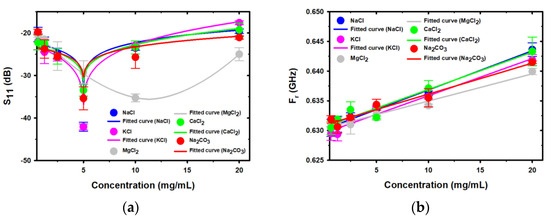
Figure 8.
The relationship between the concentration of salt in water in the frequency range of the second resonance peak and the resulting values of (a) S11 and (b) Fr.
The relationship between the magnitude of S11 and Fr and the concentrations of salt in the range of 0.625–20 mg/mL is shown in Figure 9. The relationship between the magnitude of S11 and Fr and the concentration of salt is linearly correlated, as shown in Figure 9a,b, respectively. The equations and parameters of the relationship between S11 and Fr and the concentrations of each salt are provided in Table 4. The measurement results showed that the magnitude of S11 decreased as the concentration of salt increased. The variation in the magnitude of S11 among the different salt concentrations can be attributed to the variation in the tangent loss, which affects the reflectance power of the measured sensor. At the same time, it was found that the Fr value was higher when the salt concentration was higher, which can be attributed to the reduction in the relative permittivity.
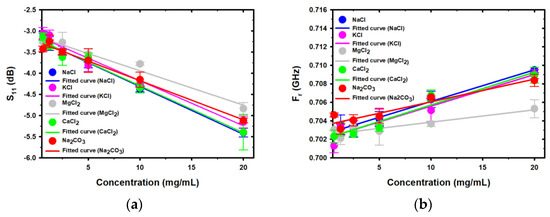
Figure 9.
The relationship between the concentration of salt in water in the frequency range of the third resonance peak and the resulting values of (a) S11 and (b) Fr.
From the results, it was found that the relationship between S11 and Fr with salt concentrations varying in the range from 0.625 to 20 mg/mL was different in each frequency band. This is due to the fact that the sensor’s response magnitude of S11 and Fr was affected by variations in the sample’s dielectric properties, volume fraction, and salt concentration, as described by electrolyte conductance, ion cloud relaxation, ion-pair rotation, and the Maxwell Garnett mixing theory [58,59,60,61,62,63]. The complex relative permittivity of salt solutions as a function of frequency (f) is represented by the following equation: , where is the complex relative permittivity, is the real part of the complex relative permittivity, and is the imaginary part of the complex relative permittivity. The imaginary part of the complex relative permittivity of conducting samples contains two contributions, as represented by the following equation:, where is the dielectric loss and is the loss due to the drift of ions. The loss due to the drift of ions tends to mask the dielectric contribution at low frequencies, as represented by the following equation: , where is the ionic conductivity and is the permittivity of free space [64]. The dielectric constant of electrolyte water solutions is represented by the following equation: , where is the dielectric constant of DI water, is the electrolyte solution concentration, and is a phenomenological ion-specific parameter [65]. The error bar in Figure 7, Figure 8 and Figure 9 indicates measurement uncertainty potentially caused by the sample preparation process and gaps between the split ring and plastic centrifuge tubes that may have occurred during the experiment, due to the factory’s inability to control the plastic centrifuge tubes used. Additionally, the values of S11 and Fr that result from the concentration of salt in water depend on the specific properties of the salt and the water, as well as the specific design and operating parameters of the sensor being used to measure these values. In this work, it was found that the concentration of salt in water affects the values of S11 and Fr by changing the dielectric properties of the water, which in turn affects the way in which electromagnetic waves propagate through the solution. The specific nature of this relationship may be complex and may depend on various factors, including the type of salt, the concentration of the salt, the temperature and pH of the water, and the operating frequency of the sensor.
3.3. Statistical Analysis
The Shapiro–Wilk test and the Bartlett test were used to assess the normality and homogeneity of variance of the experimental data, respectively. When it was found that the data were abnormally distributed, it was analyzed using the Kruskal–Wallis H test. All statistical analyses were performed using R version 4.2.0. The S11 and Fr data obtained from the measurements of five different salts at seven different concentrations were recorded and analyzed. The Shapiro–Wilk test was performed on the S11 and Fr data of the first resonance peak, and it was found that the p-value was greater than 0.05 (p = 0.104 and p = 0.3031), indicating that the distribution of the data was not significantly different from a normal distribution. The S11 and Fr data of the second and third resonance peaks were analyzed using the Shapiro–Wilk test, revealing a p-value of less than 0.05 (p = 0.0075, p = 0.0017, p = 0.0198, and p = 0.0056, respectively). This suggests that the data obtained from the measurements of the second and third resonance peaks deviate from a normal distribution. Bartlett’s test was performed on the S11 and Fr data of all three peaks, and it was found that the p-value was not less than the significance level of 0.05. This indicates that the variance for all salts is the same based on the data obtained from the three peaks. Additionally, when we tested for significant differences between the S11 and Fr data of the second and third resonance peaks obtained from the five salt measurement samples under seven different concentrations using the Kruskal–Wallis H test, we found that the p-value was greater than the significance level of 0.05, indicating that there were no statistically significant differences. Figure 10a shows a boxplot of the S11 data obtained from the first resonance peak for each salt. The top and bottom whiskers on the figure depict the maximum and minimum values of the corresponding salts. The line inside each box represents the median value, while the upper and lower borders of the boxes indicate the 75th and 25th percentile values, respectively. In all tests of salt measurement, the results indicated that the median was greater than the mean. Specifically, the medians of NaCl, KCl, MgCl2, CaCl2, and Na2CO3 were −25.45 dB, −28.83 dB, −32.59 dB, −30.81 dB, and −31.21 dB, respectively. Meanwhile, the means of these salts were −26.66 dB, −28.34 dB, −31.88 dB, −29.96 dB, and −30.40 dB, respectively. When taken together, the mean and median of all salts were −29.45 dB and −29.79 dB, respectively. According to the box plot, NaCl has the highest median value when compared to the other salts, including KCl, MgCl2, CaCl2, and Na2CO3. Figure 10b shows a boxplot of the Fr data obtained from the first resonance peak for each salt; it can be observed that NaCl had the lowest mean and median among the salts. When the mean and median of all salts were calculated, they were found to be 0.5750 GHz and 0.5752 GHz, respectively.
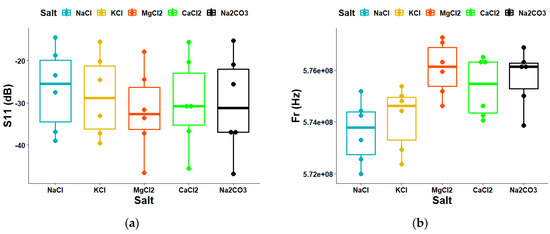
Figure 10.
The distribution characteristics of the raw data were compared in each group obtained from the first resonance peak: (a) boxplot (S11) and (b) boxplot (Fr).
Figure 11a,b shows the boxplots of the S11 data and the Fr data obtained from the second resonance peak for each salt, respectively. In all tests of salt measurement, the results indicated that the median was greater than the mean. Specifically, the medians of NaCl, KCl, MgCl2, CaCl2, and Na2CO3 were −25.51 dB, −25.82 dB, −26.13 dB, −24.39 dB, and −25.21 dB, respectively. Meanwhile, the means of these salts were −23.12 dB, −23.70 dB, −25.20 dB, −22.96 dB, and −24.67 dB, respectively. When taken together, the mean and median of all salts were −25.41 dB and −23.93 dB, respectively. The boxplot for CaCl2 has the highest median in the S11 data case, while the median for MgCl2 is the smallest in the Fr data case. When the mean and median of all salts were calculated, they were found to be 0.6338 GHz and 0.6326 GHz, respectively.
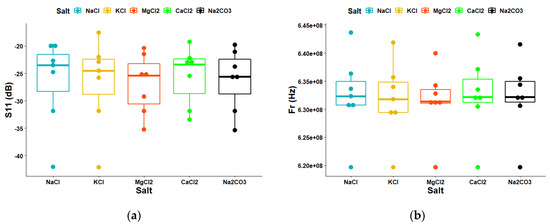
Figure 11.
The distribution characteristics of the raw data were compared in each group obtained from the second resonance peak: (a) boxplot (S11) and (b) boxplot (Fr).
Figure 12a,b shows the boxplots of the S11 data and the Fr data obtained from the third resonance peak for each salt, respectively. The boxplot for MgCl2 has the highest mean and median in the S11 data case, while the mean and median for Na2CO3 are the highest in the Fr data case. When taken together, the mean and median of all salts in the S11 data case were −3.83 dB and −3.59 dB, respectively. When the mean and median of all salts in the Fr data case were calculated, they were found to be 0.7045 GHz and 0.7037 GHz, respectively.
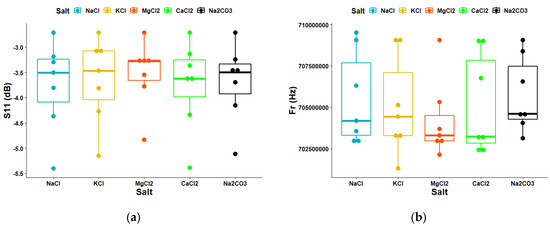
Figure 12.
The distribution characteristics of the raw data were compared in each group obtained from the third resonance peak: (a) boxplot (S11) and (b) boxplot (Fr).
In the boxplots of Figure 10, Figure 11 and Figure 12, where the concentration has been changed, the median and standard deviation of the boxplot can be used to understand how the concentration affects the distribution of the data. If the standard deviation is larger for a higher concentration, this could indicate that the data points are more spread out for that concentration. The correlation results for the first, second, and third resonance peaks of the reflection coefficient spectra at various concentrations for each salt, obtained from measurements, are shown in Figure 13, Figure 14 and Figure 15, respectively, when using the S11 and Fr data. Figure 13 shows the relationship between all of the independent variables from the raw data obtained from the first resonance peak. Figure 13a,c,e analyze the data obtained from S11, while Figure 13b,d,f analyze the data obtained from Fr. When considering the correlation from the S11 data of the first resonance peak, it was found that the correlation between Na2CO3 and MgCl2, as well as Na2CO3 and CaCl2, was low with values of 0.81 and 0.82, respectively. However, the correlation between other salts was greater than 0.92. When considering the correlation from the Fr data, it was found that the correlation between Na2CO3 and CaCl2 was low, with values of 0.79. According to the correlation analysis between each salt at the first resonance peak, it was found that Na2CO3 and CaCl2 had the lowest correlation with each other. As a result, it is possible to use the first resonance peak in the measurement to distinguish the two salts from each other as their concentration changes.
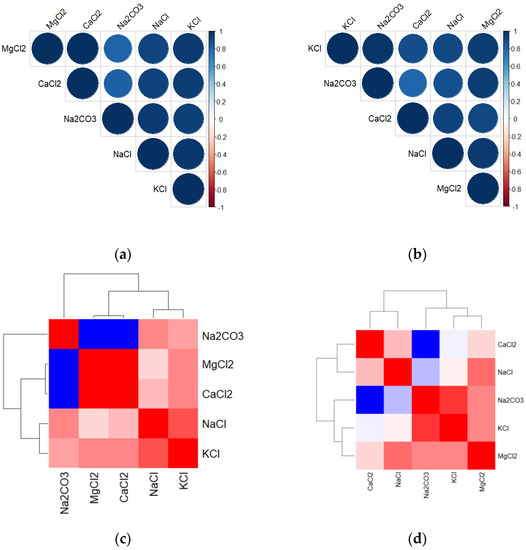
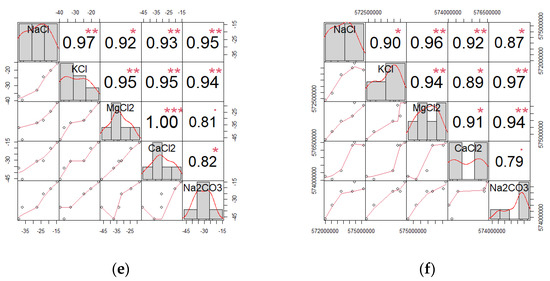
Figure 13.
The correlation between all independent variables from the raw data obtained from the first resonance peak: (a) correlation plot (S11), (b) correlation plot (Fr), (c) heatmap plot (S11) (red color corresponds to the highest values), (d) heatmap plot (Fr) (red color corresponds to the highest values), (e) chart plot (S11), and (f) chart plot (Fr). Each significance level is represented by a unique symbol, with the p-values 0.001 (***), 0.01 (**), and 0.05 (*).
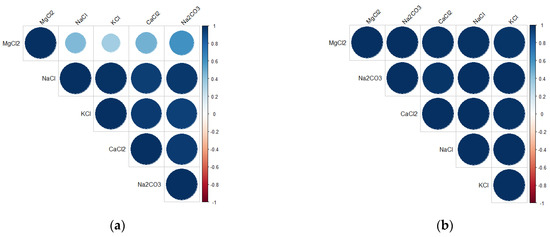
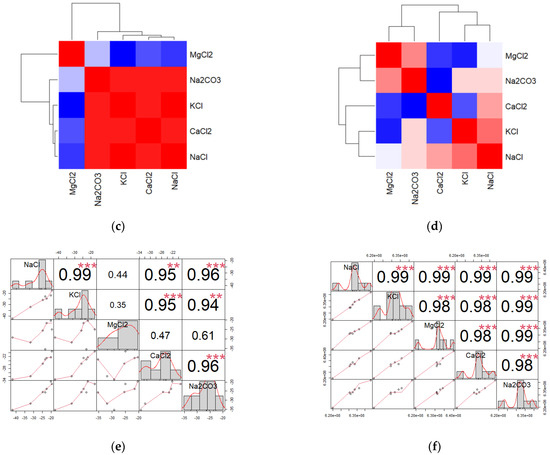
Figure 14.
The correlation between all independent variables from the raw data obtained from the second resonance peak: (a) correlation plot (S11), (b) correlation plot (Fr), (c) heatmap plot (S11) (red color corresponds to the highest values), (d) heatmap plot (Fr) (red color corresponds to the highest values), (e) chart plot (S11), and (f) chart plot (Fr). Each significance level is represented by a unique symbol, with the p-values 0.001 (***), 0.01 (**), and 0.05 (*).
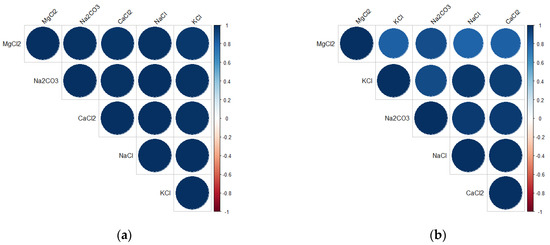
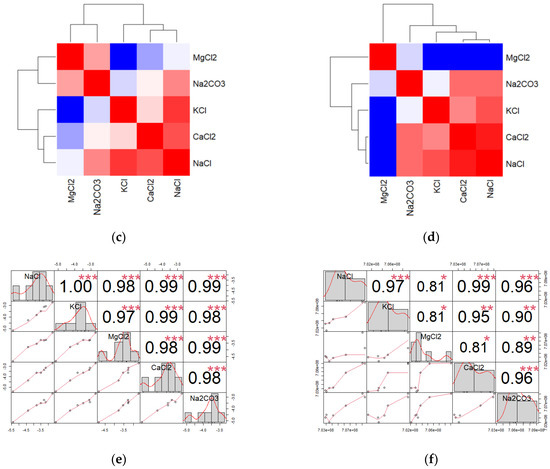
Figure 15.
The correlation between all independent variables from the raw data obtained from the third resonance peak: (a) correlation plot (S11), (b) correlation plot (Fr), (c) heatmap plot (S11) (red color corresponds to the highest values), (d) heatmap plot (Fr) (red color corresponds to the highest values), (e) chart plot (S11), and (f) chart plot (Fr). Each significance level is represented by a unique symbol, with the p-values 0.001 (***), 0.01 (**), and 0.05 (*).
The correlation between all salts based on the raw data of S11 and Fr obtained from the second resonance peak is shown in Figure 14. The results clearly show that MgCl2 has the least affinity with the other salts in the S11 data cases, with the relationship between the other salts and MgCl2 in descending order being Na2CO3, CaCl2, NaCl, and KCl. In the Fr data case, we found that MgCl2 had a low affinity with CaCl2 and KCl salts, and that Na2CO3 also had a low affinity with CaCl2.
Based on the results obtained from the correlation analysis of the S11 and Fr data of the second resonance peak, it was found that MgCl2 had a low correlation with other salts, particularly with KCl and CaCl2. Therefore, it is possible to use the second resonance peak in the measurement to distinguish MgCl2 salts from KCl and CaCl2 as their concentration changes. The relationships between all salts based on the raw data of S11 and Fr obtained from the third resonance peak is shown in Figure 15. The results clearly show that MgCl2 has the lowest affinity with other salts in both the S11 and Fr data cases. In the S11 data case, we found that MgCl2 and KCl had the lowest correlation between them, while in the Fr data case, we found that MgCl2 had a low affinity with NaCl, KCl, and CaCl2.
The statistical data analysis of the three-peak resonance showed that the data obtained from each salt type measurement tended to follow the same trend, with the exception of the data for MgCl2, which had a distinct trend profile compared to the other salts. Therefore, it was possible to measure and distinguish MgCl2 from the other salts when the concentration varied in the range of 0.625–20 mg/mL by using the proposed sensor and system. Table 5 shows a comparison of various microwave sensors for detecting salt concentrations. The sensors mentioned in references [27,46,51,52,53,54,55,56,57] use a contact measurement method to test the salt sample. The implementation of these methods can lead to contamination and invasiveness of both the specimens and the microwave sensors, as the copper material of the sensor comes into direct contact with the salinity concentration in the water. To address the issues associated with the contact method, a non-contact method was proposed and described in our previous work in the references of [54]. However, the sensors described in [29] do not provide complete data and analysis for lower concentrations in the range of 0.625–20 mg/mL. Therefore, in this work, we propose and demonstrate a method for collecting data and studying the relationship between individual salts in this concentration range.

Table 5.
Comparison table for various microwave sensor detection of salt concentrations.
4. Limitations of the Work
Because the presented measurement is non-contact and aims to prevent contamination and structural damage to the test substance, it also helps to extend the lifespan of the sensor by reducing corrosion and deterioration caused by direct exposure. Nevertheless, non-contact measurements often result in lower signal reception by the sensor compared to direct contact measurements. Additionally, the presence of similarly low concentrations of different salts makes it challenging to accurately distinguish between them at these levels. However, the researcher attempted to analyze the data obtained from the measurements through statistical processes to identify differences and relationships between the various concentrations of each salt. From the preliminary statistical analysis, it was observed that the first resonance peak was normally distributed while the second and third resonance peaks were abnormally distributed. Therefore, nonparametric testing will be conducted again to determine whether the two peaks are significantly different. The results showed that the two peaks were not significantly different. However, the statistical analysis results mentioned above were based on a small amount of data, and the concentration separation was a two-fold series dilution with varying distances between each concentration. Therefore, this could be one of the reasons why the estimation of the data is not very accurate and convincing. Future development and studies should aim to design more sensitive sensors that can detect changes at low concentrations. Sample solution preparations should be made in such a way that they cover a wide concentration range and include a large amount of concentration data with consistent spacing between concentrations.
5. Conclusions
The results clearly show that when the salt type and concentration change, the S11 and Fr values change. The S11 and Fr at the third resonance peak and the Fr at the second resonance peak are linearly correlated with each change in salt concentration. In the range of 0.625–20 mg/mL, there was a nonlinear relationship between the change in salt concentration and the values of S11 at the second resonance peak, as well as S11 and Fr at the first resonance peak. The results of the statistical data analysis revealed that the data obtained from each salt type had content measurements that tended to go in the same direction. However, it is worth noting that the MgCl2 data showed a low correlation trend profile with other salt types. From such results, it is possible to identify and distinguish MgCl2 from other salts at this tested concentration range through non-contact measurements using microwave sensors. Dielectric properties, such as permittivity and conductivity, can be used to distinguish between chloride and carbonate salts. Permittivity is a measure of a material’s ability to store electric charge, while conductivity is a measure of a material’s ability to conduct electric current. The dielectric properties of a material are related to its chemical composition and structure, and can be measured using a microstrip patch sensor. To detect and distinguish between chloride and carbonate salts using a microstrip patch sensor, you would need to first prepare a sample solution of the salt in water. The microstrip patch sensor would then be used to measure the dielectric properties of the sample solution at a range of frequencies. The permittivity and conductivity of the sample solution could then be used to distinguish between chloride and carbonate salts. Chloride salts tend to have higher permittivity values and lower conductivity values compared to carbonate salts, due to their chemical structure. By comparing the measured permittivity and conductivity values to the known values of these two types of salts, it is possible to determine which type of salt is present in the sample solution. Using a microstrip patch sensor to measure the dielectric properties of a sample solution is a non-contact method, as the sensor does not need to come into direct contact with the sample in order to measure its properties. This makes it a convenient and safe method for detecting and distinguishing between different types of salts.
Funding
This research project was financially supported by Thailand Science Research and Innovation (TSRI).
Institutional Review Board Statement
Not applicable.
Informed Consent Statement
Not applicable.
Data Availability Statement
Not applicable.
Conflicts of Interest
The author declares no conflict of interest.
References
- Mata-Contreras, J.; Herrojo, C.; Martín, F. Detecting the rotation direction in contactless angular velocity sensors implemented with rotors loaded with multiple chains of resonators. IEEE Sens. J. 2018, 18, 7055–7065. [Google Scholar] [CrossRef]
- Naqui, J.; Martín, F. Angular displacement and velocity sensors based on electric-LC (ELC) loaded microstrip lines. IEEE Sens. J. 2014, 14, 939–940. [Google Scholar] [CrossRef]
- Horestani, A.; Fumeaux, C.; Al-Sarawi, S.; Abbott, D. Displacement sensor based on diamond-shaped tapered split ring resonator. IEEE Sens. J. 2013, 13, 1153–1160. [Google Scholar] [CrossRef]
- Horestani, A.; Fumeaux, C.; Al-Sarawi, S.; Abbott, D. Rotation sensor based on horn-shaped split ring resonator. IEEE Sens. J. 2013, 13, 3014–3015. [Google Scholar] [CrossRef]
- Wang, L.; Chung, K.L.; Zong, W.; Feng, B. A highly sensitive microwave patch sensor for multidirectional strain sensing based on near orthogonal modes. IEEE Access 2021, 9, 24669–24681. [Google Scholar] [CrossRef]
- Daliri, A.; Galehdar, A.; John, S.; Wang, C.H.; Rowe, W.S.T.; Ghorbani, K. Wireless strain measurement using circular microstrip patch antennas. Sens. Actuators A Phys. 2012, 184, 86–92. [Google Scholar] [CrossRef]
- Cho, C.; Yi, X.; Li, D.; Wang, Y.; Tentzeris, M.M. Passive wireless frequency doubling antenna sensor for strain and crack sensing. IEEE Sens. J. 2016, 16, 5725–5733. [Google Scholar] [CrossRef]
- Ibrahim, A.; Cumming, D.R.S. Passive single chip wireless microwave pressure sensor. Sens. Actuators A Phys. 2011, 165, 200–206. [Google Scholar] [CrossRef]
- Zarifi, M.H.; Wiltshire, B.; Mahdi, N.; Kar, P.; Shankar, K.; Daneshmand, M. Ultraviolet sensing using a TiO2 nanotube integrated high resolution planar microwave resonator device. Nanoscale 2018, 10, 4882–4889. [Google Scholar] [CrossRef]
- Kang, T.G.; Park, J.K.; Yun, G.H.; Choi, H.H.; Lee, H.J.; Yook, J.G. A real-time humidity sensor based on a microwave oscillator with conducting polymer PEDOT: PSS film. Sens. Actuators B Chem. 2019, 282, 145–151. [Google Scholar] [CrossRef]
- Mohd Bahar, A.A.; Zakaria, Z.; Isa AA, M.; Dasril, Y.; Alahnomi, R.A. Real time microwave biochemical sensor based on circular SIW approach for aqueous dielectric detection. Sci. Rep. 2019, 9, 5467. [Google Scholar] [CrossRef] [PubMed]
- Wong, D.Y.; Yesiloz, G.; Boybay, M.S.; Ren, C.L. Microwave temperature measurement in microfluidic devices. Lab Chip 2016, 16, 2192–2197. [Google Scholar] [CrossRef]
- Rydosz, A.; Maciak, E.; Wincza, K.; Gruszczynski, S. Microwave-based sensors with phthalocyanine films for acetone, ethanol and methanol detection. Sens. Actuators B Chem. 2016, 237, 876–886. [Google Scholar] [CrossRef]
- Bailly, G.; Harrabi, A.; Rossignol, J.; Stuerga, D.; Pribetich, P. Microwave gas sensing with a microstrip interdigital capacitor: Detection of NH3 with TiO2 nanoparticles. Sens. Actuators B Chem. 2016, 236, 554–564. [Google Scholar] [CrossRef]
- Zarifi, M.H.; Shariaty, P.; Hashisho, Z.; Daneshmand, M. A non-contact microwave sensor for monitoring the interaction of zeolite 13X with CO2 and CH4 in gaseous streams. Sens. Actuators B Chem. 2017, 238, 1240–1247. [Google Scholar] [CrossRef]
- Withayachumnankul, W.; Jaruwongrungsee, K.; Tuantranont, A.; Fumeaux, C.; Abbott, D. Metamaterial-based microfluidic sensor for dielectric characterization. Sens. Actuators A Phys. 2013, 189, 233–237. [Google Scholar] [CrossRef]
- Withayachumnankul, W.; Jaruwongrungsee, K.; Fumeaux, C.; Abbott, D. Metamaterial-inspired multichannel thin-film sensor. IEEE Sens. J. 2012, 12, 1455–1458. [Google Scholar] [CrossRef]
- Melikyan, H.; Danielyan, E.; Kim, S.; Kim, J.; Babajanyan, A.; Lee, J.; Friedman, B.; Lee, K. Non-invasive in vitro sensing of d-glucose in pig blood. Med. Eng. Phys. 2012, 34, 299–304. [Google Scholar] [CrossRef]
- Ebrahimi, A.; Withayachumnankul, W.; Al-Sarawi, S.; Abbott, D. High-sensitivity metamaterial-inspired sensor for microfluidic dielectric characterization. IEEE Sens. J. 2014, 14, 1345–1351. [Google Scholar] [CrossRef]
- Kim, N.Y.; Dhakal, R.; Adhikari, K.K.; Kim, E.S.; Wang, C. A reusable robust radio frequency biosensor using microwave resonator by integrated passive device technology for quantitative detection of glucose level. Biosens. Bioelectron. 2015, 67, 687–693. [Google Scholar] [CrossRef]
- Zarifi, M.H.; Farsinezhad, S.; Shankar, K.; Daneshmand, M. Liquid sensing using active feedback assisted planar microwave resonator. IEEE Microw. Wirel. Compon. Lett. 2015, 25, 621–623. [Google Scholar] [CrossRef]
- Zarifi, M.H.; Sadabadi, H.; Hejazi, S.H.; Daneshmand, M.; Sanati-Nezhad, M. Noncontact and nonintrusive microwave-microfuidic flow sensor for energy and biomedical engineering. Sci. Rep. 2018, 8, 139. [Google Scholar] [CrossRef]
- Zarifi, M.H.; Rahimi, M.; Daneshmand, M.; Thundat, T. Microwave ring resonator-based non-contact interface sensor for oil sands applications. Sens. Actuators B Chem. 2016, 224, 632–639. [Google Scholar] [CrossRef]
- Zarifi, M.H.; Daneshmand, M. Liquid sensing in aquatic environment using high quality planar microwave resonator. Sens. Actuators B Chem. 2016, 225, 517–521. [Google Scholar] [CrossRef]
- Harnsoongnoen, S.; Wanthong, A. Coplanar waveguides loaded with a split ring resonator-based microwave sensor for aqueous sucrose solutions. Meas. Sci. Technol. 2016, 27, 015103. [Google Scholar] [CrossRef]
- Harnsoongnoen, S.; Wanthong, A. Real-time monitoring of sucrose, sorbitol, D-glucose and D-fructose concentration by electromagnetic sensing. Food Chem. 2017, 232, 566–570. [Google Scholar] [CrossRef]
- Harnsoongnoen, S.; Wanthong, A.; Charoen-In, U.; Siritaratiwat, A. Planar microwave sensor for detection and discrimination of aqueous organic and inorganic solutions. Sens. Actuators B Chem. 2018, 271, 300–305. [Google Scholar] [CrossRef]
- Harnsoongnoen, S.; Wanthong, A.; Charoen-In, U.; Siritaratiwat, A. Microwave sensor for nitrate and phosphate concentration sensing. IEEE Sens. J. 2019, 19, 2950–2955. [Google Scholar] [CrossRef]
- Harnsoongnoen, S.; Wanthong, A. A non-contact planar microwave sensor for detection of high-salinity water containing NaCl, KCl, CaCl2, MgCl2 and Na2CO3. Sens. Actuators B Chem. 2021, 331, 129355. [Google Scholar] [CrossRef]
- Srisai, S.; Harnsoongnoen, S. Noncontact planar microwave sensor for liquid interface detection by a pixelated CSRR-loaded microstrip line. J. RF Microw. Comput.-Aided Eng. 2021, 31, e22557. [Google Scholar] [CrossRef]
- Harnsoongnoen, S. Metamaterial-inspired microwave sensor for detecting the concentration of mixed phosphate and nitrate in water. IEEE Trans. Instrum. Meas. 2021, 70, 9509906. [Google Scholar] [CrossRef]
- Harnsoongnoen, S. Microwave Sensors Based on Coplanar Waveguide Loaded with Split Ring Resonators: A Review. Appl. Sci. Eng. Prog. 2019, 12, 224–234. [Google Scholar] [CrossRef]
- Vélez, P.; Muñoz-Enano, J.; Grenier, K.; Mata-Contreras, J.; Dubuc, D.; Martín, F. Split ring resonator-based microwave fluidic sensors for electrolyte concentration measurements. IEEE Sens. J. 2019, 19, 2562–2569. [Google Scholar] [CrossRef]
- Vélez, P.; Grenier, K.; Mata-contreras, J.; Dubuc, D.; Martin, F. Highly-sensitive microwave sensors based on open complementary split ring resonators (OCSRRs) for dielectriccharacterization and solute concentration measurement in liquids. IEEE Access 2018, 6, 48324–48338. [Google Scholar] [CrossRef]
- Vélez, P.; Su, L.; Grenier, K.; Mata-Contreras, J.; Dubuc, D.; Martín, F. Microwave microfluidic sensor based on a microstrip splitter/combiner configuration and split ring resonators (SRRs) for dielectric characterization of liquids. IEEE Sens. J. 2017, 17, 6589–6598. [Google Scholar] [CrossRef]
- Zarifi, M.H.; Shariaty, P.; Abdolrazzaghi, M.; Hashisho, Z.; Daneshmand, M. Particle size characterization using a high resolution planar resonator sensor in a lossy medium. Sens. Actuators B Chem. 2016, 234, 332–337. [Google Scholar] [CrossRef]
- Zarifi, M.H.; Thundat, T.; Daneshmand, M. High resolution microwave microstrip resonator for sensing applications. Sens. Actuators A Phys. 2015, 233, 224–230. [Google Scholar] [CrossRef]
- Trabelsi, S.; Nelson, S.O. Microwave sensing of quality attributes of agricultural and food products. IEEE Instrum. Meas. Mag. 2016, 19, 36–41. [Google Scholar] [CrossRef]
- Li, F.; Zheng, Y.; Hua, C.; Jian, J. Gas sensing by microwave transduction: Review of progress and challenges. Front. Mater. 2019, 6, 101. [Google Scholar] [CrossRef]
- Martín, F.; Vélez, P.; Gil, M. Microwave sensors based on resonant elements. Sensors 2020, 20, 3375. [Google Scholar] [CrossRef] [PubMed]
- Haq, T.; Ruan, C.; Zhang, X.; Ullah, S.; Fahad, A.K.; He, W. Extremely sensitive microwave sensor for evaluation of dielectric characteristics of low-permittivity materials. Sensors 2020, 20, 1916. [Google Scholar] [CrossRef]
- Fayaz, M.; Zarifi, M.H.; Abdolrazzaghi, M.; Shariaty, P.; Hashisho, Z.; Daneshmand, M. A novel technique for determining the adsorption capacity and breakthrough time of adsorbents using a noncontact high-resolution microwave resonator sensor. Environ. Sci. Technol. 2017, 51, 427–435. [Google Scholar] [CrossRef]
- Kozak, R.; Wiltshire, B.D.; Khandoker, M.A.R.; Golovin, K.; Zarifi, M.H. Modified microwave sensor with a patterned ground heater for detection and prevention of ice accumulation. ACS Appl. Mater. Interfaces 2020, 12, 55483–55492. [Google Scholar] [CrossRef] [PubMed]
- Elias, M.; Laranjo, M.; Agulheiro-Santos, A.C.; Potes, M.E. The role of salt on food and human health. In Salt in the Earth; Cinku, M., Karabulut, S., Eds.; IntechOpen: London, UK. [CrossRef]
- Durack, E.; Alonso-Gomez, M.; Wilkinson, M.G. Salt: A review of its role in food science and public health. Curr. Nutr. Food Sci. 2008, 4, 290–297. [Google Scholar] [CrossRef]
- Islam, M.T.; Rahaman, M.N.; Singh, M.S.J.; Samsuzzaman, M. Detection of salt and sugar contents in water on the basis of dielectric properties. IEEE Access. 2018, 6, 4118–4126. [Google Scholar] [CrossRef]
- Naqui, J.; Martín, F. Transmission lines loaded with bisymmetric resonators and their application to angular displacement and velocity sensors. IEEE Trans. Microw. Theory Tech. 2013, 61, 4700–4712. [Google Scholar] [CrossRef]
- Lugli, S.M.; Lutz, W.K. Stimulation of cell division in the rat by NaCl, KCl, MgCl2, and CaCl2, and inhibition of the sodium chloride effect on the glandular stomach by ascorbic acid and beta-carotene. J. Cancer Res. Clin. Oncol. 1999, 125, 209–213. [Google Scholar] [CrossRef]
- Zhao, Y.; Liao, Y.; Zhang, B.; Lai, S. Monitoring technology of salinity in water with optical fiber sensor. J. Light. Technol. 2003, 21, 1334–1338. [Google Scholar] [CrossRef]
- Li, Y.; Xu, X.; Wang, X.; Li, P.; Hao, Q.; Xiao, B. Survey and evaluation of equations for thermophysical properties of binary/ternary eutectic salts from NaCl, KCl, MgCl2, CaCl2, ZnCl2 for heat transfer and thermal storage fluids in CSP. Sol. Energy 2017, 152, 57–79. [Google Scholar] [CrossRef]
- Kilpijärvi, J.; Halonen, N.; Juuti, J.; Hannu, J. Microfluidic microwave sensor for detecting saline in biological range. Sensors 2019, 19, 819. [Google Scholar] [CrossRef] [PubMed]
- Lee, K.; Hassan, A.; Lee, C.H.; Bae, J. Microstrip patch sensor for salinity determination. Sensors 2017, 17, 2941. [Google Scholar] [CrossRef] [PubMed]
- Rahman, M.N.; Islam, M.T.; Samsuzzaman, M. Detection of different concentrated salt and sugar solution based on dielectric properties using microstrip technology. Microw. Opt. Technol. Lett. 2018, 60, 1573–1577. [Google Scholar] [CrossRef]
- Rahman, M.N.; Hassan, S.A.; Samsuzzaman, M.; Singh, M.S.J.; Islam, M.T. Determination of salinity and sugar concentration using microwave sensor. Microw. Opt. Technol. Lett. 2018, 61, 361–364. [Google Scholar] [CrossRef]
- Rahman, M.N.; Islam, M.T.; Samsuzzaman, M. Development of a microstrip based sensor aimed at salinity and sugar detection in water considering dielectric properties. Microw. Opt. Technol. Lett. 2018, 60, 667–672. [Google Scholar] [CrossRef]
- Rahman, M.N.; Islam, M.T.; Sobuz, M.S. Microwave measurement system to detect salt and sugar concentration. Microw. Opt. Technol. Lett. 2018, 60, 1772–1774. [Google Scholar] [CrossRef]
- Rahman, M.N.; Islam, M.T.; Samsuzzaman, M. Salinity and sugar detection system using microstrip patch antenna. Microw. Opt. Technol. Lett. 2018, 60, 1092–1096. [Google Scholar] [CrossRef]
- Buchner, R. Dielectric Spectroscopy of Solutions, In Novel Approaches to the Structure and Dynamics of Liquids: Experimets, Theories and Simulations; NATO Science Series (Series II: Mathematics, Physics and Chemistiry); Samios, J., Durov, V., Eds.; Springer: Dordrecht, The Netherlands, 2004; Volume 133, pp. 265–288. [Google Scholar]
- Capewell, S.G.; Buchner, R.; Hefter, G.; May, P.M. Dielectric relaxation of aqueous Na2CO3 solutions. Phys. Chem. Chem. Phys. 1999, 1, 1933–1937. [Google Scholar] [CrossRef]
- Buchner, R.; Hefter, G.T.; May, P.M. Dielectric relaxation of aqueous NaCl solutions. J. Phys. Chem. A. 1999, 103, 1–9. [Google Scholar] [CrossRef]
- Chen, T.; Hefter, G.; Buchner, R. Dielectric spectroscopy of aqueous solutions of KCl and CsCl. J. Phys. Chem. A 2003, 107, 4025–4031. [Google Scholar] [CrossRef]
- Friesen, S.; Hefter, G.; Buchner, R. Cation hydration and ion pairing in aqueous solutions of MgCl2 and CaCl2. J. Phys. Chem. A 2019, 123, 891–900. [Google Scholar] [CrossRef] [PubMed]
- Sihvola, A. Mixing rules with complex dielectric coefficients. Subsurf. Sens. Technol. Appl. 2000, 1, 393–415. [Google Scholar] [CrossRef]
- Nortemann, K.; Hilland, J.; Kaatze, U. Dielectric properties of aqueous NaCl solutions at microwave frequencies. J. Phys. Chem. A 1997, 101, 6864–6869. [Google Scholar] [CrossRef]
- Gavish, N.; Promislow, K. Dependence of the dielectric constant of electrolyte solutions on ionic concentration: A microfield approach. Phys. Rev. E 2016, 94, 012611. [Google Scholar] [CrossRef] [PubMed]
Disclaimer/Publisher’s Note: The statements, opinions and data contained in all publications are solely those of the individual author(s) and contributor(s) and not of MDPI and/or the editor(s). MDPI and/or the editor(s) disclaim responsibility for any injury to people or property resulting from any ideas, methods, instructions or products referred to in the content. |
© 2023 by the author. Licensee MDPI, Basel, Switzerland. This article is an open access article distributed under the terms and conditions of the Creative Commons Attribution (CC BY) license (https://creativecommons.org/licenses/by/4.0/).