Review

Detection of Kidney Complications Relevant Concentrations of Ammonia Gas Using Plasmonic Biosensors: A Review

1
Centre for Advanced Industrial Technology, Pekan Campus, University of Malaysia Pahang, Pekan 26600, Pahang, Malaysia
2
Department of Physics, Al-Qalam University Katsina, PMB 2137, Katsina 820102, Nigeria
3
Faculty of Electrical and Electronic Engineering, Pekan Campus, Universiti Malaysia Pahang, Pekan 26600, Pahang, Malaysia
4
Department of Fundamental and Applied Sciences, Universiti Teknologi PETRONAS, Seri Iskandar 32610, Perak, Malaysia
5
Physics Department, College of Science, Imam Mohammad Ibn Saud Islamic University (IMSIU), Riyadh 13318, Saudi Arabia
6
CNR Nanotec, University Campus Ecotekne, 73100 Lecce, Italy
7
Faculty of Mechanical & Automotive Engineering Technology, Pekan Campus, Universiti Malaysia Pahang, Pekan 26600, Pahang, Malaysia
8
Center for Advanced Intelligent Materials, Universiti Malaysia Pahang, Kuantan 26300, Pahang, Malaysia
9
Faculty of Industrial Sciences and Technology, Universiti Malaysia Pahang, Kuantan 26300, Pahang, Malaysia
*
Authors to whom correspondence should be addressed.
Chemosensors 2023, 11(2), 119; https://doi.org/10.3390/chemosensors11020119
Submission received: 5 December 2022 / Revised: 17 January 2023 / Accepted: 31 January 2023 / Published: 6 February 2023
(This article belongs to the Special Issue Advanced Surface Plasmon Resonance Sensors)

Abstract

:
Kidney-related health problems cause millions of deaths around the world annually. Fortunately, most kidney problems are curable if detected at the earliest stage. Continuous monitoring of ammonia from exhaled breath is considered as a replacement for the conventional blood-based monitoring of chronic kidney disease (CKD) and kidney failure owing to its cost effectiveness, non-invasiveness, excellent sensitivity, and capabilities for real-time measurement. The detection of ammonia for renal failure requires a biosensor with a detection limit of 1000 ppb (1 ppm). Among biosensors, plasmonic biosensors have attracted considerable research interest due to their potential for ultra-sensitivity, single particle/molecular level detection capability, multiplexing capability, photostability, real-time measurement, label-free measurement, room temperature operation, naked-eye readability, ease of miniaturization via simple sensor chip fabrication, and instrumentation, among other features. In this review, plasmonic sensors for the detection of ammonia gas relevant to kidney problems (LOD ≤ 1 ppm) are reviewed. In addition, the utilized strategies and surface functionalization for the plasmonic sensor are highlighted. Moreover, the main limitations of the reported sensors are stated for the benefit of future researchers. Finally, the challenges and prospects of plasmonic-based ammonia gas biosensors for potential application in the monitoring and screening of renal (kidney) failure, as well as the endpoint of the dialysis session, are stated.

1. Introduction

Kidney diseases are a rising global health problem [1]. Globally, 10% of the population is reported to be affected by chronic kidney disease (CKD), which leads to millions of deaths annually due to lack of affordable treatments [2,3,4]. According to a recent global burden of disease (GBD) study, 1.2 million people died from kidney failure in 2015, an increase of 32% since 2005 [1,5]. Moreover, the prevalence rising to 5–10 million annual deaths of other kidney diseases are considered in [1]. Coupled with the global economic burden of kidney disease, the number of people undergoing dialysis globally is projected to rise from 2.62 million in 2010 to 5.24 million by 2030 [5]. Fortunately, kidney complications are controllable if detected at their early stages [1].
Thus, the quest for a reliable procedure is necessary. Regular and continuous monitoring of blood, imaging, and urine are currently considered as the only way to avoid renal failure [6,7,8,9]. However, these procedures are invasive, annoying to the patients, time-consuming, expensive, operator-dependent, require special skills, and are therefore not suitable for point-of-care testing and real-time monitoring.
Continuous monitoring of ammonia from exhaled breath offers a non-invasive way to monitor kidney health status [10,11,12,13,14,15,16]. Ammonia is a nitrogen waste product naturally produced in the body and excreted in the urine. Ammonia concentrations increase in the body when the kidneys or liver are not working properly, allowing water products to remain in the bloodstream [17]. When a patient has kidney failure, solute that is normally filtered out of the body begins to build up in the blood. Urea reaches a toxic level and hydrogen compounds make the blood more acidic.
The effective monitoring and screening of CKD, renal (kidney) failure, and the endpoint of the dialysis session can be achieved through breath ammonia analysis due to 0.95 and 0.83 correlation factors found between the breath ammonia and blood urine nitrogen (BUN), and between the breath ammonia and creatinine, respectively [18]. The mean ammonia concentration for patients with end-stage renal failure was found to be 4880 ppb, ranging from 820 to 14,700 ppb [19]. In another study, patients with renal failure had an amount of ammonia in their breath ranging from 1500 ppb to 2000 ppb [18]. Analytical techniques are required to be able to quantify breath ammonia down to a limit of detection of 29 ppb before they can be considered efficient. However, to detect ammonia for renal failure screening, the detection limit will be 1000 ppb (1 ppm) [20].
The non-invasive exhaled breath ammonia-based monitoring and screening for renal failure is ultra-sensitively achieved using conventional equipment such as GC, laser-induced fluorescence (LIF), tunable diode laser absorption spectroscopy (TDLAS), and SIFT-MS. Unfortunately, these methods are costly and bulky, and require trained and qualified personnel, and they are tabletop equipment [21,22,23,24].
A sensor-based approach is currently considered among the easiest ways of detecting ammonia vapours. Unfortunately, the development of most of the available ammonia sensors based on quartz crystal microbalance (QCM), CMOS fabrication process, chemiresistive techniques, and MEMS is hindered due to one or more issues such as poor accuracy, low sensitivity, and short detection range [21,25,26]. Sensors based on nanostructured inorganic structures such as SnO2, WO3, and TiO2 have large sensitivity and response time, but the technology for producing both the materials and devices for gas sensors usually requires a vacuum and high temperature that results in considerably large expenses [27,28]. With the aim to reduce these costs, many research groups were able to develop gas sensors based on conducting polymers that feature a simple fabrication process, low power consumption, and room-temperature operation [28,29,30,31].
Recently, increased research interest was recorded in plasmonic sensors including surface plasmon resonance (SPR), localized surface plasmon resonance (LSPR), and surface-enhanced Raman scattering (SERS), owing to their superior features such as ultra-sensitivity, single particle/molecular level detection capability, multiplexing capability, photostability, naked-eye readability, and the ease of miniaturization without sophisticated sensor chip fabrication and instrumentation [32,33]. SPR technique is based on the interaction of electromagnetic waves with planar metallic substrate, while LSPR arises due to the interaction of electromagnetic waves with discrete metallic nanoparticles with dimensions smaller than the incident wavelength [34,35]. Another nanoparticle-based technique, surface enhanced Raman scattering (SERS) employed the huge production of electric field at the resonance condition for its sensing application [36]. Unfortunately, investigations on the application of plasmonic sensors for the management of renal complications based on the detection of NH3 gas are lacking despite the promising advantages of the sensing technique. As such, the current review is aimed at revealing the potential of plasmonic sensors in this regard by reporting contributions related to the plasmonic sensing of low concentration NH3 gas of CKD or renal failure interest (≤1 ppm) in a broad manner. As part of this effort, the principle of the plasmonic sensors, including SPR, LSPR, and SERS, is described. In addition, the performance parameters required to be optimized before the successful deployment of plasmonic sensors in the detection of low concentrations of the NH3 gas for the management of CKD and kidney failure are reported. Thereafter, the advances in the detection of the low concentrations NH3 gas (≤1 ppm) using plasmonic biosensors are presented. Finally, the conclusion and outlook for the detection of low concentrations NH3 gas using plasmonic biosensors are stated.

2. Principles of Plasmonic Biosensors

Plasmonic biosensors are broadly categorized into two classes, surface plasmon resonance (SPR) biosensors, which use a thin film of plasmonic materials, and localized surface plasmon resonance (LSPR) biosensors, which are based on plasmonic nanoparticles. Prominently, the plasmonic materials based on noble metals such as gold and silver are more attractive owing to their superior plasmonic properties at visible range. Apart from these, other optical sensors such as surface-enhanced Raman scattering (SERS), surface-enhanced fluorescence (SEF), and surface-enhanced infrared absorption spectroscopy (SEIRA) can be classified as plasmonic sensors owing to the strong dependence of their enhanced optical properties with incorporation of plasmonic materials [37]. The principles of plasmonics biosensors relevant to this review including SPR, LSPR, and SERS have been extensively explained elsewhere [37,38] and in our previous review [39]. A comprehensive summary of these principles is given below.

2.1. SPR Biosensors

Surface plasmon resonance (SPR) biosensors exploit the alteration of refractive index (RI), an optical parameter to monitor the concentration or quantity of a particular analyte. A surface plasmon wave is generated following the interaction of a plane polarized light wave with planar thin film of a metallic/plasmonic material (mostly gold or silver) surrounded by a dielectric medium. As shown in Figure 1a, the surface plasmons have the features of both an electromagnetic wave and surface charge. The wave propagates along the metal–dielectric interface with its electric field perpendicular to the interface and decays exponentially into the metal and dielectric medium [40,41]. The electric field of the surface plasmon is perpendicular to the interface and decays exponentially into the metal and dielectric medium. The penetration depth of the electric field in metal is much smaller than that in the dielectric medium [41].
The surface plasmon can be excited by an incident light propagating along the interface. However, as shown in Figure 1b, the surface plasmons cannot be excited by a direct light and require the wave vector of excitation light along the metal–dielectric interface to be equal to the wave vector of the surface plasmon wave, a condition called the resonance condition.
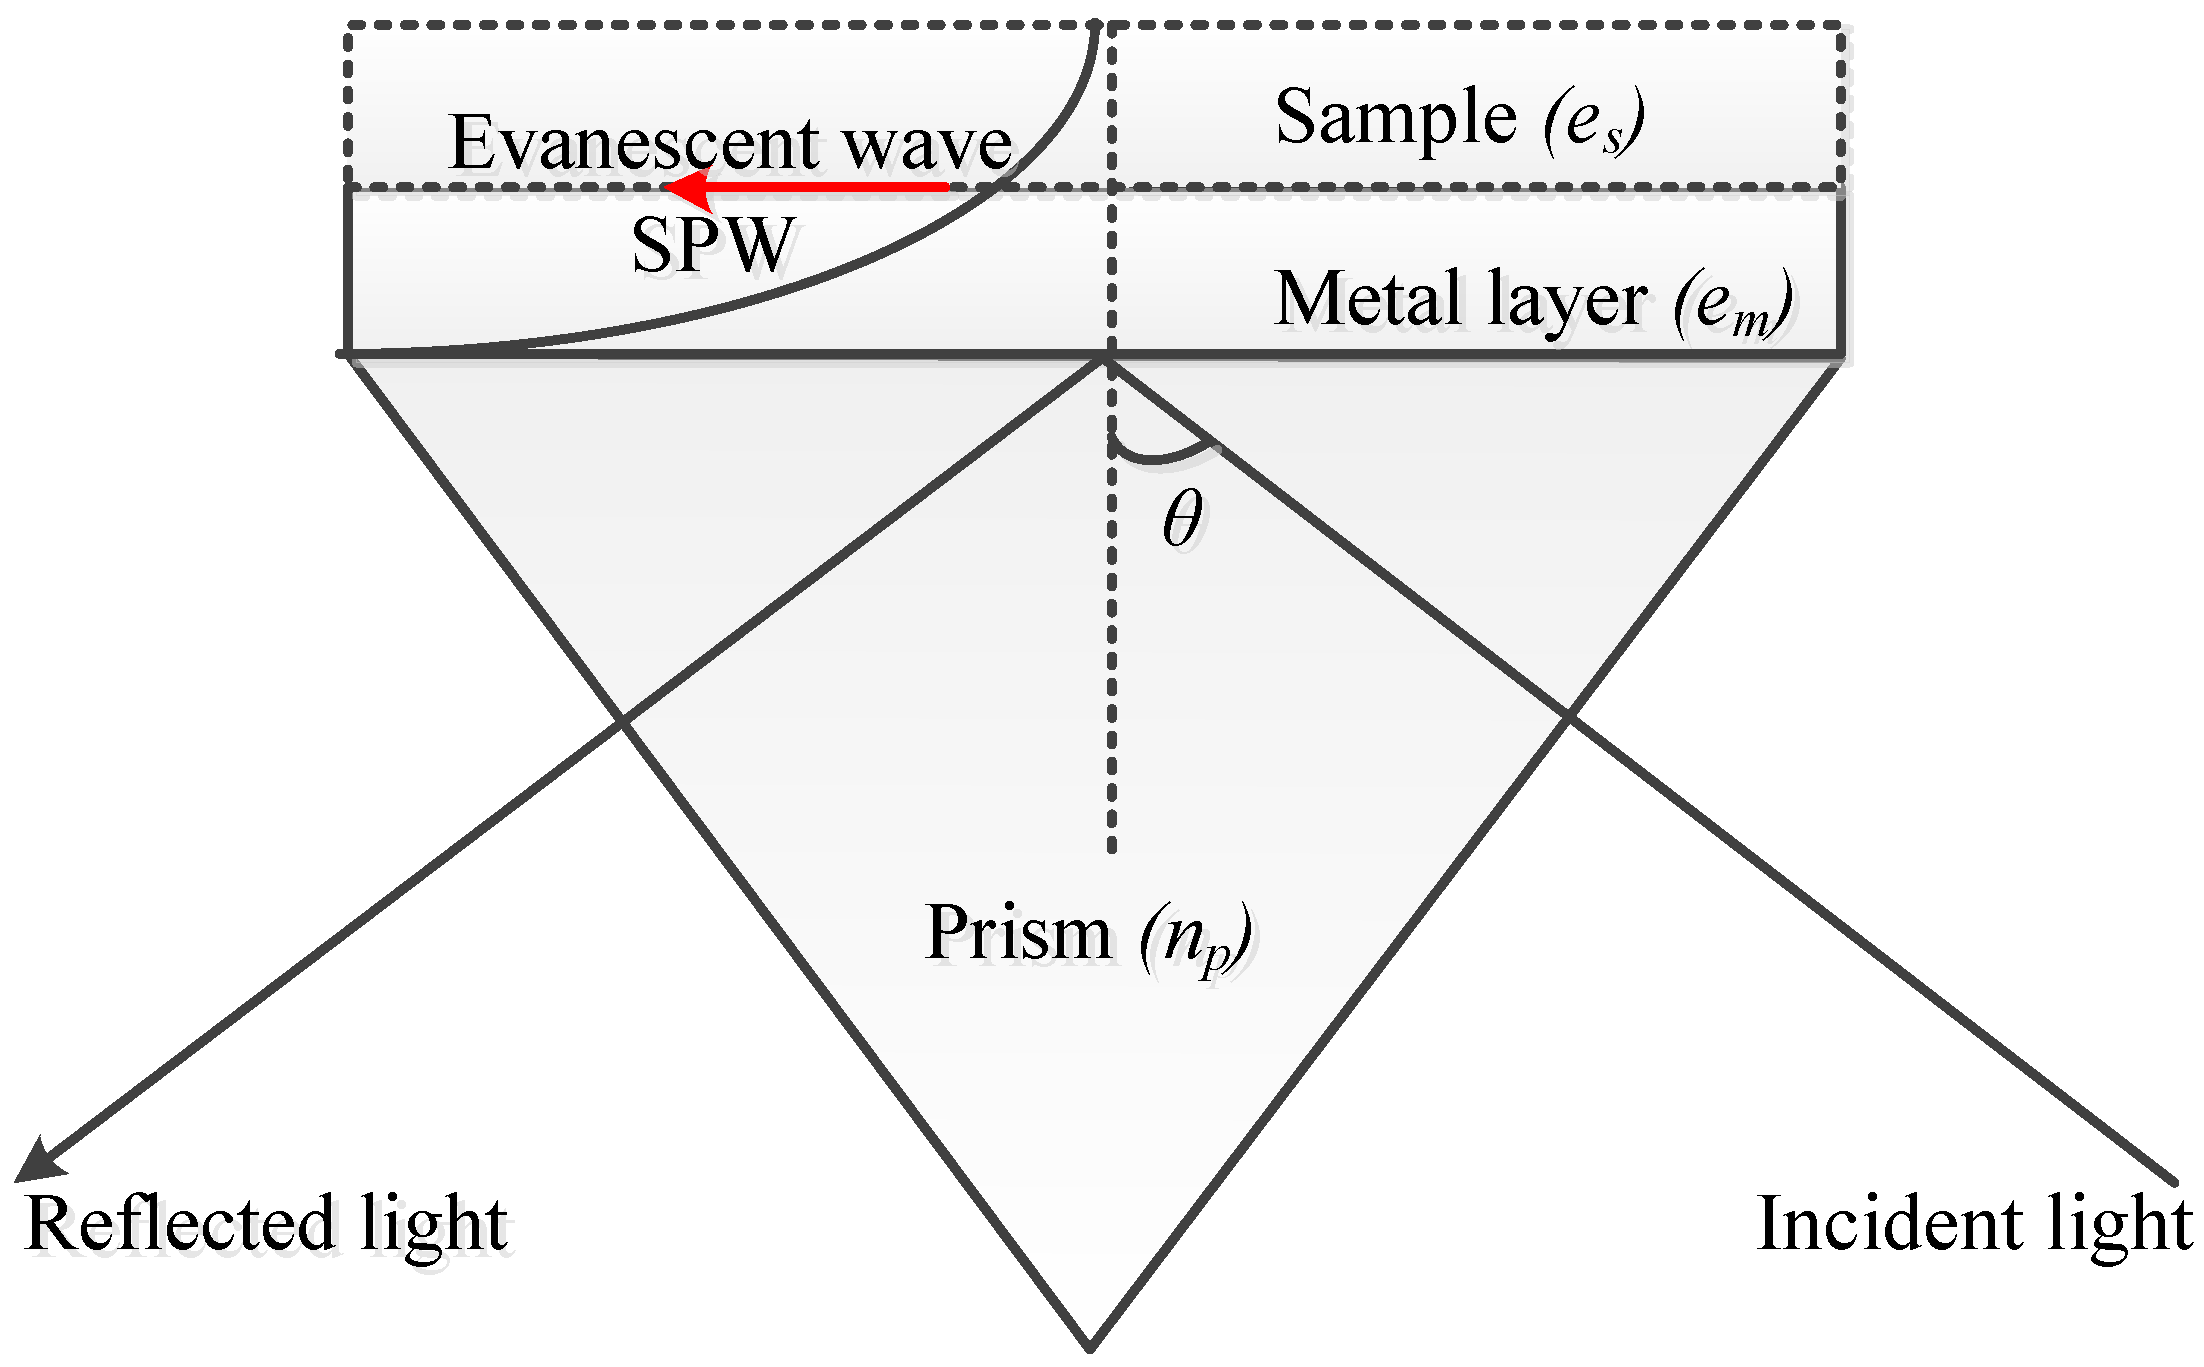
Prism coupling technique is prominently employed to increase the wave vector of the excitation light due to its simplicity (Figure 2). Typically, the base of a prism is coated with a plasmonic material through the deployment of a well-known Kretchmann configuration and is followed by striking one face of the prism with a light source. At a certain angle of incident beyond critical angle, total internal reflection (TIR) occurs which leads to the generation of an evanescent wave (excitation light) that propagates along the prism–metal layer interface (Figure 2) [41,44]. Based on this, the propagation constant of the evanescent wave (Kev) can be calculated using Equation (1), implying the dependency of the Kev with the increment of dielectric constant of the prism (εp).
K e v = ω c ε p sin θ
where es, em and np represent the dielectric constant of sample or dielectric medium, dielectric constant of the plasmonic material (metal), and the refractive index of the material of the prism, respectively. In addition, ω is the angular frequency, c is the speed of light in a vacuum, and θ is the angle of incidence of light.
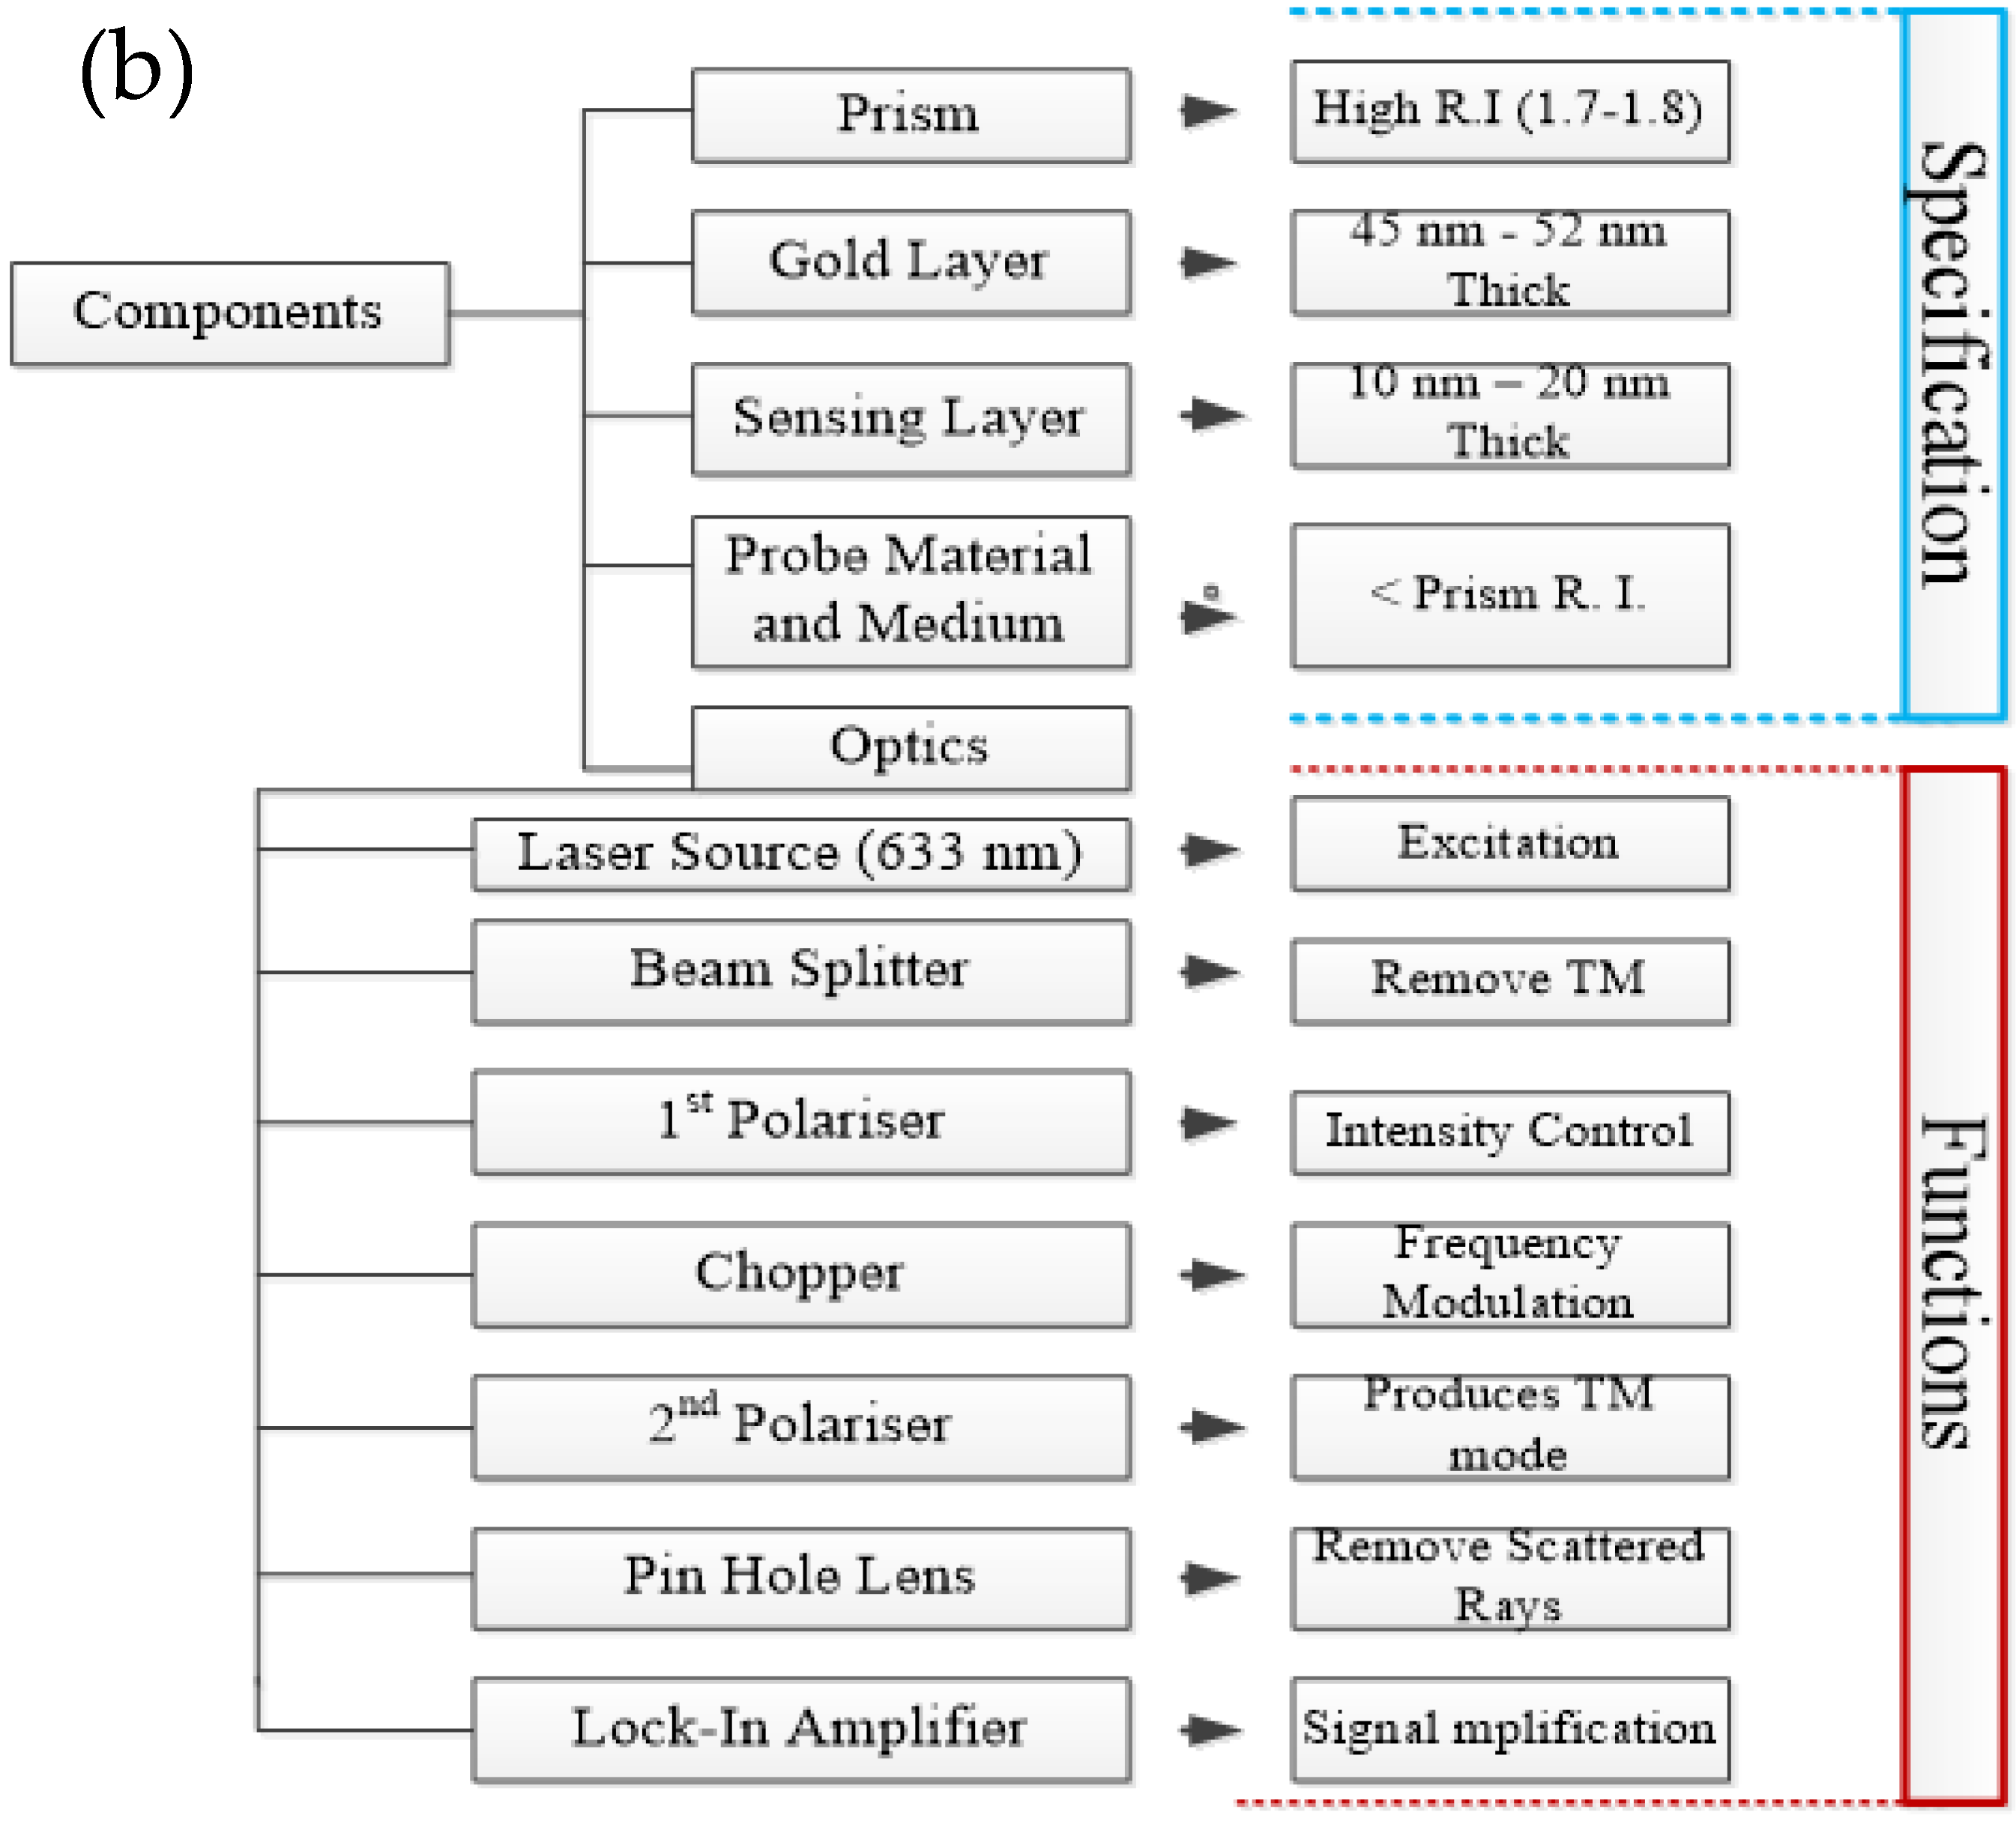
Upon satisfaction of the resonance condition, an intense reduction in the intensity of the reflected light is observed at a certain angle of incidence, resonance angle (θres). As shown in Figure 3a, any adsorption or introduction of a particular analyte toward the surface of the metal coated layer of the SPR biosensor will result in displacement of the SPR angle (SPR shift). This is exploited for SPR sensing. Despite the simplicity of the prism-based SPR biosensors, their development is hindered due to their bulkiness and involvement of various components and moving parts (Figure 3a,b). Apart from the prism coupling techniques, other SPR biosensors based on waveguide, optical fibers, and grating coupling techniques are also available [39]. Among these, fiber-optic SPR biosensors seem to be more promising, enabling ultrasensitive detection, point of care testing (POCT), and attainment of portable biosensing devices, among other advantages [41,45].
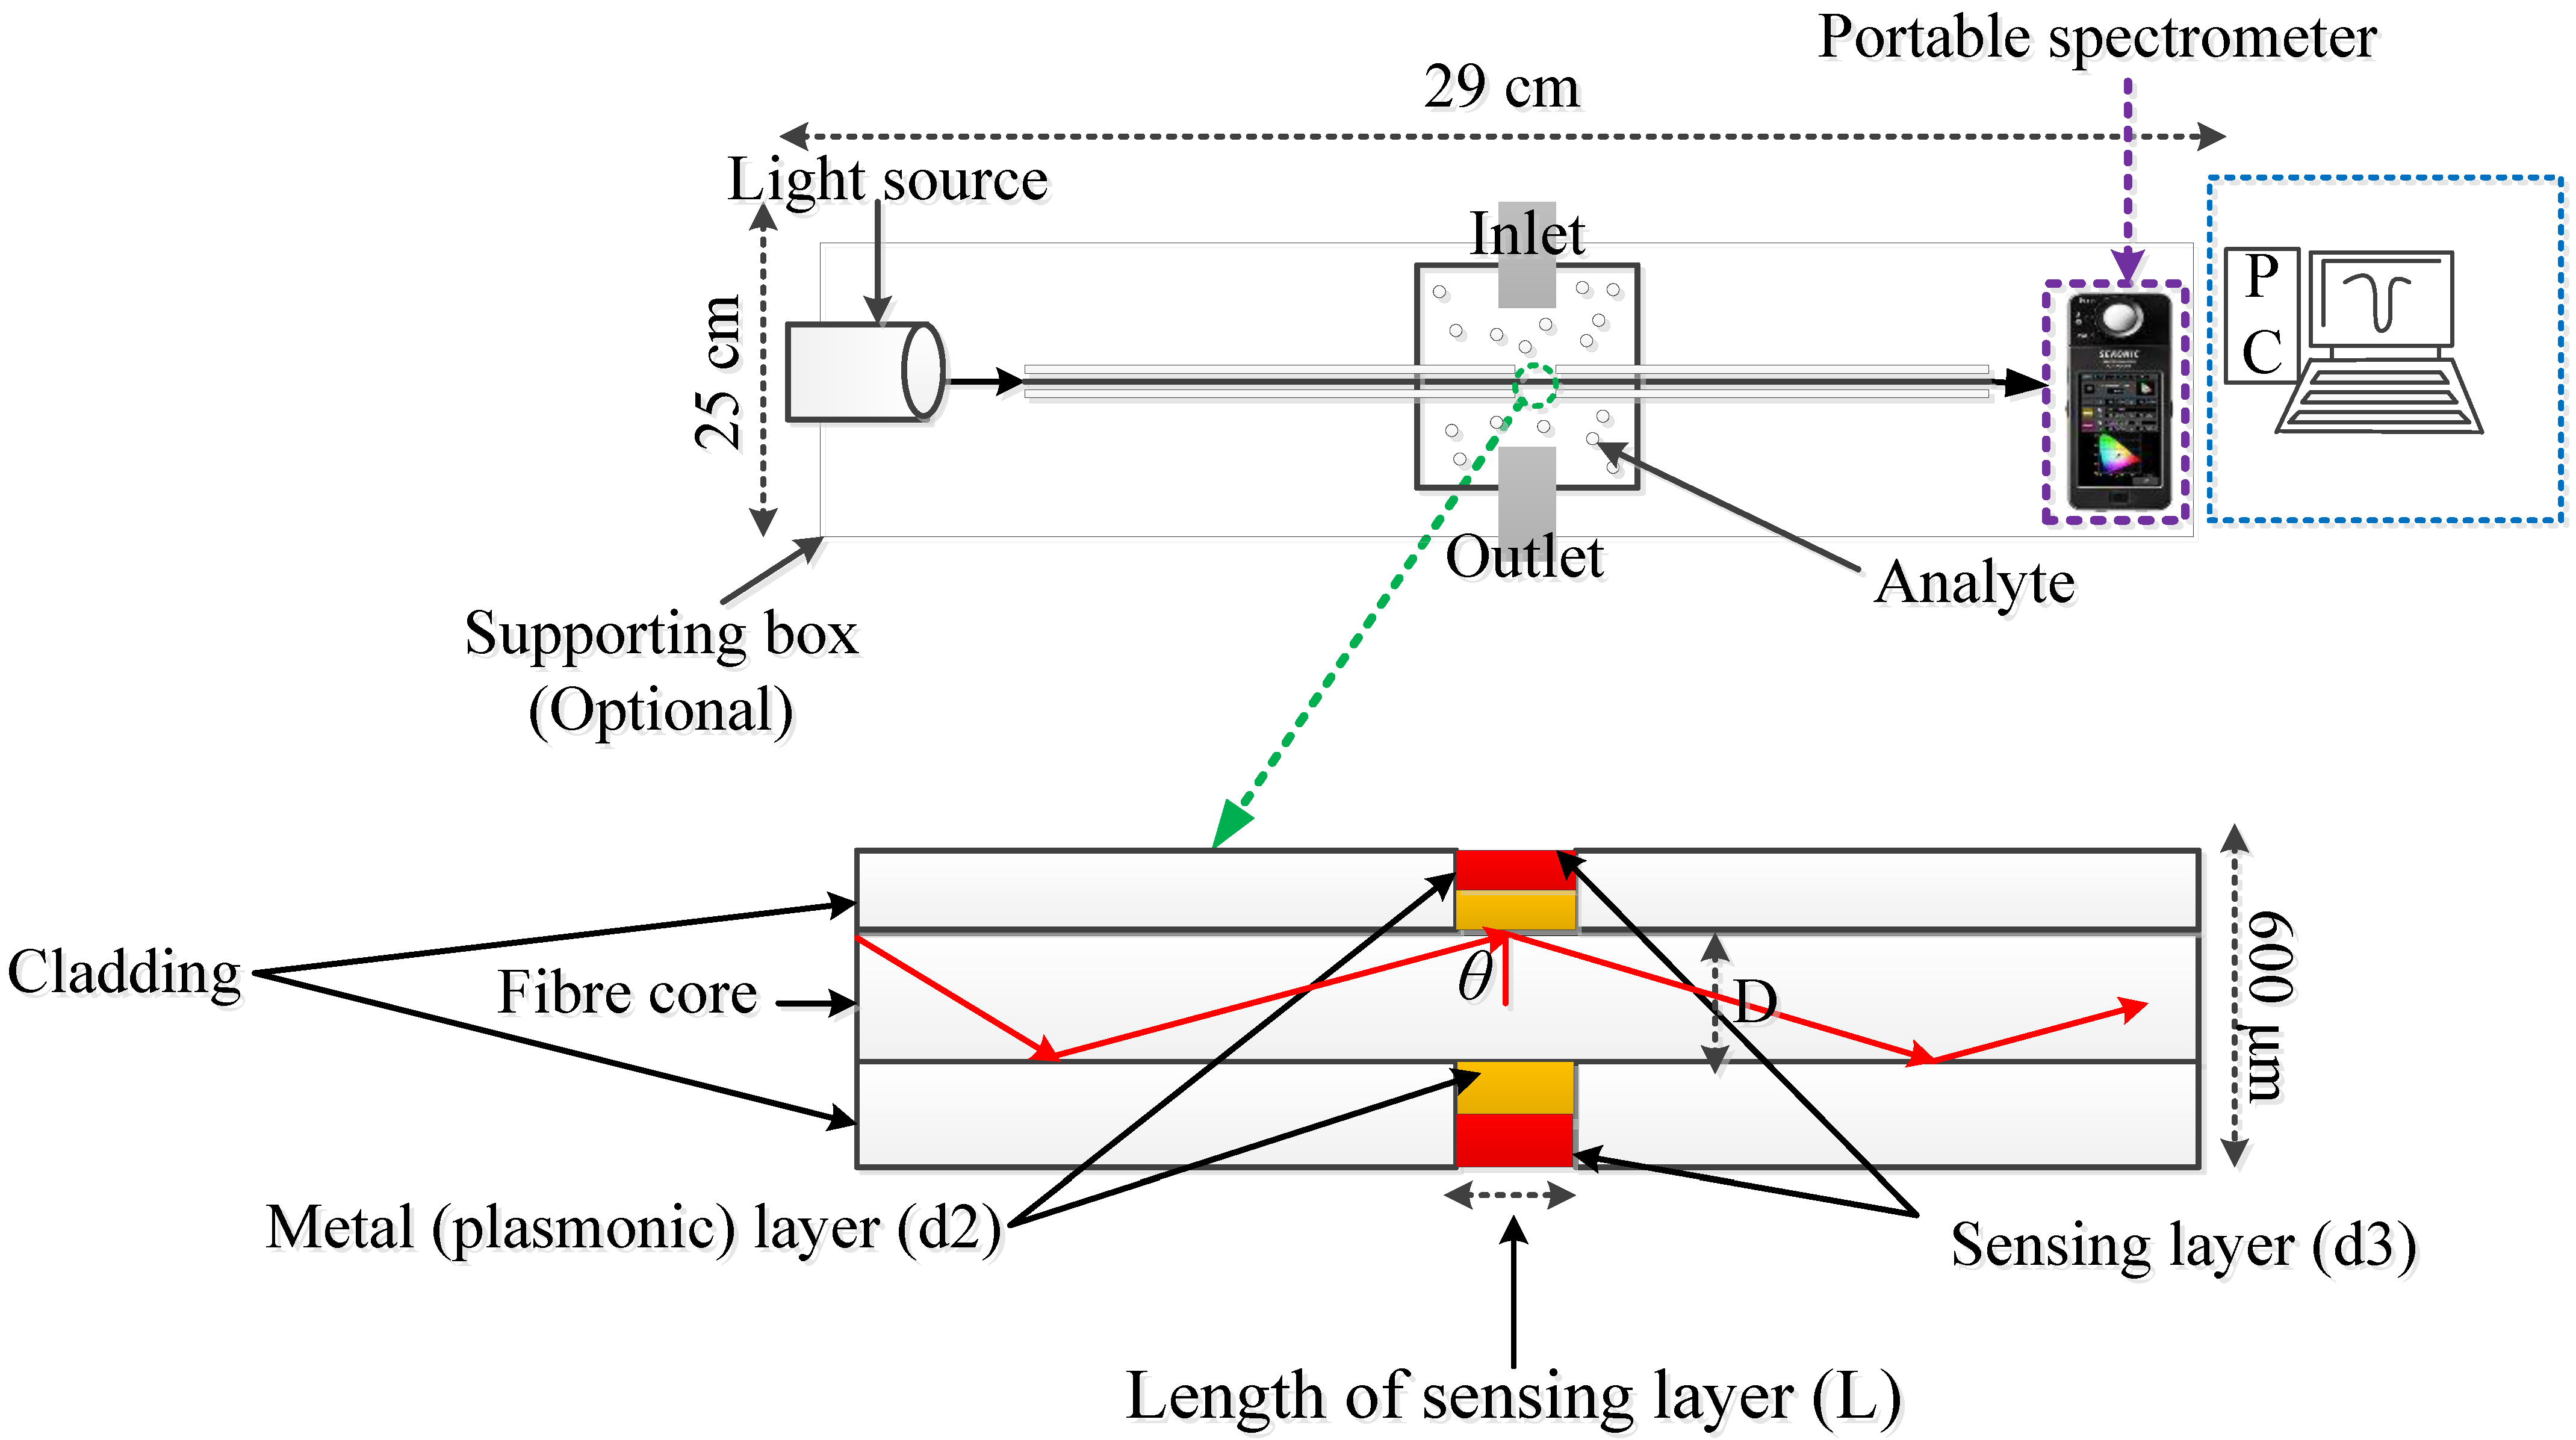
In the case of a fiber-optic (FO) SPR biosensor, the so-called surface plasmon resonance (SPR) condition is satisfied in a process similar to prism-based SPR biosensors. However, the evanescent wave spreads along the core-cladding interface [46]. Additionally, wavelength interrogation is employed as opposed to the angular interrogation method for the prism-based SPR biosensors. As such, the wavelength of the light at which nearly complete attenuation of the transmitted intensity of the reflected light occurs is called the SPR wavelength (λSPR), and it is a function of the optical properties of the metal, optical fiber properties, dielectric medium, and any adsorbate on the metal [47,48]. This dependency is exploited in fiber-optic SPR biosensing applications. The SPR wavelength is observed through SPR curve, the plot of transmitted intensity against the wavelength. SPR-based sensors feature high sensitivity, real-time non-invasive measurement, label-free measurement, and non-requirement of electrodes [41,48]. The schematic diagram of a fiber-optic biosensor is shown in Figure 4. For realization of this biosensor, an optical fiber core with diameter D, surrounded by a cladding, is required. The cladding is removed in the middle to obtain a sensing region, L. The unclad portion of the fiber is coated with a sheet of plasmonic material (mostly gold or silver) film, having thickness of d2 and sensing layer of thickness d3. Light is launched with a polychromatic light source and data are collected using a portable spectrometer/normal spectrometer and computer. The power, P, of the light launched by the polychromatic light source into one end of the fiber core is indicated by the red arrow in Figure 4. Assuming dP is the power arriving at the other fiber end between the incident angles θ and θ + , then dP can be expressed by Equation (2) [49].
dP α P(θ)dθ
where P(θ) is the modal power related to the incident angle θ. It can be mathematically written by Equation (3) [49]:
P ( θ ) = n c 2 sin θ cos θ ( 1 n c 2 cos 2 θ ) 2
where nc is the refractive index of the fiber core. The normalised transmitted power (PT) due to single reflection at the core/metal (mostly gold or silver) interface is described by Equation (4) [49,50]
P T = θ C π / 2 R P N r e p ( θ ) P ( θ ) d θ θ C π / 2 P ( θ ) d θ
where Nrep(θ) = L/(Dtanθ) is the total number of light reflections in fiber, θ is the incident angle of the light rays, L is the length of the sensing layer, D is the diameter of the fiber core, and θC (sin-1(nCL/nC)) is the critical angle of the optical fiber, while nCL is the refractive index of the cladding.
The performance of both prism and FO SPR biosensors are described in terms of their sensitivity, detection accuracy, and the quality factor among others, as explained in the proceeding section, which are all required to be high [41,50].

2.2. LSPR Biosensors

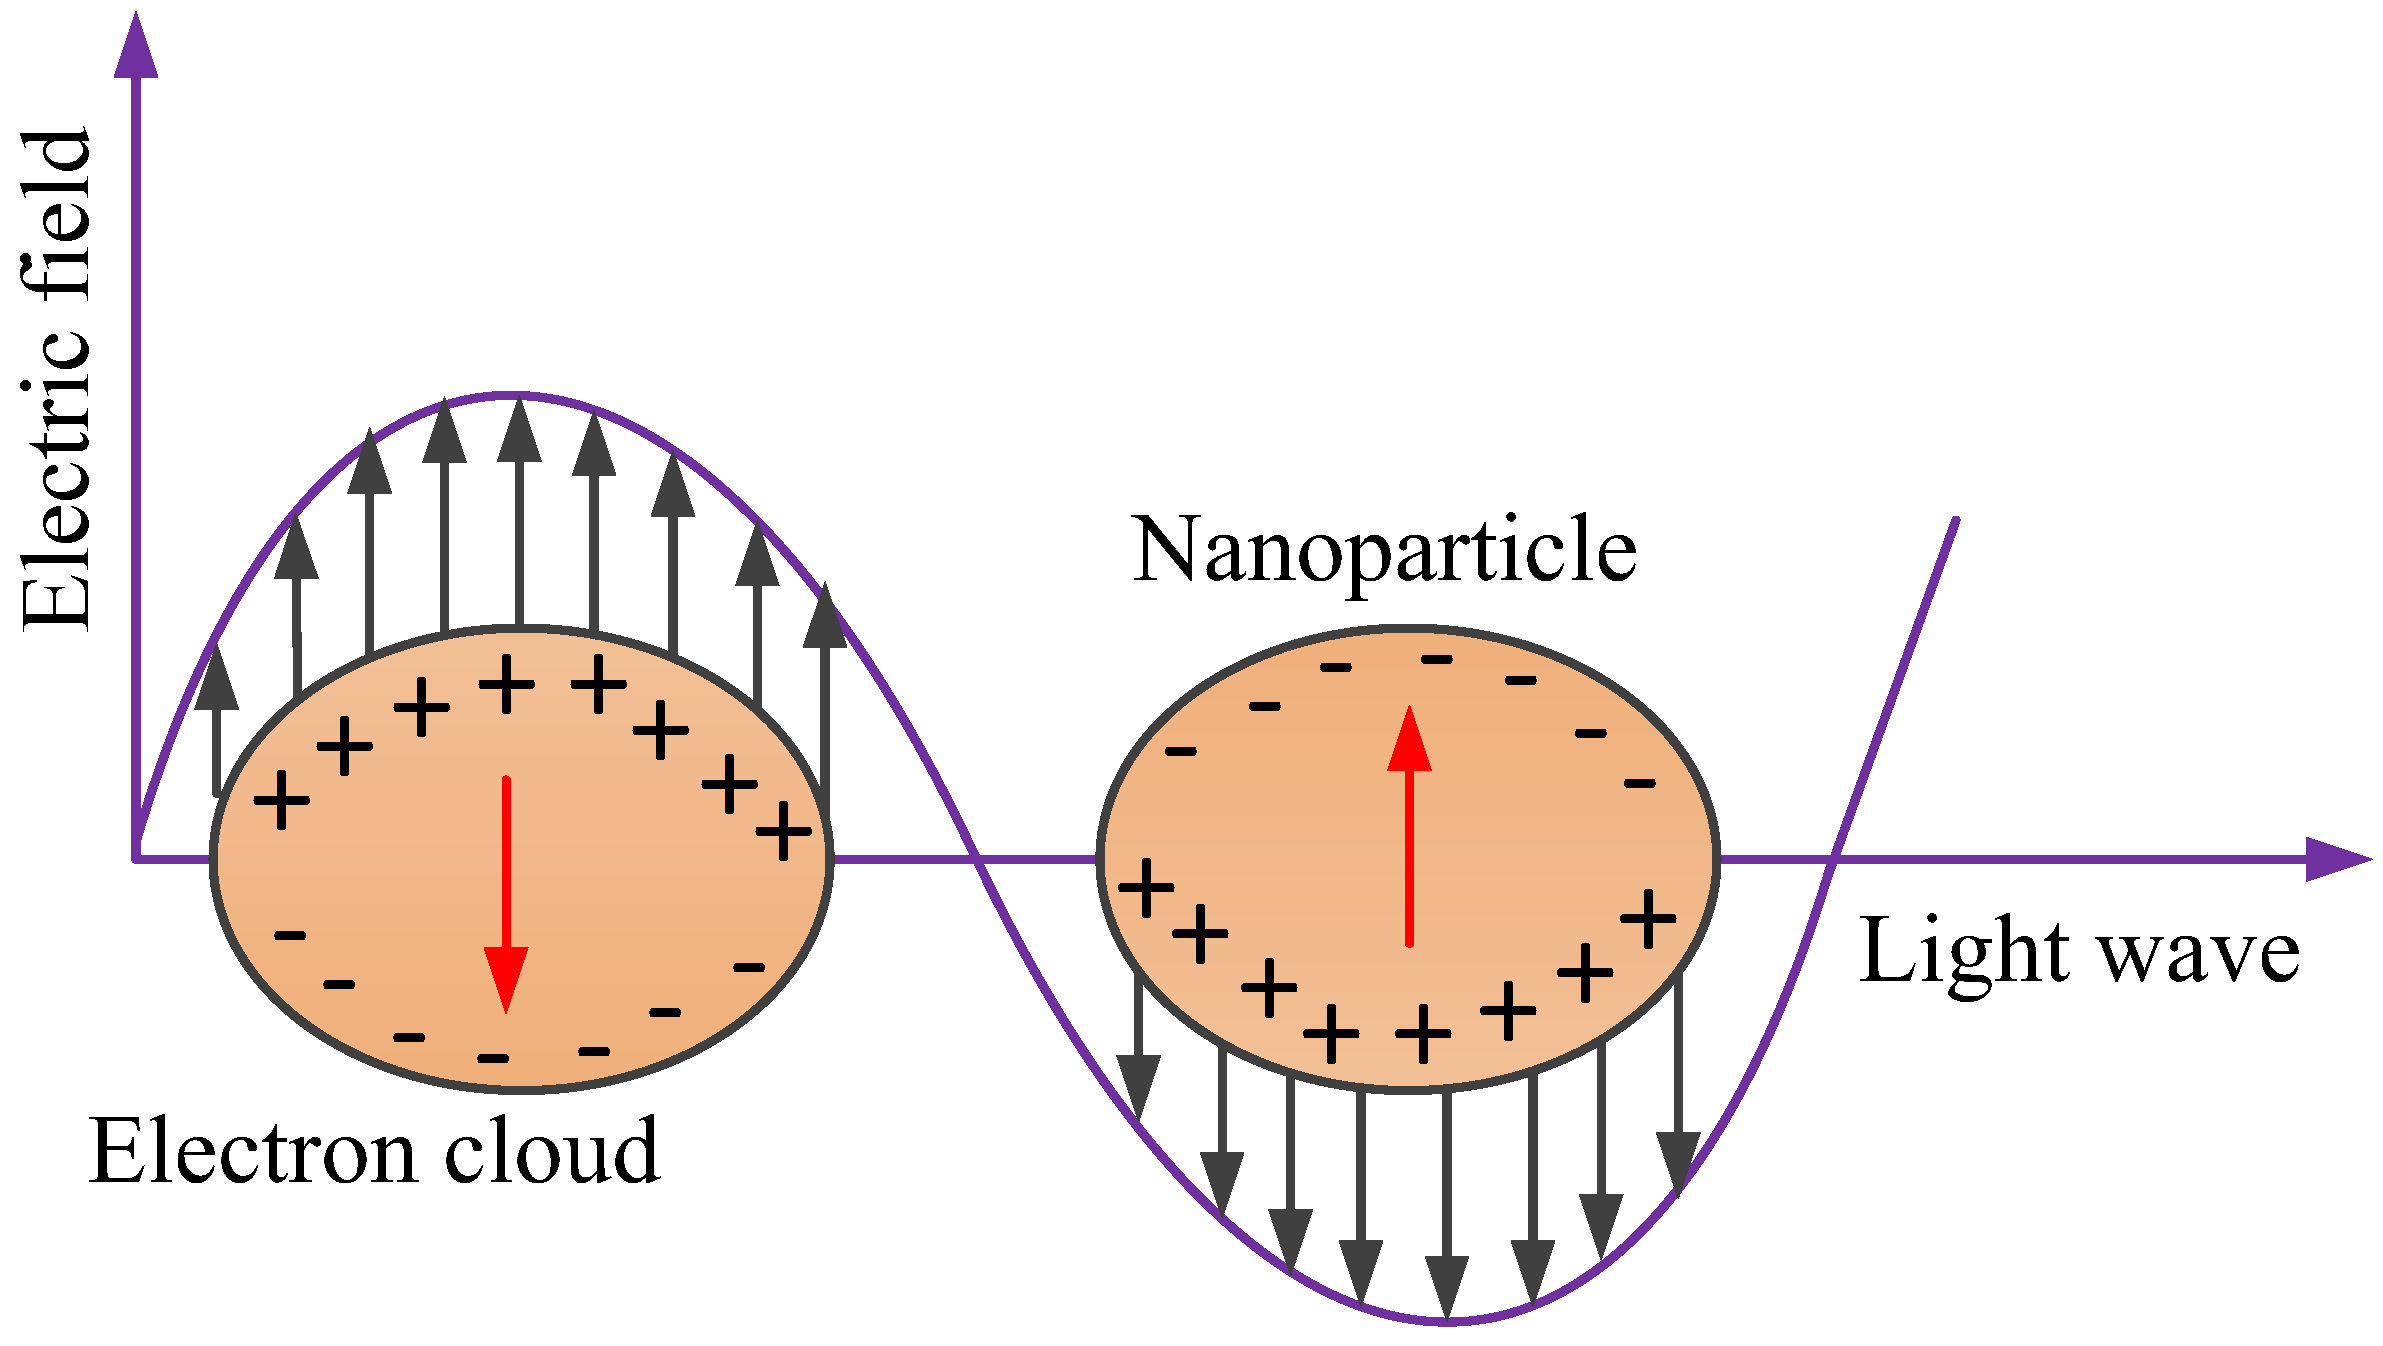
LSPR biosensors have the potential to enable ultrasensitive detection of analytes including gaseous-based ones such as ammonia, especially within a few nanometers from their surface [37]. Unlike SPR biosensors that employ a thin film of plasmonic materials (such as gold), LSPR biosensors are based on a non-propagating oscillation of conducting electrons due to an interaction between light waves and subwavelength-sized metallic nanoparticles [40]. As shown in Figure 5, the interaction results in the buildup of polarization charges on the surface of the metallic nanoparticle, which is behaving as a dipole. Consequently, strong absorption and scattering of the light (light extinction) are manifested in addition to the strong enhancement of EM field proximal to the nanoparticle surface [40].
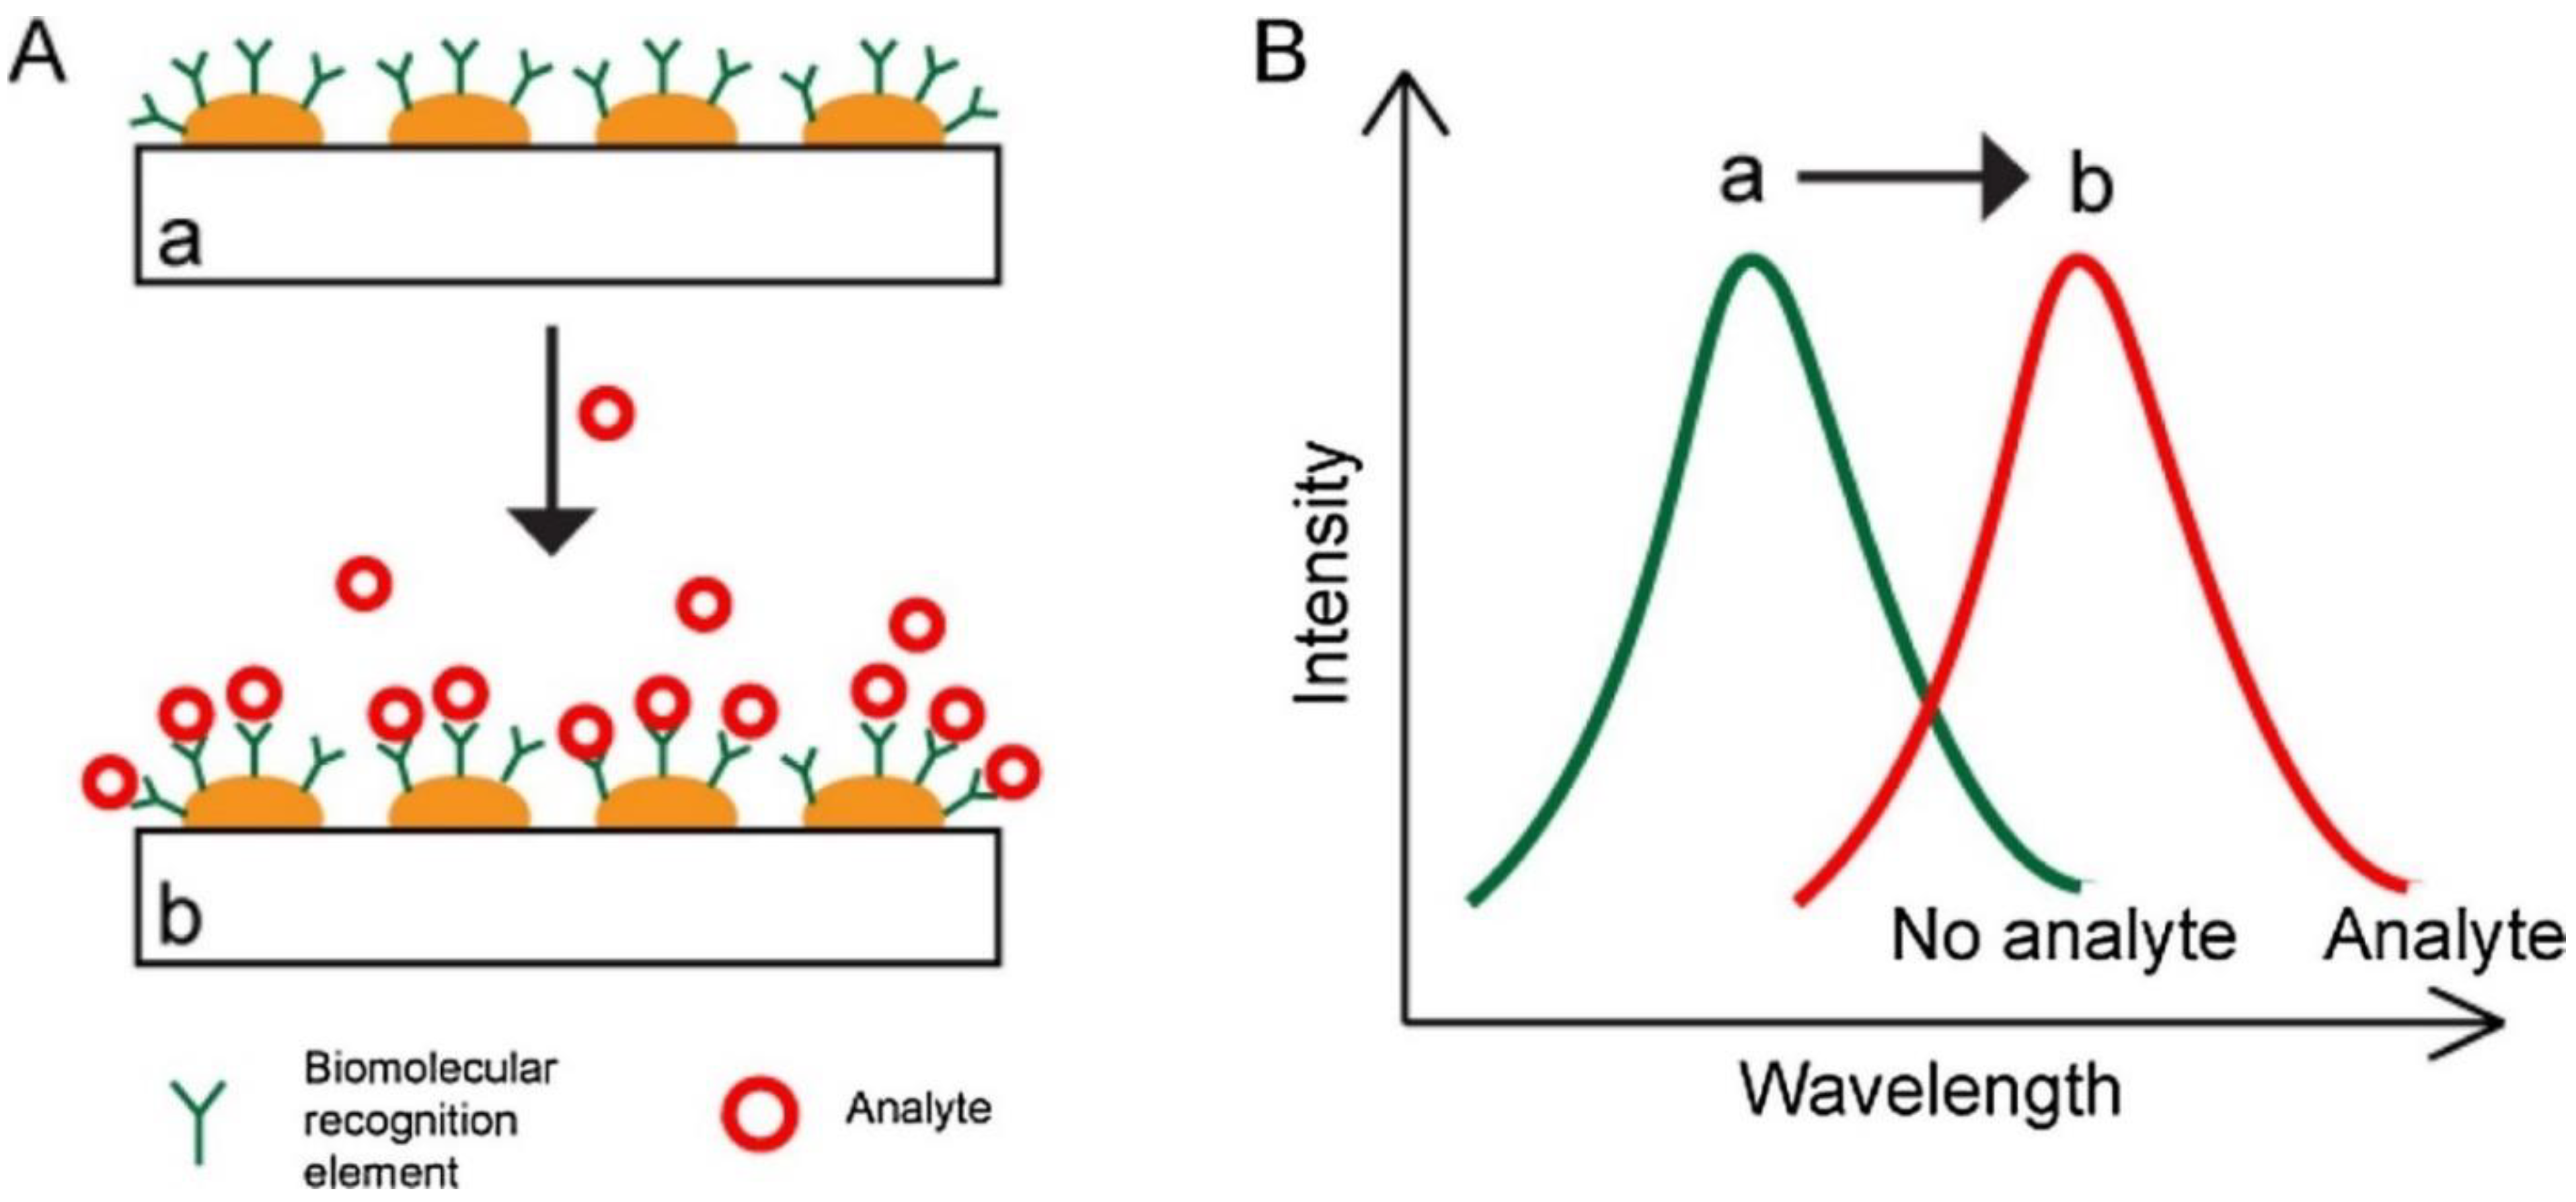
The localized resonance is featured as an extinction wavelength peak, LSPR peak, where the maximum light extinction (absorption and scattering) is observed. As shown in Figure 6A,B, the LSPR peak and its corresponding wavelength are extremely sensitive to the changes (e.g., refractive index change) in the medium of the metallic nanoparticle [51]. This is exploited in LSPR sensing. In addition, the LSPR peak depends on the shape, size, and material of the metallic (plasmonic) nanostructure [37]. A significant advantage of LSPR biosensors over SPR biosensors is that the plasmonic resonance can be achieved through excitation with direct light (Figure 6A,B), simplifying their system setup by avoiding the incorporation of complex light couplers such as prism or gratings.
For the prominent spherical nanoparticle with a radius smaller than the wavelength of the incident wave (2r << λ), its optical extinction (σe) is given using Equation (5) [39].
σ e ( λ ) = 24 π 2 r 3 ε d 3 / 2 N λ ln ( 10 ) ( ε i ( λ ) ( ε r ( λ ) + 2 ε d ) 2 + ε i ( λ ) 2 )
where N, λ, εd, εr, εi represent the electron density, wavelength of the incident light, dielectric medium permittivity, real part metallic nanoparticle’s permittivity, and imaginary part metallic nanoparticle’s permittivity, respectively.
LSPR biosensing platforms defend on the surface density of the nanoparticles. As shown in Figure 7a, for high density surfaces, the optical response is easily measured using an extinction measurement. Typically, a plasmonic nanostructure (nano hole), or occasionally, plasmonic nanoparticles on a substrate are directly illuminated and have the resulting transmitted light measured using either a spectrometer (wavelength interrogation) or CCD/CMOS camera (intensity interrogation) (Figure 7a) [40].
Alternatively, when dealing with low-density nanoparticle surfaces, the incident light and the light absorbed by the metallic nanoparticle are required to be significantly contrasted. In that case, scattering measurements capable of realizing higher signal-to-noise ratios are the most suitable and can be accomplished using dark-field (DF) microscopy or total internal reflection (TIR) microscopy (Figure 7b,c). DF microscopy functions in transmission configuration, using a darkfield condenser to targets the surface of the nanohole (or other nanostructure), as shown in Figure 7b. Next, a microscope objective is employed to measure the light scattered by the plasmonic nanoholes (or other plasmonic nanostructures). The prism-coupling based TIR microscopy also utilizes a microscope objective to measure the scattered light, as shown in Figure 7c.

2.3. SERS Biosensors

SERS phenomenon is considered as a landmark achievement in Raman analysis with characteristic weak signal. The weak nature of Raman signal has hindered its development and detection of low-concentration analytes despite the advantages of Raman spectroscopy in offering non-destructive, fast, and precise analysis; simplified sample preparations and handling capabilities; and excellent specificity, among others [53]. SERS is reported to enhance an original Raman signal up to 1015 [54], enabling improved fingerprint capability and detection of chemicals and biomolecules even at a single-molecule level, which opens a way to its popularity in various applications including medical diagnostics, food safety and security, environmental monitoring and defense, and security, among others [38]. Prominently, the Raman enhancement is described in terms of two (2) mechanisms, namely, (i) electromagnetic (EM) enhancement (plasmonic), and (ii) chemical enhancement (charge transfer) [53,54].
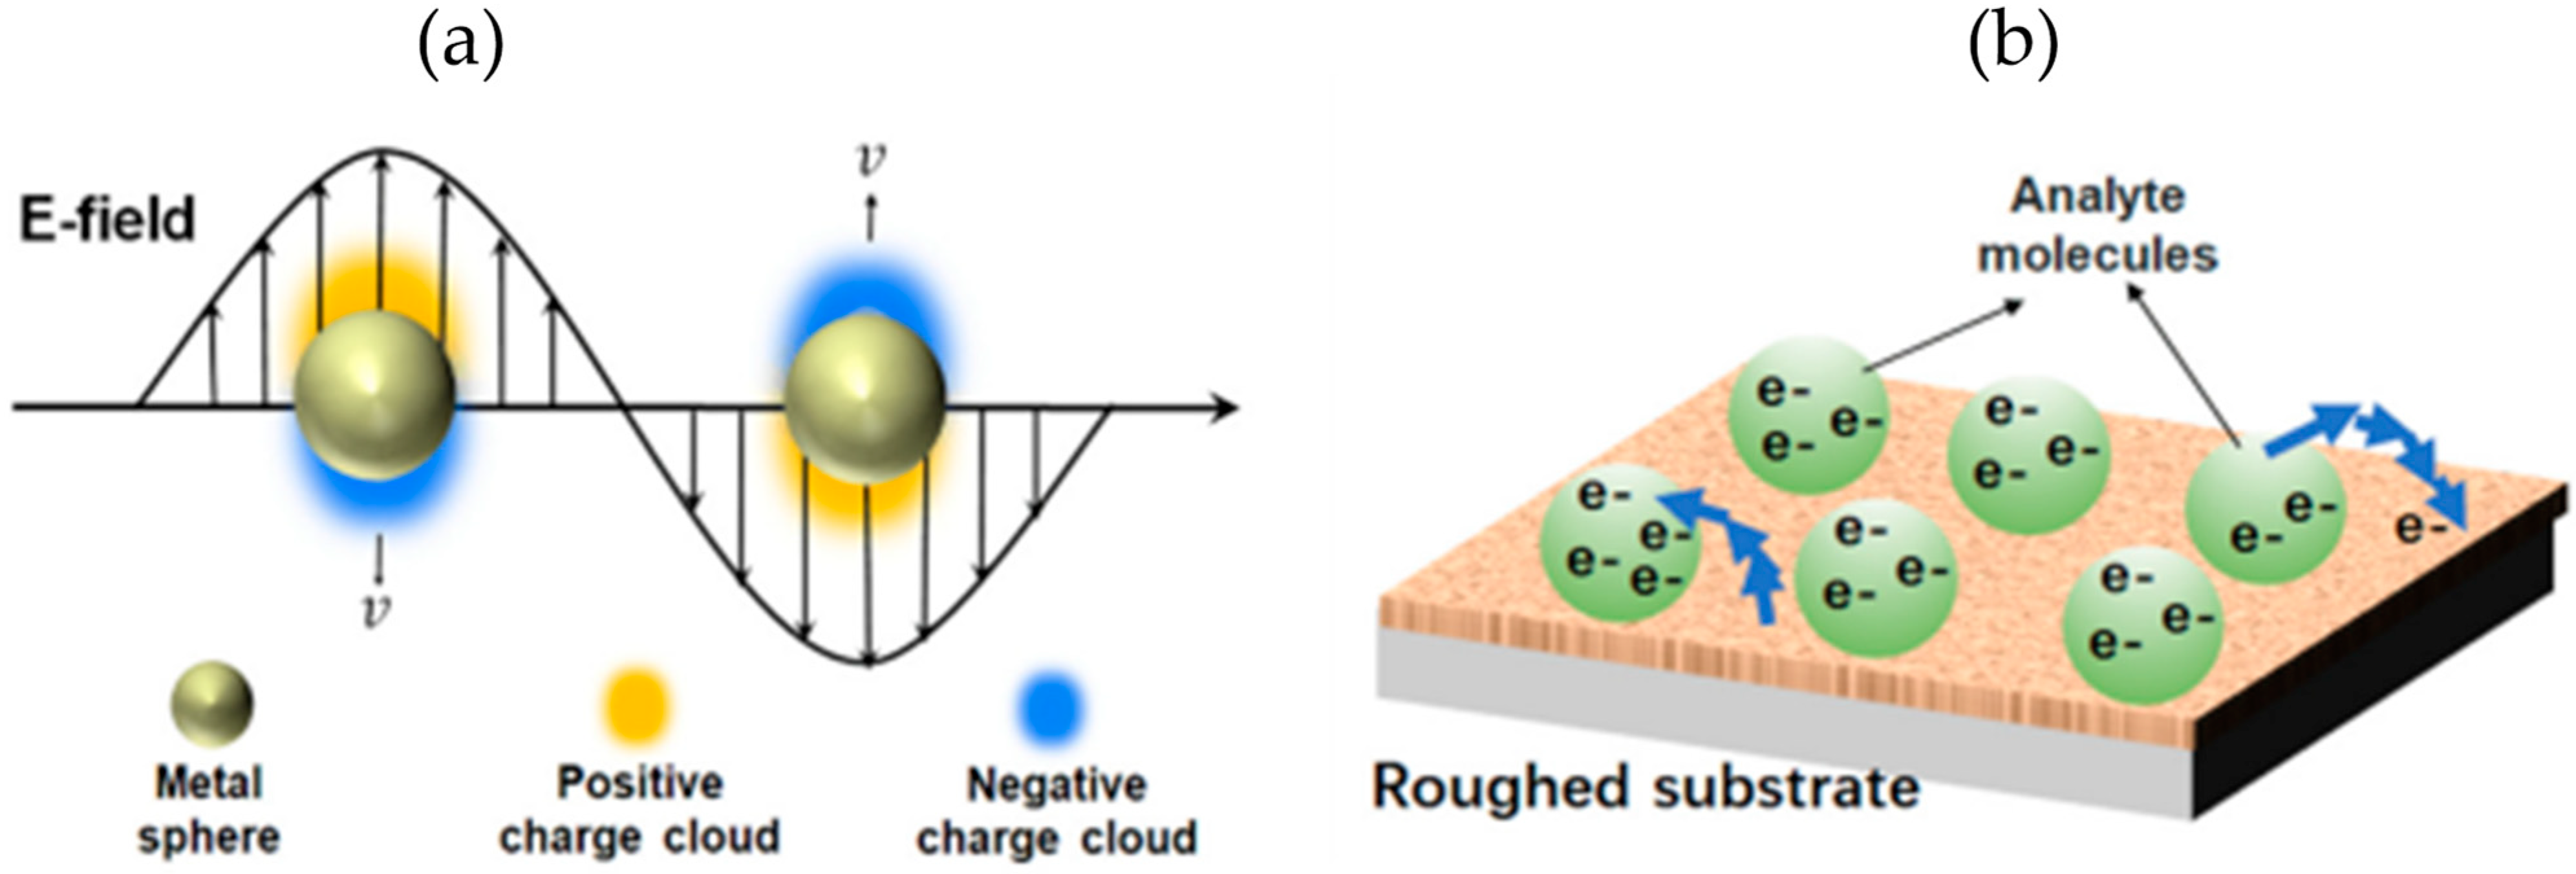
Among these mechanisms, EM enhancement plays a greater role for metallic SERS substrates leading to the consideration of SERS biosensors as an integral part of the plasmonic biosensors by numerous researchers [37,55,56]. Figure 8a,b illustrates the processes for the EM enhancement and the charge transfer mechanisms, respectively, for a metallic SERS substrate. On the other hand, SERS substrates based on organic and inorganic semiconductors have demonstrated excellent chemical stability and reproducibility. However, their enhancement mechanism is mainly regarded as a chemical enhancement with highest reported EF of 107 [57].
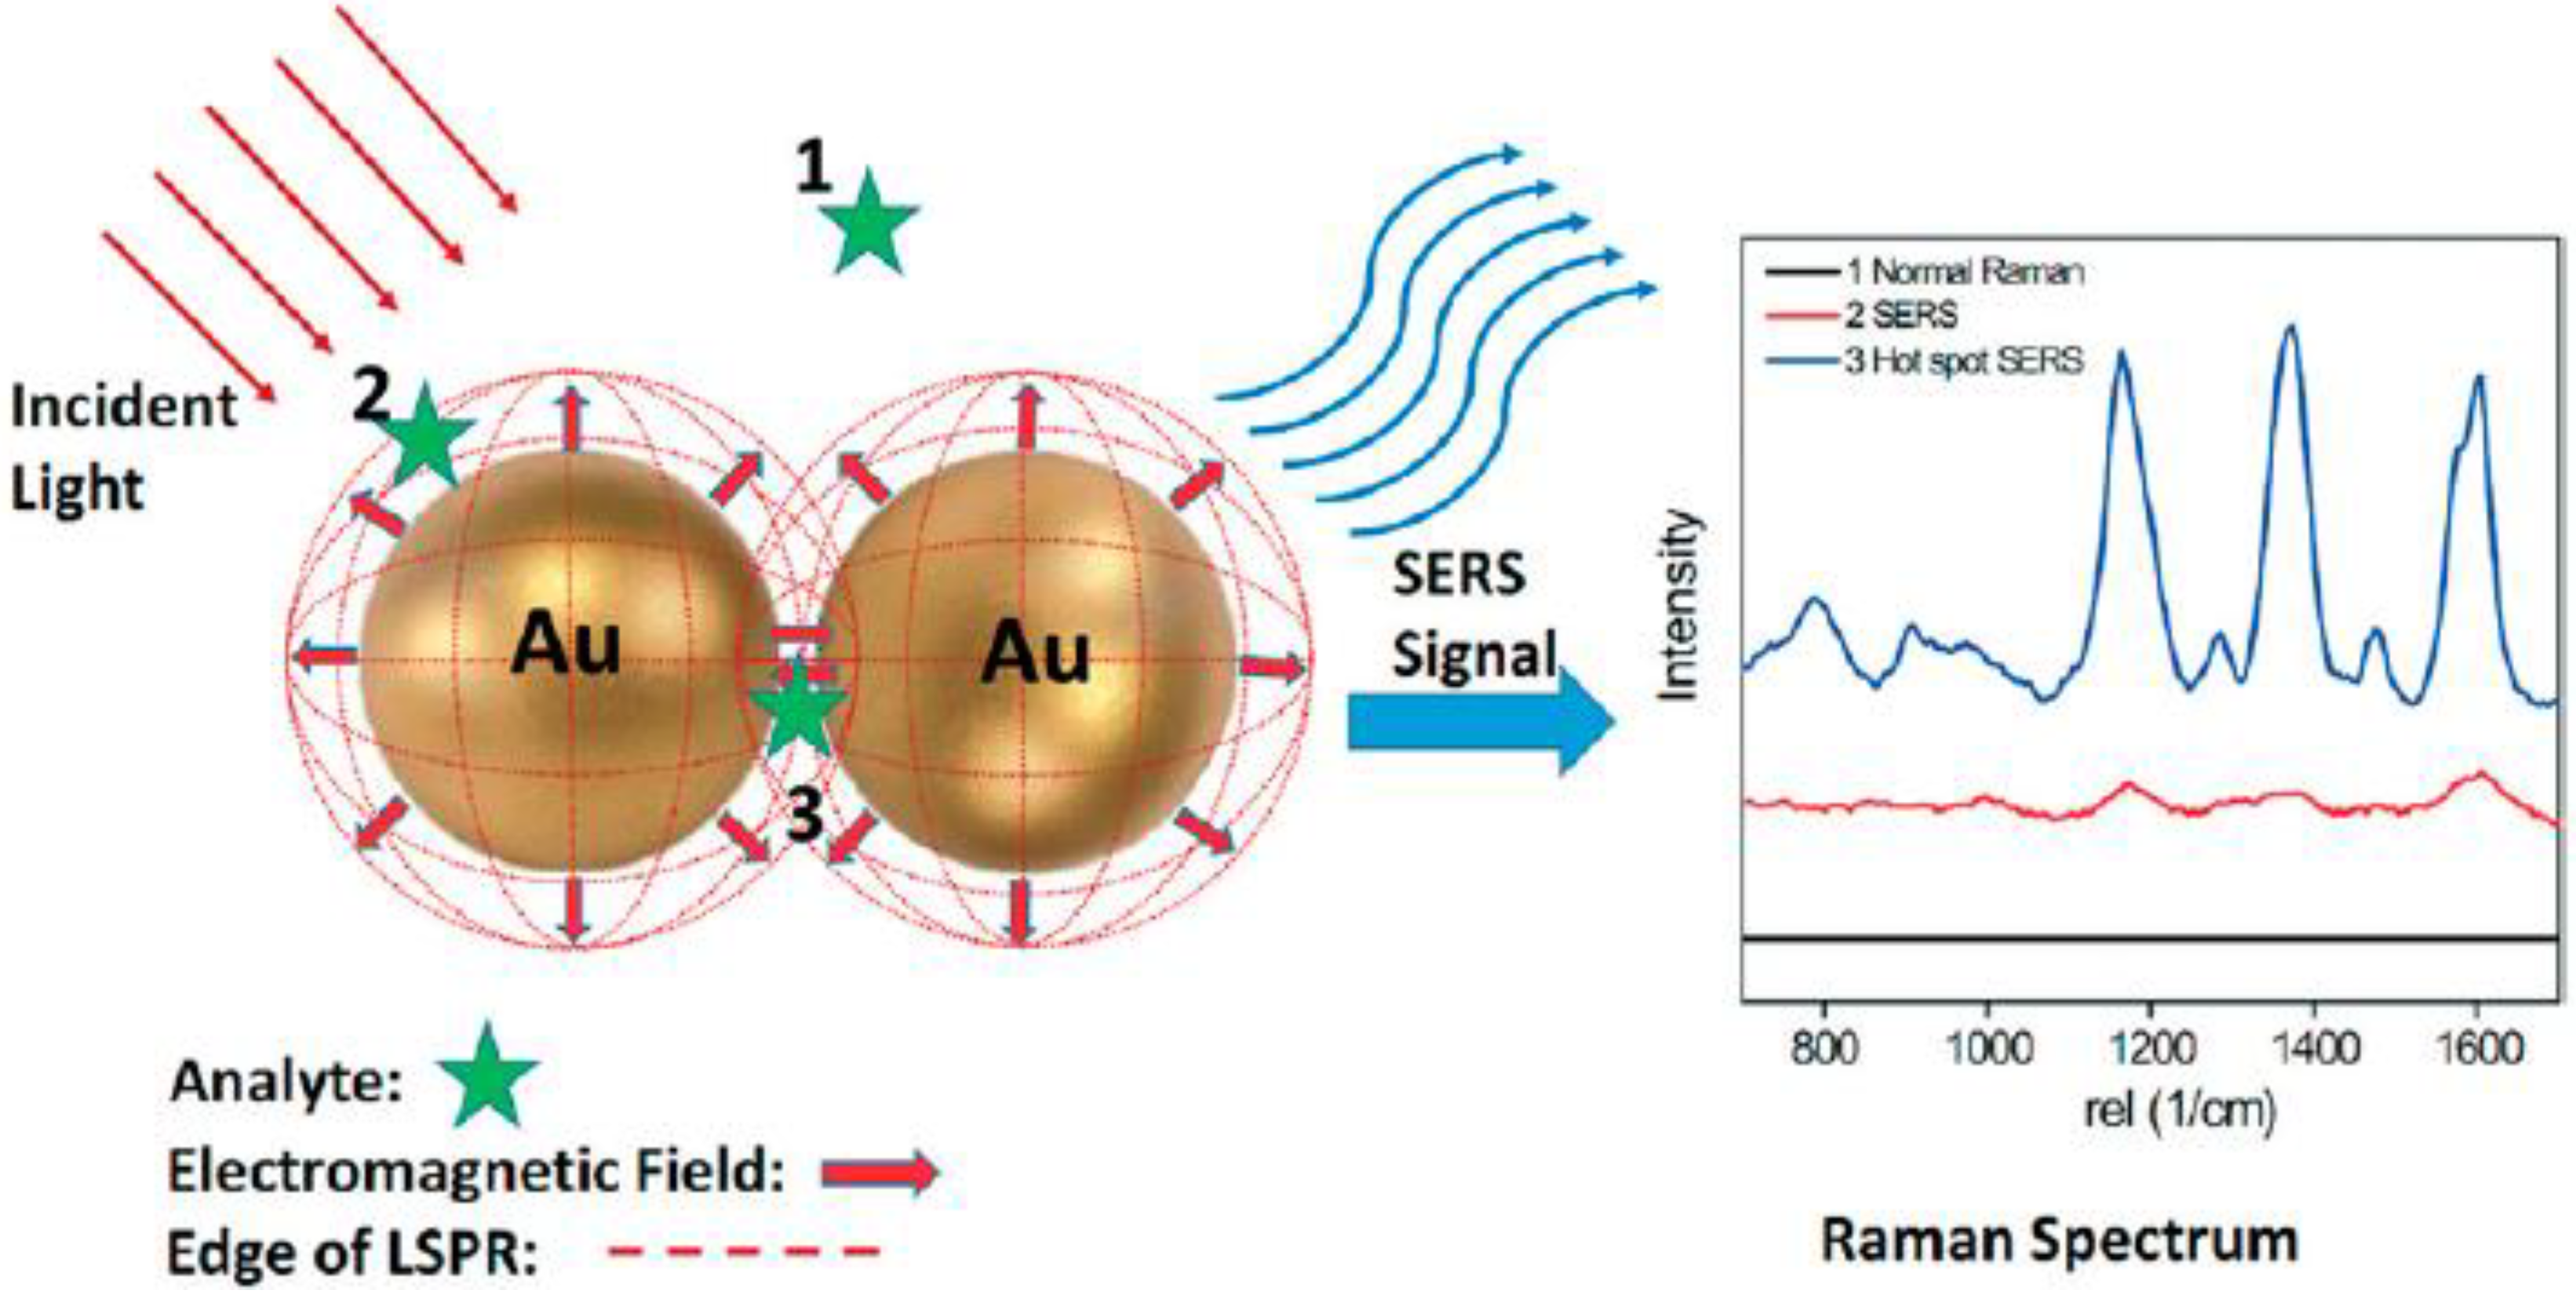
The principle of EM is mainly due to the localized surface plasmon resonance (LSPR) on a nanometal surface generated from the interaction between light waves, metallic nanoparticles, and target molecules. This produces enhanced local EM and the fingerprint information of the molecules in the form of the Raman spectrum. Therefore, EM takes care of signal enhancement in SERS biosensing [59]. CM arises due to the transfer of electrons between adsorbed molecules and the SERS substrate during development of an adsorbate–surface complex, giving rise to stronger molecular selectivity [38,59]. Generally, an ideal metallic SERS substrate is required to possess two important properties which include excellent plasmonic activity and presence of abundant hotspots (nanometer-sized spaces in between metallic nanoparticles) for the generation of an intense electromagnetic field. This is normally generated using rough or nanostructured surfaces. Based on this, the highest enhancement is observed when the molecules are present in these hotspots (Figure 9) [54].

3. Performance Characteristics Requirement for the Deployment of Plasmonic NH3 Sensors in Renal Disease or Kidney Failure

The mitigation of complications related to the CKD progression to end-stage kidney disease (kidney or renal failure) is subject to the early identification of impaired kidney function. Despite the potential application of biosensors for exhaled breath NH3 in this respect, the inherent low concentrations of NH3 in exhaled breath as well as the presence of abundant interferents hinders its rapid development. These oblige the exploration of biosensors with ultra-sensitive detection capability and overall excellent performance characteristics for the accomplishment of this task in a reliable and non-invasive manner. Optimization of the following performance parameters is essential for the potential application of plasmonic sensors in the detention of renal complication-related NH3 gas.

3.1. Sensitivity and Lowest Detection Limit

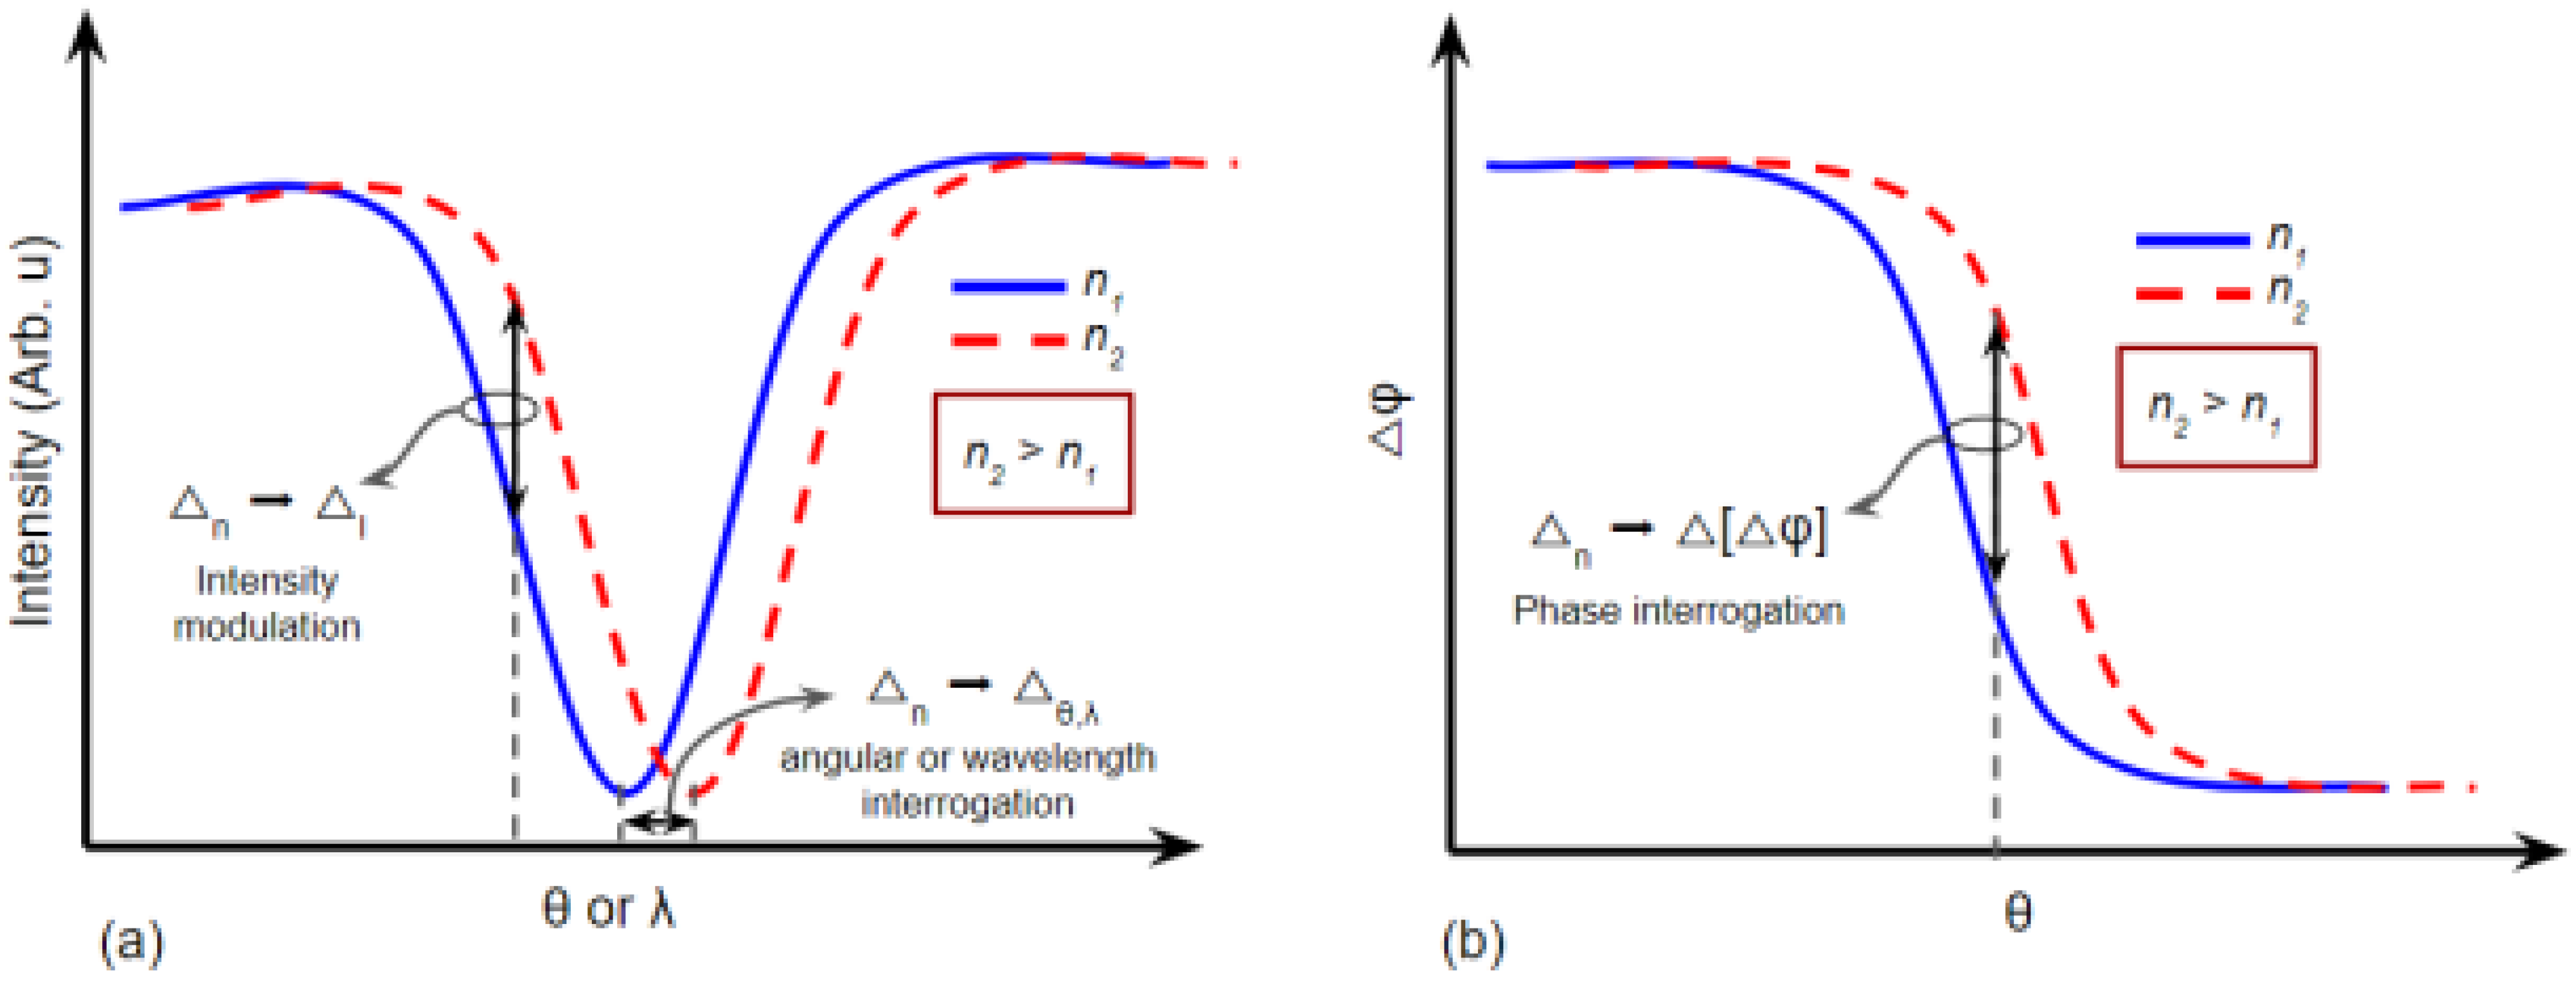
Sensitivity of a sensor refers to the fraction between its output signal and quantified property which is simply the slope of an output–input graph. In SPR sensors, and depending on the interrogation techniques, the sensitivity is defined as the ratio of the change in output signal (resonance angle or wavelength, intensity, or phase (Δθres, Δλres, ΔI or Δφ)) and change in the analyte property (refractive index or analyte concentration (Δn or Δc)), as shown in Figure 10. Broadly, the SPR sensitivity can be evaluated using Equation (6) [61,62].
S S P R = Δ o u t p u t   s i g n a l Δ c
In the case of LSPR sensors, the sensitivity is calculated (Equation (7)) from the resonance peak wavelength shift [63].
S L S P R = Δ λ Δ c
where Δλ is the wavelength shift of the plasmonic resonance peak, and Δc is the change in concentration.
For SERS sensors, the sensitivity is defined by measuring the enhancement factor (EF) across different substrates, as shown in Equation (8). A more reliable EF value is usually obtained through the analysis of multiple spots on the SERS substrate.
E F = I S E R S N s u r f I R S N v o l
where ISERS and IRS represent the intensity of Raman scattering and SERS, respectively. In addition, Nsurf and Nvol stand for the number of molecules adsorbed on the SERS active substrate and sampled in bulk, respectively [64,65].
Another important parameter is the lowest detection limit (LOD), which refers to the lowest concentration of analyte that can be detected by a biosensor. In several medical and environmental monitoring applications, biosensors are required to detect analyte concentrations of as low as ng/mL, ppb, ppm, or fg/mL to confirm the presence of traces of analytes or disease biomarkers. In the case of renal-related complications, a biosensor capable of detecting NH3 gas at least down to 1ppm is required. The LOD for SPR sensors has been defined as the ration of refractive index change (Δn) and resonance angle variation as shown in Equation (9).
LOD = Δ n Δ θ r e s × 0.001 0
In general, the detection limit of bio-analyte based plasmonic biosensors (LODba) is defined as the concentration of analyte that produces a sensor output corresponding to three standard deviations of the sensor output measured for a blank sample, as shown in Equation (10).
LOD b a = 3 σ S b a
where Sba is the sensitivity related to the bio-analyte concentration.

3.2. Detection Accuracy and Quality Factor

In plasmonic sensors, specifically SPR and LSPR sensors, the detection accuracy (DA) and figure of merit or quality factor (FOM or QF) complement the performance measurement of plasmonic sensors. This is attributed to the widening of SPR and LSPR curves at large shifts (increased sensitivity), making it difficult to locate the SPR dip and LSPR peaks with certainty, in other words, decreasing the resolution of the sensor [63,66,67]. As shown in Equations (11) and (12), calculations of DA and FOM require the full width at half maximum (FWHM) of the SPR and LSPR spectra to be evaluated [68]. FWHM is defined as the width of the SPR/LSPR curve for the half value (50%) of the maximum response signal [69].
DA = 1 FWHM
FOM = Sensitivity FWHM = DA × Sensitivity

3.3. Selectivity

Selectivity is another important performance parameter that generally depicts the ability of a receptor in a biosensor to detect an analyte of interest amidst interfering analytes and contaminants. In plasmonic sensors, this is usually achieved through diverse novel approaches by functionalizing the surface of the biosensor or nanoparticles’ surface (LSPR and SERS) with antibodies, enzymes, peptides, nucleic acids, semiconducting materials, polymeric materials, or other unique materials capable of capturing the analyte of interest [70,71,72,73,74]. For example, the utilization of an SERS sensor based on Au nanoparticles decorated on polystyrene colloidal crystals (PSCCs) has demonstrated better H2S selectivity compared to gases like NH3, hydrogen peroxide (H2O2), and nitrous oxide (N2O) [75]. Equally, selective detection of NH3 gas has been achieved with polymer-coated plasmonic sensors [76,77,78]. Overall, the selectivity of a biosensor to a particular analyte is highly dependent on the proper selection of its bioreceptor.

3.4. Reproducibility and Repeatability

Reproducibility is the ability of the biosensor to generate identical responses for a duplicated experimental set-up. On the other hand, repeatability refers to the ability of a biosensor to generate identical responses for a series of experimental testing utilizing a single experimental set-up. Usually, the reliability of a sensor is subject to improved reproducibility and repeatability. By extension, the deployment of plasmonic sensors and other sensing devices in medical applications requires a compromise between sensitivity and reliability [72]. In plasmonic sensing, performance reproducibility and repeatability measurements are achieved by conducting multiple number of experiments under similar conditions (at different spots for sensors such as SERS-based ones) and followed by the evaluation of relative standard deviation (RSD%), standard deviation (S.D.), or coefficient of variation (COV) [72,78,79,80,81,82,83,84].

3.5. Stability

Stability is the degree of vulnerability to ambient disruptions in and around the biosensing system. These disruptions can cause a drift in the output signals of a biosensor under measurement. This can cause an error in the measured concentration and can affect the reliability of the biosensor. The response stability of a plasmonic sensor is usually evaluated through continuous usage of the sensor for up to a few months to ensure that little or no change is observed in the output signal [85,86,87]. A stable biosensor is expected to be free from issues related to temperature sensitivity, poor affinity, and time-related degradation of the active sensing layer of the biosensor, which may influence the stability of a biosensor [88].

3.6. Linearity

Linearity measurement uses linear relationships to reveal the correctness of the measured response of a particular sensor at diverse concentrations of the analyte of interest. It is mathematically expressed as y = kx, where x is the concentration of the analyte, y is the output signal, and k is the sensitivity of the biosensor. Using linear fittings, correlation coefficients determine the extent of linearity. Usually, the maximum linearity is achieved at one and decreases from one to zero. Linearity is equally an important determining factor for the deployment of biosensors in medical and other applications. For example, the detection of a disease-related biomarker requires the response of the biosensor to be linear at least within a wide range of interest [66,72,88].

4. Plasmonic Biosensors for the Detection of Ammonia (NH3) Vapour

Plasmonic sensors including surface plasmon resonance (SPR), localized surface plasmon resonance (LSPR), and surface-enhanced Raman scattering (SERS) have gained significant popularity over other sensing techniques owing to their ultra-sensitivity, single particle/molecular level detection capability, multiplexing capability, photostability, naked-eye readability, and ease of miniaturization without sophisticated sensor chip fabrication and instrumentation [32,33]. However, the development of gas sensors based on plasmonic techniques is generally hindered due to the poor absorptivity of the gaseous molecules resulting from their low molecular weight. Additionally, the gaseous molecules tend to diffuse more rapidly than those of liquids and solids due to the extra space between their molecules. Fortunately, adoption of appropriate strategies and selection of unique novel materials are considered among the promising ways of mitigating this hurdle [89]. For example, conducting polymer-based films such as polypyrrole, polythiophene, and polyaniline (PANI) have been successfully applied for the detection of ammonia gas [30]. In addition to the superb performance of these polymer-based sensors, researchers are also attracted by their easy synthesis methods, cost-effectiveness, low power consumption, presence of functional groups, high environmental stability, tunable conductivity through doping, and room temperature operation [28,30,90,91,92,93,94,95,96,97,98]; Moreover, the doping and dedoping nature of PANI when exposed to NH3 gas has resulted in numerous PANI-based NH3 sensors [30,99,100,101]. Likewise, the general detection mechanisms between the NH3 gas and other conducting polymers (e.g., polypyrrole, polythiophene), as well as metal oxide semiconductors such as SnO2, are based on the consideration of NH3 as a reducing gas with capability of increasing the resistance of a sensing layer by removing a proton [102,103,104,105,106,107,108].
This is the case in the majority of resistive-based biosensors. In the case of plasmonic biosensors, their response is mainly attributed to either the alteration of refractive index of the sensing layer or that of its surrounding medium upon exposure to NH3 gas [45,109,110,111]. However, improved comprehension of the interaction mechanism during ammonia detection, as well as consideration of the peculiarities associated with renal complication-related NH3 gas, still require great scientific efforts before the successful deployment of plasmonic sensors in line with management of CKD and renal failure.
Exhaled breath is mainly composed of nitrogen, oxygen, carbon dioxide, and water vapour. In addition, thousands (over 3500) of other trace components are present at extremely low concentrations, in parts per million (ppm), parts per billion (ppb), or parts per trillion (ppt) concentrations which serve as important biomarkers of various diseases. NH3 is one of these components and its comprehensive analysis in exhaled breath has been reviewed recently [112].
In addition, in the following subsections, the plasmonic detections of low concentrations of NH3 applicable to kidney-related issues (≤1 ppm) are reported and summarized in Table 1.

4.1. SPR Sensors for the Detection of Ammonia Gas Relevant to Kidney Disease

In the past two decades, a simple and cost-effective grating-based surface plasmon resonance sensor capable of detecting ammonia down to part per billion (ppb) concentrations range was devised [113]. As shown in Figure 11a, the conventional interrogation approaches based on angle, wavelength, phase, or intensity were changed to time-based measurement using a sensor disk approach. The rotating optical disk was coated with a silver film, a transparent dielectric (Yttria) film, and functionalized with bromocresol purple. Upon exposing the surface of the sensing layer to ammonia, a detection limit down to 10 ppb was accomplished. This resulted from the change in optical properties of BCP layer. Unfortunately, the sensors presented significant noise that required elimination in addition to other issues related to long-term drift and selectivity, and secondary effects such as changes in temperature and humidity.
In another development, the doping and de-doping feature of drop-casted camphor sulfonic acid doped polyaniline was exploited for the SPR sensing of NH3 gas. In this work, spectroscopic ellipsometry confirmed the wavelength-dependent response observed via SPR. More importantly, the device demonstrated the capability to detect ammonia gas down ∼0.2ppm theoretically [77]. Unfortunately, long response times were observed in addition to the manifestation of significant hysteresis effects.
Additionally, Mishra et al. [114] demonstrated the detection of low concentrations of NH3 gas using a fiber-optic SPR sensor based on polyaniline and PMMA/reduced graphene oxide nanocomposite. However, the sensor could not detect ammonia gas below 10 ppm concentrations despite the theoretical detection limit of 0.367 ppm [78]. To overcome this shortcoming, the coatings were replaced with indium tin oxide (ITO) and bromocresol purple (BCP), which realized the detection of NH3 gas down to 1 ppm and theoretical LOD of 0.175 ppm [111]. The authors attributed this to the porosity, defects, densities, and coarse nature of the ITO layer, which triggered the swelling effect of the ITO layer upon exposure to the NH3 gas, as well as the associated refractive index increment. Surprisingly, the ITO-based sensor even surpassed SPR sensors based on conventional plasmonic metals including Ag/BCP and Cu/BCP in terms of detection sensitivity and lowest detection limit [114]. Moreover, the same group observed a better theoretical LOD, and detection sensitivity with the utilization of Ag and SnO2 as the plasmonic and sensing layer, respectively [111]. Generally, SnO2 is widely employed for gas detection owing to its superior chemical stability and simple adsorption of molecular oxygen among other features [110].
A different group also reported the detection of NH3 down to 0.5 ppm using a SnO2-based SPR sensor [110]. Unlike the SPR sensor reported by Mishra et al., gold (Au) was used as the plasmonic material, and the detection system was based on the well-known prism coupled Kretschmann configuration (Figure 11b). Interestingly, the response time significantly improved (0.11 min to 1 sec) after the replacement of the SnO2 layer with a composite-based sensing layer comprising of a conducting polymer (polypyrrole (PPy)) and the SnO2 [115].
It is worth noting that the NH3 gas from exhaled breath is well-humidified. As such, SPR sensors capable of managing this humidity effect are required before their successful deployment for the management of kidney-related issues. An issue analogous to this has been addressed through the utilization of a waveguide SPR sensor based on poly acrylic acid (PAA) and poly vinyl alcohol (PVA) for the detection of NH3 gas under diverse humidity conditions [116]. During the experiment, simultaneous detection of NH3 and humidity was achieved using the PAA- and PVA-based waveguide SPR sensors. PAA responded significantly to the NH3 gas containing water vapour as opposed to PVA, which responded to water vapour only. The authors attributed the PAA response to the NH3 related destruction of its hydrogen bond as well as water sorption augmentation [116]. Apart from these, several investigations for the detection of NH3 gas at higher concentrations are available [76,117,118,119,120,121]. Additionally, other issues, including higher response time and poor repeatability, among others, are also reported [113]. Although significant efforts have been put in place towards the miniaturization of SPR sensors through the introduction of fiber-optic techniques [78,109,114,118,122], the fiber-optics system is still considered bulky due to the requirement to incorporate components such as spectrometers. This will hinder the realization of plasmonic sensors of point-of-care testing (POCT) of the NH3 vapour. More importantly, a reliable selectivity test needs to be conducted against other interfering analytes to enable the sensors to be considered as potential monitors for renal (kidney) failure and the endpoint of dialysis.

4.2. LSPR Sensors for the Detection of Ammonia Gas Relevant to Kidney Disease

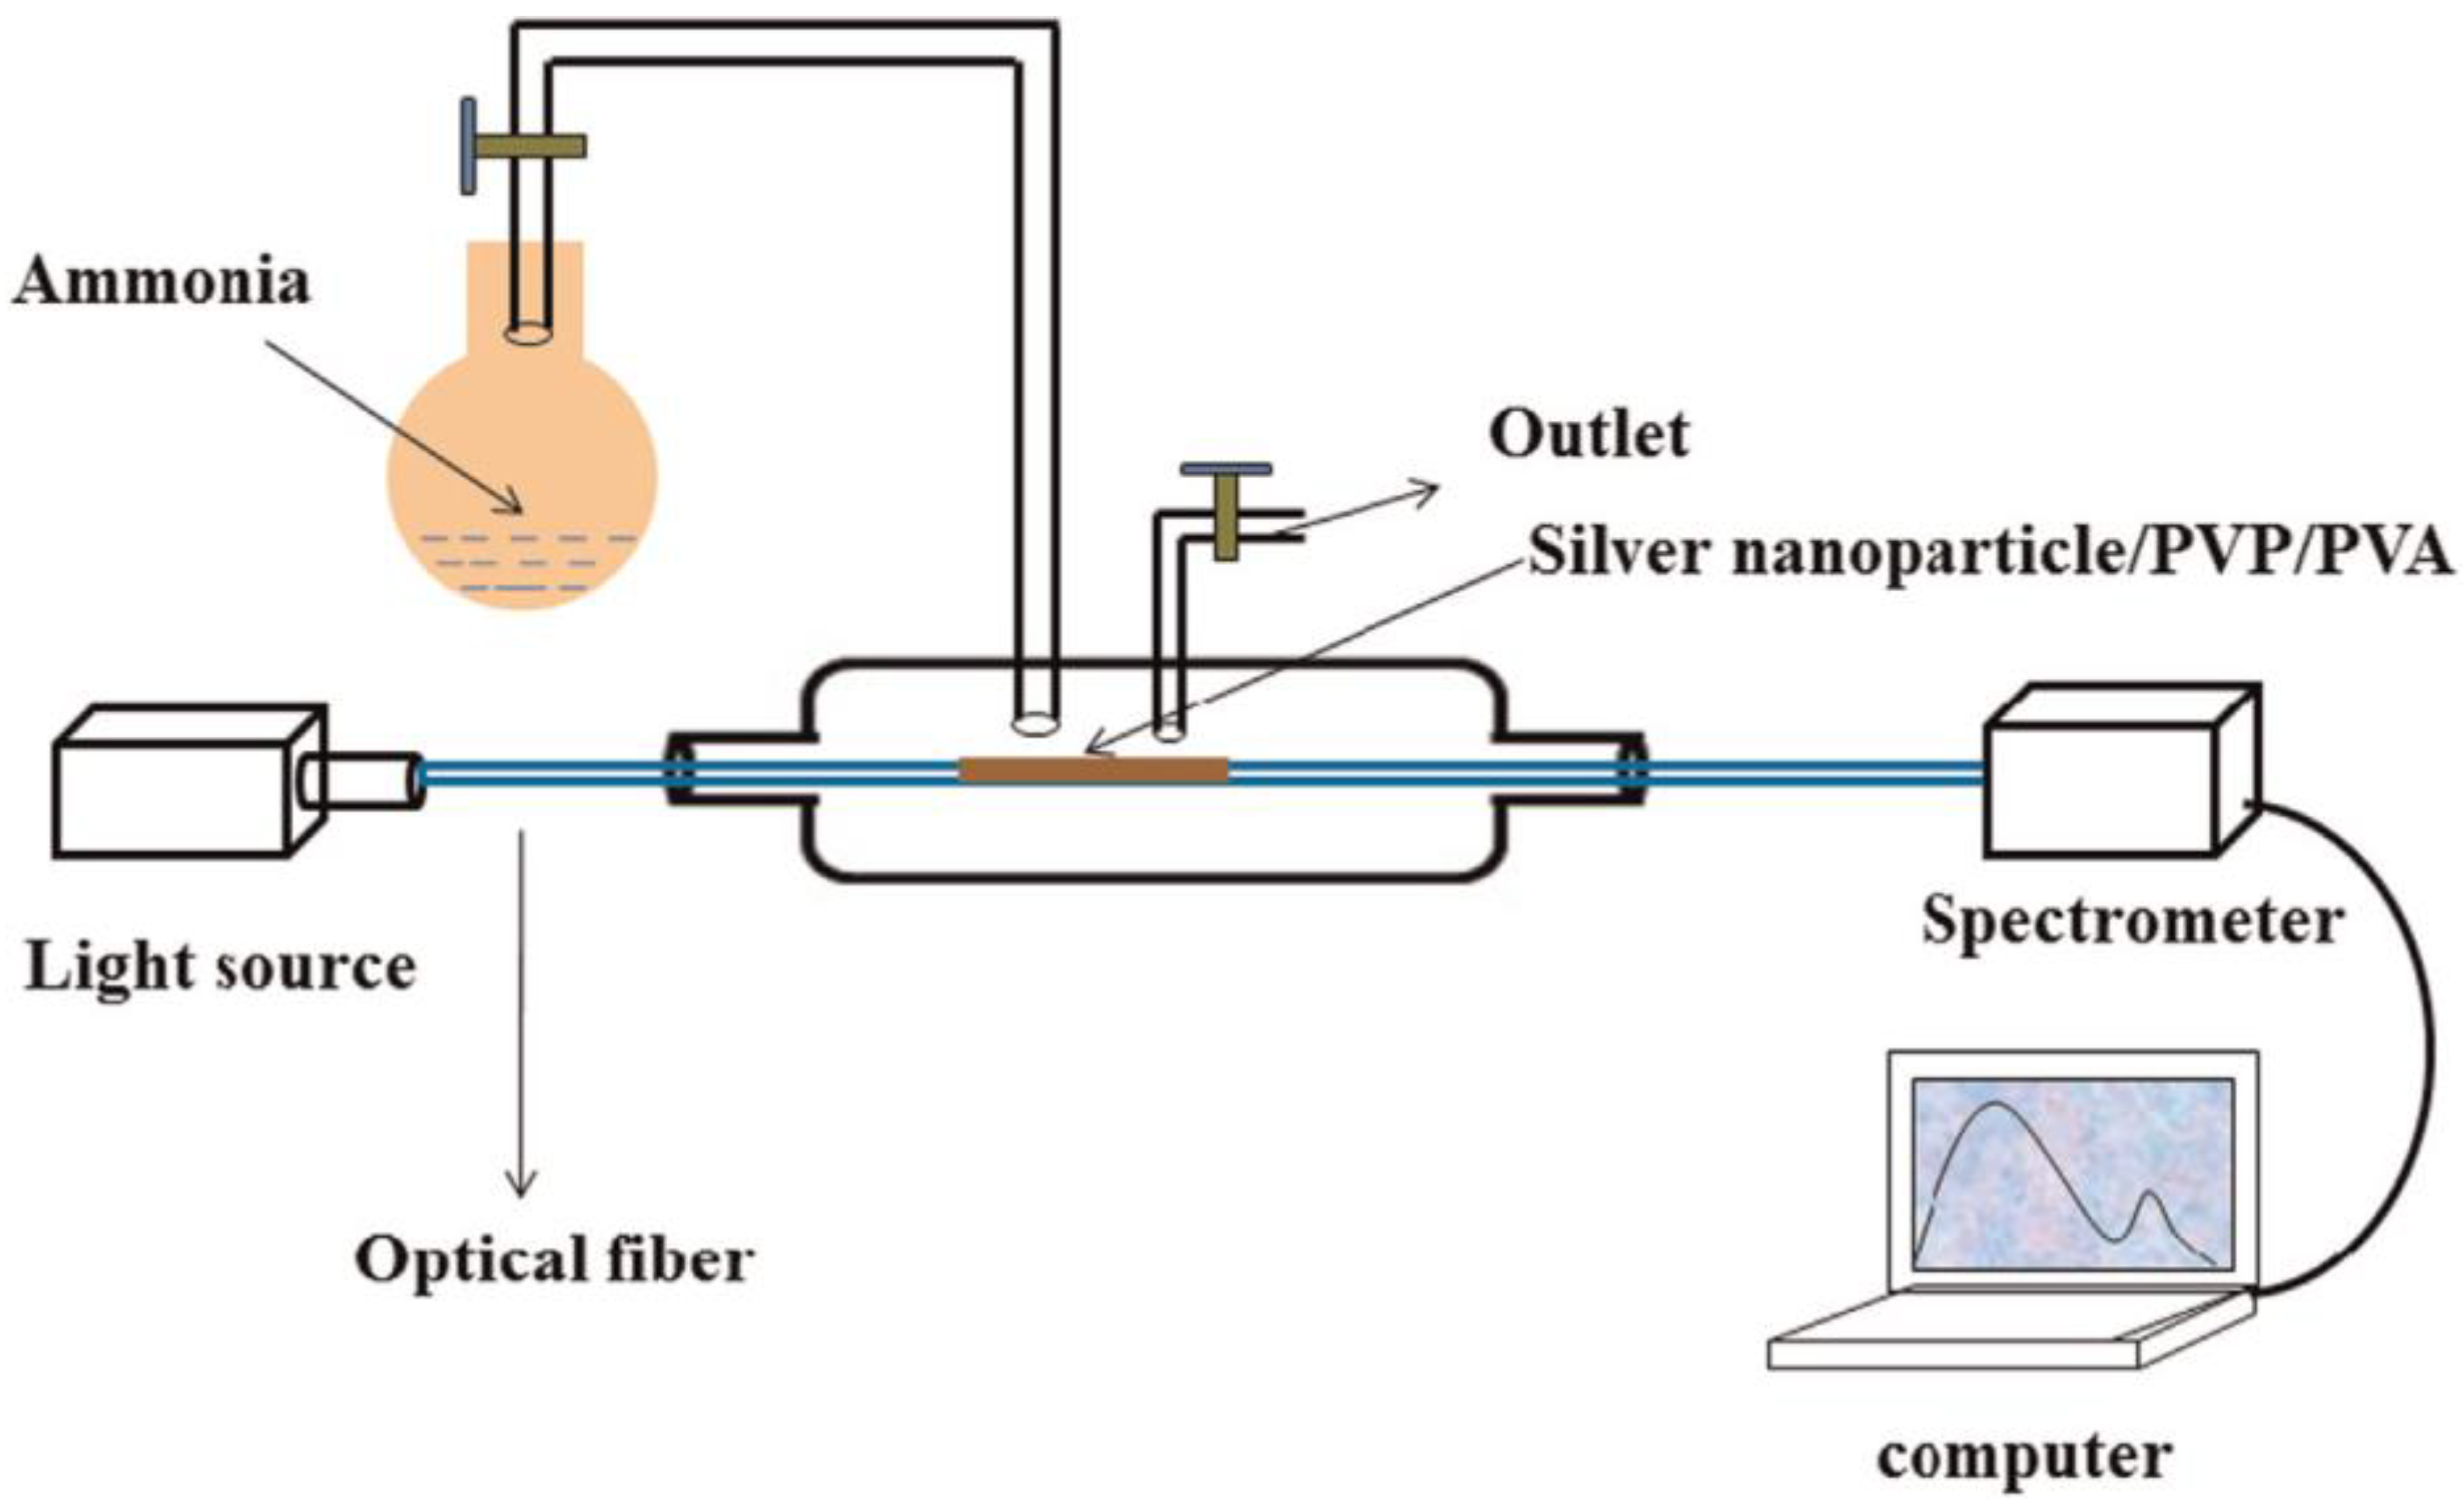
Noble metal nanoparticles (MNPs) show unique optical properties when excited by the electromagnetic field of light. This results in the generation of sharp extinction peaks and enhancement of electric fields at their surface, which are exploited for ultrasensitive sensing and detection of molecular interactions near the surface of the nanoparticles using LSPR sensors. Usually, LSPR sensors are coated with MNPs and upon exposure to the analyte of interest, an obvious wavelength shift (LSPR shift) corresponding to the concentration of the analyte is observed at the position of maximum light extinction, called the LSPR peak wavelength [39,123]. However, the performance of LSPR sensors for NH3 is hindered by the agglomeration of the MNPs in addition to poor absorptivity of gas molecules towards the surface of the MNPs. Research has been conducted to overcome these issues. For example, Pandey et al. [124] reported a fast responsive (2–3 s) detection of NH3 solution down to 1ppm using an LSPR sensor based on silver nanoparticles synthesized from silver nitrate using polysaccharide and guar gum (GG) as a template. In this case, the GG serves as both the reducing and capping agent for synthesized silver nanoparticles. Unfortunately, the prospective medical diagnosis application of the sensor targets liquid-based analytes such as plasma, sweat, saliva, and cerebrospinal liquids, among others. In another development, the incorporation of MNPs into a polymer matrix is considered as another promising method of overcoming the accumulation and agglomeration of MNPs [125]. Raj et al. [45] have exploited this synergistic property to develop their tapered plastic optical fiber NH3 gas sensor by coating it with a hybrid composite of silver nanoparticles/polyvinylpyrrolidone (PVP)/polyvinyl alcohol (PVA) (Figure 12). Normally, a fiber-optics sensor is designed by uncladding a small portion at the center of the fiber and depositing thin layers of the plasmonic and sensitive materials [78]. The sensor demonstrated a sensitive and selective detection of NH3 against interfering analytes including methanol and ethanol. Apart from utilization of polymer/nanoparticle composite, the incorporation of graphene sheets to MNPs has also demonstrated better sensing abilities. The two-dimensional single layer of graphene sheets features superior electrical, mechanical, thermal, and optical properties, making them an attractive sensing material. Similar performance has been observed for an LSPR sensor based on silver nanoparticle/polyaniline composite [126]. The incorporation of silver nanoparticles (AgNPs) to reduced graphene oxide sheets (rGO) for the detection of NH3 gas has been reported for a resistive sensor exploiting LSPR phenomena. In that case, the silver nanoparticles (AgNPs) were uniformly decorated on the reduced graphene oxide sheets (rGO), and interestingly, a sensitive detection of NH3 gas down to 100 ppt was observed [127]. The LSPR phenomenon also has the potential to improve other sensing techniques towards the detection of NH3 such as colorimetric sensors [128,129,130]. Moreover, numerous other investigations demonstrating the potential application of LSPR sensors for the detection of NH3 at concentrations greater than 1ppm are available based on diverse configurations [109,123,131,132,133,134,135,136]. With the improvement of these sensors as well as investigations of other novel LSPR sensors, the detection of NH3 gas of interest to kidney-related complications is highly anticipated.

4.3. SERS Sensors for the Detection of Ammonia Gas Relevant to Kidney Disease

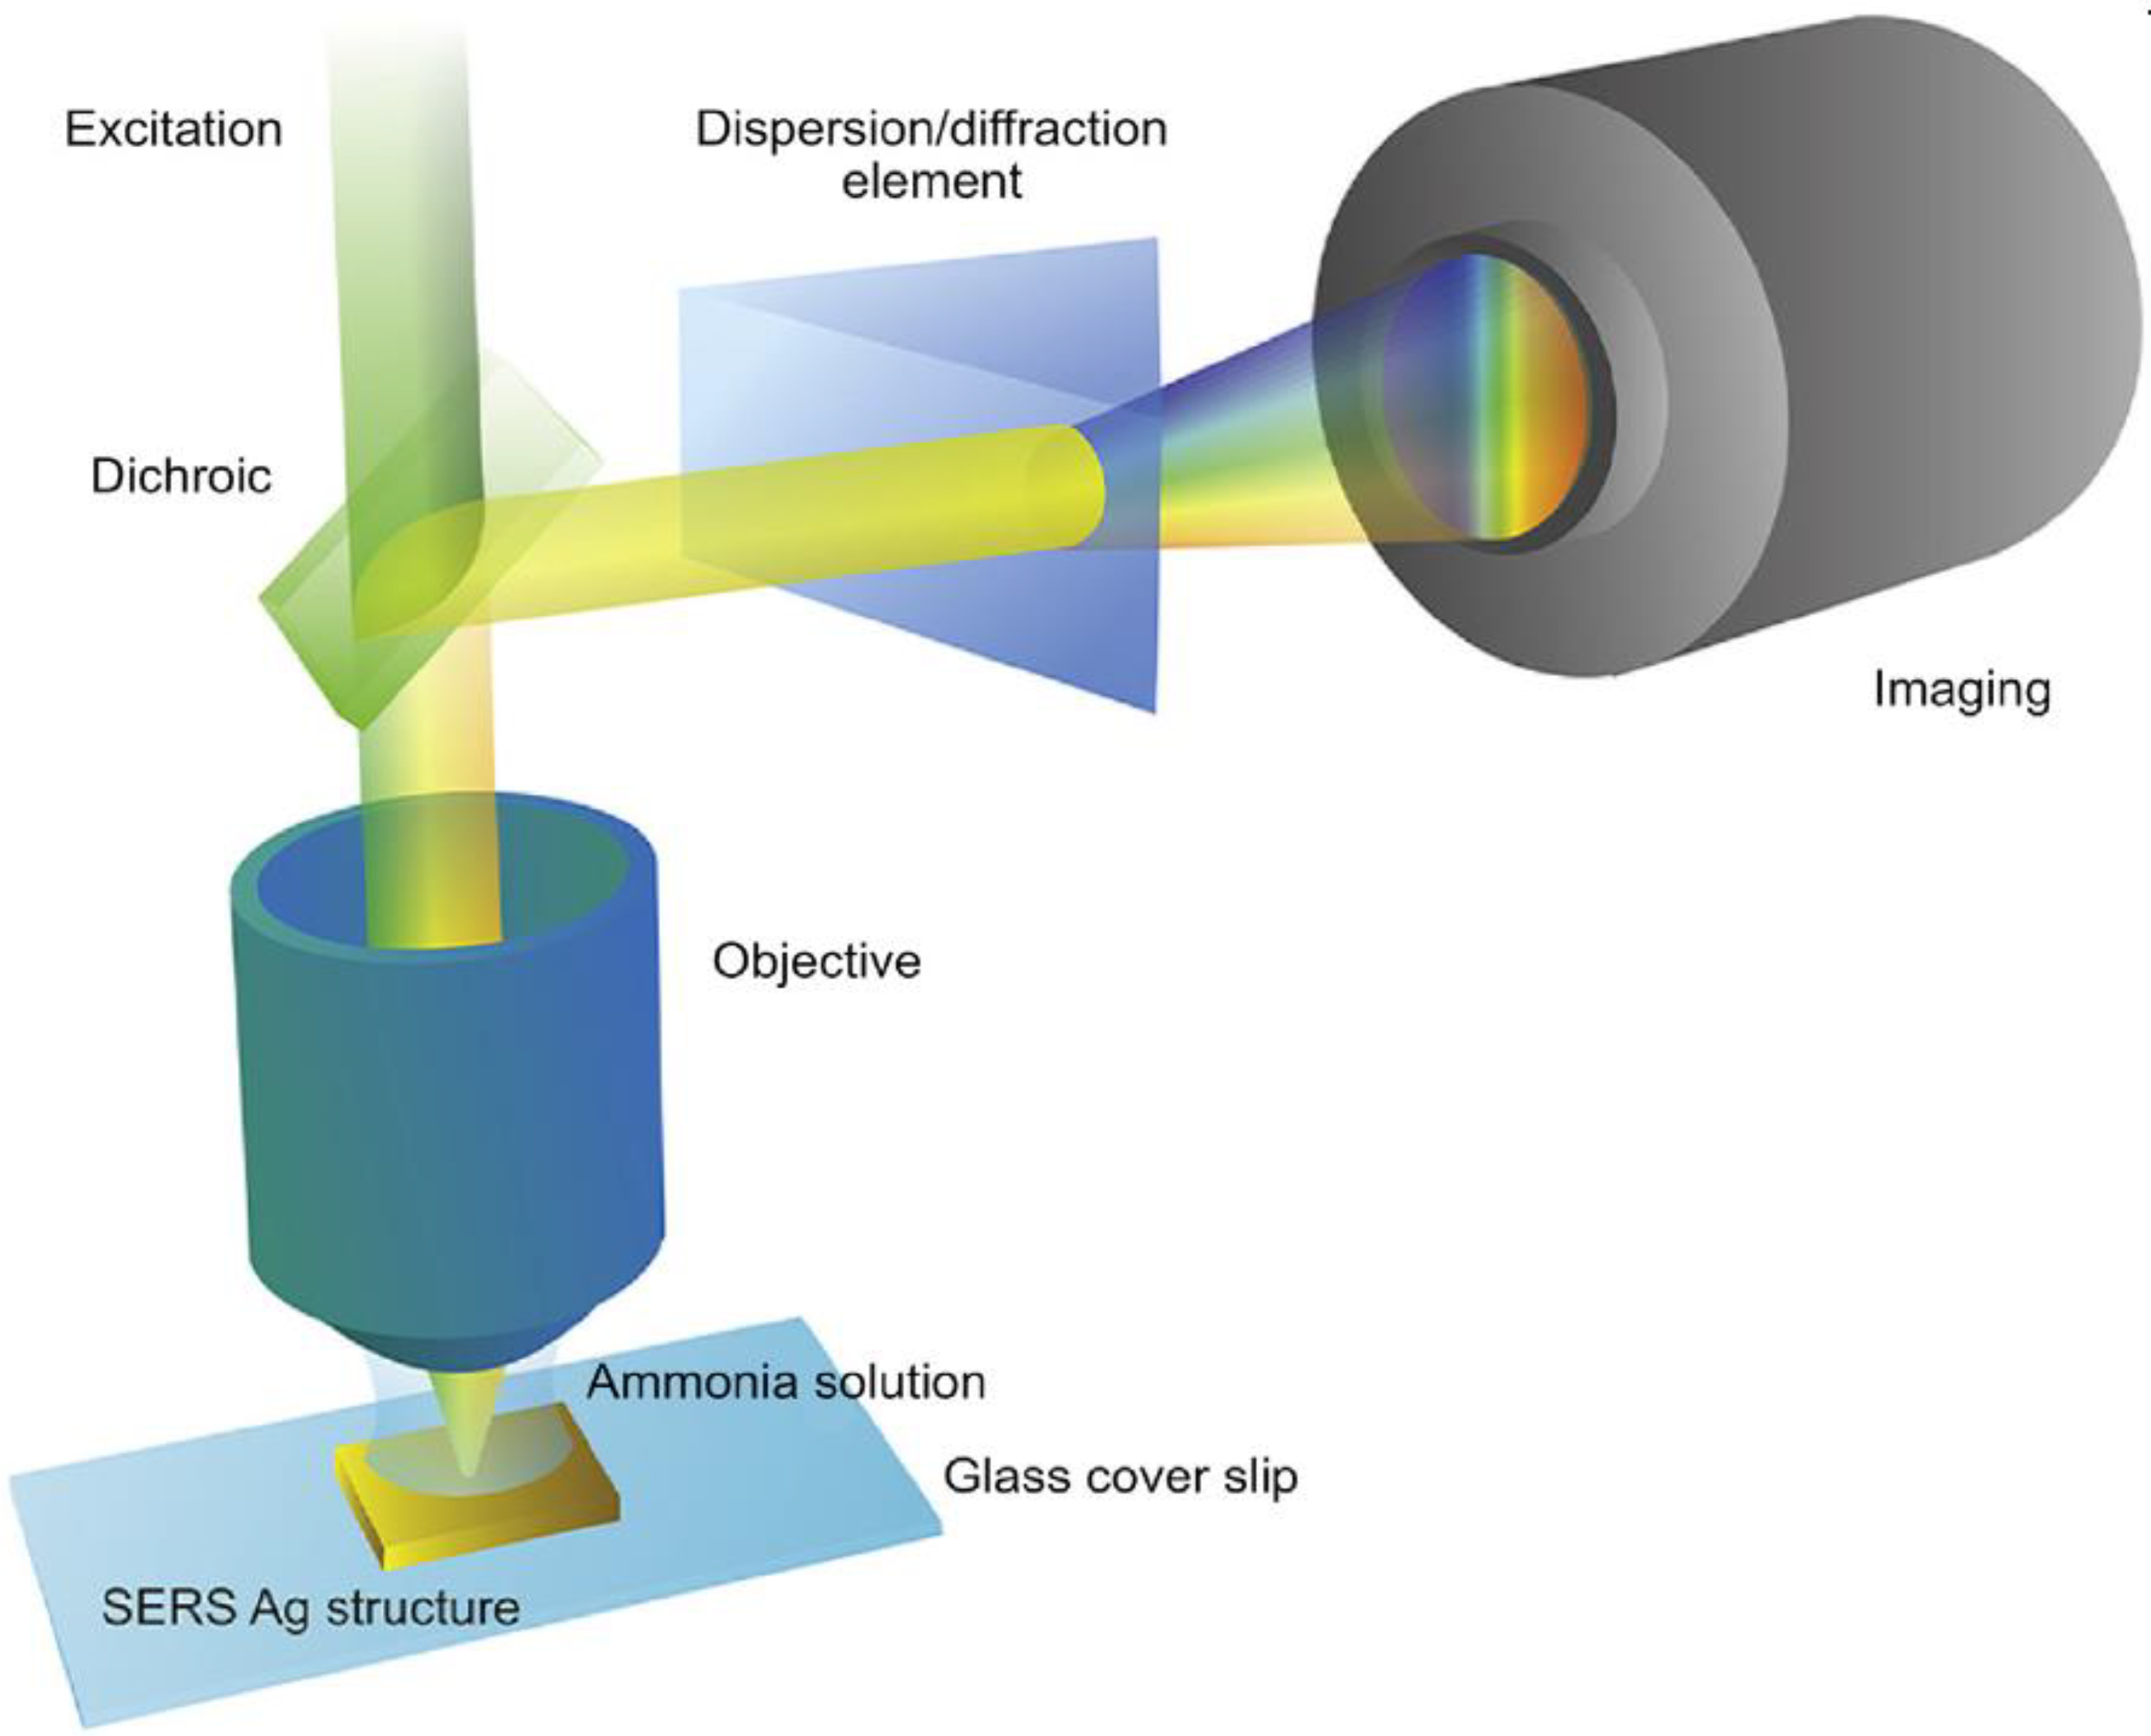
Sensing technologies with the ability to acquire concentration based on specific bands such as Raman and Near Infrared spectroscopy (NIRS) attract significant attention [137]. Among these techniques, Raman spectroscopy demonstrates superior performance enabling easier identification of target peaks with Raman spectroscopy compared to the NIRS technique, but affected by long collection time [138,139]. Thanks to the immense rise in the electromagnetic (EM) near field of plasmonic nanostructures upon light excitation, a way is opened to the popularity of surface-enhanced Raman scattering (SERS) capable of both ultrahigh detection sensitivity (signal-molecule detection) and high specificity due to its promising SERS fingerprint capability [138,140,141]. In other words, the weak Raman signals are enhanced in the case of SERS, giving rise to better detection sensitivity and specificity. However, the development of a SERS sensor is significantly hindered due to the poor reproducibility of most SERS substrates due to the complex nature of their synthesis procedure. Recently, simple, fast, sensitive, and selective detection of ammonia has been reported using a simple SERS designed system (Figure 13) [142]. The SERS experiment was conducted using a commercially available SERS substrate comprising of leaning silicon nanopillars covered with silver and another SERS substrate based on silver (Ag) ink. The method allows ultrasensitive detection of sub-1 ppm ammonia concentrations with a short acquisition time of 1~2 s, and more importantly, the device can detect both liquid and gaseous forms of ammonia. Interestingly, the device is capable of even revealing the number of NH3 molecules at the region of interest. However, the long-term utilization of the SERS substrate is hindered by the oxidation of thin Ag film, which was revealed in ink-based substrates in the form of a strong coloration. In addition, an excellent Raman signal has been observed in a substrate based on sandwich-structured mesoporous PPy–Ag (mPPy/Ag), which demonstrated excellent resistive sensitivity toward NH3 with fast response time (7 s), short recovery time (21 s), and practical detection limit reaching up to 200 ppb. The performance was attributed to the synergy between the Ag and PPy along with the unique architecture [143]. The outstanding Raman signal, as well as the resistive sensing performance of the PPy/Ag nanoplates, reveals its potential application as an excellent SERS substrate for the detection of NH3 gas of interest to kidney-related complications. In addition, other SERS sensors investigated for the detection of higher concentrations of NH3 gas are reported [84,144,145,146,147].
More importantly, a reliable selectivity test is required to be conducted against other interfering analytes before the available sensors can be considered as potential monitors for renal (kidney) failure and the endpoint of dialysis.
Table 1. Summary of plasmonic sensors for the detection of ammonia vapour.
MaterialTechnique/CouplerLOD (ppm)Main limitationsReferences
Au/SnO2 filmsSPR/Prism0.500
  • Bulkiness
  • Fair gas generation system
[117]
Ag/Yttria filmsSPR/Grating0.010
  • Background noise
  • Long term drift
  • Selectivity issue
  • Ambient effects
[113]
Au/SnO2-PPY filmsSPR/Prism1.000
  • Bulkiness
  • Fair gas generation system
[115]
Polyethylene filmSPR/Fiber optics0.001
  • Tested only at higher concentrations (>18 ppm)
  • Not linear at concentrations below 180 ppm
  • Long recovery time
[122]
Ag∕SnO2 filmsSPR/Fiber optics0.154
  • Tested only at higher concentrations (10-100 ppm)
  • Non-linearity
  • Decreased sensitivity at higher concentration
[111]
Indium tin oxide (ITO)/bromocresol purple (BCP) filmsSPR/Fiber optics0.175
  • Direct inconsistency between experiment and theory
  • Fair gas generation system
[114]
Au/CSA Doped Polyaniline (PAni) filmsSPR/Prism0.200
  • Long response times
  • Hysteresis effects
[77]
Silver nanoparticles/PVP/PVA hybridLSPR/Fiber optics<1.000
  • Long response and recovery time
  • Absence of carrier gas
[45]
Au/SnO2 filmsSPR/Prism0.500
  • Decreased sensitivity at higher concentration
[110]
Ag ink and Si/AgSERSSub 1 ppm
  • Not suitable for long term usage due to oxidation
[142]

5. Conclusions and Future Outlooks

The effective monitoring and screening of CKD, renal (kidney) failure, and the endpoint of dialysis sessions can be achieved through the analysis of exhaled breath ammonia. However, the concentrations of NH3 in patients suffering from kidney complications are in the order of <1ppm, which requires the deployment of a simple and excellently performing device. Biosensors demonstrate the potential to overcome the invasive and complex nature of blood-based monitoring methods and conventional means of detecting ammonia gas, respectively. This is due to their ability to provide a non-invasive, real-time, simple, sensitive, and specific detection of disease biomarkers. Among biosensors, plasmonic sensors attract greater attention owing to their ultra-sensitivity, single particle/molecular level detection capability, multiplexing capability, photostability, naked-eye readability, and the ease of miniaturization without sophisticated sensor chip fabrication and instrumentation.
In this review article, the potential application of plasmonic biosensors for the monitoring and screening of kidney disease-related challenges based on the detection of NH3 gas has been explored. First, the principle of the plasmonic biosensors was described. The essential performance characteristics of plasmonic sensors were also summarized and related to the detection of NH3 gas relevant to kidney compilations. Then, plasmonic sensors including SPR, LSPR, and SERS sensors for the detection of NH3 gas down to 1 ppm, the threshold for the evaluation of kidney failure, were reported. Although numerous investigations on the detection of NH3 are available, only a few explore the detection of NH3 gas down to 1ppm and most fail to provide detail description of essential performance parameters. Additionally, the reported plasmonic detections feature several limitations such as bulk/complex detection system, poor selectivity, long response and recovery times, poor gas control system, non-linearity, hysteresis effect, and saturation, among others. More alarmingly, in addition to the failure to account for the essential performance parameters, the studies rarely consider the humidified nature of exhaled breath NH3 (detection of NH3 vapour with moisture level approaching that of exhaled breath), which hinders their applicability for the management of kidney-related issues/complications. In summary, it could be concluded that plasmonic sensors have great potential as future means of overcoming and mitigating kidney-related issues. However, future researchers need to put maximum effort to address issues related to the improvement of limits of detection, sensitivity, specificity, linearity, portability/miniaturization, and optical response optimization, among others. Certainly, these could be accomplished shortly with determination and appropriate selection of novel sensing layer materials, as well as the deployment of novel plasmonic sensing strategies.

Author Contributions

Conceptualization, F.U. and K.H.G.; methodology, F.U.; validation, K.H.G., R.J. and J.O.D.; investigation, F.U. and O.A.A.; resources, K.H.G. and R.M.; writing—original draft preparation, F.U.; writing—review and editing, R.J., A.A., K.H.G. and J.O.D.; visualization, R.M., K.H.I. and N.H.J.; supervision, K.H.G.; project administration, K.H.G., N.H.J. and O.A.A.; funding acquisition, O.A.A. and K.H.I. All authors have read and agreed to the published version of the manuscript.

Funding

This research was funded by Deanship of Scientific Research at Imam Mohammad Ibn Saud Islamic University (IMSIU) through Research Partnership Program no. RP-21-09-43 and the APC was funded by MDPI.

Institutional Review Board Statement

Not applicable.

Informed Consent Statement

Not applicable.

Data Availability Statement

Not applicable.

Acknowledgments

The authors extend their appreciation to the Deanship of Scientific Research at Imam Mohammad Ibn Saud Islamic University (IMSIU) for funding and supporting this work through Research Partnership Program no. RP-21-09-43. The authors would also like to thank the Centre for Advanced Industrial Technology, Universiti Pahang Malaysia for the provision of the research environment and all the required technical support.

Conflicts of Interest

The authors declare no conflict of interest.

References

  1. Luyckx, V.A.; Tonelli, M.; Stanifer, J.W. The global burden of kidney disease and the sustainable development goals. Bull. World Health Organ. 2018, 96, 414–422C. [Google Scholar] [CrossRef] [PubMed]
  2. Nasri, H. World Kidney Day 2014; Chronic Kidney Disease and Aging: A Global Health Alert. Iran. J. Public Health 2014, 43, 126–127. [Google Scholar] [PubMed]
  3. Tamadon, M.R.; Zahmatkesh, M. World kidney day 2015. J. Parathyr. Dis. 2015, 3, 34–36. [Google Scholar]
  4. Piccoli, G.B.; Alrukhaimi, M.; Liu, Z.-H.; Zakharova, E.; Levin, A. World Kidney Day Steering Committee Women and kidney disease: Reflections on World Kidney Day 2018. Clin. Kidney J. 2018, 11, 7–11. [Google Scholar] [CrossRef]
  5. Liyanage, T.; Ninomiya, T.; Jha, V.; Neal, B.; Patrice, H.M.; Okpechi, I.; Zhao, M.-H.; Lv, J.; Garg, A.X.; Knight, J.; et al. World-wide access to treatment for end-stage kidney disease: A systematic review. Lancet 2015, 385, 1975–1982. [Google Scholar] [CrossRef] [PubMed]
  6. de Groot, E.F.; de Meij, T.G.; Berkhout, D.J.; van der Schee, M.P.; de Boer, N.K. Flatography: Detection of gastrointestinal diseases by faecal gas analysis. World J. Gastrointest Pharm. Ther. 2015, 6, 111–113. [Google Scholar] [CrossRef] [PubMed]
  7. Risby, T.H.; Solga, S.F. Current status of clinical breath analysis. Appl. Phys. B 2006, 85, 421–426. [Google Scholar] [CrossRef]
  8. Black, D.A.K. Diagnosis in Renal Disease. Br. Med. J. 1970, 2, 315–318. [Google Scholar] [CrossRef] [PubMed]
  9. Sesso, R.; Belasco, A.G. Late diagnosis of chronic renal failure and mortality on maintenance dialysis. Nephrol. Dial. Transplant. 1996, 11, 2417–2420. [Google Scholar] [CrossRef]
  10. Hibbard, T.; Killard, A.J. Breath ammonia levels in a normal human population study as determined by photoacoustic laser spectroscopy. J. Breath Res. 2011, 5, 037101. [Google Scholar] [CrossRef]
  11. Tan, S.Y.; Hu, M. Medicine in Stamps Antoine-Laurent Lavoisier (1743–1794): Founder of modern chemistry. Singap. Med. J. 2004, 45, 303–304. [Google Scholar]
  12. Ettre, L.S. The Invention, Development and Triumph of the Flame Ionization Detector. LCGC N. Am. 2002, 20, 48–56. [Google Scholar]
  13. Wang, Z.; Wang, C. Is breath acetone a biomarker of diabetes? A historical review on breath acetone measurements. J. Breath Res. 2013, 7, 037109. [Google Scholar] [CrossRef] [Green Version]
  14. Minh, T.D.C.; Blake, D.R.; Galassetti, P.R. The Clinical Potential of Exhaled Breath Analysis For Diabetes Mellitus. Diabetes Res. Clin. Pract. 2012, 97, 195–205. [Google Scholar] [CrossRef] [PubMed]
  15. Thati, A.; Biswas, A.; Chowdhury, S.R.; Sau, T.K. Breath Acetone-Based Non-Invasive Detection of Blood Glucose Levels. Int. J. Smart Sens. Intell. Syst. 2015, 8, 1244–1260. [Google Scholar] [CrossRef]
  16. Wlodzimirow, K.; Abu-Hanna, A.; Schultz, M.; Maas, M.; Bos, L.; Sterk, P.; Knobel, H.; Soers, R.; Chamuleau, R.A. Exhaled breath analysis with electronic nose technology for detection of acute liver failure in rats. Biosens. Bioelectron. 2013, 53, 129–134. [Google Scholar] [CrossRef]
  17. Weiner, I.D.; Mitch, W.E.; Sands, J.M. Urea and Ammonia Metabolism and the Control of Renal Nitrogen Excretion. Clin. J. Am. Soc. Nephrol. 2014, 10, 1444–1458. [Google Scholar] [CrossRef]
  18. Narasimhan, L.R.; Goodman, W.; Patel, C.K.N. Correlation of breath ammonia with blood urea nitrogen and creatinine during hemodialysis. Proc. Natl. Acad. Sci. USA 2001, 98, 4617–4621. [Google Scholar] [CrossRef]
  19. Davies, S.; Spanel, P.; Smith, D. Quantitative analysis of ammonia on the breath of patients in end-stage renal failure. Kidney Int. 1997, 52, 223–228. [Google Scholar] [CrossRef]
  20. Di Natale, C.; Paolesse, R.; Martinelli, E.; Capuano, R. Solid-state gas sensors for breath analysis: A review. Anal. Chim. Acta 2014, 824, 1–17. [Google Scholar] [CrossRef]
  21. Hibbard, T.; Killard, A.J. Breath ammonia analysis: Clinical application and measurement. Crit. Rev. Anal. Chem. 2011, 41, 21–35. [Google Scholar] [CrossRef]
  22. Ruzsanyi, V.; Baumbach, J.I.; Sielemann, S.; Litterst, P.; Westhoff, M.; Freitag, L. Detection of human metabolites using multi-capillary columns coupled to ion mobility spectrometers. J. Chromatogr. A 2005, 1084, 145–151. [Google Scholar] [CrossRef] [PubMed]
  23. Liu, X.; Cheng, S.; Liu, H.; Hu, S.; Zhang, D.; Ning, H. A Survey on Gas Sensing Technology. Senors 2012, 12, 9635–9665. [Google Scholar] [CrossRef] [Green Version]
  24. Brackmann, C.; Hole, O.; Zhou, B.; Li, Z.S.; Aldén, M. Characterization of ammonia two-photon laser-induced fluorescence for gas-phase diagnostics. Appl. Phys. B 2014, 115, 25–33. [Google Scholar] [CrossRef]
  25. Karlsson, M. Characterization of Absorption Spectra of Molecular Constituents in the Mid-Infrared Region and their Role as Potential Markers for Breath Analysis. Bachelor’s Thesis, Umeå University, Umeå, Sweden, 2014. [Google Scholar]
  26. Liu, M.C.; Dai, C.L.; Chan, C.H.; Wu, C.C. Manufacture of a Polyaniline Nanofiber Ammonia Sensor Integrated with a Readout Circuit Using the CMOS-MEMS Technique. Sensors 2009, 9, 869–880. [Google Scholar] [CrossRef]
  27. Gardon, M.; Guilemany, J.M. A review on fabrication, sensing mechanisms and performance of metal oxide gas sensors. J. Mater. Sci. Mater. Electron. 2013, 24, 1410–1421. [Google Scholar] [CrossRef]
  28. Dinh, N.N. Conducting Polymers Incorporated with Related Graphene Compound Films for Use for Humidity and NH3 Gas Sensing. 2019. Available online: https://www.intechopen.com/chapters/63128 (accessed on 20 September 2022).
  29. Janata, J.; Josowicz, M. Conducting polymers in electronic chemical sensors. Nat. Mater. 2003, 2, 19–24. [Google Scholar] [CrossRef]
  30. Bai, H.; Shi, G. Gas sensors based on conducting polymers. Sensors 2007, 7, 267–307. [Google Scholar] [CrossRef]
  31. Patois, T.; Sanchez, J.-B.; Berger, F.; Fievet, P.; Segut, O.; Moutarlier, V.; Bouvet, M.; Lakard, B. Elaboration of ammonia gas sensors based on electrodeposited polypyrrole—Cobalt phthalocyanine hybrid films. Talanta 2013, 117, 45–54. [Google Scholar] [CrossRef]
  32. Cathcart, N.; Chen, J.I. Sensing biomarkers with plasmonics. Anal. Chem. 2020, 92, 7373–7381. [Google Scholar] [CrossRef]
  33. Qiao, X.; Su, B.; Liu, C.; Song, Q.; Luo, D.; Mo, G.; Wang, T. Selective Surface Enhanced Raman Scattering for Quantitative Detection of Lung Cancer Biomarkers in Superparticle@MOF Structure. Adv. Mater. 2017, 30, 1702275. [Google Scholar] [CrossRef] [PubMed]
  34. Zhang, Y.; Yang, D.; Weng, L.; Wang, L. Early lung cancer diagnosis by biosensors. Int. J. Mol. Sci. 2013, 14, 15479–15509. [Google Scholar] [CrossRef] [PubMed]
  35. Wang, Y.; Zhu, X.; Wu, M.; Xia, N.; Wang, J.; Zhou, F. Simultaneous and Label-Free Determination of Wild-Type and Mutant p53 at a Single Surface Plasmon Resonance Chip Preimmobilized with Consensus DNA and Monoclonal Antibody. Anal. Chem. 2009, 81, 8441–8446. [Google Scholar] [CrossRef] [PubMed]
  36. Kajikawa, K. Sensing Based on Localized Surface Plasmon Resonance in Metallic Nanoparticles. In Nanoparticle Technology Handbook; Elsevier: Amsterdam, The Netherlands, 2018; pp. 631–633. [Google Scholar]
  37. Shrivastav, A.M.; Cvelbar, U.; Abdulhalim, I. A comprehensive review on plasmonic-based biosensors used in viral diagnostics. Commun. Biol. 2021, 4, 70. [Google Scholar] [CrossRef] [PubMed]
  38. Langer, J.; de Aberasturi, D.J.; Aizpurua, J.; Alvarez-Puebla, R.; Auguié, B.; Baumberg, J.; Bazan, G.; Bell, S.; Boisen, A.; Brolo, A. Present and future of surface-enhanced Raman scattering. ACS Nano 2019, 14, 28–117. [Google Scholar] [CrossRef]
  39. Usman, F.; Dennis, J.O.; Aljameel, A.; Ali, M.; Aldaghri, O.; Ibnaouf, K.; Zango, Z.U.; Beygisangchin, M.; Alsadig, A.; Meriaudeau, F. Plasmonic Biosensors for the Detection of Lung Cancer Biomarkers: A Review. Chemosensors 2021, 9, 326. [Google Scholar] [CrossRef]
  40. Soler, M.; Lechuga, L.M. Principles, technologies, and applications of plasmonic biosensors. J. Appl. Phys. 2021, 129, 111102. [Google Scholar] [CrossRef]
  41. Santos, J.L.; Farahi, F. Handbook of Optical Sensors; CRC Press: Boca Raton, FL, USA, 2014. [Google Scholar]
  42. Available online: https://www.physik.huberlin.de/de/nano/lehre/Gastvorlesung%20Wien/plasmonics (accessed on 5 January 2023).
  43. Gupta, B.D.; Pathak, A.; Semwal, V. Carbon-Based Nanomaterials for Plasmonic Sensors: A Review. Sensors 2019, 19, 3536. [Google Scholar] [CrossRef]
  44. Yao, Y.; Yi, B.; Xiao, J.; Li, Z. Surface plasmon resonance biosensors and its application. In Proceedings of the 2007 1st International Conference on Bioinformatics and Biomedical Engineering 2007, Wuhan, China, 6–8 July 2007; pp. 1043–1046. [Google Scholar]
  45. Raj, D.R.; Prasanth, S.; Vineeshkumar, T.; Sudarsanakumar, C. Ammonia sensing properties of tapered plastic optical fiber coated with silver nanoparticles/PVP/PVA hybrid. Opt. Commun. 2015, 340, 86–92. [Google Scholar] [CrossRef]
  46. Gupta, B.D.; Verma, R.K. Surface plasmon resonance-based fiber optic sensors: Principle, probe designs, and some applications. Sensors 2009, 2009, 979761. [Google Scholar] [CrossRef]
  47. Kooyman, R.P. Physics of surface plasmon resonance. In Handbook of Surface Plasmon Resonance, 2nd ed.; Schasfoort, R.B.M., Ed.; Royal Society of Chemistry: Cambridge, UK, 2008; pp. 15–34. [Google Scholar]
  48. Masson, J.-F. Surface Plasmon Resonance Clinical Biosensors for Medical Diagnostics. ACS Sens. 2017, 2, 16–30. [Google Scholar] [CrossRef] [PubMed]
  49. Rahman, M.; Anower, M.; Rahman, M.; Hasan, M.; Hossain, M.; Haque, M. Modeling of a highly sensitive MoS2-Graphene hybrid based fiber optic SPR biosensor for sensing DNA hybridization. Optik 2017, 140, 989–997. [Google Scholar] [CrossRef]
  50. Kanso, M.; Cuenot, S.; Louarn, G. Sensitivity of Optical Fiber Sensor Based on Surface Plasmon Resonance: Modeling and Experiments. Plasmonics 2008, 3, 49–57. [Google Scholar] [CrossRef]
  51. Zhou, J.; Wang, Y.; Zhang, L.; Li, X. Plasmonic biosensing based on non-noble-metal materials. Chin. Chem. Lett. 2018, 29, 54–60. [Google Scholar] [CrossRef]
  52. Lopez, G.A.; Estevez, M.-C.; Soler, M.; Lechuga, L.M. Recent advances in nanoplasmonic biosensors: Applications and lab-on-a-chip integration. Nanophotonics 2016, 6, 123–136. [Google Scholar] [CrossRef]
  53. Naqvi, S.M.Z.A.; Zhang, Y.; Ahmed, S.; Abdulraheem, M.I.; Hu, J.; Tahir, M.N.; Raghavan, V. Applied surface enhanced Raman Spectroscopy in plant hormones detection, annexation of advanced technologies: A review. Talanta 2022, 236, 122823. [Google Scholar] [CrossRef]
  54. Gahlaut, S.K.; Pathak, A.; Gupta, B.D. Recent Advances in Silver Nanostructured Substrates for Plasmonic Sensors. Biosensors 2022, 12, 713. [Google Scholar] [CrossRef]
  55. Hamza, M.; Othman, M.; Swillam, M. Plasmonic Biosensors. Biology 2022, 11, 621. [Google Scholar] [CrossRef]
  56. Ferhan, A.R.; Jackman, J.A.; Park, J.H.; Cho, N.-J.; Kim, D.-H. Nanoplasmonic sensors for detecting circulating cancer biomarkers. Adv. Drug Deliv. Rev. 2018, 125, 48–77. [Google Scholar] [CrossRef]
  57. Yang, B.; Jin, S.; Guo, S.; Park, Y.; Chen, L.; Zhao, B.; Jung, Y.M. Recent Development of SERS Technology: Semiconductor-Based Study. ACS Omega 2019, 4, 20101–20108. [Google Scholar] [CrossRef]
  58. Yin, Y.; Li, C.; Yan, Y.; Xiong, W.; Ren, J.; Luo, W. MoS2-Based Substrates for Surface-Enhanced Raman Scattering: Fundamentals. Prog. Perspect. 2022, 12, 360. [Google Scholar]
  59. Guo, J.; Liu, Y.; Ju, H.; Lu, G. From lab to field: Surface-enhanced Raman scattering-based sensing strategies for on-site analysis. TrAC Trends Anal. Chem. 2021, 146, 116488. [Google Scholar] [CrossRef]
  60. Wei, H.; Abtahi, S.M.H.; Vikesland, P.J. Plasmonic colorimetric and SERS sensors for environmental analysis. Environ. Sci. Nano 2015, 2, 120–135. [Google Scholar] [CrossRef]
  61. Prabowo, B.A.; Purwidyantri, A.; Liu, K.-C. Surface Plasmon Resonance Optical Sensor: A Review on Light Source Technology. Biosensors 2018, 8, 80. [Google Scholar] [CrossRef] [Green Version]
  62. Singh, G.P.; Sardana, N. Smartphone-based Surface Plasmon Resonance Sensors: A Review. Plasmonics 2022, 17, 1869–1888. [Google Scholar] [CrossRef]
  63. Taghipour, A.; Heidarzadeh, H. Design and Analysis of Highly Sensitive LSPR-Based Metal–Insulator–Metal Nano-Discs as a Biosensor for Fast Detection of SARS-CoV-2. Photonics 2022, 9, 542. [Google Scholar] [CrossRef]
  64. Das, G.M.; Managò, S.; Mangini, M.; De Luca, A.C. Biosensing Using SERS Active Gold Nanostructures. Nanomaterials 2021, 11, 2679. [Google Scholar] [CrossRef]
  65. Olavarría-Fullerton, J.; Velez, R.A.; Wells, S.; Sepaniak, M.J.; Hernández-Rivera, S.P.; De Jesús, M.A. Design and Characterization of Hybrid Morphology Nanoarrays as Plasmonic Raman Probes for Antimicrobial Detection. Appl. Spectrosc. 2013, 67, 1315–1322. [Google Scholar] [CrossRef]
  66. Usman, F.; Dennis, J.O.; Seong, K.C.; Ahmed, A.Y.; Ferrell, T.L.; Fen, Y.W.; Sadrolhosseini, A.R.; Ayodele, O.B.; Meriaudeau, F.; Saidu, A. Enhanced Sensitivity of Surface Plasmon Resonance Biosensor Functionalized with Doped Polyaniline Composites for the Detection of Low-Concentration Acetone Vapour. J. Sens. 2019, 2019, 5786105. [Google Scholar] [CrossRef]
  67. Alharbi, R.; Irannejad, M.; Yavuz, M. A Short Review on the Role of the Metal-Graphene Hybrid Nanostructure in Promoting the Localized Surface Plasmon Resonance Sensor Performance. Sensors 2019, 19, 862. [Google Scholar] [CrossRef]
  68. Nurrohman, D.T.; Chiu, N.-F. Surface plasmon resonance biosensor performance analysis on 2D material based on graphene and transition metal dichalcogenides. ECS J. Solid State Sci. Technol. 2020, 9, 115023. [Google Scholar] [CrossRef]
  69. Daniyal, W.M.E.M.M.; Fen, Y.W.; Abdullah, J.; Sadrolhosseini, A.R.; Saleviter, S.; Omar, N.A.S. Exploration of surface plasmon resonance for sensing copper ion based on nanocrystalline cellulose-modified thin film. Opt. Express 2018, 26, 34880–34893. [Google Scholar] [CrossRef]
  70. Byun, K.-M. Development of Nanostructured Plasmonic Substrates for Enhanced Optical Biosensing. J. Opt. Soc. Korea 2010, 14, 65–76. [Google Scholar] [CrossRef]
  71. Unser, S.; Bruzas, I.; He, J.; Sagle, L. Localized Surface Plasmon Resonance Biosensing: Current Challenges and Approaches. Sensors 2015, 15, 15684–15716. [Google Scholar] [CrossRef] [PubMed]
  72. Špačková, B.; Lynn, J.N.S.; Slabý, J.; Šípová, H.; Homola, J. A Route to Superior Performance of a Nanoplasmonic Biosensor: Consideration of Both Photonic and Mass Transport Aspects. ACS Photonics 2018, 5, 1019–1025. [Google Scholar] [CrossRef]
  73. Areizaga-Martinez, H.I.; Kravchenko, I.; Lavrik, N.; Sepaniak, M.J.; Hernández-Rivera, S.P.; De Jesús, M.A. Performance Characteristics of Bio-Inspired Metal Nanostructures as Surface-Enhanced Raman Scattered (SERS) Substrates. Appl. Spectrosc. 2016, 70, 1432–1445. [Google Scholar] [CrossRef]
  74. Spackova, B.; Wrobel, P.; Bockova, M.; Homola, J. Optical Biosensors Based on Plasmonic Nanostructures: A Review. Proc. IEEE. 2016, 104, 2380–2408. [Google Scholar] [CrossRef]
  75. Sharma, S.K.; Kumar, P.; Barthwal, S.; Sharma, S.; Sharma, A. Highly Sensitive Surface-Enhanced Raman Scattering (SERS)- Based Multi Gas Sensor: Au Nanoparticles Decorated on Partially Embedded 2D Colloidal Crystals into Elastomer. Chemistryselect 2017, 2, 6961–6969. [Google Scholar] [CrossRef]
  76. Banerji, S.; Peng, W.; Kim, Y.-C.; Menegazzo, N.; Booksh, K.S. Evaluation of polymer coatings for ammonia vapor sensing with surface plasmon resonance spectroscopy. Sens. Actuators B Chem. 2010, 147, 255–262. [Google Scholar] [CrossRef]
  77. Menegazzo, N.; Herbert, B.; Banerji, S.; Booksh, K.S. Discourse on the utilization of polyaniline coatings for surface plasmon resonance sensing of ammonia vapor. Talanta 2011, 85, 1369–1375. [Google Scholar] [CrossRef] [PubMed]
  78. Mishra, S.K.; Tripathi, S.N.; Choudhary, V.; Gupta, B.D. SPR based fibre optic ammonia gas sensor utilizing nanocomposite film of PMMA/reduced graphene oxide prepared by in situ polymerization. Sens. Actuators B Chem. 2014, 199, 190–200. [Google Scholar] [CrossRef]
  79. Beffara, F.; Humbert, G.; Auguste, J.-L.; Perumal, J.; Dinish, U.S.; Olivo, M. Optimization and performance analysis of SERS-active suspended core photonic crystal fibers. Opt. Express 2020, 28, 23609. [Google Scholar] [CrossRef] [PubMed]
  80. Andrade, G.F.; Fan, M.; Brolo, A.G. Multilayer silver nanoparticles-modified optical fiber tip for high performance SERS remote sensing. Biosens. Bioelectron. 2010, 25, 2270–2275. [Google Scholar] [CrossRef]
  81. Wang, K.; Sun, D.-W.; Pu, H.; Wei, Q.; Huang, L. Stable, Flexible, and High-Performance SERS Chip Enabled by a Ternary Film-Packaged Plasmonic Nanoparticle Array. ACS Appl. Mater. Interfaces 2019, 11, 29177–29186. [Google Scholar] [CrossRef]
  82. Jia, P. Plasmonic Optical Sensors: Performance Analysis and Engineering Towards Biosensing; The University of Western Ontario: London, ON, Canada, 2014. [Google Scholar]
  83. Usman, F.; Dennis, J.; Mkawi, E.; Al-Hadeethi, Y.; Meriaudeau, F.; Ferrell, T.; Aldaghri, O.; Sulieman, A. Investigation of Acetone Vapour Sensing Properties of a Ternary Composite of Doped Polyaniline, Reduced Graphene Oxide and Chitosan Using Surface Plasmon Resonance Biosensor. Polymers 2020, 12, 2750. [Google Scholar] [CrossRef] [PubMed]
  84. Zhao, J.; Lin, J.; Wei, H.; Li, X.; Zhang, W.; Zhao, G.; Bu, J.; Chen, Y. Surface enhanced Raman scattering substrates based on titanium nitride nanorods. Opt. Mater. 2015, 47, 219–224. [Google Scholar] [CrossRef]
  85. Kim, N.-H.; Choi, M.; Kim, T.W.; Choi, W.; Park, S.Y.; Byun, K.M. Sensitivity and Stability Enhancement of Surface Plasmon Resonance Biosensors based on a Large-Area Ag/MoS2 Substrate. Sensors 2019, 19, 1894. [Google Scholar] [CrossRef] [PubMed]
  86. Zhang, F.; Martin, J.; Plain, J. Long-term stability of plasmonic resonances sustained by evaporated aluminum nanostructures. Opt. Mater. Express 2018, 9, 85–94. [Google Scholar] [CrossRef]
  87. Luan, J.; Xu, T.; Cashin, J.; Morrissey, J.J.; Kharasch, E.D.; Singamaneni, S. Environmental Stability of Plasmonic Biosensors Based on Natural versus Artificial Antibody. Anal. Chem. 2018, 90, 7880–7887. [Google Scholar] [CrossRef]
  88. Karunakaran, C.; Rajkumar, R.; Bhargava, K. Introduction to biosensors. In Biosensors and Bioelectronics; Elsevier: Amsterdam, The Netherlands, 2015; pp. 1–68. [Google Scholar]
  89. Fu, Y.; Xin, M.; Chong, J.; Li, R.; Huang, M. Plasmonic gold nanostars@ZIF-8 nanocomposite for the ultrasensitive detection of gaseous formaldehyde. J. Mater. Sci. 2020, 56, 4151–4160. [Google Scholar] [CrossRef]
  90. Janaki, V.; Oh, B.-T.; Vijayaraghavan, K.; Kim, J.-W.; Kim, S.A.; Ramasamy, A.; Kamala-Kannan, S. Application of bacterial extracellular polysaccharides/polyaniline composite for the treatment of Remazol effluent. Carbohydr. Polym. 2012, 88, 1002–1008. [Google Scholar] [CrossRef]
  91. Huang, W.; MacDiarmid, A. Optical properties of polyaniline. Polymer 1993, 34, 1833–1845. [Google Scholar] [CrossRef]
  92. Borah, R.; Banerjee, S.; Kumar, A. Surface functionalization effects on structural, conformational, and optical properties of polyaniline nanofibers. Synth. Met. 2014, 197, 225–232. [Google Scholar] [CrossRef]
  93. Fratoddi, I.; Venditti, I.; Cametti, C.; Russo, M.V. Chemiresistive polyaniline-based gas sensors: A mini review. Sens. Actuators B Chem. 2015, 220, 534–548. [Google Scholar] [CrossRef]
  94. Qiu, S.; Chen, C.; Zheng, W.; Li, W.; Zhao, H.; Wang, L. Long-term corrosion protection of mild steel by epoxy coating containing self-doped polyaniline nanofiber. Synth. Met. 2017, 229, 39–46. [Google Scholar] [CrossRef]
  95. Kohl, M.; Kalendová, A. Effect of polyaniline salts on the mechanical and corrosion properties of organic protective coatings. Prog. Org. Coat. 2015, 86, 96–107. [Google Scholar] [CrossRef]
  96. Kumar, L.; Rawal, I.; Kaur, A.; Annapoorni, S. Flexible room temperature ammonia sensor based on polyaniline. Sens. Actuators B Chem. 2017, 240, 408–416. [Google Scholar] [CrossRef]
  97. Zhang, K.; Luo, J.; Yu, N.; Gu, M.; Sun, X. Synthesis and excellent electromagnetic absorption properties of reduced graphene oxide/PANI/BaNd0.2Sm0.2Fe11.6O19 nanocomposites. J. Alloys Compd. 2018, 779, 270–279. [Google Scholar] [CrossRef]
  98. Usman, F.; Dennis, J.O.; Seong, K.C.; Ahmed, A.Y.; Meriaudeau, F.; Ayodele, O.B.; Tobi, A.R.; Rabih, A.A.S.; Yar, A. Synthesis and characterisation of a ternary composite of polyaniline, reduced graphene-oxide and chitosan with reduced optical band gap and stable aqueous dispersibility. Results Phys. 2019, 15, 102690. [Google Scholar] [CrossRef]
  99. Wang, Q.; Dong, X.; Pang, Z.; Du, Y.; Xia, X.; Wei, Q.; Huang, F. Ammonia Sensing Behaviors of TiO2-PANI/PA6 Composite Nanofibers. Sensors 2012, 12, 17046–17057. [Google Scholar] [CrossRef]
  100. Tai, H.; Jiang, Y.; Xie, G.; Yu, J.; Chen, X. Fabrication and gas sensitivity of polyaniline–titanium dioxide nanocomposite thin film. Sens. Actuators B Chem. 2007, 125, 644–650. [Google Scholar] [CrossRef]
  101. He, L.; Jia, Y.; Meng, F.; Li, M.; Liu, J. Gas sensors for ammonia detection based on polyaniline-coated multi-wall carbon nanotubes. Mater. Sci. Eng. B 2009, 163, 76–81. [Google Scholar] [CrossRef]
  102. Šetka, M.; Drbohlavová, J.; Hubálek, J. Nanostructured Polypyrrole-Based Ammonia and Volatile Organic Compound Sensors. Sensors 2017, 17, 562. [Google Scholar] [CrossRef]
  103. Zhang, D.; Wu, Z.; Zong, X.; Zhang, Y. Fabrication of polypyrrole/Zn2SnO4 nanofilm for ultra-highly sensitive ammonia sensing application. Sens. Actuators B Chem. 2018, 274, 575–586. [Google Scholar] [CrossRef]
  104. Wang, L.; Jiang, R. Investigation on the Ammonia Sensitivity Mechanism of Conducting Polymer Polypyrroles Using In-Situ FT-IR. Mater. Sci. Appl. 2019, 10, 497. [Google Scholar]
  105. Malkeshi, H.; Moghaddam, H.M. Ammonia gas-sensing based on polythiophene film prepared through electrophoretic deposition method. J. Polym. Res. 2016, 23, 108. [Google Scholar] [CrossRef]
  106. Korent, A.; Žagar Soderžnik, K.; Šturm, S.; Žužek Rožman, K.; Redon, N.; Wojkiewicz, J.L.; Duc, C. Facile Fabrication of an Ammonia-Gas Sensor Using Electrochemically Synthesised Polyaniline on Commercial Screen-Printed Three-Electrode Systems. Sensors 2020, 21, 169. [Google Scholar] [CrossRef]
  107. Shankar, P.; Rayappan, J.B.B. Gas sensing mechanism of metal oxides: The role of ambient atmosphere, type of semiconductor and gases-A review. Sci. Lett. J. 2015, 4, 126. [Google Scholar]
  108. Van Hieu, N.; Thuy, L.; Chien, N. Highly sensitive thin film NH3 gas sensor operating at room temperature based on SnO2/MWCNTs composite. Sens. Actuators B Chem. 2008, 129, 888–895. [Google Scholar] [CrossRef]
  109. Mishra, S.K.; Kumari, D.; Gupta, B.D. Surface plasmon resonance based fiber optic ammonia gas sensor using ITO and polyaniline. Sens. Actuators B Chem. 2012, 171–172, 976–983. [Google Scholar] [CrossRef]
  110. Paliwal, A.; Sharma, A.; Tomar, M.; Gupta, V. Surface plasmon resonance study on the optical sensing properties of tin oxide (SnO2) films to NH3 gas. J. Appl. Phys. 2016, 119, 164502. [Google Scholar] [CrossRef]
  111. Pathak, A.; Mishra, S.K.; Gupta, B.D. Fiber-optic ammonia sensor using Ag/SnO2 thin films: Optimization of thickness of SnO2 film using electric field distribution and reaction factor. Appl. Opt. 2015, 54, 8712–8721. [Google Scholar] [CrossRef] [PubMed]
  112. Lefferts, M.J.; Castell, M.R. Ammonia breath analysis. Sens. Diagn. 2022, 1, 955–967. [Google Scholar] [CrossRef]
  113. Challener, W.; Ollmann, R.; Kam, K. A surface plasmon resonance gas sensor in acompact disc’format. Sens. Actuators B Chem. 1999, 56, 254–258. [Google Scholar] [CrossRef]
  114. Mishra, S.K.; Bhardwaj, S.; Gupta, B.D. Surface Plasmon Resonance-Based Fiber Optic Sensor for the Detection of Low Concentrations of Ammonia Gas. IEEE Sens. J. 2014, 15, 1235–1239. [Google Scholar] [CrossRef]
  115. Gahlot, A.; Paliwal, A.; Kapoor, A. The Exploitation of SnO2/Polypyrrole Interface for the Sensing of Ammonia Vapors Using SPR Technique: A Theoretical and Experimental Analysis. 2022. Available online: https://assets.researchsquare.com/files/rs-1428599/v1/329cb39d-a2d4-4203-996a-c090080084e5.pdf?c=1647523774 (accessed on 23 September 2022).
  116. Shinbo, K.; Komai, R.; Honda, H.; Ohdaira, Y.; Baba, A.; Kato, K.; Kaneko, F. Ammonia Gas Detection under Various Humidity Conditions Using Waveguide Surface Plasmon Resonance Spectroscopy. Anal. Sci. 2017, 33, 443–447. [Google Scholar] [CrossRef] [Green Version]
  117. Paliwal, A.; Sharma, A.; Tomar, M.; Gupta, V. Dielectric Properties of SnO2 Thin Film Using SPR Technique for Gas Sensing Applications. Conf. Pap. Sci. 2014, 2014, 656120. [Google Scholar] [CrossRef]
  118. Bhatia, P.; Gupta, B.D. Surface plasmon resonance based fiber optic ammonia sensor utilizing bromocresol purple. Plasmonics 2013, 8, 779–784. [Google Scholar] [CrossRef]
  119. Mishra, S.K.; Tripathi, S.; Choudhary, V.; Gupta, B.D. Fiber optic ammonia gas sensor utilizing surface plasmon resonance of reduced graphene oxide. In Proceedings of the JSAP-OSA Joint Symposia 2013, Kyoto Japan, 16–20 September 2013. [Google Scholar] [CrossRef]
  120. Zhao, Y.; Zhang, S.; Wen, G.; Han, Z. Optical fiber gas sensor based on graphene nanometer functional materials. Instrum. Sci. Technol. 2018, 46, 12–27. [Google Scholar] [CrossRef]
  121. Komai, R.; Honda, H.; Baba, A.; Shinbo, K.; Kato, K.; Kaneko, F. Simultaneous detection of ammonia and water vapors using surface plasmon resonance waveguide sensor. In Proceedings of the 2014 International Symposium on Electrical Insulating Materials, Niigata City, Japan, 1–5 June 2014; pp. 284–286. [Google Scholar]
  122. Jin, Z.; Su, Y.; Duan, Y. Development of a polyaniline-based optical ammonia sensor. Sens. Actuators B Chem. 2001, 72, 75–79. [Google Scholar] [CrossRef]
  123. Mohtajeb, M.; Abdi, Y. Localized Surface Plasmon Resonance of Reduced Graphene Oxide/Ag Hybrid for Gas Sensing Application. IEEE Sens. J. 2018, 18, 9222–9229. [Google Scholar] [CrossRef]
  124. Pandey, S.; Goswami, G.K.; Nanda, K.K. Green synthesis of biopolymer–silver nanoparticle nanocomposite: An optical sensor for ammonia detection. Int. J. Biol. Macromol. 2012, 51, 583–589. [Google Scholar] [CrossRef] [PubMed]
  125. Pastoriza-Santos, I.; Kinnear, C.; Pérez-Juste, J.; Mulvaney, P.; Liz-Marzán, L. Plasmonic polymer nanocomposites. Nat. Rev. Mater. 2018, 3, 375–391. [Google Scholar] [CrossRef]
  126. Detsri, E.; Popanyasak, J. Fabrication of silver nanoparticles/polyaniline composite thin films using layer-by-layer self-assembly technique for ammonia sensing. Colloids Surf. A: Physicochem. Eng. Asp. 2015, 467, 57–65. [Google Scholar] [CrossRef]
  127. Jarmoshti, J.A.; Nikfarjam, A.; Hajghassem, H.; Banihashemian, S.M. Visible light enhancement of ammonia detection using silver nanoparticles decorated on reduced graphene oxide. Mater. Res. Express 2019, 6, 066306. [Google Scholar] [CrossRef]
  128. Qiu, Z.; Xue, Y.; Li, J.; Zhang, Y.; Liang, X.; Wen, C.; Gong, H.; Zeng, J. Highly sensitive colorimetric detection of NH3 based on Au@ Ag@ AgCl core-shell nanoparticles. Chin. Chem. Lett. 2021, 32, 2807–2811. [Google Scholar] [CrossRef]
  129. Amirjani, A.; Fatmehsari, D.H. Colorimetric detection of ammonia using smartphones based on localized surface plasmon resonance of silver nanoparticles. Talanta 2018, 176, 242–246. [Google Scholar] [CrossRef]
  130. Pande, S.A. Green Synthesis of Biopolymer-Silver Nanocomposites for Gas Sensing. Adv. Sci. Technol. 2016, 99, 54–60. [Google Scholar] [CrossRef]
  131. Nengsih, S.; Umar, A.; Salleh, M.; Yahaya, M. Detection of volatile organic compound gas using localized surface plasmon resonance of gold nanoparticles. Sains Malays. 2011, 40, 231–235. [Google Scholar]
  132. Tomer, A.K.; Rahi, T.; Neelam, D.K.; Dadheech, P.K. Cyanobacterial extract-mediated synthesis of silver nanoparticles and their application in ammonia sensing. Int. Microbiol. 2018, 22, 49–58. [Google Scholar] [CrossRef]
  133. Mishra, S.K.; Prasood, U.S.; Gupta, B.D. Fiber Optic LSPR Gas Sensor utilizing ZnO nanoparticles for ammonia sensing. In Proceedings of the International Conference on Fibre Optics and Photonics, Kharagpur, India, 13–16 December 2014. [Google Scholar]
  134. Dubas, S.T.; Pimpan, V. Green synthesis of silver nanoparticles for ammonia sensing. Talanta 2008, 76, 29–33. [Google Scholar] [CrossRef]
  135. Prabhash, P.; Haritha, V.; Nair, S.S.; Pilankatta, R. Localized surface plasmon resonance based highly sensitive room temperature pH sensor for detection and quantification of ammonia. Sens. Actuators B Chem. 2017, 240, 580–585. [Google Scholar] [CrossRef]
  136. Tabassum, S.; Kumar, R.; Dong, L. Plasmonic Crystal-Based Gas Sensor Toward an Optical Nose Design. IEEE Sens. J. 2017, 17, 6210–6223. [Google Scholar] [CrossRef]
  137. Yadav, J.; Rani, A.; Singh, V.; Murari, B.M. Prospects and limitations of non-invasive blood glucose monitoring using near-infrared spectroscopy. Biomed. Signal Process. Control. 2015, 18, 214–227. [Google Scholar] [CrossRef]
  138. Yu, Z.; Jiang, N.; Kazarian, S.; Tasoglu, S.; Yetisen, A. Optical sensors for continuous glucose monitoring. Prog. Biomed. Eng. 2021, 3, 022004. [Google Scholar] [CrossRef]
  139. Jang, S.; Xu, C. Review of Emerging Approaches in Non-Or Minimally Invasive Glucose Monitoring and Their Application to Physiological Human Body Fluids. 2018. Available online: https://academicworks.cuny.edu/ny_pubs/423/ (accessed on 22 September 2022).
  140. Wang, Y.; Zhao, C.; Wang, J.; Luo, X.; Xie, L.; Zhan, S.; Kim, J.; Wang, X.; Liu, X.; Ying, Y. Wearable plasmonic-metasurface sensor for noninvasive and universal molecular fingerprint detection on biointerfaces. Sci. Adv. 2021, 7, eabe4553. [Google Scholar] [CrossRef]
  141. Xu, K.; Zhou, R.; Takei, K.; Hong, M. Toward flexible surface-enhanced Raman scattering (SERS) sensors for point-of-care diagnostics. Adv. Sci. 2019, 6, 1900925. [Google Scholar] [CrossRef]
  142. Liu, Y.; Asset, T.; Chen, Y.; Murphy, E.; Potma, E.O.; Matanovic, I.; Fishman, D.A.; Atanassov, P. Facile All-Optical Method for In Situ Detection of Low Amounts of Ammonia. Iscience 2020, 23, 101757. [Google Scholar] [CrossRef]
  143. Wei, F.; Zhong, Y.; Luo, H.; Wu, Y.; Fu, J.; He, Q.; Cheng, J.; Na, J.; Yamauchi, Y.; Liu, S. Soft template-mediated coupling construction of sandwiched mesoporous PPy/Ag nanoplates for rapid and selective NH3 sensing. J. Mater. Chem. A 2021, 9, 8308–8316. [Google Scholar] [CrossRef]
  144. Kasztelan, M.; Słoniewska, A.; Gorzkowski, M.; Lewera, A.; Pałys, B.; Zoladek, S. Ammonia modified graphene oxide—Gold nanoparticles composite as a substrate for surface enhanced Raman spectroscopy. Appl. Surf. Sci. 2021, 554, 149060. [Google Scholar] [CrossRef]
  145. Kumar, P.; Soni, M.; Arora, T.; Sharma, S. 2D Colloidal Crystals Based SERS Sensors for NH3 Detection. In Proceedings of the 2015 IEEE International Symposium on Nanoelectronic and Information Systems, Indore, India, 21–23 December 2015; pp. 277–280. [Google Scholar]
  146. Kwon, S.; Kim, C.; Kim, K.; Jung, H.; Kang, H. Effect of Ag NPs-decorated carbon nanowalls with integrated Ni-Cr alloy microheater for sensing ammonia and nitrogen dioxide gas. J. Alloys Compd. 2023, 932, 167551. [Google Scholar] [CrossRef]
  147. Vijayarangamuthu, K.; Rath, S. Nanoparticle size, oxidation state, and sensing response of tin oxide nanopowders using Raman spectroscopy. J. Alloys Compd. 2014, 610, 706–712. [Google Scholar] [CrossRef]
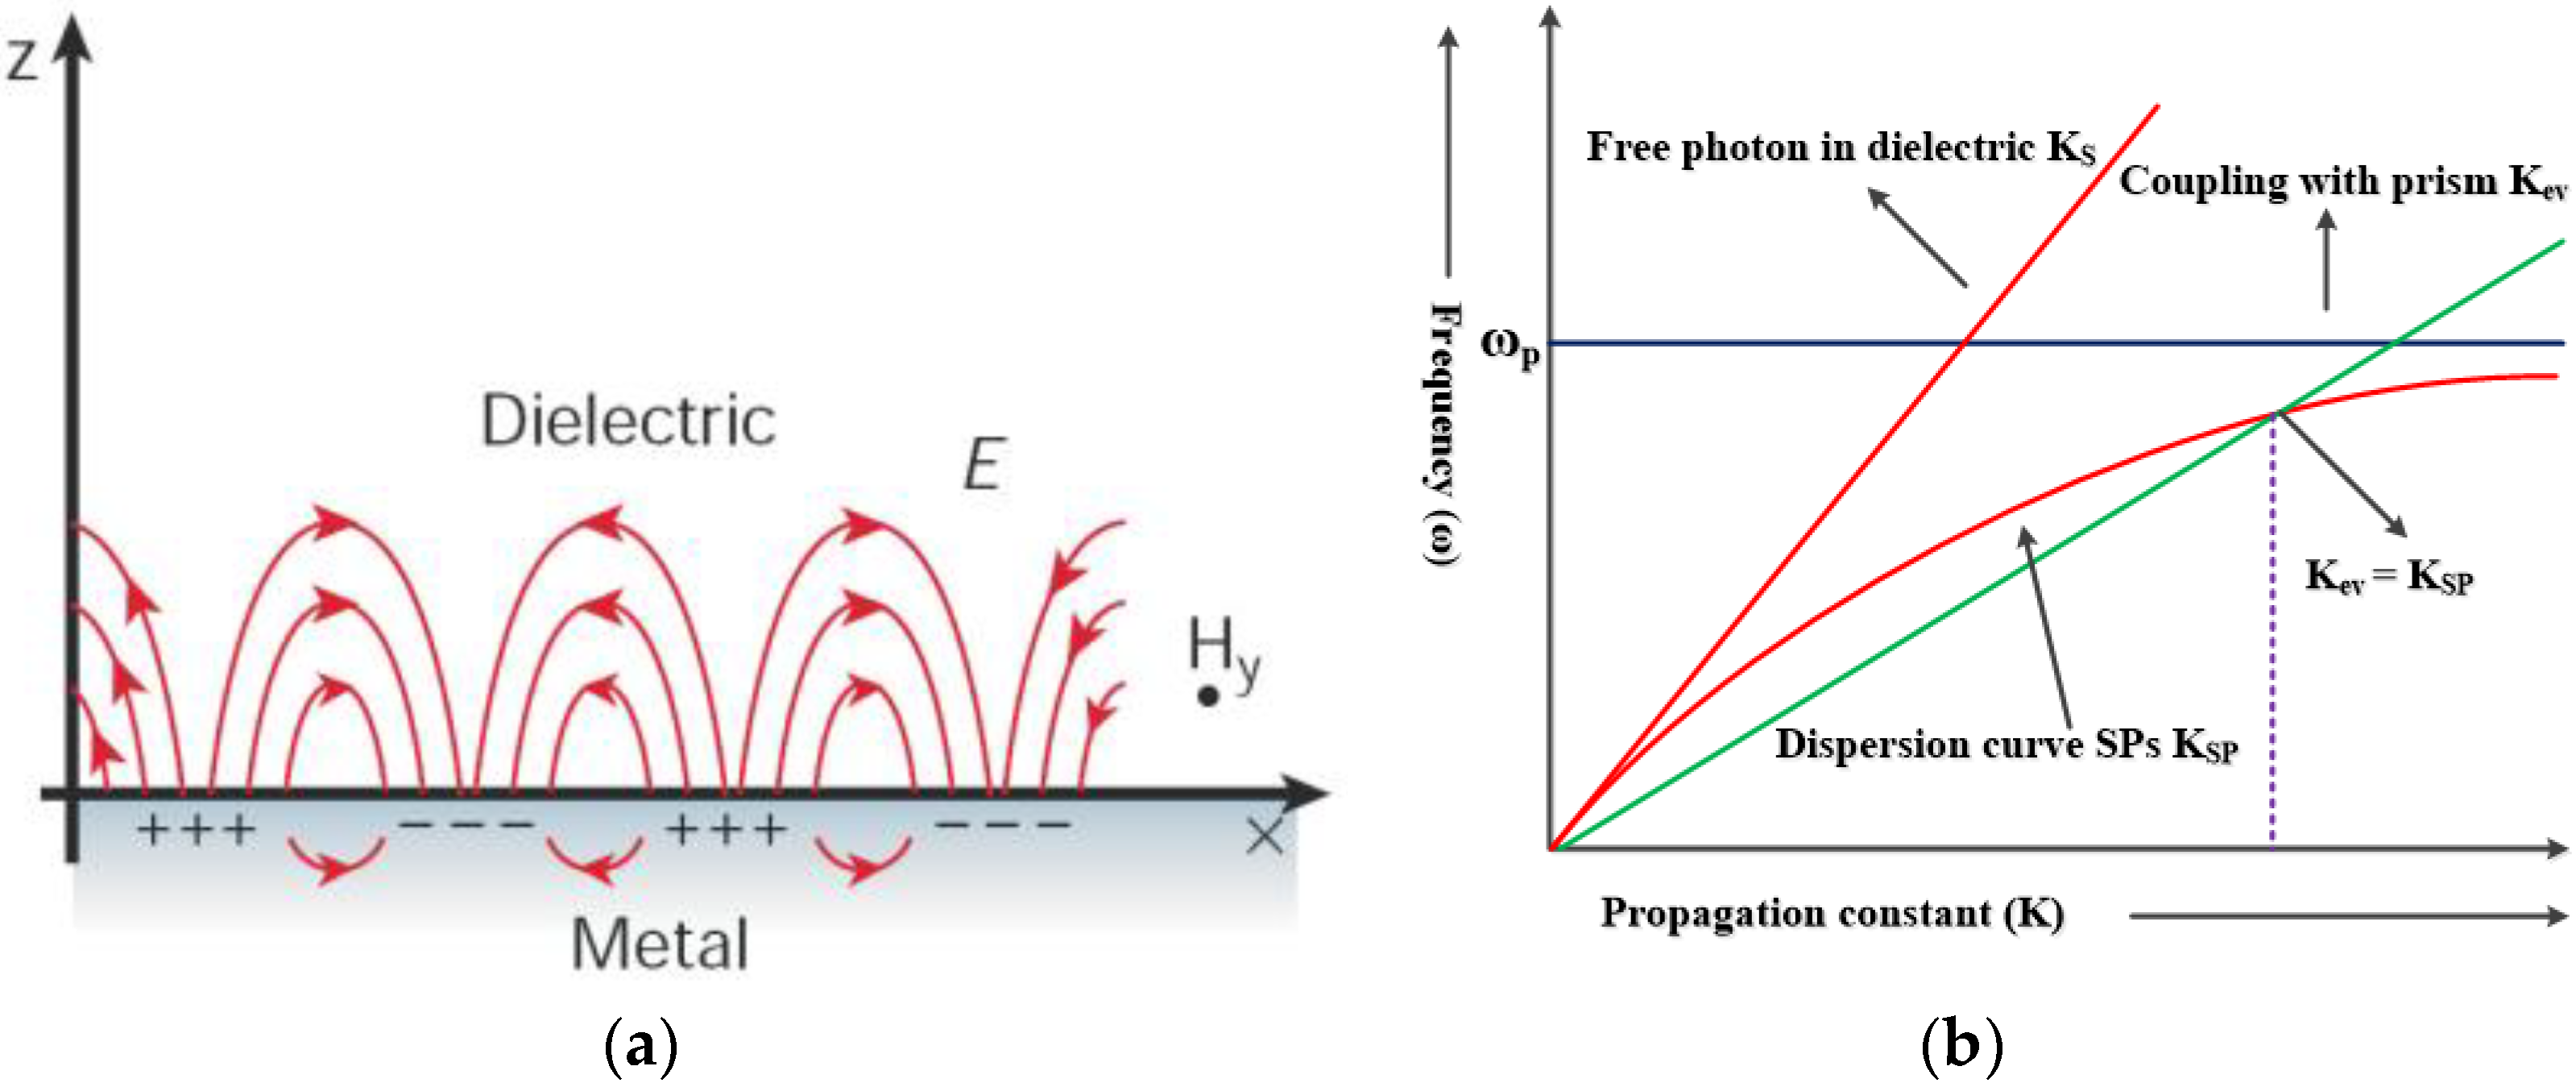
Figure 1. (a) Electric field lines and charge distributions associated with a surface plasmon traveling on a metal–dielectric interface [42]; (b) dispersion curves of light in free space and the surface plasmon [39,43].
Chemosensors 11 00119 g001
Figure 2. The excitation of SPR using prism couplers. Figure adapted from [39].
Chemosensors 11 00119 g002
Figure 3. (a) Sketch diagram of a typical SPR biosensor system; (b) Components of SPR biosensor system and their functions.
Chemosensors 11 00119 g003aChemosensors 11 00119 g003b
Figure 4. The schematic diagram of a typical portable FO SPR sensor.
Chemosensors 11 00119 g004
Figure 5. Localised surface plasmon resonance (LSPR) due to collective oscillations of delocalised electrons in response to external electric field [39].
Chemosensors 11 00119 g005
Figure 6. LSPR biosensing principle. (A) Biomolecular recognition elements (e.g., antibody) on the surface of metal nanosubstrate (a) recognize and capture analytes (e.g., antigens) present in a liquid sample, (b) producing a local increase in the refractive index at the metal surface. (B) The increase in local refractive index induces a peak-wavelength shift of the extinction spectra. Figure adapted from [51].
Chemosensors 11 00119 g006
Figure 7. Diagrams illustrating nanoplasmonic-based biosensor setups: (a) extinction measurements, (b) dark-field microscopy, and (c) total internal reflection (TIR) microscopy. Figure adapted from [52].
Chemosensors 11 00119 g007
Figure 8. SERS enhancement mechanisms (a) EM: surface plasmon resonance on metal surface; (b) CM: charge transfer between analyte molecules and roughed substrate. Figure adapted from [58].
Chemosensors 11 00119 g008
Figure 9. Schematic of SERS phenomenon for an organic analyte on AuNPs showing highest Raman intensity when the analyte is present in the hotspot. Figure adapted from [60].
Chemosensors 11 00119 g009
Figure 10. The methodology of SPR measurement (a) principle of intensity, angular, and wavelength interrogations. (b) The principle of phase interrogation method for SPR signal acquisition. Figure adapted from [61].
Chemosensors 11 00119 g010
Figure 11. (a) Design of the sensor disk optical system. Reprinted from [113] with permission from Elsevier; (b) (I) Schematic of the SnO2/Polypyrrole based SPR gas sensor; and (II) Kretschmann configuration utilized for ammonia gas detection. Figure adapted from [115].
Chemosensors 11 00119 g011
Figure 12. Schematic representation of the experimental setup of the ammonia sensor. Reprinted from [45], with permission from Elsevier.
Chemosensors 11 00119 g012
Figure 13. Schematic Diagram of NH3 Detection by the Surface-Enhanced Raman Scattering (SERS) Approach Proposed by Liu and Colleagues. Reprinted from [142], with permission from Elsevier.
Chemosensors 11 00119 g013
Disclaimer/Publisher’s Note: The statements, opinions and data contained in all publications are solely those of the individual author(s) and contributor(s) and not of MDPI and/or the editor(s). MDPI and/or the editor(s) disclaim responsibility for any injury to people or property resulting from any ideas, methods, instructions or products referred to in the content.