Abstract
Creatinine is the final metabolic product of creatine in muscles and a widely accepted biomarker for chronic kidney disease. In this work, we present a non-enzymatic sensor based on an electrochemical pretreated screen-printed carbon electrode (PTSPCE) with electrodeposited Cu nanoparticles (CuNPs). To function in a PoC format, the prepared PTSPCE/CuNPs non-enzymatic sensors were used as disposable elements in a portable potentiostat. The pretreatment using mild anodic and cathodic potentials in PBS resulted in an increased electroactive surface area and improved conductivity, confirmed by cyclic voltammetry and electrochemical impedance. Moreover, the detection through the CuNPs–creatinine interaction showed an enhanced performance in the PTSPCE surface compared to the bare electrode. The optimized PTSPCE/CuNPs sensor showed a linear working range from 10 to 160 μM (R2 = 0.995), a sensitivity of 0.2582 μA·μM−1 and an LOD of 0.1 μM. The sensor analytical parameters covered the requirements of creatinine detection in biofluids such as blood and saliva, with a low interference of common biomarkers such as urea, glucose, and uric acid. When evaluated in Fusayama/Meyer artificial saliva, the PTSPCE/CuNPs showed an average recovery rate of 116%. According to the observed results, the non-enzymatic PTSPCE/CuNPs sensor can potentially operate as a creatinine early screening system in PoC format.
1. Introduction
Chronic kidney disease (CKD) is defined as having a kidney abnormality or a decreased kidney function for three months or longer [1]. Since CKD presents a worldwide prevalence between 11 and 13%, early screening is strongly recommended in high-risk groups such as diabetic, hypertensive, and people with a family history of CKD [2,3]. However, the lack of Point of Care (PoC) systems devoted to CKD biomarkers detection poses a challenge for frequent testing and home evaluation [3,4,5]. Creatinine (2-amino-1-methyl-2-imidazoline-4-1) is the final metabolic product of creatine in muscles and a widely accepted biomarker for CKD, as it can be accumulated in the body due to kidney failure [6]. Additionally, serum creatinine concentration is usually the prime information to calculate the filtration glomerular rate, a major clinical indicator of CKD. Serum creatinine in healthy individuals ranges from 60 to 110 μM for men and 45 to 90 μM for women, but levels can be increased up to 10 times as CKD progresses [7]. Creatinine can be found at significant concentrations in non-invasive body fluids such as urine, sweat and saliva, which can be considered as alternative species for analysis [5]. Traditionally, creatinine tests are based on the Jaffe method, which involves the reaction of picric acid with creatinine to generate a red–yellow compound that can be detected spectrophotometrically. However, among the main drawbacks of this method are non-specificity and sensitivity affected by pH and temperature [8].
Clearly, accurately detecting creatinine is of high concern, and the development of tools for a fast evaluation based on chemical sensors in the PoC format is under great demand. Electrochemical biosensing strategies are the most extensively studied and are mainly based on creatinine amidohydrolase (CA) or creatinine deiminase (CD) enzymes [9]. However, these methods usually involve additional enzymes in cascade reactions until an electroactive species suitable for detection is produced at the electrode’s surface. Moreover, the complexity of the immobilization protocol, and the heavy influence of factors such as pH, temperature, ionic strength and enzyme concentration, make the implementation of CA and CD biosensors difficult. Recently, non-enzymatic detection has been exploited as a reliable alternative due to creatinine interaction with metallic centers through the formation of organometallic complexes, including Fe, Ag, Ni, Ti and Cu [7]. In this sense, the efficiency of copper nanoparticles (CuNPs) over carbon electrodes has been explained through the complexation of Cu ions with creatinine, leading to either increased or decreased currents as creatinine concentration is augmented [10,11].
In order to advance non-enzymatic sensing devices into the electrochemical PoC format, some characteristics need to be fulfilled such as integration and miniaturization of the electrochemical cell, minimization of sample consumption, and working in a disposable way [12]. Screen-printed carbon electrodes (SPCE) are large-scale-produced electrochemical transducers suitable for the PoC format, with advantages such as stability, reproducibility, a compact format, and the facility for surface modification [13,14]. With SPCEs as the base transducers, chemical sensors for clinical biomarker detection in the PoC format have been developed, including glucose [15,16,17], uric acid [18,19], dopamine [20,21,22], and immunoglobulin A [23]. To enhance their electrochemical performance, SPCEs can be subjected to an electrochemical pretreatment in order to activate the working surface [24]. This environmentally friendly procedure aims to eliminate binders and additives of the carbon inks that can interfere with electronic transfer [25]. In addition, pretreated screen-printed carbon electrodes (PTSPCE) exhibit new edge exposures created in the carbon microstructure which increase sensitivity and selectivity towards target analytes.
Taking this into consideration, in this work we present the effect of a simple pretreatment over SPCE performance for enhancing creatinine detection. The SPCE was subjected to anodic and cathodic pretreatments prior to Cu electrodeposition, which was optimized according to the registered current for a given creatinine concentration. The obtained materials were characterized by CV, EIS, SEM and EDS prior to creatinine detection with the optimized PTSPCE/CuNPs sensor using a portable potentiostat. The operation in the PoC format of the proposed device was validated in Fusayama/Meyer artificial saliva samples. The results showed that the PTSPCE/CuNPs might be able to efficiently detect creatinine in a useful clinical range, with potential applicability in complex samples, even in the presence of typical interference biomarkers.
2. Materials and Methods
2.1. Reagents
CuSO45H2O (CAS: 7758-99-8), H2SO4 (CAS: 7664-93-9), KH2PO4 (CAS: 7778-77-0), Na2HPO4 (CAS: 7558-79-4), KCl (CAS 7447-40-7), NaCl (CAS: 7647-14-5), creatinine (CAS: 9012-76-4), glucose (CAS: 50-99-7), urea (CAS: 57-13-6), uric acid (CAS: 69-93-2), ascorbic acid (CAS: 50-81-7) and Fusayama/Meyer artificial saliva were purchased from Sigma Aldrich (Toluca, Mexico). The phosphate buffered saline (PBS) solution at 0.1 M used during the electrode pretreatment was prepared using Na2HPO4, KH2PO4, NaCl and KCl with tridistilled water. The phosphate buffer (PB) at 0.1 M was prepared similarly, but without adding the saline solutions; this was used as the electrolyte during electrochemical characterization and creatinine detection. The SPCE model 110 featuring a 4 mm diameter working electrode (WE), a counter electrode (CE) and a pseudoreference Ag electrode was obtained from Metrohm DropSens.
2.2. Equipment
The morphology of the bare SPCE, PTSPCE and PTSPCE/CuNPs was investigated by FESEM using the JSM 7401F microscope (JEOL, Tokyo, Japan). The surface of the SPCE and PTSPCE were analyzed under the next conditions: acceleration voltage 2.0 kV, WD 3.0 mm and magnification of ×1000 and ×25,000. For the PTSPCE/CuNPs, an acceleration voltage of 10.0 kV, WD 7.6 mm and magnification of ×5000 were used. The same equipment was used for the energy dispersive spectroscopy (EDS). The cyclic voltammetry (CV) experiments were performed with the portable EmStat3 Blue potentiostat (Palmsens, Houten, The Netherlands). The electrochemical impedance spectroscopy (EIS) was recorded with the Sensit smart potentiostat (Palmsens, Houten, The Netherlands).
2.3. Electrode Pretreatment with PBS Buffer
The bare SPCE (see Figure 1A) was subjected to a two-step pretreatment with chronoamperometry using a fixed potential at −1 V during 150 s followed by a +1V potential during 150 s in PBS as the electrolyte. Subsequently, the SPCE was treated with CV in a potential window from 0 to 0.8 V at a scan rate of 100 mV/s for 20 cycles. The resulting electrodes were labeled as the PTSPCE, as shown in Figure 1B.
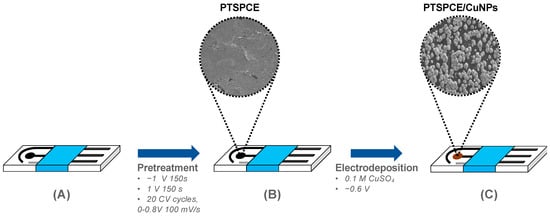
Figure 1.
Schematic representation of creatinine sensor fabrication: (A) bare SPCE; (B) the resulting PTSPCE after pre-treatment conditions in PBS; (C) the final PTSPCE/CuNPs sensor after Cu electrodeposition.
2.4. CuNPs Electrodeposition
After pretreatment, the PTSPCE was used as a template for the Cu electrodeposition using a 0.1 M solution of CuSO45H2O in 0.1 M of H2SO4. Since SPCE sensors are intended for single use, the pretreatment and electrodeposition of the WE were assisted with external reference and CE electrodes. To study the growing CuNPs, a fixed potential of −0.6 V was applied during either 25, 50, 75 or 100 s, resulting in the PTSPCE/CuNPs sensor observed in Figure 1C.
2.5. Electrochemical Characterization
To investigate the electroactive area produced by the pretreatment, the CV was recorded using the redox couple K3[Fe (CN)6]/K4[Fe (CN)6] at 5 mM in 0.1 M PB at different scan rates, in a potential window from −0.2 to 0.8 V. To study the pretreatment effect in conductivity, EIS measurements using a potential of 10 mVrms in a frequency range from 200 kHz to 0.01 Hz were recorded prior to and after the pretreatment using the same redox couple solution.
2.6. Creatinine Detection
Creatinine dilutions from 10 to 160 μM were prepared using a 0.1 M PB buffer at pH 7.4 as the solvent, departing from a 0.1 M creatinine stock solution. CV was used as the quantitative technique using potentials within −1 V to 1 V at a scan rate of 100 mV/s. Each concentration was measured by triplicate.
2.7. Selectivity Evaluation
The effect of common interferences present in biological samples over the PTSPCE/CuNPs sensor response was evaluated in the CV using the same conditions as in the creatinine detection. A creatinine solution at 100 μM was evaluated in the presence of glucose (6 mM), urea (6 mM), ascorbic acid (125 μM) and uric acid (125 μM).
2.8. Real Sample Evaluation
In this study, the complex matrix evaluation was performed using the Fusayama/Meyer artificial saliva with spike concentrations of creatinine. We selected the evaluated creatinine concentration considering the reported salivary range in the literature [26]. Thus, 25 µM is considered a creatinine amount found in healthy individuals, while 50 and 100 µM exceed the normal expected value and can be potentially related to kidney malfunction [5].
3. Results
3.1. Effect of SPCE Pretreatment
To study the repercussions of the electrochemical pretreatment over the SPCE surface, the morphology of the WE was observed in FESEM. Originally, the top view of the SPCE amplified at ×1000 showed a flat surface with minimal roughness (Figure 2A) but a closer view in the highlighted yellow zone revealed a granular composition of the ink at high amplifications of ×25,000 (Figure 2B). The recorded morphology is consistent with that observed for SPCE in literature. After the pretreatment, the surface morphology of the PTSPCE showed a similar microstructure as the SPCE at both amplifications, which is in accordance with the mild morphological variations produced by the applied potentials [24]. However, a pretreatment with these conditions can eliminate binders and additives of the carbon inks that interfere with the electronic transfer during detection. Thus, to study this effect, an electrochemical characterization was conducted in the SPCE and PTSPCE electrodes by CV and EIS using the K3[Fe (CN)6]/K4[Fe (CN)6] redox probe. The CV at a scan rate of 100 mV/s in both electrodes showed well-defined redox peaks with quasi-reversible behavior as shown in Figure 2C. However, an increased anodic and cathodic current is observed in the PTSPCE as well as a decreased ΔEp = 200 mV compared with ΔEp = 360 mV of the bare SPCE. Similarly, when an EIS specter was obtained, the Nyquist plot in Figure 2D showed a dramatic decrease of the semicircle diameter from 2000 Ω for the SPCE to 700 Ω for the PTSPCE. This result was attributed to a reduction in the charge transfer resistance due to the applied electrode surface mild pretreatment. According to the observed electrochemical results, it was concluded that the PBS pretreatment effectively improved the electron transfer rate, decreased the charge/transfer resistance, increased conductivity, and allowed and enhanced oxidation/reduction of the redox probe at the WE surface.
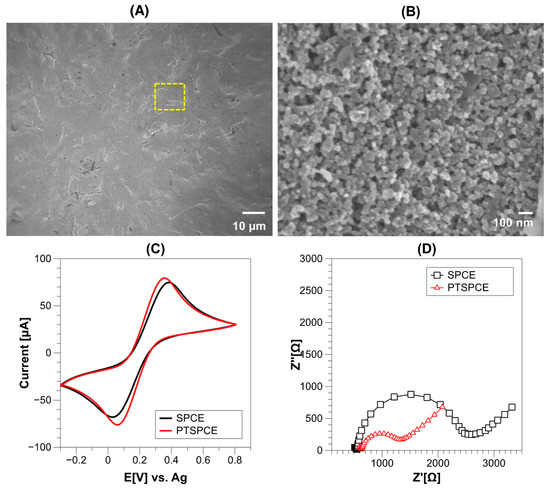
Figure 2.
FESEM characterization of SPCE surface using amplification at ×1000 (A) and a closer view at ×25000 (B); comparison of CV using SPCE and PTSPCE with 5 mM K3[Fe (CN)6]/K4[Fe (CN)6] at 100 mV/s (C); comparison of Nyquist plot of SPCE and PTSPCE with the same ferricyanide redox probe (D).
To corroborate the pretreatment effect on the electroactive surface, we studied the performance of the SPCE and PTSPCE using K3[Fe (CN)6]/K4[Fe (CN)6] at different scan rates from 10 to 100 mV/s. The CV data of Figure 3 show the results for the PTSPCE along with the obtained slopes for anodic and cathodic currents; the corresponding results of the SPCE are presented in Figure S1. The obtained information was subsequently used to calculate the electroactive surface area of both electrodes using the Randles–Sevick equation:
where n is the number of electrons involved in the redox reaction (n = 1), A being the electroactive area (cm2), v the scan rate (Vs−1), D the diffusion coefficient (6.7 × 10⁻⁶ cm2 s−1) and C the molar concentration (mol cm−3) of the ferricyanide/ferrocyanide redox probe. Since A can be calculated from the slope resulting from the Ipa vs. root of scan rate graph, it is possible to calculate the electroactive surface area of the PTSPCE as 0.0642 cm2. Comparing the value of 0.059 cm2 calculated for the SPCE, the 14% increase registered was attributed to the applied electrochemical pretreatment.
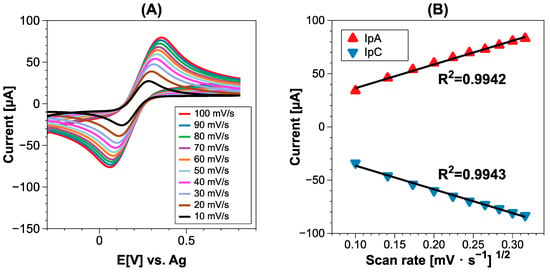
Figure 3.
(A) CV of PTSPCE in K3[Fe (CN)6]/K4[Fe (CN)6] at different scan rates from 10 to 100 mV/s; (B) obtained slopes of anodic and cathodic current vs. root of scan rate.
3.2. CuNPs Electrodeposition
The PTSPCE was used as template for Cu growing through electrodeposition at −0.6 V during either 25, 50, 75 or 100 s. In the Supplementary Figure S2, it is observed that the size and distribution of the CuNPs over the electrode surface were clearly influenced by the applied time. When an electrodeposition time of 25 s was applied, the carbon ink in the background surface prevailed over the CuNPs growing, reducing the potential interaction sites with creatinine. For 50 s of electrodeposition (Figure 4A), Cu nucleation produced structures distributed homogeneously over the WE, while 75 and 100 s produced particles of higher dimensions that can be associated with lower catalytic activity. To study the effect of electrodeposited CuNPs over creatinine detection, the current produced for 100 μM was studied in Figure 4B. It was observed that compared against the CuNPs obtained at 25 s, the structures produced at 50 s increased the registered current almost 46%. If the initial 25 s time is compared with 75 s and 100 s, the increment was almost 33%, and 56%, respectively. Considering the manufacturing time and the obtained currents, an electrodeposition time of 50 s was selected for creatinine detection. Finally, the EDS specter of the PTSPCE/CuNPs was obtained showing the distinctive signals for C and Cu, confirming the presence of these elements in the electrode surface (Figure 4C).
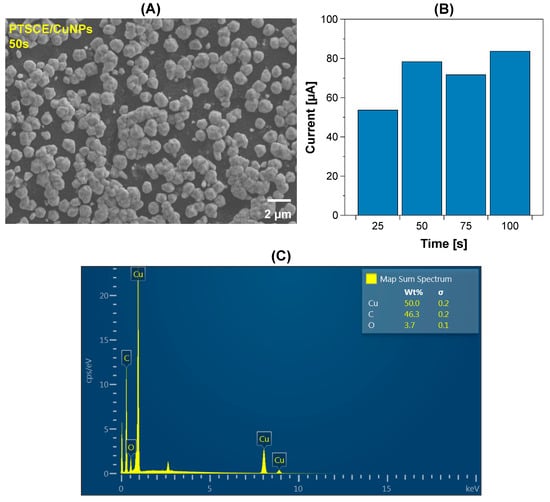
Figure 4.
Characterization of PTSPCE/CuNPs electrodeposited during 50 s observed at ×5000 (A); (B) the current recorded after 100 μM creatinine detection using different Cu electrodeposition conditions; (C) EDS of PTSPCE/CuNPs.
3.3. Creatinine Detection with Optimized PTSPCE/CuNPs
With the optimized PTSPCE/CuNPs, the detection of creatinine was performed using CV in the range of −1 V to 1 V using 0.1 M PB as the electrolyte. Figure 5A shows the comparison between electrodes with electrodeposited Cu during 50 s with and without a pretreatment for creatinine detection of 100 μM. Similarly, the current of both electrodes in 0.1 M PB as blank was registered. The current for the bare SPCE/CuNPs was 24 μA for PB and 47 μA for creatinine, while PTSPCE/CuNPs registered a value of 39 μA for PB and 95 μA for creatinine. The current value was clearly increased in pretreated sensors, as the registered current is approximately double that in bare electrodes. The observed response was directly attributed to the PBS pretreatment; since the electroactive surface area was increased and the conductivity was enhanced for the PTSPCE, it was expected that Cu electrodeposits will find a high number of nucleation sites for growing and consequently, a higher number of sites for creatinine interaction. Moreover, the non-enzymatic detection in both the SPCE/CuNPs and PTSPCE/CuNPs relies on the interaction between creatinine and Cu oxide produced in situ during CV. Figure 5A shows both CV measurements during the transition from Cu0 to CuII at 0.2 V due to a potential scan; the in situ produced CuII interacts with creatinine through N in its aromatic ring forming a Cu II–creatinine complex, which is oxidized on the surface. However, the PTSPCE/CuNPs clearly exceeds the performance of the bare sensor, which directly benefits analytical parameters such as a wide detection range and sensitivity.
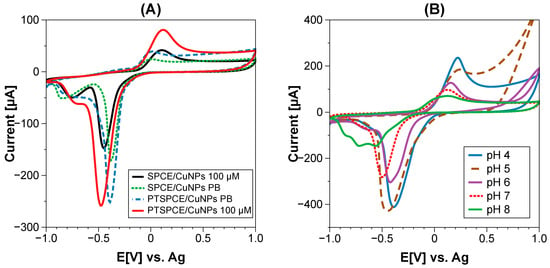
Figure 5.
(A) Comparison between SPCE/CuNPs vs. PTSPCE/CuNPs in 100 μM of creatinine, (B) effect of pH in creatinine detection for PTSPCE/CuNP sensor.
Additionally, we investigated the effect of pH over detection since creatinine is present in biological samples such as saliva, serum, plasma and urine (Figure 5B). These biofluids can range from acidic (saliva), to slightly neutral (serum, plasma) to basic pH (urine). The non-enzymatic PTSPCE/CuNPs sensor evaluated within 100 μM of creatinine performed increasingly better at acidic conditions. Still, the non-enzymatic interaction was observed in every evaluated condition, suggesting the potential application of the sensor in a variety of biofluids.
3.4. Analytical Performance of PTSPCE/CuNPs for Creatinine Detection
Under optimized conditions, CV was used to measure creatinine concentrations in a range from 10 to 160 μM in PB pH 7.4 using the PTSPCE/CuNPs non-enzymatic sensor. Figure 6A shows the data obtained during the creatinine measurements, highlighting the region with an increased oxidation current produced by adding higher creatinine concentrations (Figure 6B). The data were recorded by triplicate to build a calibration curve to correlate the recorded current and creatinine concentration with a linear model using the equation I(μA) = 0.2582 (μM) + 40.95 with R2 = 0.9553 (Figure 6C). With these parameters, it was determined that the PTSPCE/CuNPs sensor exhibited a linear working range from 10 to 169 μM, a sensitivity of 0.2582 μA·μM−1 and a low limit of detection (LOD) of 0.1 μM.
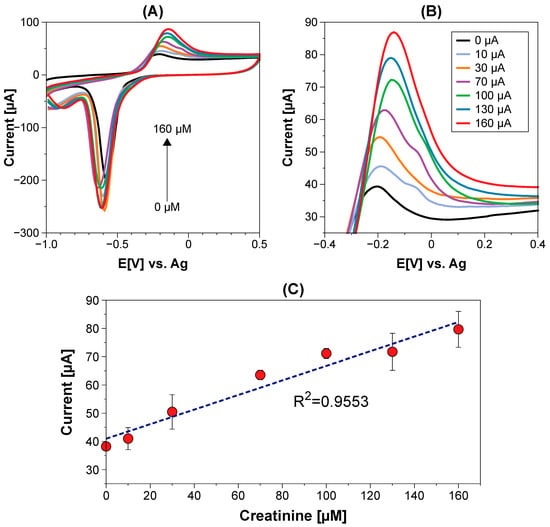
Figure 6.
(A) Recorded CV data for creatinine detection with non-enzymatic PTSPCE/CuNPs sensor in the range from 10 to 160 μM; (B) zoomed detection area of Cu–creatinine complex oxidation; and (C) the associated calibration curve.
According to the described analytical results, the PTSPCE/CuNPs was compared in Table 1 with previous non-enzymatic sensors based on Cu as a sensing material for creatinine detection. For instance, the obtained detection range from 10 to 160 μM was similar to that achieved with carbon nanomaterials applied for an increase to the surface area [27,28] and molecular synthetic layers such as imprinted polymers (MIP) [29]. Although some architectures based on encapsulated NPs [30] and ionic liquid [28] can indeed extend the detection range with a lower LOD, the presented PTSPCE/CuNPs shows a good detection performance with a simple, environmentally friendly, efficient and low-cost method for surface activation. Moreover, the normal concentration range for creatinine in blood was covered with the PTSPCE/CuNPs non-enzymatic sensor and even abnormal ranges up to 140 μM linked to kidney disease can be potentially discriminated [5]. Similarly, considering the detection in non-invasive fluids, salivary creatinine concentration has been reported from 8.8 to 26.5 μM, with concentrations out of this range indicating potential kidney damage [5]. Thus, the developed PTSPCE/CuNPs are suited to meet these requirements and possibly provide information on the creatinine content in salivary biofluids within clinical ranges. Further, all electrodes were prepared as disposable strips and measured with a portable potentiostat, which can effectively be applied as a proof-of-concept system in the PoC format.

Table 1.
Comparison of PTSPCE/CuNPs with previous non-enzymatic sensors based on CuNPs.
3.5. Selectivity of PTSPCE/CuNPs
One crucial concern with non-enzymatic sensors is the selectivity of the inorganic sensing layer against the well-known high selectivity of enzymatic detection. As the non-enzymatic PTSPCE/CuNPs sensor is intended for application in biological samples, we evaluated the potential interferences that common biomarkers and electroactive species can influence over sensor response. We selected glucose (GC), urea (UR), uric acid (UA) and ascorbic acid (AA) for the interference evaluation under the same CV conditions for creatinine (CRT) detection in PB. Figure 7 shows that the PTSPCE/CuNPs recorded current was only inhibited by 10% with GC (6 mM) and UA (125 μM), which potentially could avoid additional pretreatment steps to eliminate the effect of both biomarkers as observed in previous reported sensors [31]. UR (6 mM) and AA (125 μM) only affected the response by 3 and 5%, respectively. However, the high complexity of biological samples such as blood could pose additional challenges for detection; thus, online sample pretreatment stages can be subsequently incorporated in the proposed sensor to maintain the portable, low-cost and in situ operation format.
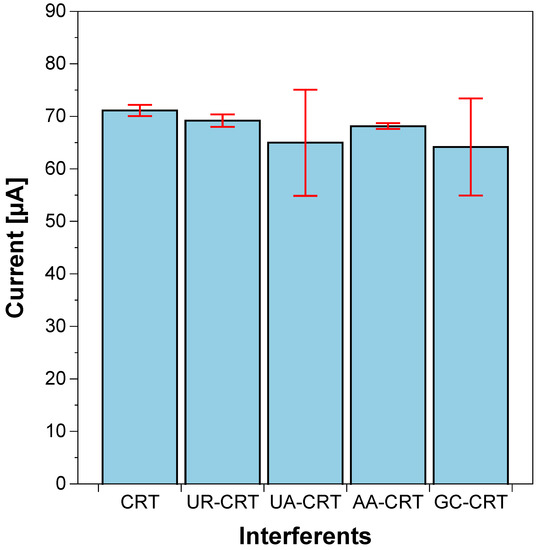
Figure 7.
Selectivity of PTSPCE/CuNPs for creatinine (CRT) detection against urea (UR), uric acid (UA), ascorbic acid (AA) and glucose (GC).
3.6. Recovery in Real Samples
A final assay was proposed to prove the applicability of the PTSPCE/CuNPs in real matrices. Creatinine in Fusayama/Meyer artificial saliva was tested considering a concentration for healthy individuals and two exceeding the normal parameters. Table 2 shows that the average recovery rate was 116%, suggesting the potential utility of the developed non-enzymatic sensor.

Table 2.
Recovery obtained with non-enzymatic PTSPCE/CuNPs in artificial saliva.
4. Conclusions
In this work, we presented a non-enzymatic PTSPCE/CuNPs sensor based on a mild electrochemical pretreatment using PBS. The pretreatment allowed an increase in the electroactive surface area and conductivity of the bare carbon substrate impacting the growth of electrodeposited Cu. The increased number of active sites for creatinine interaction led to a detection range from 10 to 160 μM with an LOD of 0.1 μM. The analytical parameters were similar to that achieved with previous systems based on carbon nanomaterials for surface enhancement but using a simpler, environmentally friendly and low-cost approach. Moreover, the sensor detection range of the PTSPCE/CuNPs covers the requirements for blood and saliva biofluids with a low interference of common biomarkers such as uric acid. All prepared electrodes were prepared and disposed of after measurement with a portable potentiostat. Thus, according to these results, the non-enzymatic PTSPCE/CuNPs showed a promising performance to operate as a disposable sensor in creatinine screening systems in the PoC format.
Supplementary Materials
The following supporting information can be downloaded at: https://www.mdpi.com/article/10.3390/chemosensors11020102/s1, Figure S1: CV of PTSPCE in K3[Fe (CN)6]/K4[Fe (CN)6] at different scan rates from 10 to 100 mV/s for electroactive surface area calculation, Figure S2: SEM images according with electrodeposited time: (a) 25 s, (b) 75 s and (c) 100 s.
Author Contributions
Conceptualization, A.D.-A. and R.B.D.; methodology, A.D.-A. and E.A.Z.-C.; software, A.S.C.-D.; validation, R.B.D., A.S.C.-D. and E.A.Z.-C.; investigation, E.A.Z.-C.; resources, R.B.D.; data curation, A.S.C.-D.; writing—review and editing, R.B.D. and A.S.C.-D.; supervision, R.B.D.; project administration, R.B.D.; funding acquisition, R.B.D. and A.S.C.-D. All authors have read and agreed to the published version of the manuscript.
Funding
This research was funded by CIMAV SC through “Internal Call for Research and Technological Projects 2022”, grant number 24002. The research was also supported by the Consejo Nacional de Ciencia y Tegnología (CONACYT) through the project C-614/2021 “Plataforma para el desarrollo y fabricación de sensores y actuadores inteligentes aplicados en energía, salud, y seguridad–iSensMEX”. We also thank CONACYT for the postdoctoral fellowship granted to Alain Salvador Conejo-Dávila (627922).
Institutional Review Board Statement
Not applicable.
Informed Consent Statement
Not applicable.
Data Availability Statement
Not applicable.
Acknowledgments
The authors would like to thank M.C. Karla Campos for the assistance in the SEM analysis.
Conflicts of Interest
The authors declare no conflict of interest.
References
- Lopez-Giacoman, S. Biomarkers in Chronic Kidney Disease, from Kidney Function to Kidney Damage. World J. Nephrol. 2015, 4, 57. [Google Scholar] [CrossRef] [PubMed]
- Kovesdy, C.P. Epidemiology of Chronic Kidney Disease: An Update 2022. Kidney Int. Suppl. 2022, 12, 7–11. [Google Scholar] [CrossRef] [PubMed]
- Gbinigie, O.; Price, C.P.; Heneghan, C.; van den Bruel, A.; Plüddemann, A. Creatinine Point-of-Care Testing for Detection and Monitoring of Chronic Kidney Disease: Primary Care Diagnostic Technology Update. Br. J. Gen. Pract. 2015, 65, 608–609. [Google Scholar] [CrossRef] [PubMed]
- Cánovas, R.; Cuartero, M.; Crespo, G.A. Modern Creatinine (Bio)Sensing: Challenges of Point-of-Care Platforms. Biosens. Bioelectron. 2019, 130, 110–124. [Google Scholar] [CrossRef]
- Gonzalez-gallardo, C.L.; Alvarez-contreras, L. Electrochemical Creatinine Detection for Advanced Point-of-Care Sensing Devices: A Review. 2022, 47, 30785–30802. RSC Adv. 2022, 47, 30785–30802. [Google Scholar] [CrossRef] [PubMed]
- Jayasekhar Babu, P.; Tirkey, A.; Mohan Rao, T.J.; Chanu, N.B.; Lalchhandama, K.; Singh, Y.D. Conventional and Nanotechnology Based Sensors for Creatinine (A Kidney Biomarker) Detection: A Consolidated Review. Anal. Biochem. 2022, 645, 114622. [Google Scholar] [CrossRef]
- Rakesh Kumar, R.K.; Shaikh, M.O.; Chuang, C.H. A Review of Recent Advances in Non-Enzymatic Electrochemical Creatinine Biosensing. Anal. Chim. Acta 2021, 1183, 338748. [Google Scholar] [CrossRef]
- Mohabbati-Kalejahi, E.; Azimirad, V.; Bahrami, M.; Ganbari, A. A Review on Creatinine Measurement Techniques. Talanta 2012, 97, 1–8. [Google Scholar] [CrossRef]
- Pundir, C.S.; Kumar, P.; Jaiwal, R. Biosensing Methods for Determination of Creatinine: A Review. Biosens. Bioelectron. 2019, 126, 707–724. [Google Scholar] [CrossRef] [PubMed]
- Ngamchuea, K.; Wannapaiboon, S.; Nongkhunsan, P.; Hirunsit, P.; Fongkaew, I. Structural and Electrochemical Analysis of Copper-Creatinine Complexes: Application in Creatinine Detection. J. Electrochem. Soc. 2022, 169, 020567. [Google Scholar] [CrossRef]
- Chen, C.H.; Lin, M.S. A Novel Structural Specific Creatinine Sensing Scheme for the Determination of the Urine Creatinine. Biosens. Bioelectron. 2012, 31, 90–94. [Google Scholar] [CrossRef]
- da Silva, E.T.S.G.; Souto, D.E.P.; Barragan, J.T.C.; de Fátima Giarola, J.; de Moraes, A.C.M.; Kubota, L.T. Electrochemical Biosensors in Point-of-Care Devices: Recent Advances and Future Trends. ChemElectroChem 2017, 4, 778–794. [Google Scholar] [CrossRef]
- García-Miranda Ferrari, A.; Rowley-Neale, S.J.; Banks, C.E. Screen-Printed Electrodes: Transitioning the Laboratory in-to-the Field. Talanta Open 2021, 3, 100032. [Google Scholar] [CrossRef]
- Beitollahi, H.; Mohammadi, S.Z.; Safaei, M.; Tajik, S. Applications of Electrochemical Sensors and Biosensors Based on Modified Screen-Printed Electrodes: A Review. Anal. Methods 2020, 12, 1547–1560. [Google Scholar] [CrossRef]
- Dayakar, T.; Venkateswara Rao, K.; Park, J.; Krishna, P.; Swaroopa, P.; Ji, Y. Biosynthesis of Ag@CuO Core–Shell Nanostructures for Non-Enzymatic Glucose Sensing Using Screen-Printed Electrode. J. Mater. Sci. Mater. Electron. 2019, 30, 9725–9734. [Google Scholar] [CrossRef]
- Maity, D.; Minitha, C.R.; Rajendra, R.K. Glucose Oxidase Immobilized Amine Terminated Multiwall Carbon Nanotubes/Reduced Graphene Oxide/Polyaniline/Gold Nanoparticles Modified Screen-Printed Carbon Electrode for Highly Sensitive Amperometric Glucose Detection. Mater. Sci. Eng. C 2019, 105, 110075. [Google Scholar] [CrossRef] [PubMed]
- Ji, D.; Liu, L.; Li, S.; Chen, C.; Lu, Y.; Wu, J.; Liu, Q. Smartphone-Based Cyclic Voltammetry System with Graphene Modified Screen Printed Electrodes for Glucose Detection. Biosens. Bioelectron. 2017, 98, 449–456. [Google Scholar] [CrossRef] [PubMed]
- da Cruz, F.S.; de Souza, P.F.; Franco, D.L.; dos Santos, W.T.P.; Ferreira, L.F. Electrochemical Detection of Uric Acid Using Graphite Screen-Printed Electrodes Modified with Prussian Blue/Poly(4-Aminosalicylic Acid)/Uricase. J. Electroanal. Chem. 2017, 806, 172–179. [Google Scholar] [CrossRef]
- Shi, W.; Li, J.; Wu, J.; Wei, Q.; Chen, C.; Bao, N.; Yu, C.; Gu, H. An Electrochemical Biosensor Based on Multi-Wall Carbon Nanotube–Modified Screen-Printed Electrode Immobilized by Uricase for the Detection of Salivary Uric Acid. Anal. Bioanal. Chem. 2020, 412, 7275–7283. [Google Scholar] [CrossRef]
- Shen, X.; Ju, F.; Li, G.; Ma, L. Smartphone-Based Electrochemical Potentiostat Detection System Using Pedot: Pss/Chitosan/Graphene Modified Screen-Printed Electrodes for Dopamine Detection. Sensors 2020, 20, 2781. [Google Scholar] [CrossRef]
- Ku, S.; Palanisamy, S.; Chen, S.M. Highly Selective Dopamine Electrochemical Sensor Based on Electrochemically Pretreated Graphite and Nafion Composite Modified Screen Printed Carbon Electrode. J. Colloid Interface Sci. 2013, 411, 182–186. [Google Scholar] [CrossRef] [PubMed]
- Kanyong, P.; Rawlinson, S.; Davis, J. A Voltammetric Sensor Based on Chemically Reduced Graphene Oxide-Modified Screen-Printed Carbon Electrode for the Simultaneous Analysis of Uric Acid, Ascorbic Acid and Dopamine. Chemosensors 2016, 4, 25. [Google Scholar] [CrossRef]
- Putnin, T.; Jumpathong, W.; Laocharoensuk, R.; Jakmunee, J.; Ounnunkad, K. A Sensitive Electrochemical Immunosensor Based on Poly(2-Aminobenzylamine) Film Modified Screen-Printed Carbon Electrode for Label-Free Detection of Human Immunoglobulin G. Artif. Cells Nanomed. Biotechnol. 2017, 46, 1042–1051. [Google Scholar] [CrossRef]
- Rana, A.; Baig, N.; Saleh, T.A. Electrochemically Pretreated Carbon Electrodes and Their Electroanalytical Applications–A Review. J. Electroanal. Chem. 2019, 833, 313–332. [Google Scholar] [CrossRef]
- Cui, G.; Yoo, J.J.H.; Lee, J.S.; Yoo, J.J.H.; Uhm, J.H.; Cha, G.S.; Nam, H. Effect of Pre-Treatment on the Surface and Electrochemical Properties of Screen-Printed Carbon Paste Electrodes. Analyst 2001, 126, 1399–1403. [Google Scholar] [CrossRef]
- Kalasin, S.; Sangnuang, P.; Khownarumit, P.; Tang, I.M.; Surareungchai, W. Salivary Creatinine Detection Using a Cu(I)/Cu(II) Catalyst Layer of a Supercapacitive Hybrid Sensor: A Wireless IoT Device To Monitor Kidney Diseases for Remote Medical Mobility. ACS Biomater. Sci. Eng. 2020, 6, 5895–5910. [Google Scholar] [CrossRef]
- Gao, X.; Gui, R.; Guo, H.; Wang, Z.; Liu, Q. Creatinine-Induced Specific Signal Responses and Enzymeless Ratiometric Electrochemical Detection Based on Copper Nanoparticles Electrodeposited on Reduced Graphene Oxide-Based Hybrids. Sens. Actuators B Chem. 2019, 285, 201–208. [Google Scholar] [CrossRef]
- Boobphahom, S.; Ruecha, N.; Rodthongkum, N.; Chailapakul, O.; Remcho, V.T. A Copper Oxide-Ionic Liquid/Reduced Graphene Oxide Composite Sensor Enabled by Digital Dispensing: Non-Enzymatic Paper-Based Microfluidic Determination of Creatinine in Human Blood Serum. Anal. Chim. Acta 2019, 1083, 110–118. [Google Scholar] [CrossRef]
- Nontawong, N.; Amatatongchai, M.; Thimoonnee, S.; Laosing, S.; Jarujamrus, P.; Karuwan, C.; Chairam, S. Novel Amperometric Flow-Injection Analysis of Creatinine Using a Molecularly-Imprinted Polymer Coated Copper Oxide Nanoparticle-Modified Carbon-Paste-Electrode. J. Pharm. Biomed. Anal. 2019, 175, 112770. [Google Scholar] [CrossRef]
- Kalasin, S.; Sangnuang, P.; Khownarumit, P.; Tang, I.M.; Surareungchai, W. Evidence of Cu(I) Coupling with Creatinine Using Cuprous Nanoparticles Encapsulated with Polyacrylic Acid Gel-Cu(II) in Facilitating the Determination of Advanced Kidney Dysfunctions. ACS Biomater. Sci. Eng. 2020, 6, 1247–1258. [Google Scholar] [CrossRef]
- Raveendran, J.; Resmi, P.E.; Ramachandran, T.; Nair, B.G.; Satheesh Babu, T.G. Fabrication of a Disposable Non-Enzymatic Electrochemical Creatinine Sensor. Sens. Actuators B Chem. 2017, 243, 589–595. [Google Scholar] [CrossRef]
- Kumar, R.K.; Shaikh, M.O.; Kumar, A.; Liu, C.-H.; Chuang, C.-H. Zwitterion Functionalized Cuprous Oxide Nanoparticles for Highly Specific and Enzymeless Electrochemical Creatinine Biosensing in Human Serum. ACS Appl. Nanomater. 2023. [Google Scholar] [CrossRef]
- Ngamchuea, K.; Moonla, C.; Watwiangkham, A.; Wannapaiboon, S.; Suthirakun, S. Electrochemical and Structural Investigation of Copper Phthalocyanine: Application in the Analysis of Kidney Disease Biomarker. Electrochim. Acta 2022, 428, 140951. [Google Scholar] [CrossRef]
- Pandey, I.; Bairagi, P.K.; Verma, N. Electrochemically Grown Polymethylene Blue Nanofilm on Copper-Carbon Nanofiber Nanocomposite: An Electrochemical Sensor for Creatinine. Sens. Actuators B Chem. 2018, 277, 562–570. [Google Scholar] [CrossRef]
- Ullah, H.; Ahmad, R.; Khan, A.A.; Lee, N.E.; Lee, J.; Shah, A.U.; Khan, M.; Ali, T.; Ali, G.; Khan, Q.; et al. Anodic SnO2 Nanoporous Structure Decorated with Cu2O Nanoparticles for Sensitive Detection of Creatinine: Experimental and DFT Study. ACS Omega 2022, 46, 42377–42395. [Google Scholar] [CrossRef]
Disclaimer/Publisher’s Note: The statements, opinions and data contained in all publications are solely those of the individual author(s) and contributor(s) and not of MDPI and/or the editor(s). MDPI and/or the editor(s) disclaim responsibility for any injury to people or property resulting from any ideas, methods, instructions or products referred to in the content. |
© 2023 by the authors. Licensee MDPI, Basel, Switzerland. This article is an open access article distributed under the terms and conditions of the Creative Commons Attribution (CC BY) license (https://creativecommons.org/licenses/by/4.0/).