Abstract
Adenosine is a vital biological small molecule that regulates various physiological processes in the human body. A high expression of adenosine in cells can facilitate tumor growth. Therefore, detecting adenosine is crucial for early disease diagnosis. In this paper, we designed a fluorescent biosensor for the sensitive detection of adenosine based on the cationic comb-type copolymer PLL-g-Dex for assisted rapid hybridization of nucleic acids at room temperature. In this strategy, adenosine preferentially binds to the aptamer immobilized on the surface of magnetic nanobeads, releasing free aDNA in solution as the primer strand, which rapidly forms DNA nanowires with auxiliary probes of bDNA with the assistance of PLL-g-Dex. SYBR Green I is embedded in DNA duplexes to generate strong fluorescence. The experimental results showed that PLL-g-Dex promotes DNA hybridization reactions at room temperature to form ultra-long DNA nanowires, thus achieving signal amplification and shortening the detection time. In addition, magnetic nanobeads can reduce the background signal during the reaction. Compared with several previous studies on the fluorescence detection of adenosine, this strategy has a lower detection limit of 2.32 nM. Furthermore, this novel system exhibited a good detection performance even under complex environments, such as serum, providing some reference for the quantitative detection of adenosine in early disease diagnosis.
1. Introduction
Adenosine (Ad) is a small physiological molecule that is widely distributed in human cells and has multiple functions in physiological processes [1,2]. In addition to participating in nucleic acid and energy metabolism, adenosine also influences the vascular and nervous systems and has a bidirectional regulatory effect on the immune system [3,4,5]. For instance, adenosine can induce vasodilation to increase blood flow and reduce ischemic and hypoxic damage [6]; as a neuromodulator, adenosine can regulate sleep and pain [7,8]; furthermore, adenosine can act as an immunoregulatory factor that protects tissues and organs by inhibiting inflammation [9]. Adenosine, at high concentrations, can facilitate tumor growth and progression, according to recent studies. This suggests that adenosine may serve as a potential cancer biomarker [10,11]. Therefore, it is essential to detect adenosine with high sensitivity in the early stages of cancer.
In past studies, a variety of methods have been developed for the quantitative detection of adenosine, including high-performance liquid chromatography (HPLC) [12], electrochemical measurements [13], colorimetry [14], and surface-enhanced Raman spectroscopy (SERS) [15]. Although these methods have good selectivity, they also have drawbacks, such as complex sample processing, high requirements for the experimenters’ expertise, and a high cost. These limitations hinder their further application in practice [16]. It is highly desirable to design a biosensor that can detect adenosine rapidly, conveniently, and accurately. Fluorescence analysis is favored by more and more researchers due to its short detection time, simple procedure, and high sensitivity [17,18]. Compared to other techniques that require more complex instrumentation and procedures, fluorescence analysis can be performed in the field using portable instruments. Fluorescence spectrometers are widely used and affordable, and fluorescent probes are easy to design and synthesize. Moreover, fluorescence analysis can detect molecules at extremely low concentrations, such as nanomolar or picomolar levels.
To enhance the detection of trace target species to detectable levels, signal amplification strategies are usually employed [19]. Compared with the enzyme amplification strategy that requires stringent experimental conditions [20], we adopted an enzyme-free signal amplification strategy with high stability in constructing the biosensor, which simplifies the operation and avoids the problem of enzyme inactivation. By combining enzyme-free signal amplification with other signal amplification strategies, the detection signal can be effectively enhanced and the sensitivity can be increased. This approach has been successfully applied to detect proteins, metal ions, and small molecules [21,22,23].
Prof. Maruyama’s group synthesized a cationic comb-type copolymer termed PLL-g-Dex, an artificial nucleic acid chaperone, which can accelerate DNA hybridization and strand displacement reactions, while stabilizing DNA multilevel structures [24,25,26]. It forms complexes with DNA molecules via electrostatic interactions and hydrogen bonds, enhancing DNA stability and shortening the hybridization time. In addition, the comb-type cationic copolymer (PLL-g-Dex) has cationic groups that can neutralize the anionic charge of DNA, reducing its rigidity and repulsion. This increases the flexibility and affinity of DNA and facilitates the hybridization reaction between DNA molecules. Wang et al. found that the cationic comb-type copolymer can promote the hybridization chain reaction (HCR) by increasing the sensitivity of the initiator strand, producing high molecular weight HCR products, and significantly shortening the HCR time [27]. Therefore, PLL-g-Dex can act as an effective hybridization promoter that improves the speed and efficiency of the DNA hybridization reaction. Based on the properties of PLL-g-Dex mentioned above, our lab has also developed several biosensor systems for the highly sensitive detection for proteins and nucleic acids [28,29]. At present, various methods for detecting adenosine have been developed, but to date, highly sensitive detection of adenosine using chaperone copolymers to promote nucleic acid hybridization and thus amplify the fluorescence signal has not been reported yet.
In this study, we developed a biosensor for the sensitive detection of adenosine based on cationic comb-type copolymer-assisted chain hybridization and efficient separation via magnetic nanobeads (MNs). Streptavidin magnetic beads and aptamers specifically bind to form a stable complex, enriching nucleic acids on the surface of magnetic nanobeads. PLL-g-Dex facilitates the hybridization between the aDNA displaced from the surface of the magnetic nanobeads and the bDNA of the auxiliary probe, which significantly enhances the detection sensitivity and shortens the detection time. SYBR Green I (SGI) is an active nucleic acid dye. When SGI intercalates into double-stranded DNA, it produces strong fluorescence, which is used for the accurate quantitative analysis of double-stranded DNA [30]. This is an enzyme-free strategy that does not require fluorophores, which reduces costs to some extent and has low detection limits. Adenosine can also be detected in the complex environment of human serum, indicating that the sensor has a certain anti-interference ability, which may provide new ideas for the quantitative detection of adenosine in the medical field.
2. Materials and Methods
2.1. Materials
Adenosine (Ad) and poly-L-lysine were purchased from Sigma-Aldrich (Shanghai, China). Cytidine, guanosine, uridine, dextran, sodium cyanoborohydride, and Tris-HCl buffer (1 M, pH 7.6) were all purchased from Shanghai Yuanye Biotechnology Company (Shanghai, China). SYBR Green I (SGI) was purchased from Beijing Suolaibao Technology Co., Ltd. (Beijing, China). Streptavidin magnetic beads (50 mg/mL, diameter 500 nm) and phosphate buffer (PBS, 10×) were purchased from Sangon Bioengineering Co., Ltd.(Shanghai, China). The pH reference solution was purchased from Shanghai Merrill Biochemical Technology Co., Ltd. (Shanghai, China). Tween-20 was purchased from Jiangsu KGI Biotechnology Co., Ltd. (Jiangsu, China). The ultrapure water (18.25 MΩcm−1) used in the experiment was prepared using a Plus-E2 ultrapure water machine (Shanghai Zeye Biotechnology Co., Ltd., Shanghai, China). Bovine serum albumin (BSA) was purchased from New England Biolabs (Ipswich, MA, USA).
The DNA used in this experiment (Table 1) was provided by Sangon Bioengineering Co., Ltd. (Shanghai, China) and purified via high-performance liquid chromatography (HPLC). A 100 µM storage solution was prepared with PBS buffer and stored in a refrigerator at 4 °C.

Table 1.
DNA sequences used in experiments.
2.2. Experimental Equipment
Fluorescence detection was performed with a Shimadzu RF-6000 spectrofluorometer (Kyoto, Japan). In this experiment, SGI was used as a fluorescent dye, which can specifically bind to DNA duplexes to generate a fluorescence signal value. The excitation wavelength used in this assay was 495 nm, the emission wavelength was 520 nm, and the spectral scanning range was from 520 nm to 640 nm. The excitation light bandwidth was 5 nm, and the emission light bandwidth was 10 nm.
2.3. Synthesis of PLL-g-Dex
Cationic comb-type copolymers were prepared through following the method of previous work [28]. Poly-L-lysine (25 mg) and dextran (150 mg) were dissolved in dimethyl sulfoxide (25 mL), and sodium cyanoborohydride (30 mg) was added as a reducing agent to prepare a PLL-g-Dex solution through the reductive amination method. The reaction mixture was dialyzed and lyophilized to obtain a purified PLL-g-Dex sample, which was dissolved in ultrapure water for storage.
2.4. Preparation of the MNs-Apt/aDNA Complex
First, 2.5 µL of magnetic nanobeads were washed three times with 1 mL of TTL buffer (1 M LiCl, 100 mM Tris-HCl, 0.1% Tween-20) to remove surface impurities. Next, 50 µL of Apt (2 µM) and 50 µL of aDNA (3 µM) were heated at 95 °C for 5 min and then placed in a −20 °C refrigerator for 10 min to reduce dimer formation. Then, 50 µL of Apt was added to the washed magnetic nanobeads and continuously vortexed for 30 min. After magnetic separation, the supernatant was discarded, and 50 μL of aDNA was added to the magnetic beads and incubated at 37 °C for 1.5 h. aDNA was attached to the surface of magnetic nanobeads by hybridizing with Apt, and the magnetic nanobeads were washed twice with PBS buffer (1×) to remove excess aDNA. The prepared MNs-Apt/aDNA was evenly dispersed in 200 μL of PBS buffer and stored in a refrigerator at 4 °C for later use. All washing steps in the experiment were performed under an external magnetic field.
2.5. Fluorescence Detection of Adenosine
First, 20 µL of MNs-Apt/aDNA was added to 20 µL of adenosine solution and incubated at 37 °C for 60 min. Then, 5 µL of bDNA and 5 µL of PLL-g-Dex were added to 30 µL of supernatant after magnetic separation and then reacted at room temperature for five minutes. Finally, 10 µL of diluted SYBR Green I (5×) was added to the solution of the above reaction, and after shaking, the prepared solution was transferred to a cuvette containing 2 mL of PBS buffer for fluorescence measurement.
2.6. Statistical Analysis
The software GraphPad Prism 10 was used to perform statistical analysis. Each experiment was performed in triplicate, and the one-way ANOVA (and non-parametric) statistical test was used to evaluate the data. The data were expressed as the mean ± standard deviation of the mean (SDM). A p-value of < 0.05 indicated that the result was statistically significant.
3. Results and Discussion
3.1. The Detection Principle of Biosensors
Figure 1 shows the principle of highly sensitive enzyme-free detection of adenosine using PLL-g-Dex-facilitated strand hybridization. First, aptamers with biotin were immobilized on the surface of magnetic nanobeads by specifically binding with streptavidin. The aDNA containing the complementary segment of the aptamer sequence was added to form the MNs-Apt/aDNA complex. In the presence of adenosine, due to the high specificity and affinity of the aptamer, adenosine preferentially recognized the aptamer over the hybridization mode with the DNA part, thereby releasing aDNA. aDNA and bDNA are two well-designed probes whose sequences can be fully complementary. After magnetic separation, and after adding the auxiliary probe bDNA, aDNA and bDNA can hybridize to form double-stranded DNA. Due to the influence of the DNA base sequence and length, the length of the generated DNA duplex was limited. PLL-g-Dex can form electrostatic interactions with DNA, thereby reducing the electrostatic shielding effect. Therefore, the participation of PLL-g-Dex can further promote the cascade hybridization between aDNA and bDNA, produce longer DNA duplexes, and increase the number of DNA duplex fragments. Adding the specific dye SGI, which binds to DNA duplexes, produces a strong fluorescence signal. In the absence of adenosine, due to the lack of competition from adenosine, aDNA will not detach from the aptamer, and adding bDNA cannot form more duplexes, resulting in only a weak background signal.
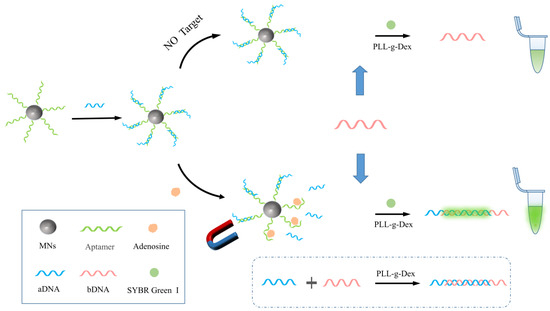
Figure 1.
Schematic diagram of a biosensor for the detection of adenosine via PLL-g-Dex auxiliary strand hybridization.
3.2. Feasibility Analysis
Firstly, in order to verify that PLL-g-Dex can assist aDNA and bDNA to produce longer DNA duplex structures, we performed the following fluorescence tests (Figure 2A). The experiment was conducted at room temperature. When only aDNA or bDNA was present, there was a small amount of fluorescence signal due to some self-pairing of the DNA bases. When both aDNA and bDNA were present, they produced a certain fluorescence intensity due to the base complementarity principle. Under the same experimental circumstances, the fluorescence intensity rose after adding PLL-g-Dex, indicating that PLL-g-Dex could facilitate the hybridization of probes with complementary base sequences and enhance the fluorescence intensity.
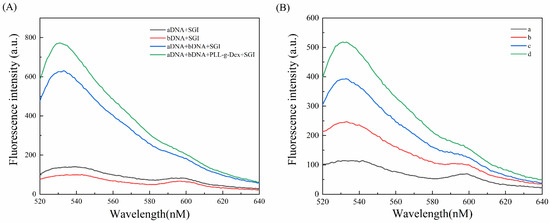
Figure 2.
(A) Fluorescence intensity of different samples spiked. (B) Fluorescence intensities containing different components. (a) MNs-Apt/aDNA + Ad + PLL-g-Dex; (b) MNs-Apt/aDNA + bDNA + PLL-g-Dex; (c) MNs-Apt/aDNA + Ad + bDNA; and (d) MNs-Apt/aDNA + Ad + bDNA + PLL-g-Dex (control group).
To verify the feasibility of the sensor to detect adenosine, we conducted a series of experiments under different conditions. Figure 2B shows the fluorescence spectra obtained with different components. After adding adenosine to the complete system, adenosine and aDNA in the magnetic nanobead complex competed for the aptamer, and adenosine occupied the major part of the aptamer, releasing aDNA into the solution. After magnetic separation, the added bDNA and aDNA rapidly hybridized in a cascade manner with the assistance of PLL-g-Dex to form more DNA duplexes, which generated strong fluorescence signals in the presence of SGI (curve d). This was due to the positively charged comb-shaped cationic copolymer on the surface being able to form a composite system with negatively charged DNA, which reduced the electrostatic repulsion between DNA molecules, allowing free aDNA and bDNA to hybridize with maximum efficiency and produce longer DNA nanowires. When PLL-g-Dex was not introduced, the situation represented by curve c occurred, and the resulting fluorescence intensity was lower than that of the control group. When the system did not contain bDNA, there was no recognition probe complementary to aDNA, and only weak fluorescence intensity was observed (curve a). The background signal was smaller (curve b) without adenosine, as aDNA was not able to be released from the aptamer sequence. In summary, except in the complete system, the fluorescence intensity of other components was relatively low, and this strategy was feasible for detecting adenosine.
3.3. Optimization of the Experimental Conditions
To improve the efficiency and accuracy of the biosensor, this experiment optimized five key factors: the incubation times of the Ad and magnetic nanobead complexes, the concentration of PLL-g-Dex, the incubation times of aDNA and bDNA, the concentration of bDNA, and the temperature. Each experiment had only one variable, and three parallel experiments were performed to reduce the influence of random errors. F denotes the fluorescence signal intensity when the target substance is present, and F0 represents the fluorescence signal intensity when the target substance is not present.
Firstly, we optimized the incubation times of the adenosine and magnetic nanobead complexes. If the incubation time was too short, adenosine did not have enough time to bind to the aptamer, releasing aDNA in time, and only a fraction of aDNA participated in the subsequent reaction to generate a fluorescence signal; if the incubation time was too lengthy, some non-specifically adsorbed nucleic acids on the surface of the magnetic nanobead probe detached from the solution, increasing the background signal. As shown in Figure 3A, as the incubation time rose, the fluorescence intensity first increased continuously, and when the incubation time reached 60 min, the maximum value of the fluorescence signal was obtained. After that, the intensity of the fluorescence started to decline. Therefore, we selected 60 min as the optimal reaction time in this experiment.
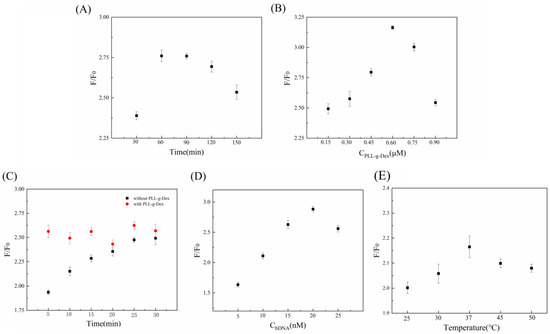
Figure 3.
Optimization of experimental conditions. (A) Incubation times of the Ad and magnetic nanobead complex; (B) concentration of PLL-g-Dex; (C) incubation times of aDNA and bDNA; (D) concentration of bDNA; and (E) temperature.
The hybridization reaction’s fluorescence intensity is influenced by the PLL-g-Dex concentration. Within a certain range, increasing the concentration of PLL-g-Dex enhanced nucleic acid double-strand hybridization, but beyond a certain threshold, this effect either diminished or disappeared. This may be a result of the molecular amplification process being interfered with via the high concentration of PLL-g-Dex. The analysis results (Figure 3B) show that the fluorescence intensity first increases and then decreases with the PLL-g-Dex concentration. The optimal concentration of PLL-g-Dex was 0.6 μM, which gave the maximum value of F/F0.
The reaction times of aDNA and bDNA hybridization also needed to be optimized. As seen in Figure 3C, we tested the hybridization times of 5, 10, 15, 20, 25, and 30 min and contrasted them with and without the addition of PLL-g-Dex. The outcomes revealed that in the presence of PLL-g-Dex, the fluorescence intensity reached its highest value in 5 min and remained stable afterwards. In the control group without PLL-g-Dex, although the fluorescence intensity increased with time, it was always lower than in the experimental group with PLL-g-Dex. The presence of PLL-g-Dex reduces the electrostatic repulsion between nucleic acid molecules, accelerates the hybridization rate, and shortens the reaction time. Moreover, PLL-g-Dex can facilitate the rapid hybridization of more free aDNA and bDNA and amplify the hybridization signal.
The concentration of bDNA influences the sensor signal directly. Generally, increasing the bDNA concentration improves the hybridization efficiency between aDNA and bDNA and raises the fluorescence intensity, but it also increases the background signal intensity. The experimental results with different bDNA concentrations are presented in Figure 3D. The F/F0 value increased continuously from 5 nM to 20 nM of bDNA concentration and reached a maximum at 20 nM. The F/F0 value decreased when the bDNA concentration exceeded 20 nM. Hence, the optimal bDNA concentration was 20 nM.
Experimental temperature is another important factor that affects the results. Generally, an increase in temperature leads to a weaker binding ability between streptavidin and biotin. Moreover, temperature changes also influence the binding between adenosine and aptamers. Thus, we needed to select a suitable temperature to ensure the sensitivity and specificity of the reaction. Figure 3E shows the results of temperature optimization. F/F0 first increased and then decreased as the temperature rose. F/F0 reached its highest value at 37 °C. Therefore, we chose 37 °C as the optimal reaction temperature.
3.4. The Detection Performance of the Sensor
In this experiment, a comb-shaped cationic copolymer-assisted strand hybridization strategy was designed for the rapid and sensitive detection of adenosine. In order to evaluate the detection performance of the sensor for adenosine, different concentrations of adenosine were detected under optimal experimental conditions, and the results are shown in Figure 4A. When the concentrations of adenosine ranged from 0 to 500 nM, the fluorescence intensity rose as a function of adenosine concentration. This indicates that more adenosine was bound to the aptamer, releasing more aDNA to hybridize with bDNA and allowing SGI to insert into more double-stranded structures and generate a stronger fluorescence signal. Adenosine concentration and fluorescence intensity have a linear connection between them between 5 nM and 50 nM, as shown in Figure 4B. The regression equation was F = 388.4 + 3.4 C (C represents the adenosine concentration in nM) and the correlation coefficient was 0.9929. The detection limit of adenosine was 2.32 nM based on 3σ/S (σ is the standard deviation of the blank signal and S is the slope from the regression equation). This strategy had a lower detection limit than other sensors for detecting adenosine (Table 2). This sensor’s low detection limit could provide some references for the medical detection of adenosine.
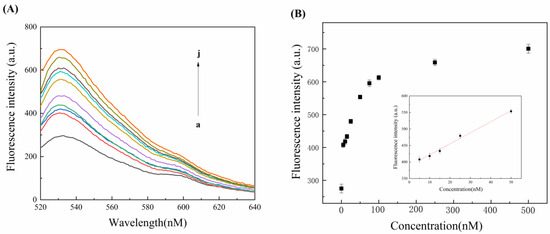
Figure 4.
(A) Fluorescence spectra of different adenosine concentrations (a–j: 0 nM, 5 nM, 10 nM, 15 nM, 25 nM, 50 nM, 75 nM, 100 nM, 250 nM, and 500 nM). (B) Graph of the relationship between different adenosine concentrations and fluorescence signal intensity (the inset is a linear calibration curve of adenosine and fluorescence intensity in the range of 0–50 nM). Error bars represent the standard deviation obtained from triplicate experiments.
Table 2.
Comparison with other sensors for detecting adenosine.
3.5. The Specificity of the Sensor
Specificity is an important factor in evaluating sensor performance. In order to verify the reliability of the sensor, different nucleosides of the same nucleoside family were detected under the same optimized conditions. The detection objects included uridine, cytidine, guanosine, adenosine, and mixtures (comprising adenosine and analogues), and three sets of parallel experiments were carried out to reduce errors. Figure 5 shows the selectivity of this sensor. The concentration of adenosine used in this experiment was 50 nM, and the concentration of other nucleosides was 10 times higher than that of adenosine. The fluorescence intensities of uridine, cytidine, and guanosine were similar, but much lower than that of adenosine. This suggests that the aptamer had a lower affinity for other nucleosides than adenosine, and only a small fraction of them did not bind to the aptamer, leaving most of the aDNA immobilized on the magnetic beads via the aptamer. Only a very small amount of aDNA was free in solution, resulting in a low fluorescence intensity. The experimental groups containing adenosine and the mixture had similar fluorescence intensities, which were much higher than that of the other groups. This indicates that the sensor could specifically recognize the target adenosine without being affected by other nucleosides. Therefore, this strategy demonstrated good selectivity for detecting adenosine and could identify the target adenosine in the presence of the homonucleosides family.
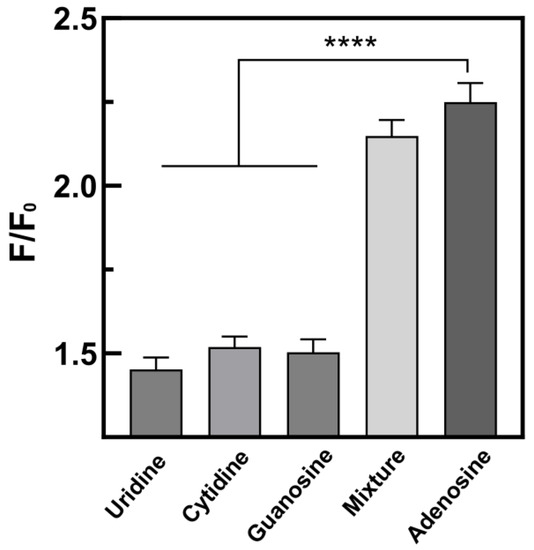
Figure 5.
Selectivity of the sensor for uridine, cytidine, guanosine, mixture, and adenosine. The data were expressed as mean ± SDM (n = 3). A one-way ANOVA was used to evaluate the data (**** p < 0.001).
3.6. Performance of the Sensor for Detecting Adenosine in Complex Environments
The detection of adenosine in complex biological samples, such as serum, is an important criterion for evaluating sensors. Serum, the liquid fraction of blood after coagulation, contains various components that may interfere with the sensor’s accuracy and sensitivity. To test the biosensor’s applicability for adenosine detection, we performed recovery studies by adding different concentrations of adenosine (20 nM, 30 nM, and 50 nM) to 1% diluted BSA samples. Table 3 shows the results. The recoveries of adenosine in serum samples ranged from 93.06% to 108.71%, with relative standard deviations (RSDs) ranging from 2.39% to 6.94%. These data indicate that the sensor has good anti-interference and detection performance in complex environments.
Table 3.
Detection results of adenosine in serum samples.
4. Conclusions
In this study, an enzyme-free, rapid, and sensitive biosensor for the detection of adenosine was constructed based on the excellent separation performance of magnetic nanobeads and comb-shaped cationic copolymer-assisted cascade amplification. This is also the first time we have used PLL-g-Dex to accelerate nucleic acid hybridization for adenosine detection. Firstly, we designed a magnetic bead probe (MNs-Apt/aDNA). The aptamer on the magnetic beads preferentially binds to adenosine specifically, and aDNA is displaced, forming a nucleic acid duplex with the participation of the auxiliary probe bDNA chain structure. The addition of the artificial nucleic acid partner comb-type cationic copolymer significantly promoted the cascade amplification between nucleic acids, forming ultra-long DNA nanowires. SYBR Green I was embedded as a fluorescence signal output into the double strand to produce strong fluorescence. In addition, the enrichment of nucleic acids through magnetic nanobeads sped up the reaction and obtained a lower background signal. The comb-type cationic copolymer assists chain amplification to amplify the signal and improve the detection performance of the sensor. The detection limit of adenosine was as low as 2.32 nM. This design method was applied in a complex serum environment, and the recovery results of adenosine were satisfactory. There were no enzymes involved in the entire experimental process, which prevented enzyme inactivation or instability from affecting the performance of the sensor. As an effective nucleic acid hybridization promoter, PLL-g-Dex can be used in combination with other signal amplification strategies, and there will be more innovations and breakthroughs in the future. In summary, based on the excellent performance of this strategy in detecting adenosine, it is expected to provide a new idea for the quantitative detection of adenosine in medicine.
Author Contributions
Y.L. and J.D. performed the experiments and wrote the paper; Y.L., Y.Y., Y.Q. and J.D. analyzed the data, and J.D. conceived and designed the experiments. All authors have read and agreed to the published version of the manuscript.
Funding
This work was financially supported by the Hainan Province Science and Technology Special Fund (ZDYF2023SHFZ110), the National Natural Science Foundation of China (Grant No. 21763009), and the Graduate Students Innovation Research Project of Hainan Province (Qhys2022-77, Qhys2022-146).
Institutional Review Board Statement
Not applicable.
Informed Consent Statement
Not applicable.
Data Availability Statement
Not applicable.
Conflicts of Interest
The authors declare no conflict of interest.
References
- Shahrestanaki, M.K.; Arasi, F.P.; Aghaei, M. Adenosine protects pancreatic beta cells against apoptosis induced by endoplasmic reticulum stress. J. Cell Biochem. 2019, 120, 7759–7770. [Google Scholar] [CrossRef]
- Churov, A.; Zhulai, G. Targeting adenosine and regulatory T cells in cancer immunotherapy. Hum. Immunol. 2021, 82, 270–278. [Google Scholar] [CrossRef]
- Porkka-Heiskanen, T.; Kalinchuk, A.V. Adenosine, energy metabolism and sleep homeostasis. Sleep. Med. Rev. 2011, 15, 123–135. [Google Scholar] [CrossRef]
- Reiss, A.B.; Grossfeld, D.; Kasselman, L.J.; Renna, H.A.; Vernice, N.A.; Drewes, W.; Konig, J.; Carsons, S.E.; DeLeon, J. Adenosine and the Cardiovascular System. Am. J. Cardiovasc. Drugs 2019, 19, 449–464. [Google Scholar] [CrossRef] [PubMed]
- Antonioli, L.; Fornai, M.; Blandizzi, C.; Pacher, P.; Hasko, G. Adenosine signaling and the immune system: When a lot could be too much. Immunol. Lett. 2019, 205, 9–15. [Google Scholar] [CrossRef]
- Hansen, P.B.; Schnermann, J. Vasoconstrictor and vasodilator effects of adenosine in the kidney. Am. J. Physiol. Ren. Physiol. 2003, 285, F590–F599. [Google Scholar] [CrossRef] [PubMed]
- Huang, Z.L.; Urade, Y.; Hayaishi, O. The role of adenosine in the regulation of sleep. Curr. Top. Med. Chem. 2011, 11, 1047–1057. [Google Scholar] [CrossRef] [PubMed]
- Sawynok, J.; Liu, X.J. Adenosine in the spinal cord and periphery: Release and regulation of pain. Prog. Neurobiol. 2003, 69, 313–340. [Google Scholar] [CrossRef]
- Palmer, T.M.; Trevethick, M.A. Suppression of inflammatory and immune responses by the A(2A) adenosine receptor: An introduction. Br. J. Pharmacol. 2008, 153 (Suppl. S1), S27–S34. [Google Scholar] [CrossRef]
- Spychala, J. Tumor-promoting functions of adenosine. Pharmacol. Ther. 2000, 87, 161–173. [Google Scholar] [CrossRef] [PubMed]
- Leone, R.D.; Emens, L.A. Targeting adenosine for cancer immunotherapy. J. Immunother. Cancer 2018, 6, 57. [Google Scholar] [CrossRef]
- Jeon, J.S.; Lee, M.J.; Yoon, M.H.; Park, J.A.; Yi, H.; Cho, H.J.; Shin, H.C. Determination of Arbutin, Niacinamide, and Adenosine in Functional Cosmetic Products by High-Performance Liquid Chromatography. Anal. Lett. 2014, 47, 1650–1660. [Google Scholar] [CrossRef]
- Gliga, L.E.; Iacob, B.C.; Chesches, B.; Florea, A.; Barbu-Tudoran, L.; Bodoki, E.; Oprean, R. Electrochemical platform for the detection of adenosine using a sandwich-structured molecularly imprinted polymer-based sensor. Electrochim. Acta 2020, 354, 136656. [Google Scholar] [CrossRef]
- Yousefi, S.; Saraji, M. Optical aptasensor based on silver nanoparticles for the colorimetric detection of adenosine. Spectrochim. Acta A Mol. Biomol. Spectrosc. 2019, 213, 1–5. [Google Scholar] [CrossRef] [PubMed]
- Li, Y.; Xin, X.L.; Zhang, T.T.; Li, W.H.; Li, J.S.; Lu, R. Raspberry-like polyamide@Ag hybrid nanoarrays with flexible cores and SERS signal enhancement strategy for adenosine detection. Chem. Eng. J. 2021, 422, 129983. [Google Scholar] [CrossRef]
- Han, D.; Kim, H.M.; Chand, R.; Kim, G.; Shin, I.S.; Kim, Y.S. Rhodium Complex and Enzyme Couple Mediated Electrochemical Detection of Adenosine. Appl. Biochem. Biotechnol. 2015, 177, 812–820. [Google Scholar] [CrossRef] [PubMed]
- Yousefi, S.; Saraji, M. Developing a fluorometric aptasensor based on carbon quantum dots and silver nanoparticles for the detection of adenosine. Microchem. J. 2019, 148, 169–176. [Google Scholar] [CrossRef]
- Shen, X.; Xu, L.; Zhu, W.; Li, B.; Hong, J.; Zhou, X. A turn-on fluorescent aptasensor based on carbon dots for sensitive detection of adenosine. New J. Chem. 2017, 41, 9230–9235. [Google Scholar] [CrossRef]
- Zheng, G.; Dai, J.; Wang, H.; Li, L.; Yuan, D.; Bai, S.; Song, X.; Zhao, Y. A hairpin-mediated nicking enzymatic signal amplification for nucleic acids detection. Talanta 2021, 225, 121991. [Google Scholar] [CrossRef] [PubMed]
- Xiao, F.; Liu, J.; Guo, Q.; Du, Z.; Li, H.; Sun, C.; Du, W. Dual-Signal Amplification Strategy for Sensitive MicroRNA Detection Based on Rolling Circle Amplification and Enzymatic Repairing Amplification. ACS Omega 2020, 5, 32738–32743. [Google Scholar] [CrossRef]
- Dong, J.; Zhang, D.; Li, C.; Bai, T.; Jin, H.; Suo, Z. A sensitive electrochemical sensor based on PtNPs@Cu-MOF signal probe and DNA walker signal amplification for Pb(2+) detection. Bioelectrochemistry 2022, 146, 108134. [Google Scholar] [CrossRef] [PubMed]
- Kim, G.; Cho, H.; Nandhakumar, P.; Park, J.K.; Kim, K.S.; Yang, H. Wash-Free, Sandwich-Type Protein Detection Using Direct Electron Transfer and Catalytic Signal Amplification of Multiple Redox Labels. Anal. Chem. 2022, 94, 2163–2171. [Google Scholar] [CrossRef] [PubMed]
- Ren, L.J.; Xu, P.; Zhang, P.; Qin, Z.R.; Zhang, Y.T.; Jiang, L.Y. Label-free fluorescence aptasensor based on AuNPs and CQDs for the detection of ATP. Aip Adv. 2021, 11, 015316. [Google Scholar] [CrossRef]
- Kim, W.; Ishihara, T.; Akaike, T.; Maruyama, A. Comb-Type Cationic Copolymer Expedites DNA Strand Exchange while Stabilizing DNA Duplex. Chem. Eur. J. 2007, 7, 176–180. [Google Scholar] [CrossRef]
- Choi, S.W.; Kano, A.; Maruyama, A. Activation of DNA strand exchange by cationic comb-type copolymers: Effect of cationic moieties of the copolymers. Nucleic Acids Res. 2008, 36, 342–351. [Google Scholar] [CrossRef]
- Du, J.; Wu, L.; Shimada, N.; Kano, A.; Maruyama, A. Polyelectrolyte-assisted transconformation of a stem-loop DNA. Chem. Commun. 2013, 49, 475. [Google Scholar] [CrossRef]
- Wang, J.; Shimada, N.; Maruyama, A. Cationic Copolymer-Augmented DNA Hybridization Chain Reaction. ACS Appl. Mater. Interfaces 2022, 14, 39396–39403. [Google Scholar] [CrossRef]
- Han, J.; Fang, C.; Ouyang, P.; Qing, Y.; Yang, Y.; Li, H.; Wang, Z.; Du, J. Chaperone Copolymer Assisted G-Quadruplex-Based Signal Amplification Assay for Highly Sensitive Detection of VEGF. Biosensors 2022, 12, 262. [Google Scholar] [CrossRef]
- Han, J.; Wu, J.; Du, J. Fluorescent DNA Biosensor for Single-Base Mismatch Detection Assisted by Cationic Comb-Type Copolymer. Molecules 2019, 24, 575. [Google Scholar] [CrossRef]
- Leggate, J.; Allain, R.; Isaac, L.; Blais, B.W. Microplate fluorescence assay for the quantification of double stranded DNA using SYBR Green I dye. Biotechnol. Lett. 2006, 28, 1587–1594. [Google Scholar] [CrossRef]
- Yang, H.M.; Hu, P.Y.; Tang, J.; Cheng, Y.; Wang, F.; Chen, Z.L. A bifunctional electrochemical aptasensor based on AuNPs-coated ERGO nanosheets for sensitive detection of adenosine and thrombin. J. Solid. State Electr. 2021, 25, 1383–1391. [Google Scholar] [CrossRef]
- Xu, L.; Shen, X.; Li, B.; Zhu, C.; Zhou, X. G-quadruplex based Exo III-assisted signal amplification aptasensor for the colorimetric detection of adenosine. Anal. Chim. Acta 2017, 980, 58–64. [Google Scholar] [CrossRef] [PubMed]
- Lin, Y.; Wang, X.; Sun, Y.; Dai, Y.; Sun, W.; Zhu, X.; Liu, H.; Han, R.; Gao, D.; Luo, C. A chemiluminescent biosensor for ultrasensitive detection of adenosine based on target-responsive DNA hydrogel with Au@HKUST-1 encapsulation. Sens. Actuators B Chem. 2019, 289, 56–64. [Google Scholar] [CrossRef]
- Sun, Y.; Ding, C.; Lin, Y.; Sun, W.; Liu, H.; Zhu, X.; Dai, Y.; Luo, C. Highly selective and sensitive chemiluminescence biosensor for adenosine detection based on carbon quantum dots catalyzing luminescence released from aptamers functionalized graphene@magnetic beta-cyclodextrin polymers. Talanta 2018, 186, 238–247. [Google Scholar] [CrossRef] [PubMed]
- Cui, L.; Lu, M.; Li, Y.; Tang, B.; Zhang, C.Y. A reusable ratiometric electrochemical biosensor on the basis of the binding of methylene blue to DNA with alternating AT base sequence for sensitive detection of adenosine. Biosens. Bioelectron. 2018, 102, 87–93. [Google Scholar] [CrossRef]
- You, J.; You, Z.; Xu, X.; Ji, J.; Lu, T.; Xia, Y.; Wang, L.; Zhang, L.; Du, S. A split aptamer-labeled ratiometric fluorescent biosensor for specific detection of adenosine in human urine. Mikrochim. Acta 2018, 186, 43. [Google Scholar] [CrossRef]
- Zhou, S.; Gan, Y.; Kong, L.; Sun, J.; Liang, T.; Wang, X.; Wan, H.; Wang, P. A novel portable biosensor based on aptamer functionalized gold nanoparticles for adenosine detection. Anal. Chim. Acta 2020, 1120, 43–49. [Google Scholar] [CrossRef]
Disclaimer/Publisher’s Note: The statements, opinions and data contained in all publications are solely those of the individual author(s) and contributor(s) and not of MDPI and/or the editor(s). MDPI and/or the editor(s) disclaim responsibility for any injury to people or property resulting from any ideas, methods, instructions or products referred to in the content. |
© 2023 by the authors. Licensee MDPI, Basel, Switzerland. This article is an open access article distributed under the terms and conditions of the Creative Commons Attribution (CC BY) license (https://creativecommons.org/licenses/by/4.0/).