Article

Highly Sensitive SF6 Decomposition Byproducts Sensing Platform Based on CuO/ZnO Heterojunction Nanofibers

1
College of Engineering and Technology, Southwest University, Chongqing 400715, China
2
Taiyuan Power Supply Company, State Grid Shanxi Electric Power Company, Taiyuan 030021, China
3
International Iberian Nanotechnology Laboratory, 4715-330 Braga, Portugal
4
College of Materials Science and Engineering, Chongqing University, Chongqing 400030, China
*
Authors to whom correspondence should be addressed.
Chemosensors 2023, 11(1), 58; https://doi.org/10.3390/chemosensors11010058
Submission received: 1 December 2022 / Revised: 28 December 2022 / Accepted: 9 January 2023 / Published: 11 January 2023

Abstract

:
Hydrogen sulfide (H2S) and sulfur dioxide (SO2) are two typical decomposition byproducts of sulfur hexafluoride (SF6), commonly used as an insulating medium in electrical equipment; for instance, in gas circuit breakers and gas insulated switchgears. In our work, fiber-like p-CuO/n-ZnO heterojunction gas sensing materials were successfully prepared via the electrospinning method to detect the SF6 decomposition byproducts, H2S and SO2 gases. The sensing results demonstrated that p-CuO/n-ZnO nanofiber sensors have good sensing performance with respect to H2S and SO2. It is noteworthy that this fiber-like p-CuO/n-ZnO heterojunction sensor exhibits higher and faster response–recovery time to H2S and SO2. The enhanced sensor performances can probably be attributed to the sulfuration–desulfuration reaction between H2S and the sensing materials. Moreover, the gas sensor exhibited a high response to the low exposure of H2S and SO2 gas (below 5 ppm). Towards the end of the paper, the gas sensing mechanism of the prepared p-CuO/n-ZnO heterojunction sensors to SO2 and H2S is discussed carefully. Calculations based on first principles were carried out for Cu/ZnO to construct adsorption models for the adsorption of SO2 and H2S gas molecules. Information on adsorption energy, density of states, energy gap values and charge density were calculated and compared to explain the gas-sensitive mechanism of ZnO on SO2 and H2S gases.

1. Introduction

SF6 as a common insulating gas. It is commonly used as the insulating medium for various types of gas-insulated equipment [1,2]. Despite the high stability of SF6 at normal operating temperatures, under conditions of discharge fault caused by arcs, sparks and partial discharges, some SF6 molecules react with small amounts of water and solid insulation materials and decompose into various typical decomposition by-products, including SO2, H2S, SOF2, SO2F2 and other gases and solid byproducts [3]. Thus, one of the effective methods for identifying and diagnosing early faults in SF6 gas-insulated equipment is the detection of typical decomposition components of SF6 gas [4,5]; the development of technology, photoacoustic (PA) spectroscopy [6], gas chromatography [7] and infrared absorption spectrometry [8] is put into practice for SF6 decomposition component detection. However, the methods mentioned above are offline monitoring means for analyzing the insulation status. In terms of online analysis of insulation status, gas sensor detection methods have been well developed recently [9,10]. Zhang et al. worked on the application of online monitoring of SF6 decomposition by-products TiO2 nanotubes and carbon nanotube sensors for GIS equipment [11,12]. Intrinsic and Au-modified anatase had been prepared. The gas-sensitive properties of Au-modified anatase to SOF2 and SO2F2 are better than those of pure anatase, but the results of SO2 are opposite [11]. Metal-oxide semiconductor nanomaterials have received much attention as they represent one of the effective approaches for detecting various gases for high sensitivity, low cost, and low power consumption [13,14]. Over the last decades, various metal oxides sensors such as SnO2 [15,16], ZnO [17,18], WO3 [19,20], CuO [21,22], MoO3 [23] and TiO2 [24,25] have been prepared for gas sensing. However, the research on using a metal-oxide semiconductor for the detection of decomposed byproducts of SF6 is still insufficient.
Moreover, to improve the gas sensing properties, several methods have been researched such as metal doping [26] and loading, as well as changing nanostructures for an increasing surface area. The metal-oxide semiconductor composites [27], one of the most effective methods, have gained great attention for their prominent effect in terms of improving their sensing performances. For example, Yan et al. utilized a facile electrospinning method to synthesize SnO2–ZnO hetero-nanofibers, which have great stability and excellent selectivity to ethanol [28]. Zhang et al. successfully synthesized flower-like CuO/ZnO nanostructures’ gas sensing materials, utilizing a two-step synthesis route. The result showed an obvious improvement with respect to gas sensing properties [29]. Qu et al. achieved the synthesis of NiO/ZnO nanowire by a simple hydrothermal method and tested the prepared gas sensors’ H2S gas sensing properties; they demonstrates fast response and high sensitivity [30]. Maryam et al. synthesized an Au-decorated ZnO-polyaniline (PANI) ternary system composite nanofibers for NO2 gas sensing studies and demonstrated the promising effect of this ternary system for NO2 sensing [31]. Bo et al. first prepared ZnO nanorods and self-sacrificed them by heating them in a water bath to produce the commonly used porous ZIF-8 then firmly attached them to the ZnO surface. They then demonstrated by gas-sensitive experiments that ZnO coated with ZIF-8, having a core-shell structure, showed a better response than pristine ZnO [32].
Here, we successfully synthesized fiber-like p-CuO/n-ZnO heterojunction nanomaterials via the electrospinning method for detecting H2S and SO2, two of the most important decomposition byproducts of SF6. The nanostructure and morphology of the electrospun p-CuO/n-ZnO nanomaterials were characterized, as were their H2S and SO2 gas sensing properties, such as responses at varying operating temperatures or different gas concentrations, so the response and recovery times were tested. Finally, the sensing mechanism of the p-CuO/n-ZnO heterojunction sensor was discussed.

2. Materials and Methods

2.1. Materials Synthesis

The fiber-like CuO/ZnO sample were synthesized via the electrospinning method. All reagents (analytical grade reagents), zinc acetate (Zn(CH3COO)2), cupric chloride (CuCl₂·2H2O), polyvinyl alcohol (PVA, Mw = 80,000) and unpurified deionized water were used directly. All the raw materials were purchased from Chongqing Chuandong Chemical Reagent.
In a typical electrostatic spinning [33], 1 g PVA was dissolved in 9 mL deionized water and stirred for 20 min. Then 0.2 g CuCl₂·2H2O and 1.5 g Zn(CH3COO)2 were added in the solution. To obtain a homogeneous sample for subsequent synthesis, the mixture was stirred at 25 °C for 10 h. The prepared mixture was put into a 2 mL syringe with a 0.5 mm needle and was electrospun by applying a voltage of 15 kV. The collector to needle distance was 15 cm. The as-electrospun sensing materials were annealed at 600 °C for 3 h with a heating rate of 5 °C/min in air to remove the organic polymer components.

2.2. Materials Characterization

The crystal structure of the prepared CuO/ZnO sensing materials was investigated by X-ray diffraction (XRD, Rigaku D/Max-1200X) with Cu-Kα radiation (1.542 Å) over 2 θ from 20° to 80°. Moreover, the morphology of the powders was determined by field emission scanning electronic microscopy (FESEM, JEOL, JSM-6700F, operating at 15 kV) and transmission electron microscopy (TEM, JEOL, JEM-2100, operating at 120 kV). The elemental composition was characterized using energy dispersive spectroscopy (EDS, Oxford INCA 250). The specific surface areas and porosity was calculated by nitrogen adsorption–desorption isotherm using Micromeritics ASAP2020 apparatus at 77 K.

2.3. Fabrication and Measurement of Gas Sensors

The planar-type sensors were fabricated by the screen-printing technique [34]. The complete sensor comprises ceramic substrate, Ag-Pd interdigital electrodes and sensing materials as shown in Figure 1. The preparation process of the sensor is as follows: firstly, the as-electrospun materials were ground into power, and then mixed with distilled water and small amounts of ethanol forming the homogeneous paste; secondly, the paste was screen printed on the ceramic substrate; finally, the planar sensor was dried for 12 h and aged at 300 °C for 12 days before measurement.
The gas sensing performances of the fabricated planar sensors were tested by Chemical Gas Sensor-1 Temperature Pressure intelligent gas sensing analysis system (CGS-1TP, Beijing Elite Tech Co., Ltd., Beijing, China). The system can control the temperature environment and relative humidity for testing the gas sensing performance. The gas response value was specified as S = Ra/Rg, where the Rg is the resistance of the sensor in target gas and Ra is the resistance of the sensor in air. The response time is the time taken by the gas sensor to reach 90% of steady state response value, whereas recovery time refers to the time required to attain 10% of the initial response value [15].
The average crystal sizes of the prepared sensing materials were calculated using the Scherrer equation:
d = 0.89 λ β cos θ
where d states the crystal size of the synthesized samples, λ has a value of 1.542 Å corresponding the X-ray wavelength, θ is the Bragg diffraction angle and β is the peak width at half maximum.

3. Results and Discussion

3.1. Nanomaterials Characterizations

The XRD pattern provides crystallinity information of the fiber-like CuO/ZnO nanomaterials as can be seen in Figure 2. The strong diffraction peaks could be classified as the hexagonal wurtzite ZnO (JCPDS: 89-0510) and monoclinic CuO (JCPDS: 89-5895) with the main peaks at (100), (002), (101), (102), (110), (103) and (112) for ZnO and ( 1 ¯ 11 ), (111), ( 2 ¯ 02 ), (202), ( 1 ¯ 13 ) and ( 3 ¯ 11 ) for CuO. No further peaks related to other phases have been detected in the XRD pattern. Therefore, the final ZnO and CuO with high purity was successfully prepared. The average crystal size of ZnO and CuO of prepared materials is 26.3 nm and 23.2 nm, respectively.
SEM and TEM images of the electrospun CuO/ZnO nanomaterials were shown in Figure 3. It can be observed that the fiber-like nanomaterials are randomly oriented with an average diameter of 100–200 nm, and the sample agglomerates of nanoparticles have a diameter ranging from 20 nm to 50 nm. Moreover, the surface of the sample has a high degree of roughness. In fact, the decomposition of PVA polymer template can cause the formation of a porous structure in the nanofibers obtained by the electrospinning method [34].
The EDS measurement was applied to analyze the elemental composition of the synthesized CuO/ZnO nanomaterials. The atomic and weight ratios of the synthesized fiber-like CuO/ZnO are shown in Table 1. As illustrated in Figure 4, the composition of CuO and ZnO is successful. The Zn, Cu, O and C are seen in the EDS spectrum, while the atomic ratio of the Zn and Cu is 44.65: 5.72, indicating that the ratio of ZnO and CuO is 8:1.
The adsorption–desorption isotherms of nitrogen with CuO/ZnO nanomaterials were measured to understand the pore structure as shown in Figure 5a. According to the IUPAC classification, the curve exhibits a typical IV isotherm and a H3-type hysteresis when P/P0 is in 0.7–1. The Figure 5b is the images of the aperture distribution carried out using the Barret–Joyner–Halenda (BJH) method. It can be seen that the pore size distribution is centered at 9.5 nm, Moreover, the surface area of the nanomaterials is 30.7 m2g−1 in BET. The results proved that the formation of the fibers’ structure possesses a wide surface area, greatly improving the adsorption of gases, and thus leading to high sensing performance.

3.2. Gas Sensing Studies

To investigate possible applications for the detection of SF6 decomposition components with the synthesized CuO/ZnO gas sensor, SO2 and H2S gas properties were tested. The response and the response time of the fabricated CuO/ZnO gas sensor to 50 ppm H2S and SO2 were measured at different operating temperatures and displayed in Figure 6a,b, respectively. The prepared sensor’s response value first increases and then decreases with increasing temperature. It can be explained that when the sensor was at a low temperature environment, the reaction between H2S (or SO2) gas molecules with oxygen species does not occur due to the lack of thermal energy. With further increasing temperature, the gas desorption rate becomes faster, and it can lead to the drop of response value. The optimal temperature of the fabricated p-CuO/n-ZnO sensor is 200 °C and 240 °C for H2S and SO2, respectively. The response value to H2S gas is higher than that with respect to SO2 gas at different operating temperatures. As illustrated in Figure 6b, as the operating temperature rises, the response time drops quickly and then slowly. The response time for detecting SO2 gas is longer than that for H2S gas. The above results prove that the fabricated CuO/ZnO sensor has a high sensitivity to H2S and SO2 and has better gas sensing properties to H2S than SO2.
The responses of the CuO/ZnO sensor to H2S and SO2 gas in the concentration range of 1–2000 ppm at their optimal working temperatures were tested and shown in Figure 7. As illustrated in Figure 7a, when the target gas concentration increases from 1 to 1000 ppm, the response value increases rapidly. The response values tend to be stable when the gas concentration increases further. When the H2S and SO2 gas concentration is low at 5 ppm, the response value of the sensor is 11.65 and 3.53, respectively. It can fully meet the requirement stipulated in Chinese National Standard [35]. Figure 7b shows the responses for low concentrations of target gases from 1 to 100 ppm. The gas response reaches a good linear relationship with gas concentration in the range of 1–100 ppm, indicating that the sensor is ideal for the low target gas concentration detection and practical applications.
In Figure 8, we present response curves of the CuO/ZnO sensor to 20, 40, 60, 80 and 100 ppm H2S and SO2 at their optimal working temperatures. From the Figure 8, the sensor shows excellent response and recovery characteristics. The resistance can return to the nearly original resistance after several cycles. The relation between the CuO/ZnO sensor response and the time indicates that the sensor response time to H2S is faster than that to SO2.
Further, Figure 9 depicts the response and recovery times of the fabricated CuO/ZnO gas sensor to H2S and SO2 gas at the optimal working temperatures. It is displayed in Figure 9 that the response and recovery times of the prepared gas sensor for 20, 40, 60, 80 and 100 ppm of H2S are 41 s and 71 s, 46 s and 74 s, 44 s and 85 s, 42 s and 89 s, 48 s and 96 s, respectively. For SO2, response and recovery times are 66 s and 98 s, 61 s and 104 s, 67 s and 108 s, 63 s and 125 s, 72 s and 134 s, respectively. The response time remains basically constant at the same temperature and recovery time increases slightly with the increase of gas concentration.
Finally, the CuO/ZnO sensor was compared with other ZnO based H2S sensors to explore whether its sensing performance demonstrates outstanding progress, as shown in Table 2 [36,37,38,39]. It can be seen from the table that the materials prepared in this study have certain advantages in response value, working temperature and concentration.

3.3. Gas Sensing Mechanism

The H2S and SO2 gases sensing mechanism of the p-CuO/n-ZnO sensor can be explained by the change of depletion layers and the p–n junction mechanism [33], as shown in Figure 10. The resistance would change with it being exposed to different atmospheres. When the nanomaterial in the sensor is in air, oxygen molecules near the surface are formed by reaction to O2, O and O2− through the capture of electrons in the conduction band. [40]. The optimal working temperature is above 100 °C, so O and O2− ions are dominantly adsorbed oxygen species. It can be expressed as follows [11,41]:
O 2 + e O 2   ( below   100   ° C ) ;
O 2 + e 2 O ( over   100   ° C ) ;
O + e O 2 ( over   100   ° C ) .
Owing to the electron depletion layer thickening as oxygen absorbs electrons, the resistance of p-CuO/nZnO sensor is high in air. Under the target gas environment, the oxygen adsorbed reacts with the H2S and SO2 gas molecules and the electrons released in the reaction return to the conduction band [42]. The reactions are as follows [43,44,45]:
H 2 S + 3 O H 2 O + S O 2 + 3 e ;
S O 2 + O S O 3 ( a d s ) + e .
As a result, the resistance is low in reducing atmospheres. At the junction of CuO and ZnO, the band is bending and an electron-depleted region is generated as the formation of a p–n heterojunction. In Figure 10, electrons will transfer from ZnO to CuO, while the holes will move from CuO to ZnO. Therefore, the barrier will be formed at the interface of CuO and ZnO resulting in further increase of resistance in the air. When the sensor is exposed to H2S or SO2 gas, the released electrons decrease hole storage width of CuO and the depletion layer width of ZnO, resulting in reduced resistance.
When the sensor exposed in H2S gas, the CuO of CuO/ZnO nanomaterials would transform into CuS by reacting with H2S [45]:
C u O + H 2 S C u S ( s ) + H 2 O .
While CuS is unstable in high temperature environments, it could transform into Cu2S. Therefore, when the sensor id exposed in H2S gas, the transition from CuO to CuS or Cu2S leads to an obvious drop of the potential barrier in the p-n heterojunction, thus increasing the conductivity of the sensor [46]. When the sensor is exposed in air again, CuS converts to CuO as the following reaction:
C u S + 3 2 O 2 C u O ( s ) + S O 2 .
The reaction retains the sensor recovering the original high resistance [33]. The sulfuration–desulfuration process can explain CuO–ZnO nanomaterials showing higher response to H2S than SO2 gas.

4. First-Principles Based Simulation Analysis

4.1. Computational Details

The DMol3 module within the Materials Studio software was used for the simulation part of this paper, and the generalised gradient approximation GGA/PBE was chosen to calculate the electron exchange and association energies. Double numeric basis with polarization (DNP) was chosen for the basis group. Orbital electrons are calculated using the DFT Semi-core Pseudopods method [47]. The Bree abyssal K-point was chosen as 2 × 2 × 1. The energy convergence accuracy, maximum stress and maximum displacement were set to 10−5, 0.002 Ha/Å and 0.005 Å, respectively. The self-consistent field charge density convergence was accelerated using DIIS [48].

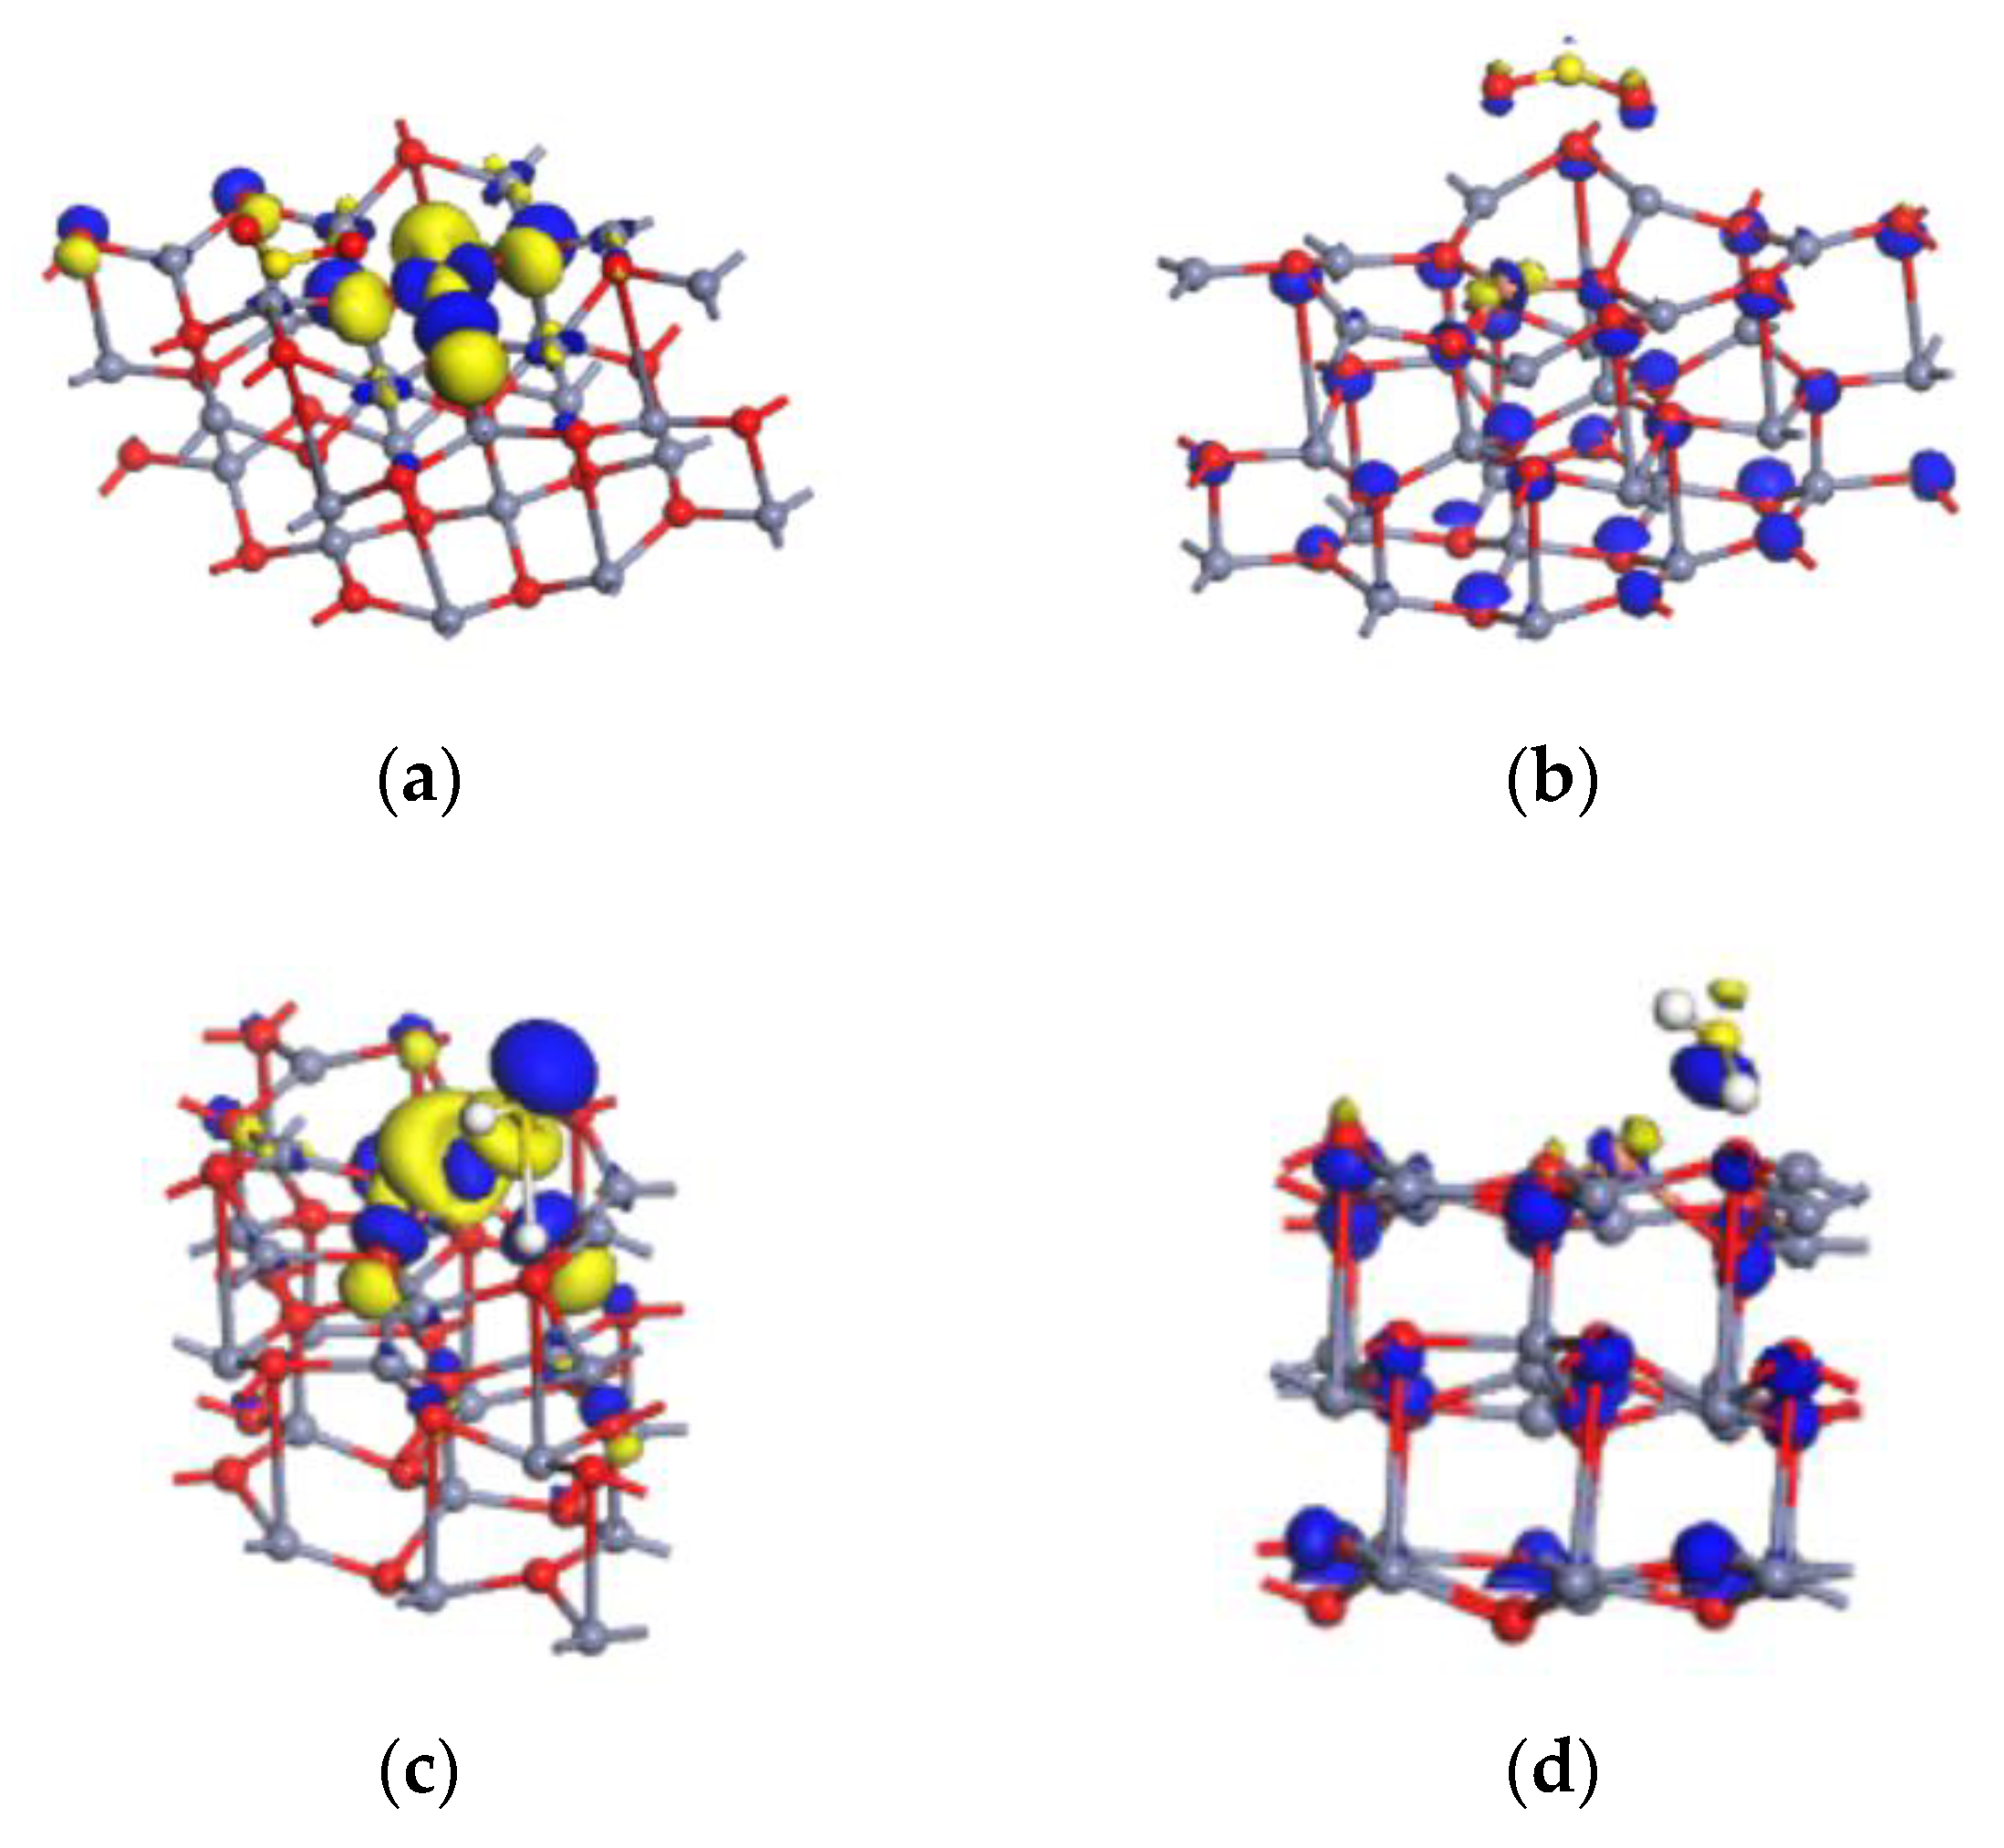
4.2. Cu/ZnO-Based SO2, H2S Gas Sensing Mechanism Based on the First Principles

The Cu/ZnO model is based on first-principles, replacing the surface Zn atoms. The following Figure 11 shows the Cu atoms replacing the surface Zn atoms at different angles.
The calculated energy band structure and density of states of Cu/ZnO are shown in Figure 12 below. Figure 12a Shows the energy band structure and it can be seen that the conduction band is significantly shifted downwards with a band gap of 0.049 eV, which is significantly lower than that of pure ZnO (1.553 eV), indicating that the electron leap is easier during gas adsorption. Figure 12b shows a plot of the total density of states of the Cu/ZnO and pure ZnO cells for comparative analysis. It can be seen from the plot that the band gap width decreases and the conduction band shifts significantly to the left, indicating that the involvement of Cu reduces the conduction band significantly. Comparing the fractional density of states plot with the atomic density of states plot, it can be found that the valence band within −19.3 to −17.5 eV is mainly provided by O2s, which are deep energy level electrons and have little effect on the surface properties of the material. The peak at the Fermi energy level consists mainly of O2p and Cu3d.
To study the adsorption reaction between Cu/ZnO and SO2 and H2S molecules, a model for the adsorption of SO2 and H2S gases on the surface of Cu/ZnO was established and geometrically optimized to obtain a stable structure as shown in Figure 13. Figure 13a,b shows the optimized structural models for SO2 and H2S gas adsorption, respectively.
The adsorption distance, adsorption energy and charge transfer are shown in the Table 3 below, from which it can be seen that the adsorption distance of H2S is significantly reduced compared to pure ZnO by only 0.976 Å. It is found that the adsorption energy of H2S adsorbed on the Cu/ZnO crystal plane is the largest at −2.2152 eV, which is a stronger chemisorption. In terms of charge transfer, H2S adsorption on the Cu/ZnO crystal faces showed the highest charge transfer, further implying that Cu/ZnO would show a higher sensitivity to H2S. Comparing the experimental data, CuO/ZnO showed the highest sensitivity for testing H2S gas. The simulation results agree with the experimental results.
To further investigate the adsorption mechanism, this section calculates the electronic density of states before and after the adsorption of the Cu/ZnO model [48]. As shown in the Figure 14 below, it can be seen from the graph that the total density of states changes very little after adsorption with Cu/ZnO and SO2, producing island peaks at the end of the valence band, between the band gaps. In the adsorption of H2S gas, it can be found that the total density of states shifts to the left, indicating a significant reduction in the energy of the system.
To further investigate the sensitivity of Cu/ZnO to SO2 and H2S gases, HOMO and LUMO calculations were conducted. As shown in the Table 4 below, the energy gap value of Cu/ZnO decreases after adsorption of both gases, and the energy gap value of SO2 gas does not decrease much, which means that the SO2 gas molecules do not improve the electron transfer ability of Cu/ZnO surface significantly. The adsorption of H2S gas shows a significant reduction in the energy gap value, which is macroscopically reflected in the significant change in material resistance and increased sensitivity of Cu/ZnO after exposure to H2S gas. Figure 15 shows the visualized HOMO, LUMO diagram after adsorption. For the SO2 adsorption system, the HOMO is mainly distributed on the matrix Cu atoms. For the H2S adsorption system, HOMO is distributed on both gas molecules and Cu atoms. The LUMO distribution is uniform for both systems.
The model adsorption of SO2 and H2S gas is manifested as chemisorption. From the analysis of adsorption energy and charge transfer amount, H2S adsorption and Cu/ZnO adsorption energy is the largest, and the charge transfer amount is the most, corresponding to the fact that the experimental part of CuO/ZnO sensors’ operating temperature is significantly lower when testing H2S, and the sensitivity is significantly increased. The simulation results are in agreement with the experimental results, indicating that the established simulation model can be used to explain the gas-sensitive mechanism of CuO/ZnO for SO2 and H2S gases.

5. Conclusions

In conclusion, a fiber-like p-CuO/n-ZnO gas sensor was successfully developed for detecting two decomposition byproducts of SF6 (H2S and SO2). The nanomaterials were prepared by the electrospinning method, then characterized by XRD, SEM, TEM, EDS and BET. The gas sensing test results showed that the prepared sensors exhibit higher responses and faster response times and recovery times to H2S gas than SO2 in the same experimental conditions. The best capability of the prepared sensing materials to detect 5 ppm H2S was 11.65 at 200 °C. The ideal linear relationship between low concentration and response of target gases indicated the potential applications of the p-CuO/n-ZnO gas sensor to detect low concentrations of H2S and SO2. The mechanism can be explained by oxygen adsorption–desorption and the formation of p-n heterojunction. The formation of highly conductive CuS leads to more enhanced H2S gas properties, compared to SO2. The calculation method based on first principles uses the Dmol3 module of the Materials Studio software to calculate the cell structure and density of states of Cu/ZnO, and to construct a model for the adsorption of SO2 and H2S gas molecules by Cu/ZnO. The simulation results are in good agreement with the experimental results, indicating that the established simulation model can be used to explain the gas-sensitive mechanism of ZnO on SO2 and H2S gases. The current results indicated that the fiber-like CuO/ZnO nanomaterials can be effective gas-sensitive mechanisms for the detection of H2S and SO2.

Author Contributions

Conceptualization, X.C., Z.L. and Q.Z.; methodology, X.C., Z.L. and Q.Z.; validation, Z.W. and W.Z.; investigation, X.C. and Z.W.; resources, W.Z.; data curation, Q.Z.; writing—original draft preparation, X.C.; writing—review and editing, X.C., Q.Z. and Z.L.; visualization, W.Z.; supervision, Q.Z.; project administration, Q.Z. All authors have read and agreed to the published version of the manuscript.

Funding

This research was funded by the National Natural Science Foundation of China (Nos. 52077177 and 51507144) and the Fundamental Research Funds for the Central Universities (No. XDJK2019B021).

Institutional Review Board Statement

Not applicable.

Informed Consent Statement

Not applicable.

Data Availability Statement

The data presented in this study are contained within the article.

Conflicts of Interest

The authors declare no conflict of interest.

References

  1. Chen, J.; Zhou, Q.; Jia, L.; Cui, X.; Zeng, W. The gas-sensing mechanism of Pt3 cluster doped SnS2 monolayer for SF6 decomposition: A DFT study. Appl. Surf. Sci. 2022, 597, 153693. [Google Scholar] [CrossRef]
  2. Li, Z.; Jia, L.; Chen, J.; Cui, X.; Zeng, W.; Zhou, Q. Ag-modified hexagonal GaN monolayer as an innovative gas detector toward SF6 decomposed species: Insights from the first-principles computations. Appl. Surf. Sci. 2022, 589, 153000. [Google Scholar] [CrossRef]
  3. Gao, X.; Zhou, Q.; Wang, J.; Xu, L.; Zeng, W. DFT study on the selective adsorption properties of modified graphene for SF6 decompositions. IEEE Sens. J. 2021, 21, 3193–3200. [Google Scholar] [CrossRef]
  4. Chu, J.; Wang, Q.; Liu, Y.; Pan, J.; Yuan, H.; Yang, A.; Wang, X.; Rong, M. Fault Diagnosis of SF6-insulated Equipment by Micro Gas Sensor Array. IEEE Trans. Power Deliv. 2022, 1–9. [Google Scholar] [CrossRef]
  5. Chu, J.; Li, W.; Yang, X.; Wu, Y.; Wang, D.; Yang, A.; Yuan, H.; Wang, X.; Li, Y.; Rong, M. Identification of gas mixtures via sensor array combining with neural networks. Sens. Actuators B Chem. 2021, 329, 129090. [Google Scholar] [CrossRef]
  6. Luo, J.; Fang, Y.H.; Su, Z.X.; Li, D.C.; Zhao, Y.D.; Wang, A.J.; Wu, J.; Cui, F.X.; Li, Y.Y. The research of temperature properties of photoacoustic spectroscopy detection for SF6 decomposition products in gas insulated switchgear. Anal. Methods 2015, 7, 3806–3813. [Google Scholar] [CrossRef]
  7. Jong, E.C.; Macek, P.V.; Perera, I.E.; Luxbacher, K.D.; McNair, H.M. An Ultra-Trace Analysis Technique for SF6 Using Gas Chromatography with Negative Ion Chemical Ionization Mass Spectrometry. J. Chromatogr. Sci. 2015, 53, 854–859. [Google Scholar] [CrossRef] [PubMed] [Green Version]
  8. Dong, M.; Zhang, C.; Ren, M.; Albarracín, R.; Ye, R. Electrochemical and Infrared Absorption Spectroscopy Detection of SF6 Decomposition Products. Sensors 2017, 17, 2627. [Google Scholar] [CrossRef] [Green Version]
  9. Wang, M.; Zhou, Q.; Zeng, W. Theoretical study on adsorption of SF6 decomposition gas in GIS gas cell based on intrinsic and Ni-doped MoTe2 monolayer. Appl. Surf. Sci. 2022, 591, 153167. [Google Scholar] [CrossRef]
  10. Li, B.; Zhou, Q.; Peng, R.; Liao, Y.; Zeng, W. Adsorption of SF6 decomposition gases (H2S, SO2, SOF2 and SO2F2) on Sc-doped MoS2 surface: A DFT study. Appl. Surf. Sci. 2021, 549, 149271. [Google Scholar] [CrossRef]
  11. Zhang, X.; Dong, X.; Gui, Y. Theoretical and experimental study on competitive adsorption of SF6 decomposed components on Au-modified anatase (101) surface. Appl. Surf. Sci. 2016, 387, 437–445. [Google Scholar] [CrossRef]
  12. Zhang, X.; Zhang, J.; Jia, Y.; Xiao, P.; Tang, J. TiO2 Nanotube Array Sensor for Detecting the SF6 Decomposition Product SO2. Sensors 2012, 12, 3302–3313. [Google Scholar] [CrossRef]
  13. Liu, C.; Zhao, L.; Wang, B.; Sun, P.; Wang, Q.; Gao, Y.; Liang, X.; Zhang, T.; Lu, G. Acetone gas sensor based on NiO/ZnO hollow spheres: Fast response and recovery, and low (ppb) detection limit. J. Colloid Interface Sci. 2017, 495, 207–215. [Google Scholar] [CrossRef]
  14. Hou, L.; Zhang, C.; Li, L.; Du, C.; Li, X.; Kang, X.-F.; Chen, W. CO gas sensors based on p-type CuO nanotubes and CuO nanocubes: Morphology and surface structure effects on the sensing performance. Talanta 2018, 188, 41–49. [Google Scholar] [CrossRef]
  15. Zhou, Q.; Chen, W.; Xu, L.; Kumar, R.; Gui, Y.; Zhao, Z.; Tang, C.; Zhu, S. Highly sensitive carbon monoxide (CO) gas sensors based on Ni and Zn doped SnO2 nanomaterials. Ceram. Int. 2018, 44, 4392–4399. [Google Scholar] [CrossRef]
  16. Bai, S.; Fu, H.; Zhao, Y.; Tian, K.; Luo, R.; Li, D.; Chen, A. On the construction of hollow nanofibers of ZnO-SnO2 heterojunctions to enhance the NO2 sensing properties. Sens. Actuators B Chem. 2018, 266, 692–702. [Google Scholar] [CrossRef]
  17. Luo, L.; Xu, W.; Xia, Z.; Fei, Y.; Zhu, J.; Chen, C.; Lu, Y.; Wei, Q.; Qiao, H.; Zhang, X. Electrospun ZnO–SnO2 composite nanofibers with enhanced electrochemical performance as lithium-ion anodes. Ceram. Int. 2016, 42, 10826–10832. [Google Scholar] [CrossRef]
  18. Zhu, L.; Li, Y.; Zeng, W. Enhanced ethanol sensing and mechanism of Cr-doped ZnO nanorods: Experimental and computational study. Ceram. Int. 2017, 43, 14873–14879. [Google Scholar] [CrossRef]
  19. Kong, M.; Liu, Q.C.; Zhu, B.H.; Yang, J.; Li, L.; Zhou, Q.; Ren, S. Synergy of KCl and Hg-el on selective catalytic reduction of NO with NH3 over V2O5-WO3/TiO2 catalysts. Chem. Eng. J. 2015, 264, 815–823. [Google Scholar] [CrossRef]
  20. Long, H.; Zeng, W.; Zhang, H. Synthesis of WO3 and its gas sensing: A review. J. Mater. Sci. Mater. Electron. 2015, 26, 4698–4707. [Google Scholar] [CrossRef]
  21. Hu, X.; Zhu, Z.; Chen, C.; Wen, T.; Zhao, X.; Xie, L. Highly sensitive H2S gas sensors based on Pd-doped CuO nanoflowers with low operating temperature. Sens. Actuators B Chem. 2017, 253, 809–817. [Google Scholar] [CrossRef]
  22. Choi, S.-W.; Park, J.Y.; Kim, S.S. Growth behavior and sensing properties of nanograins in CuO nanofibers. Chem. Eng. J. 2011, 172, 550–556. [Google Scholar] [CrossRef]
  23. Wang, J.; Zhou, Q.; Wei, Z.; Xu, L.; Zeng, W. Experimental and theoretical studies of Zn-doped MoO3 hierarchical microflower with excellent sensing performances to carbon monoxide. Ceram. Int. 2020, 46, 29222–29232. [Google Scholar] [CrossRef]
  24. Gao, X.; Li, Y.; Zeng, W.; Zhang, C.; Wei, Y. Hydrothermal synthesis of agglomerating TiO2 nanoflowers and its gas sensing. J. Mater. Sci. Mater. Electron. 2017, 28, 18781–18786. [Google Scholar] [CrossRef]
  25. Wang, Y.; Wu, T.; Zhou, Y.; Meng, C.; Zhu, W.; Liu, L. TiO2-Based Nanoheterostructures for Promoting Gas Sensitivity Performance: Designs, Developments, and Prospects. Sensors 2017, 17, 1971. [Google Scholar] [CrossRef]
  26. Zhou, Q.; Xu, L.; Umar, A.; Chen, W.; Kumar, R. Pt nanoparticles decorated SnO2 nanoneedles for efficient CO gas sensing applications. Sens. Actuators B Chem. 2018, 256, 656–664. [Google Scholar] [CrossRef]
  27. Zhou, Q.; Zeng, W.; Chen, W.G.; Xu, L.N.; Kumar, R.; Umar, A. High sensitive and low-concentration sulfur dioxide (SO2) gas sensor application of heterostructure NiO-ZnO nanodisks. Sens. Actuators B Chem. 2019, 298, 126870. [Google Scholar] [CrossRef]
  28. Yan, S.; Ma, S.; Li, W.; Xu, X.; Cheng, L.; Song, H.; Liang, X. Synthesis of SnO2–ZnO heterostructured nanofibers for enhanced ethanol gas-sensing performance. Sens. Actuators B Chem. 2015, 221, 88–95. [Google Scholar] [CrossRef]
  29. Zhang, B.; Fu, W.; Li, H.; Fu, X.; Wang, Y.; Bala, H.; Wang, X.; Sun, G.; Cao, J.; Zhang, Z. Synthesis and enhanced gas sensing properties of flower-like ZnO nanorods decorated with discrete CuO nanoparticles. Mater. Lett. 2016, 176, 13–16. [Google Scholar] [CrossRef]
  30. Qu, Z.; Fu, Y.; Yu, B.; Deng, P.; Xing, L.; Xue, X. High and fast H2S response of NiO/ZnO nanowire nanogenerator as a self-powered gas sensor. Sens. Actuators B Chem. 2016, 222, 78–86. [Google Scholar] [CrossRef]
  31. Bonyani, M.; Zebarjad, S.M.; Janghorban, K.; Kim, J.-Y.; Kim, H.W.; Kim, S.S. Au-Decorated Polyaniline-ZnO Electrospun Composite Nanofiber Gas Sensors with Enhanced Response to NO2 Gas. Chemosensors 2022, 10, 388. [Google Scholar] [CrossRef]
  32. Huang, B.; Zeng, W.; Li, Y. Synthesis of ZIF-8 Coating on ZnO Nanorods for Enhanced Gas-Sensing Performance. Chemosensors 2022, 10, 297. [Google Scholar] [CrossRef]
  33. Katoch, A.; Choi, S.-W.; Kim, J.-H.; Lee, J.H.; Lee, J.-S.; Kim, S.S. Importance of the nanograin size on the H2S-sensing properties of ZnO–CuO composite nanofibers. Sens. Actuators B Chem. 2015, 214, 111–116. [Google Scholar] [CrossRef]
  34. Qin, W.; Xu, L.; Song, J.; Xing, R.; Song, H. Highly enhanced gas sensing properties of porous SnO2–CeO2 composite nanofibers prepared by electrospinning. Sens. Actuators B Chem. 2013, 185, 231–237. [Google Scholar] [CrossRef]
  35. GB/T 8905-2012; The Guide for Management and Measuring SF6 Gas in Electrical Equipment. General Administration of Quality Supervision, Inspection and Quarantine of the People’s Republic of China: Beijing, China; Standardization Administration of the People’s Republic of China: Beijing, China, 2012.
  36. Zhou, X.; Lin, X.; Yang, S.; Zhu, S.; Chen, X.; Dong, B.; Bai, X.; Wen, X.; Geyu, L.; Song, H. Highly dispersed Metal–Organic-Framework-Derived Pt nanoparticles on three-dimensional macroporous ZnO for trace-level H2S sensing. Sens. Actuators B Chem. 2020, 309, 127802. [Google Scholar] [CrossRef]
  37. Rumyantseva, M.N.; Vladimirova, S.A.; Platonov, V.B.; Chizhov, A.S.; Batuk, M.; Hadermann, J.; Khmelevsky, N.O.; Gaskov, A.M. Sub-ppm H2S sensing by tubular ZnO-Co3O4 nanofibers. Sens. Actuators B Chem. 2020, 307, 127624. [Google Scholar] [CrossRef]
  38. Nadargi, D.Y.; Tamboli, M.S.; Patil, S.S.; Dateer, R.B.; Mulla, I.S.; Choi, H.; Suryavanshi, S.S. Microwave-Epoxide-Assisted Hydrothermal Synthesis of the CuO/ZnO Heterojunction: A Highly Versatile Route to Develop H2S Gas Sensors. ACS Omega 2020, 5, 8587–8595. [Google Scholar] [CrossRef] [Green Version]
  39. Sun, M.; Yu, H.; Dong, X.; Xia, L.; Yang, Y. Sedum lineare flower-like ordered mesoporous In2O3/ZnO gas sensing materials with high sensitive response to H2S at room temperature prepared by self-assembled of 2D nanosheets. J. Alloys Compd. 2020, 844, 156170. [Google Scholar] [CrossRef]
  40. Behera, B.; Chandra, S. An innovative gas sensor incorporating ZnO-CuO nanoflakes in planar MEMS technology. Sens. Actuators B Chem. 2016, 229, 414–424. [Google Scholar] [CrossRef]
  41. Lupan, O.; Ursaki, V.; Chai, G.; Chow, L.; Emelchenko, G.; Tiginyanu, I.; Gruzintsev, A.; Redkin, A. Selective hydrogen gas nanosensor using individual ZnO nanowire with fast response at room temperature. Sens. Actuators B Chem. 2010, 144, 56–66. [Google Scholar] [CrossRef]
  42. Zhang, D.Z.; Jiang, C.X.; Li, P.; Sun, Y.E. Layer-by-layer self-assembly of Co3O4 nanorod-decorated MoS2 nanosheet based nanocomposite toward high performance ammonia detection. ACS Appl. Mater. Interfaces 2017, 9, 6462–6471. [Google Scholar] [CrossRef]
  43. Liu, H.C.; Zhou, Q.; Zhang, Q.Y.; Hong, C.X.; Xu, L.N.; Jin, L.F.; Chen, W.G. Synthesis, characterization and enhanced sensing properties of a NiO/ZnO p-n junctions sensor for the SF6 decomposition byproducts SO2, SO2F2, and SOF2. Sensors 2017, 17, 913. [Google Scholar] [CrossRef] [PubMed] [Green Version]
  44. Li, D.; Qin, L.; Zhao, P.; Zhang, Y.; Liu, D.; Liu, F.; Kang, B.; Wang, Y.; Song, H.; Zhang, T.; et al. Preparation and gas-sensing performances of ZnO-CuO rough nanotubular arrays for low-working temperature H2S detection. Sens. Actuators B Chem. 2018, 254, 834–841. [Google Scholar] [CrossRef]
  45. Park, S.; Kim, S.; Kheel, H.; Hyun, S.K.; Jin, C.; Lee, C. Enhanced H2S gas sensing performance of networked CuO-ZnO composite nanoparticle sensor. Mater. Res. Bull. 2016, 82, 130–135. [Google Scholar] [CrossRef]
  46. Vuong, N.M.; Chinh, N.D.; Huy, B.T.; Lee, Y.I. CuO-Decorated ZnO Hierarchical nanostructures as efficient and established sensing materials for H2S gas sensors. Sci. Rep. 2016, 6, 26736. [Google Scholar] [CrossRef] [PubMed] [Green Version]
  47. Liu, Y.; Zhou, Q.; Mi, H.; Wang, J.; Zeng, W. Gas-sensing mechanism of Cr doped SnP3 monolayer to SF6 partial discharge decomposition components. Appl. Surf. Sci. 2021, 546, 149084. [Google Scholar] [CrossRef]
  48. Li, Z.; Liao, Y.; Liu, Y.; Zeng, W.; Zhou, Q. Room temperature detection of nitrogen dioxide gas sensor based on Pt-modified MoSe2 nanoflowers: Experimental and theoretical analysis. Appl. Surf. Sci. 2023, 610, 155527. [Google Scholar] [CrossRef]
Figure 1. Structure of the planar-type gas sensor.
Chemosensors 11 00058 g001
Figure 2. XRD pattern of CuO/ZnO nanomaterials.
Chemosensors 11 00058 g002
Figure 3. SEM images (a,b) and TEM images (c,d) of the synthesized CuO/ZnO nanomaterials.
Chemosensors 11 00058 g003
Figure 4. EDS spectrum of the synthesized fiber-like CuO/ZnO.
Chemosensors 11 00058 g004
Figure 5. (a) N2 adsorption−desorption isotherm and (b) the corresponding BJH pore size distribution of the synthesized CuO/ZnO nanomaterials.
Chemosensors 11 00058 g005
Figure 6. (a) Response and (b) the response time of the fabricated p-CuO/n-ZnO sensor to 50 ppm H2S and SO2 at different operating temperatures.
Chemosensors 11 00058 g006
Figure 7. (a) Responses of the fabricated p-CuO/n-ZnO sensor to various concentrations of H2S and SO2 at their optimal working temperatures and (b) response value to 1–100 ppm H2S and SO2.
Chemosensors 11 00058 g007
Figure 8. Dynamic sensing curves of the fabricated CuO/ZnO gas sensor to (a) H2S and (b) SO2 at their optimal working temperatures.
Chemosensors 11 00058 g008
Figure 9. Response and recovery times of the fabricated CuO/ZnO gas sensor to different concentrations of H2S and SO2 gas.
Chemosensors 11 00058 g009
Figure 10. Sensing mechanism of p−CuO/n−ZnO nanomaterials.
Chemosensors 11 00058 g010
Figure 11. Cu substituted surface layer Zn atom ZnO cell model (a) side view (b) top view.
Chemosensors 11 00058 g011
Figure 12. The energy band structure and DOS of Cu/ZnO model. (a) Band structure; (b) TDOS; (c) PDOS; (d) PDOS−Cu; (e) PDOS−Zn; (f) PDOS−O.
Chemosensors 11 00058 g012aChemosensors 11 00058 g012b
Figure 13. Adsorption structures of (a) SO2 and (b) H2S on the intrinsic Cu/ZnO (0001).
Chemosensors 11 00058 g013
Figure 14. Total density of states of the system before and after adsorption (a) SO2 adsorption Cu/ZnO (b) H2S adsorption Cu/ZnO.
Chemosensors 11 00058 g014
Figure 15. The HOMO and LUMO of Cu/ZnO after adsorbing SO2, H2S. (a) SO2-HOMO; (b) SO2-LUMO; (c) H2S-HOMO; (d) H2S-LUMO.
Chemosensors 11 00058 g015
Table 1. Atomic and weight ratios of the synthesized fiber-like CuO/ZnO.
ElementNorm. C [wt%]Atom. C [at.%]
C3.3612.48
O13.3137.15
Zn65.3944.65
Cu17.945.72
Table 2. Comparison of H2S gas sensing performance of this work and other material.
MaterialResponseT (°C)ConcentrationRef.
Pt/ZnO51.232020 ppm[36]
Co3O4/ZnO CuO/ZnO1.82700.2 ppm[37]
In2O3/ZnO1.925025 ppm[38]
Ni/ZnO10.225100 ppm[39]
CuO/ZnO nanofibers11.352005 ppmthis work
Table 3. Parameters of SO2 and H2S adsorbed on the surface of Cu/ZnO (0001) model.
GasAdsorption Distance ÅAdsorption Energy (eV)Charge Transfer (e)
SO22.172−1.2217−0.248
H2S0.976−2.21520.322
Table 4. The HOMO and LUMO values of Cu/ZnO after adsorbing SO2, H2S.
Adsorption SystemsHOMO (ha)LUMO (ha)Energy Gap (eV)
Cu/ZnO−0.160075−0.1155941.2104
Cu/ZnO/SO2−0.165323−0.1211761.2013
Cu/ZnO/H2S−0.153723−0.110191.1846
Disclaimer/Publisher’s Note: The statements, opinions and data contained in all publications are solely those of the individual author(s) and contributor(s) and not of MDPI and/or the editor(s). MDPI and/or the editor(s) disclaim responsibility for any injury to people or property resulting from any ideas, methods, instructions or products referred to in the content.

