Article

Specific and Sensitive Determination of Folic Acid by Label-Free Chemosensors with Microscope Glass Slips as Single-Use Consumables

by
Denis O. Novichikhin
1,2,
Alexey V. Orlov
1,
Maxim L. Antopolsky
1,
Sergey L. Znoyko
1 and
Petr I. Nikitin
1,2,*
1
Prokhorov General Physics Institute of the Russian Academy of Sciences, 38 Vavilov Street, 119991 Moscow, Russia
2
Moscow Engineering Physics Institute, National Research Nuclear University MEPhI, 31 Kashirskoe Shosse, 115409 Moscow, Russia
*
Author to whom correspondence should be addressed.
Chemosensors 2023, 11(1), 17; https://doi.org/10.3390/chemosensors11010017
Submission received: 22 November 2022 / Revised: 19 December 2022 / Accepted: 21 December 2022 / Published: 24 December 2022
(This article belongs to the Special Issue Application and Advance of Optical Immunosensors)

Abstract

:
Folic acid (FA) and its other forms known as folates are small molecules vital for humans. The high demand for increasingly sensitive methods of measuring folate concentrations is due to the fact that abnormal levels of FA cause severe health disorders. Besides, folates are used as recognition molecules in targeted drug delivery. The majority of FA measuring techniques are rather expensive, laborious, sometimes not sufficiently sensitive and specific, and often employ consumables that are too costly to be single-use for routine medical diagnostics. Here, we present a procedure for transformation of a simple microscope cover glass slip without deposition of any metal or dielectric films into a cost-efficient chemosensor chip interrogated by spectral correlation interferometry for highly sensitive measurements of the concentration of small molecules, as well as a feasibility study of long-term monitoring of such molecules in a flow mode. The obtained chips were tested for folate detection. The highly specific and sensitive measurements can be performed in real-time in a wide dynamic range of 0.9–220,000 pM. The developed method and single-use consumables are promising for concentration measurements of low molecular weight substances in pharmaceuticals and in vitro diagnostics.

1. Introduction

Folic acid (FA), along with its other forms known as vitamins B9, B11, and M, cumulatively called folates, are small molecules vital for humans. They are involved in many key processes in the organism: protein metabolism, DNA/RNA formation, production of healthy red blood cells, and many others [1,2,3]. The folate deficiency is associated with severe diseases such as neural tube defects in newborns, cardiovascular disorders, cognitive dysfunction in aging, etc. [4,5,6]. Besides, FAs are often used as recognition molecules for binding with membrane proteins of cancer cells for development of targeting drug delivery techniques [7,8,9,10,11,12]. Thus, there is a need for development of increasingly sensitive methods for measuring folate concentrations.
Microbiological assays have been the “gold standard” for FA determination since the 1930s [13,14] but now they are mostly replaced by faster and less laborious protein-binding competitive assays [15]. After identification of the folate-binding protein (FBP), one of the first developed methods was a radioisotopic assay by Waxman et al. [16]. The FBP-based assays used today offer rapid analysis at a relatively low cost.
A more comprehensive analysis with better selectivity is provided by techniques based on gas or liquid chromatography; some of them, combined with mass spectrometry, are popular for FA measurements, e.g., in formulations containing other water-soluble vitamins or nutritional supplements. However, depending on the detection principle, these methods are either not sensitive enough or too labor-intensive [17,18,19,20,21,22]. These methods require expensive equipment and qualified personnel. Other techniques for FA measurements, such as colorimetric [23], flow injection chemiluminescence [24], and fluorimetric [25,26] ones, are rather costly and require expertise in operating the equipment.
FA in various samples is often detected by surface plasmon resonance (SPR) transducers with the use of biorecognition molecules [27,28,29]. This label-free chemosensing method features high sensitivity [30,31,32]. SPR is performed by registration of a spatial or spectral shift of the minimum of light reflection from a chip that carries a precisely deposited gold film, on the surface of which specific biomolecular reactions occur [33,34,35]. The phase SPR offers a particularly high sensitivity by registration of the stepwise behavior of the reflected wave phase at the point of minimal reflection of light [36]. At the same time, SPR strongly depends on the refractive index n of a solution and, therefore, upon n(T) (as Δn = 10−4 per 1 °C), as well as on the solution density related to salt concentration of buffers [37]. Hence, the method needs bulky hardware for thermal stabilization and compensation of significant jumps in sensorgrams caused by changes of buffer solutions. Besides, commercially available SPR chips are rather expensive for use in routine medical diagnostics that require single-use consumables. Highly specific and sensitive chemosensors for measurements of concentration of folic acid based on affordable consumables is still an important task.
Here, we present a novel label-free optical chemosensor for specific and sensitive determination of folic acid. As single-use consumables, we use microscope cover glass slips without deposition of any metal or dielectric films. The glass slips are transformed into cost-efficient chemosensor chips interrogated by the spectral correlation interferometry (SCI) [38,39]. The developed SCI-based real-time chemosensor provides a wide dynamic range of 0.9–220,000 pM that covers the whole physiological range of FA concentrations [40,41,42,43]. An option of long-term operation of the chemosensor is demonstrated by continuous detection of folic acid in flow mode. The developed sensor and single-use consumables are promising for measurements of concentrations of low molecular weight substances in pharmaceuticals and in vitro diagnostics.

2. Materials and Methods

2.1. Materials

Microscope cover glass slips, (3-aminopropyl)triethoxysilane (APTES), N-(3-dimethylaminopropyl)-N-ethylcarbodiimide hydrochloride (EDC), bovine serum albumin (BSA), N-hydroxysuccinimide (NHS), succinic anhydride, folic acid (FA), and 2-(N-morpholino)ethanesulfonic acid (MES) were purchased from Sigma Aldrich (Burlington, MA, USA); sulfuric acid, methanol, dimethylformamide (DMF), 2-propanol, phosphate-buffered saline (PBS) buffer (0.1 M, pH 7.4), hydrogen peroxide, gelatin, dimethyl sulfoxide (DMSO), and borate buffer were products from Chimmed (Moscow, Russian Federation). FA antibodies were obtained from the Research Center of Molecular Diagnostics and Therapy (Moscow, Russian Federation).

2.2. Instrument Based on the Spectral Correlation Interferometry

Biosensors based on the spectral correlation interferometry, previously tested for label-free concentration measurements of autoantibodies in human serum and for development of new kinetics-based diagnostics of autoimmune diseases [38], were modified in this research for detection of FA and its monitoring in flow modes by competitive assay formats. The SCI principle described in detail in [38,39] allows real-time picometer-scale measurements of changes in the biolayer thickness Δd caused by biochemical reactions on recognition spots of a microscope cover glass slip surface, as well as accurate determination of binding kinetics [44]. The radiation from a superluminescent diode passes through a scanned Fabry–Pérot interferometer, reflects off a glass sensor chip, which serves as a second plane parallel interferometer, and is detected with the photodiodes or a CCD array. The optical thickness of the chip, varied due to biochemical reactions on its surface, is measured by a phase change of the correlation signals from the interference patterns between the radiation transmitted through the interferometer and that reflected from the glass surface. The SCI signals are independent of the refractive indexes of liquid samples and, therefore, do not depend on n(T) and salt content or density of buffers. The free space on the sensor chips is used as a reference channel to eliminate drifts due to possible thermal expansion of the glass slip [45].

2.3. Preparation of “Folic Acid–Gelatin” Conjugate

A solution of 7 mg of FA in 300 µL of DMSO was mixed with 2.7 mg of EDC and 50 mg of NHS, which were pre-dissolved in 200 µL of 0.1 M MES buffer. The mixture was kept at room temperature for 20 min, then 200 µL of 0.5 M borate buffer (pH 8.6) was added followed by addition of 400 µL of a 1% gelatin water solution. The reaction mixture was kept overnight at +4 °C, then the product was precipitated by 8 mL of acetone. The precipitate was separated by centrifugation (14,000 r.m., 10 min), divided into 4 equal parts, and each of them was purified as follows: 50 µL of DMSO was added to the precipitate, the suspension was sonicated, 2 mL of acetone was added, then the mixture was vortexed, and the product spun down. The procedure was repeated four times. After this, the precipitate was dissolved in 400 µL of water.

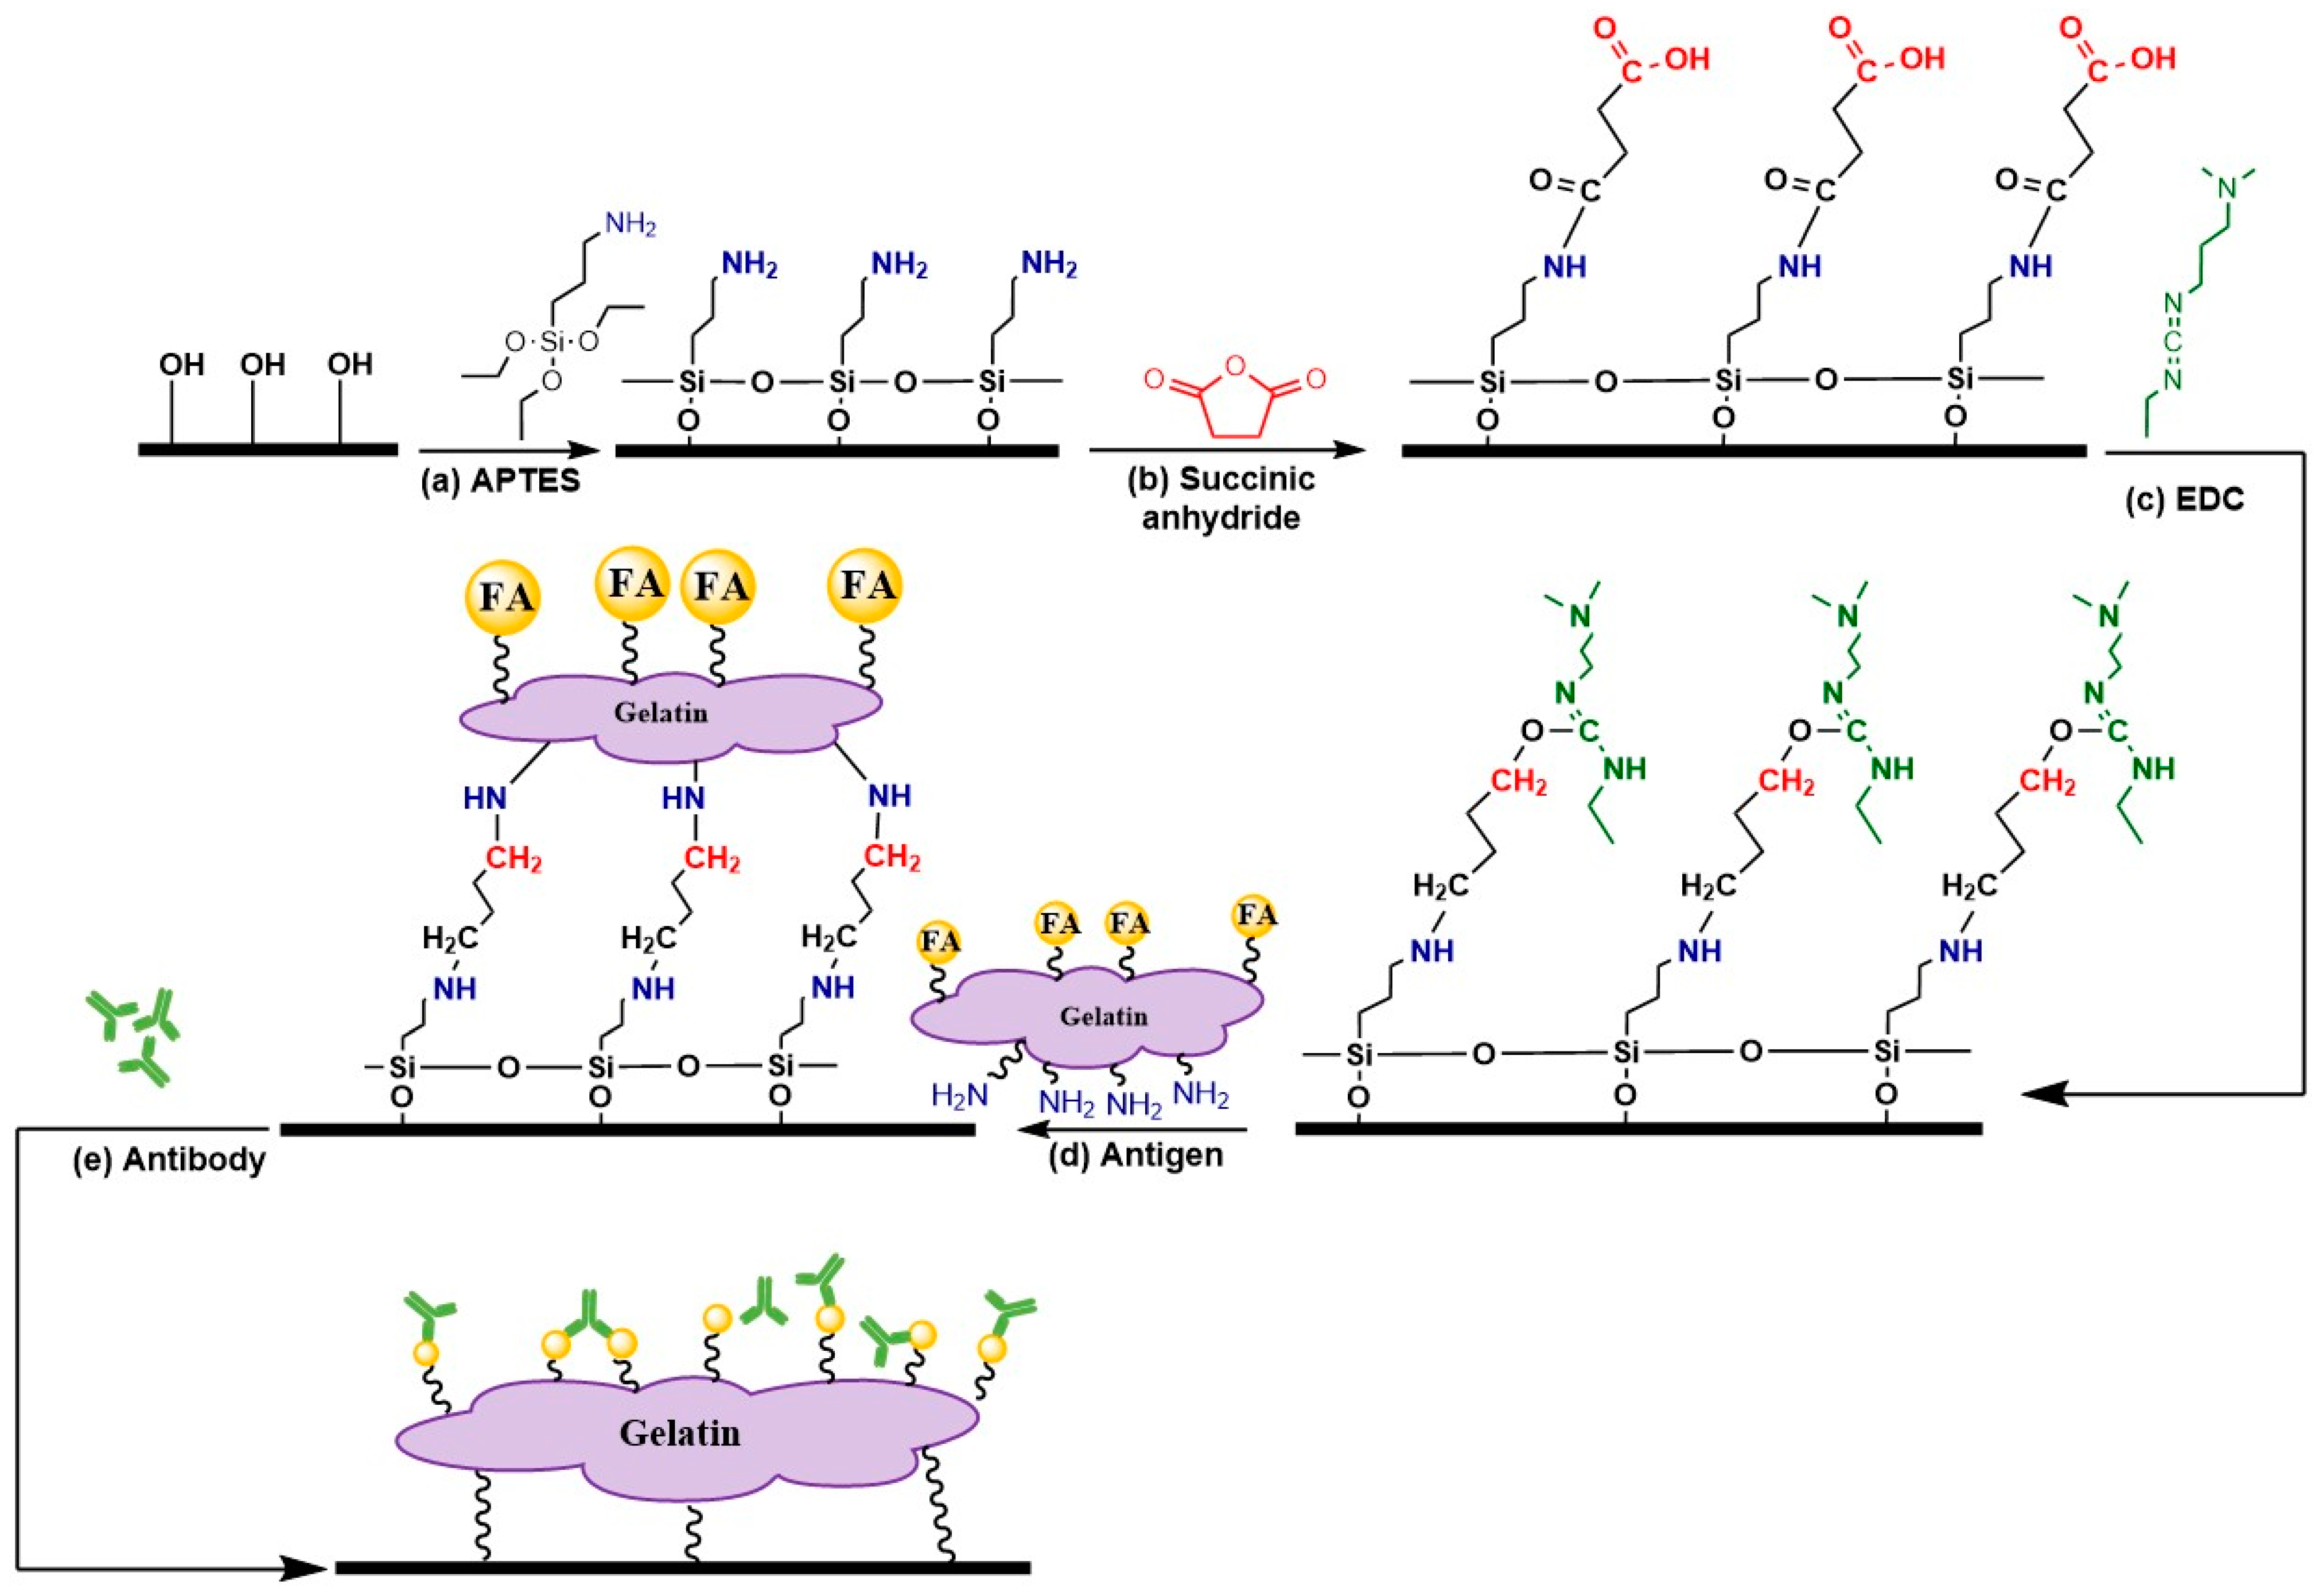
2.4. Chemical Modifications of the Sensor Chip Surface

A scheme of chemical modifications of the sensor chip surface is shown in Figure 1. Briefly, the procedure was as follows. First, we washed microscope glass cover slips with methanol followed by their 40 min treatment with a mixture of 30% hydrogen peroxide and 95% sulfuric acid (1:3 v/v) at 70 °C. Then the slips were cooled down, washed thrice with triple distilled water, and two times with methanol [46]. After that, to covalently attach to the glass surface free aliphatic amino groups, the cleaned slips were kept overnight at room temperature in a 3% solution of APTES in methanol, washed thrice with propanol-2, and dried. Then, the glass slips were kept for 2 h in a 15 mM solution of succinic anhydride in DMF at room temperature, washed three times with DMF, and dried. The thus prepared sensor chips were stored at room temperature before use. The results of SEM-based morphological characterization of the sensor chip surface are shown in Figure S1 of Supplementary Materials. Earlier, Vaughn M.W. and Wang W. showed that the APTES-based aqueous-phase deposition method produces dense flat films without visible pores with a maximum domain height of about 2 nm [47].

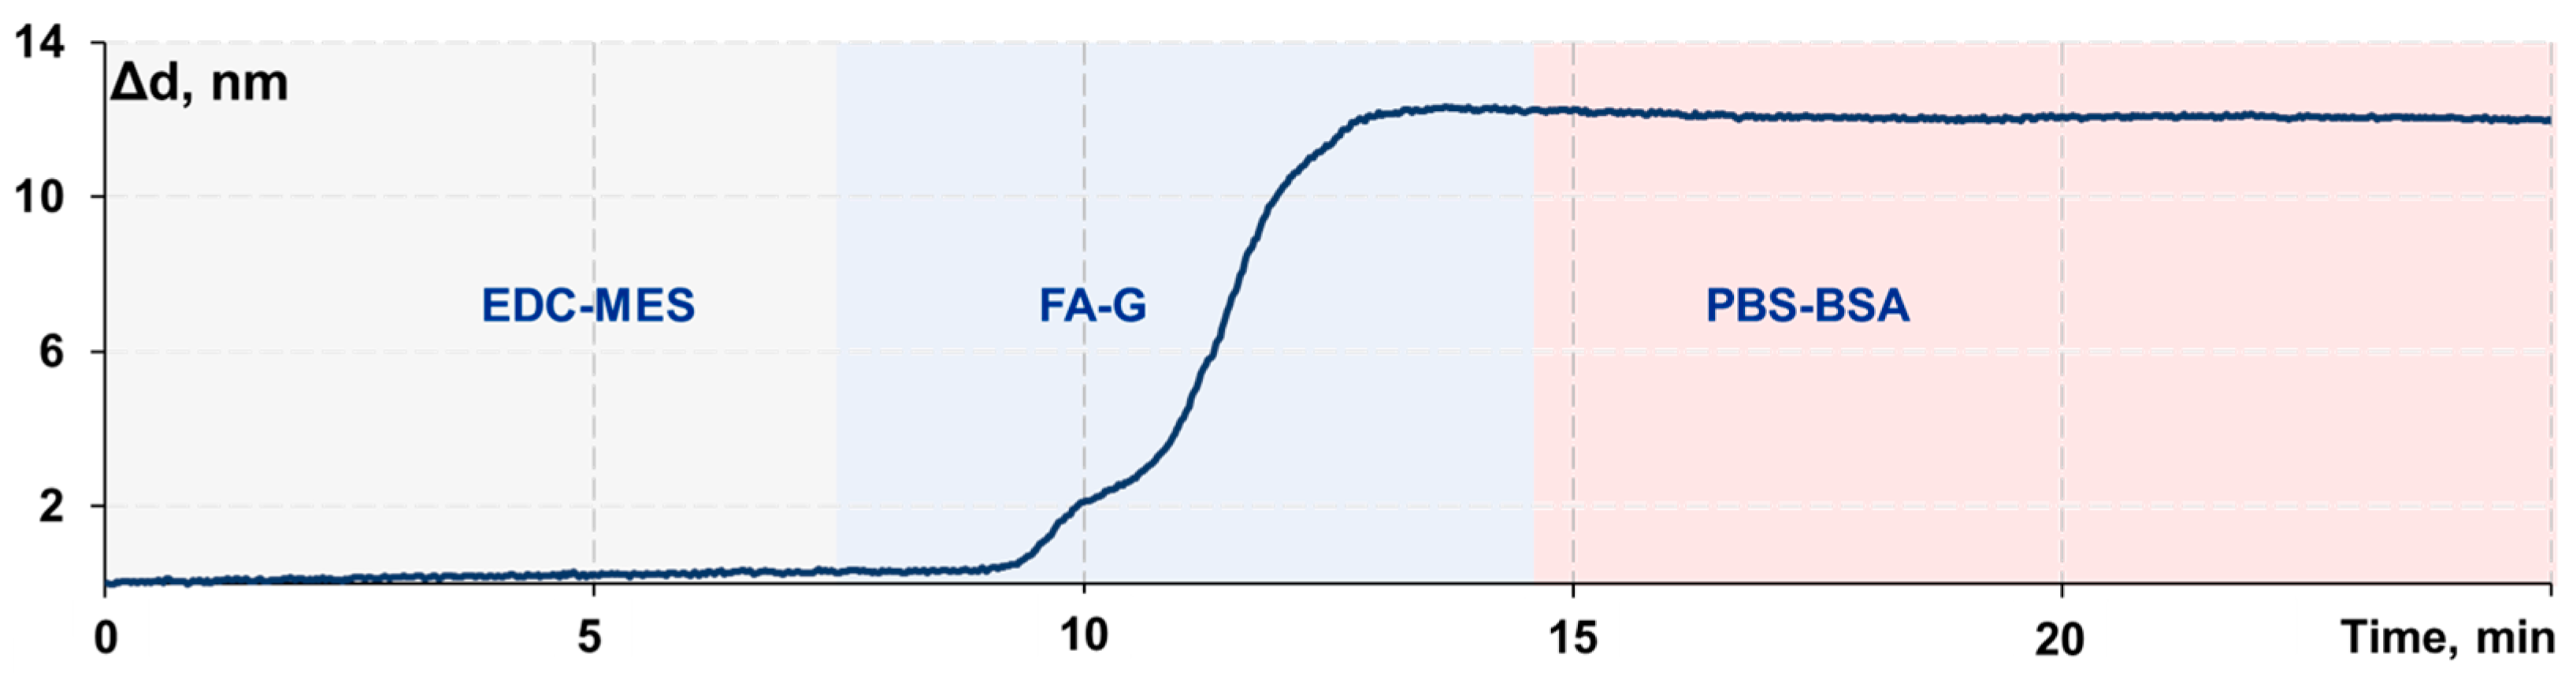
2.5. Immobilization of the “Folic Acid–Gelatin” Conjugate onto the Sensor Chip Surface

The sensor chip surface obtained as described in Section 2.4 contains free carboxyl groups. The procedure of immobilization of the “folic acid–gelatin” (FA–G) conjugate was as follows. The free carboxyl groups on the sensor chip surface were activated by passing a 6% EDC solution in 0.1 M MES buffer along it for 20 min followed by 5 min passing of 0.1 M MES buffer. After that, the FA–G conjugate was applied as a 1 mg/mL solution in PBS buffer until biolayer saturation was observed by measurements of its thickness (until the recorded sensorgram plateaued). The procedure took about 15 min. Finally, the surface was washed with a PBS-BSA buffer (10 mg/mL) for 10 min. It should be noted that the immobilization can be implemented either inside or outside the biosensor. The former is convenient for easy adjustment of the assay conditions. The latter can be done preliminarily to reduce the assay time; it also supports the method’s potential for scaling-up the production of such sensor chips.

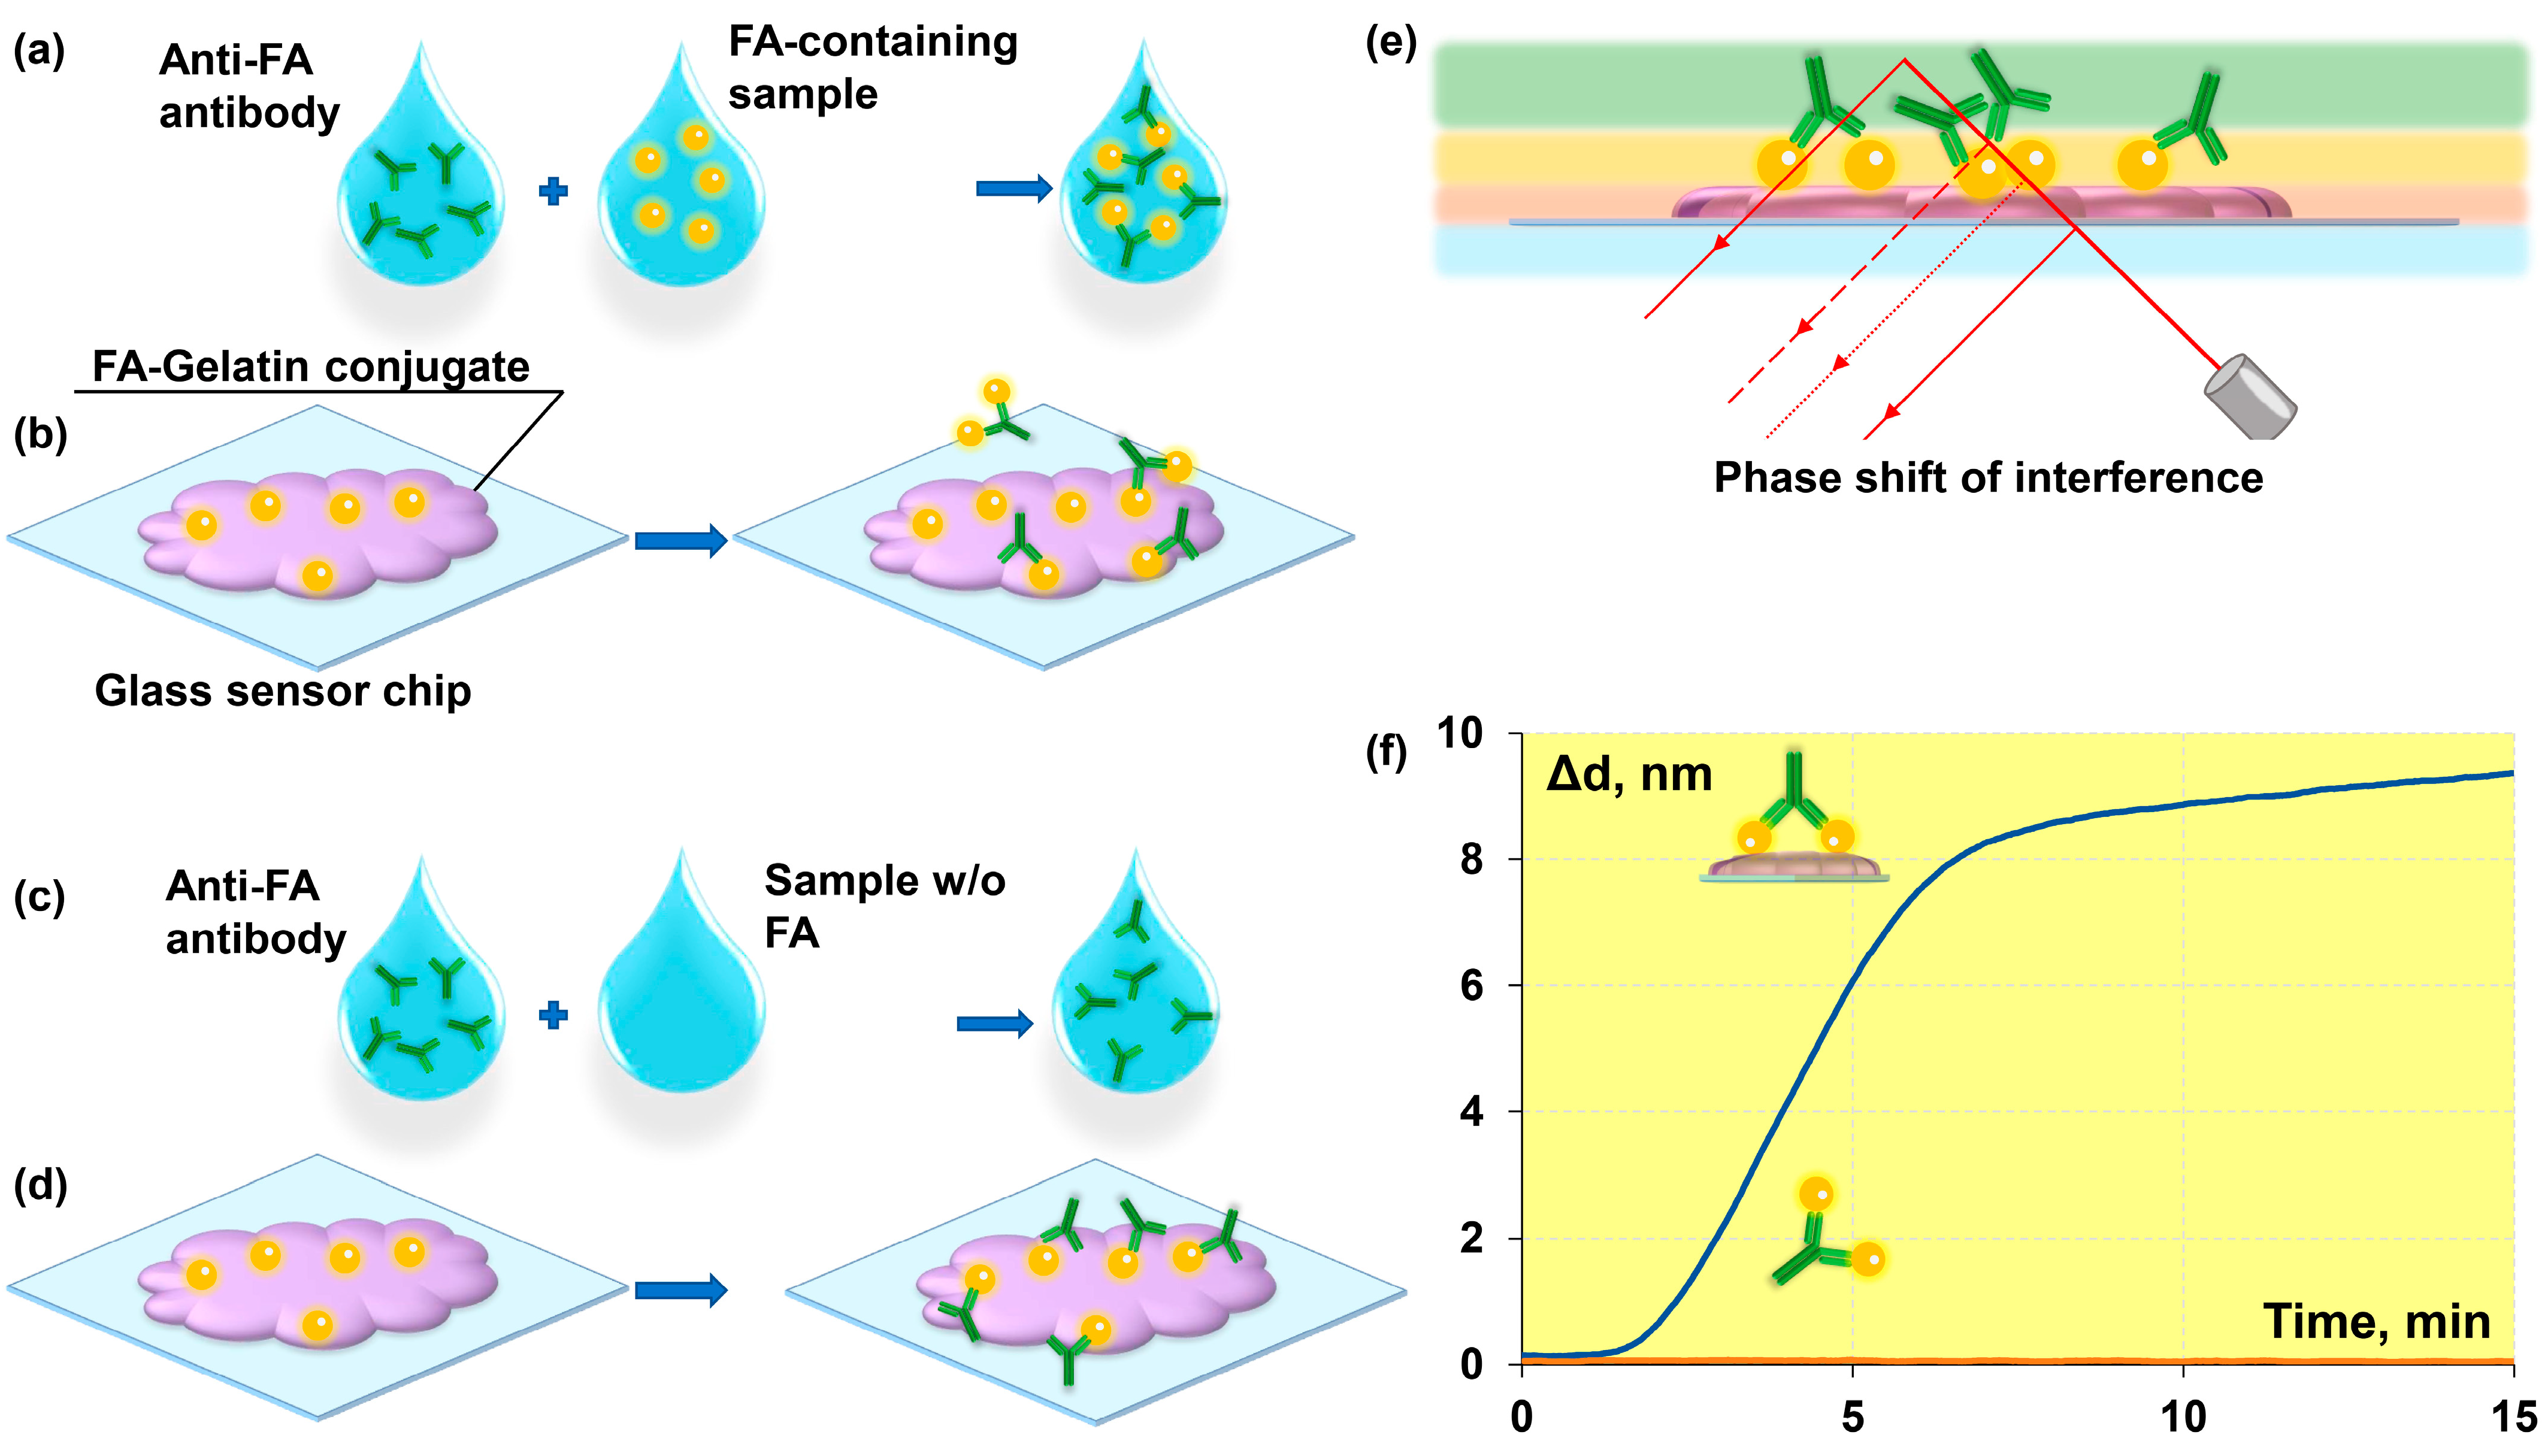
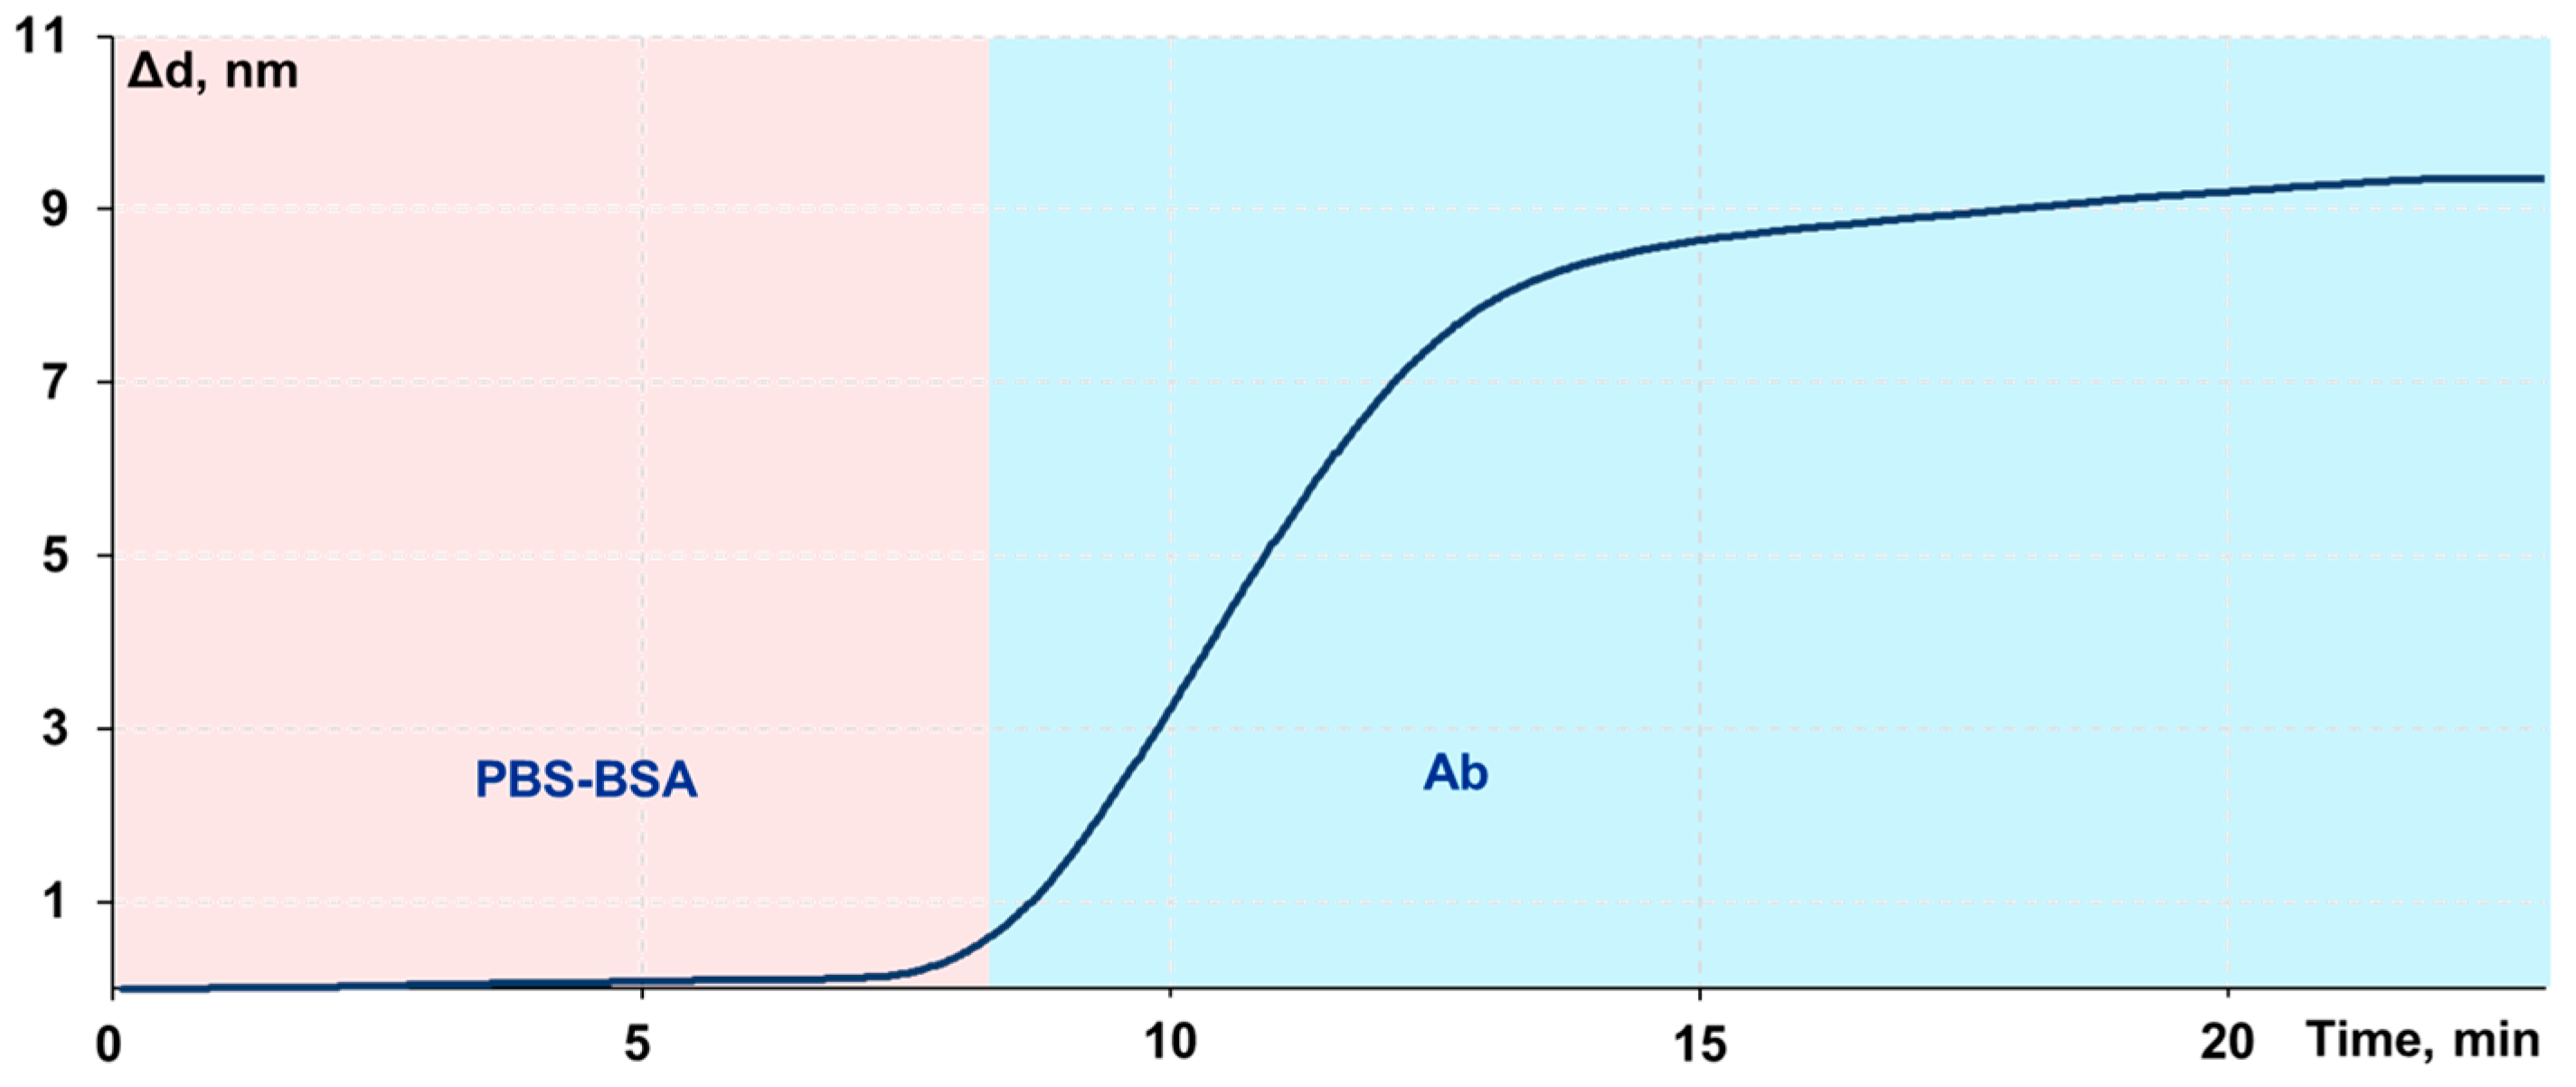
2.6. Assay Procedure

50 µL of FA antibody at different concentrations (4.66, 7, 17.5, 35, 30 µg/mL) in PBS-BSA buffer was added to the analyzed 50 µL samples, which contained different FA concentrations (22,650 pM, 4500 pM, 900 pM, 180 pM, 36 pM, 7.2 pM, 1.4 pM) or did not contain folic acid (Figure 2a,c). After 10 min incubation, the obtained solution was pumped along the sensor chip surface having immobilized FA–G conjugate (Figure 2b,d) with recording of a sensorgram Δd(t) until the biolayer thickness became stable according to the measurements by the spectral correlation interference (Figure 2e,f).
The biolayer assembly took about 15 min and was followed by washing of the surface with a 10 mg/mL BSA solution in PBS. The calibration curve for such competitive assay was obtained using a standard five-parameter logistic regression model [48]. As the negative control, we used samples without FA antibody. For the experiments with the positive control, the samples containing FA antibody but no FA antigen were applied. The assay specificity was verified using the samples, which contained, instead of folic acid, other small molecules, such as antibiotics (chloramphenicol), hormones (thyroxine), mycotoxins (ochratoxin A), or large protein molecules (PSA, cTnI, HBsAg).

2.7. Investigation of the FA Antibody Biolayer Regeneration

After assembly of the biolayer of FA antibody on the sensor chip coated with the FA–gelatin conjugate as described in Section 2.6, a solution of folic acid in PBS-BSA buffer was passed inside the SCI-based chemosensor along the sensor chip for 10 min. A decrease in the biolayer thickness was registered at each of the tested FA concentrations: 2.2 pM, 22 pM, 226 pM, 2200 pM, and 22,000 pM. After measuring at any of the concentrations, the glass chip was washed with a PBS-BSA buffer, and then the biolayer was reassembled inside the chemosensor by application for 10 min of a 10 mg/mL solution of BSA in PBS containing 70 µg/mL of FA antibody.

3. Results and Discussion

3.1. Adjustment of the Protocol of a Biolayer Assembly on the Sensor Chip Surface

At first, a standard protocol was employed for antigen attachment to the glass sensor chip surface (Figure 1a–d). All steps were carried out inside the SCI-based chemosensing system. That allowed for careful monitoring of the kinetics of each stage during the biolayer assembly. The typical sensorgram of the biolayer thickness dynamics recorded in real-time is shown in Figure 3. Such sensorgrams can be used for early identification of problems and/or inappropriate actions to correct them in further experiments. As follows from Figure 3, the procedure can be substantially shortened as soon as the signal on the experimental graph reaches a plateau. The sensorgram in Figure 3 demonstrates that after activation of carboxylic functions on the glass, the chip surface was saturated with the FA–gelatin conjugate within 10 min. The results of measurements of the contact angles of the sensor chip surface at each stage of the optimized protocol of surface functionalization are given in Table S1 of Supplementary Materials.
After the protocol adjustment, we studied the procedures of glass surface activation and FA–gelatin conjugate attachment outside the chemosensor followed by the chip conservation. In this case, the reagents were incubated directly on the chip surface. To achieve better saturation of the layer without the reagent flow along the chip surface, the total duration of incubation was increased up to 1 h. The sensor chips with thus assembled FA–gelatin conjugate on the surface were stored in a fridge at +4 °C till further analyses of the samples.
A preliminarily prepared sensor chip was installed into the SCI chemosensor, and a PBS-BSA washing buffer was passed for 5 min to register the sensorgram baseline. Then, an FA antibody solution was passed for 15 min. Figure 4 illustrates a real-time assembly of a biolayer formed by specific binding of a high-concentration (70 µg/mL) solution of FA antibody passed along the glass chip coated by the FA–gelatin conjugate.

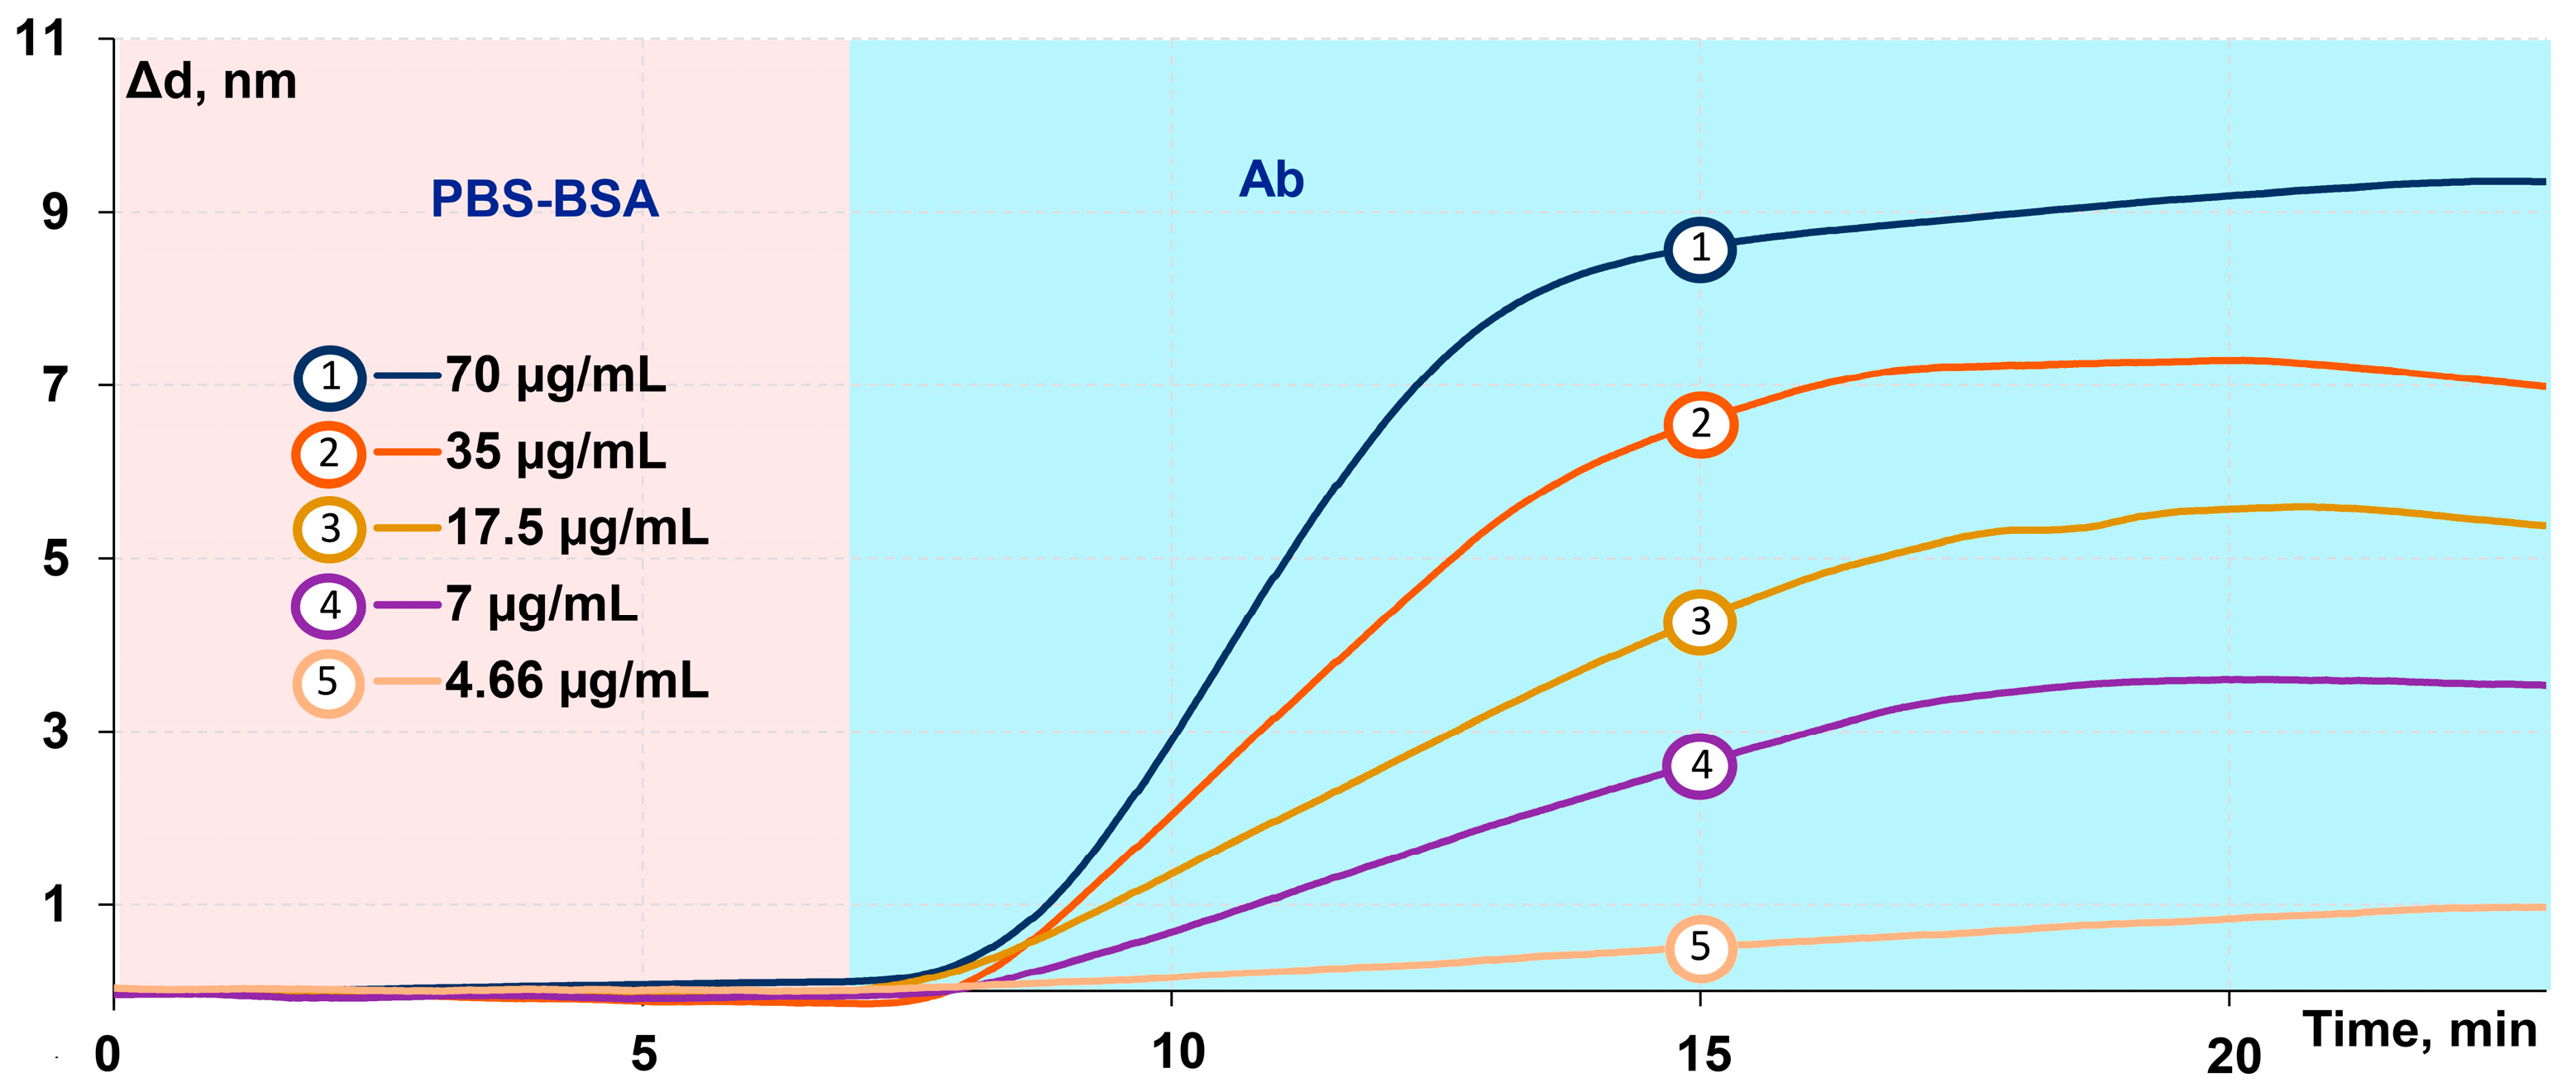
3.2. Dependence of the Biolayer Parameters on FA Antibody Concentration

The next series of experiments was devoted to determining the relationship between FA antibody concentration in a solution passed along the sensor chip and thickness of the resulting biolayer. The respective sensorgrams are presented in Figure 5.
The sensorgrams demonstrate an evident correlation between the rate of biolayer formation, its thickness, and concentration of FA antibody in the passing solutions. These data indicate that maximal antibody concentrations are desirable for larger signals but it negatively affects the limit of FA detection by decreasing the competition rate while incubation with samples having low concentration of free FA. Besides, that leads to high consumption of reagents. Therefore, an optimal compromise should be sought.

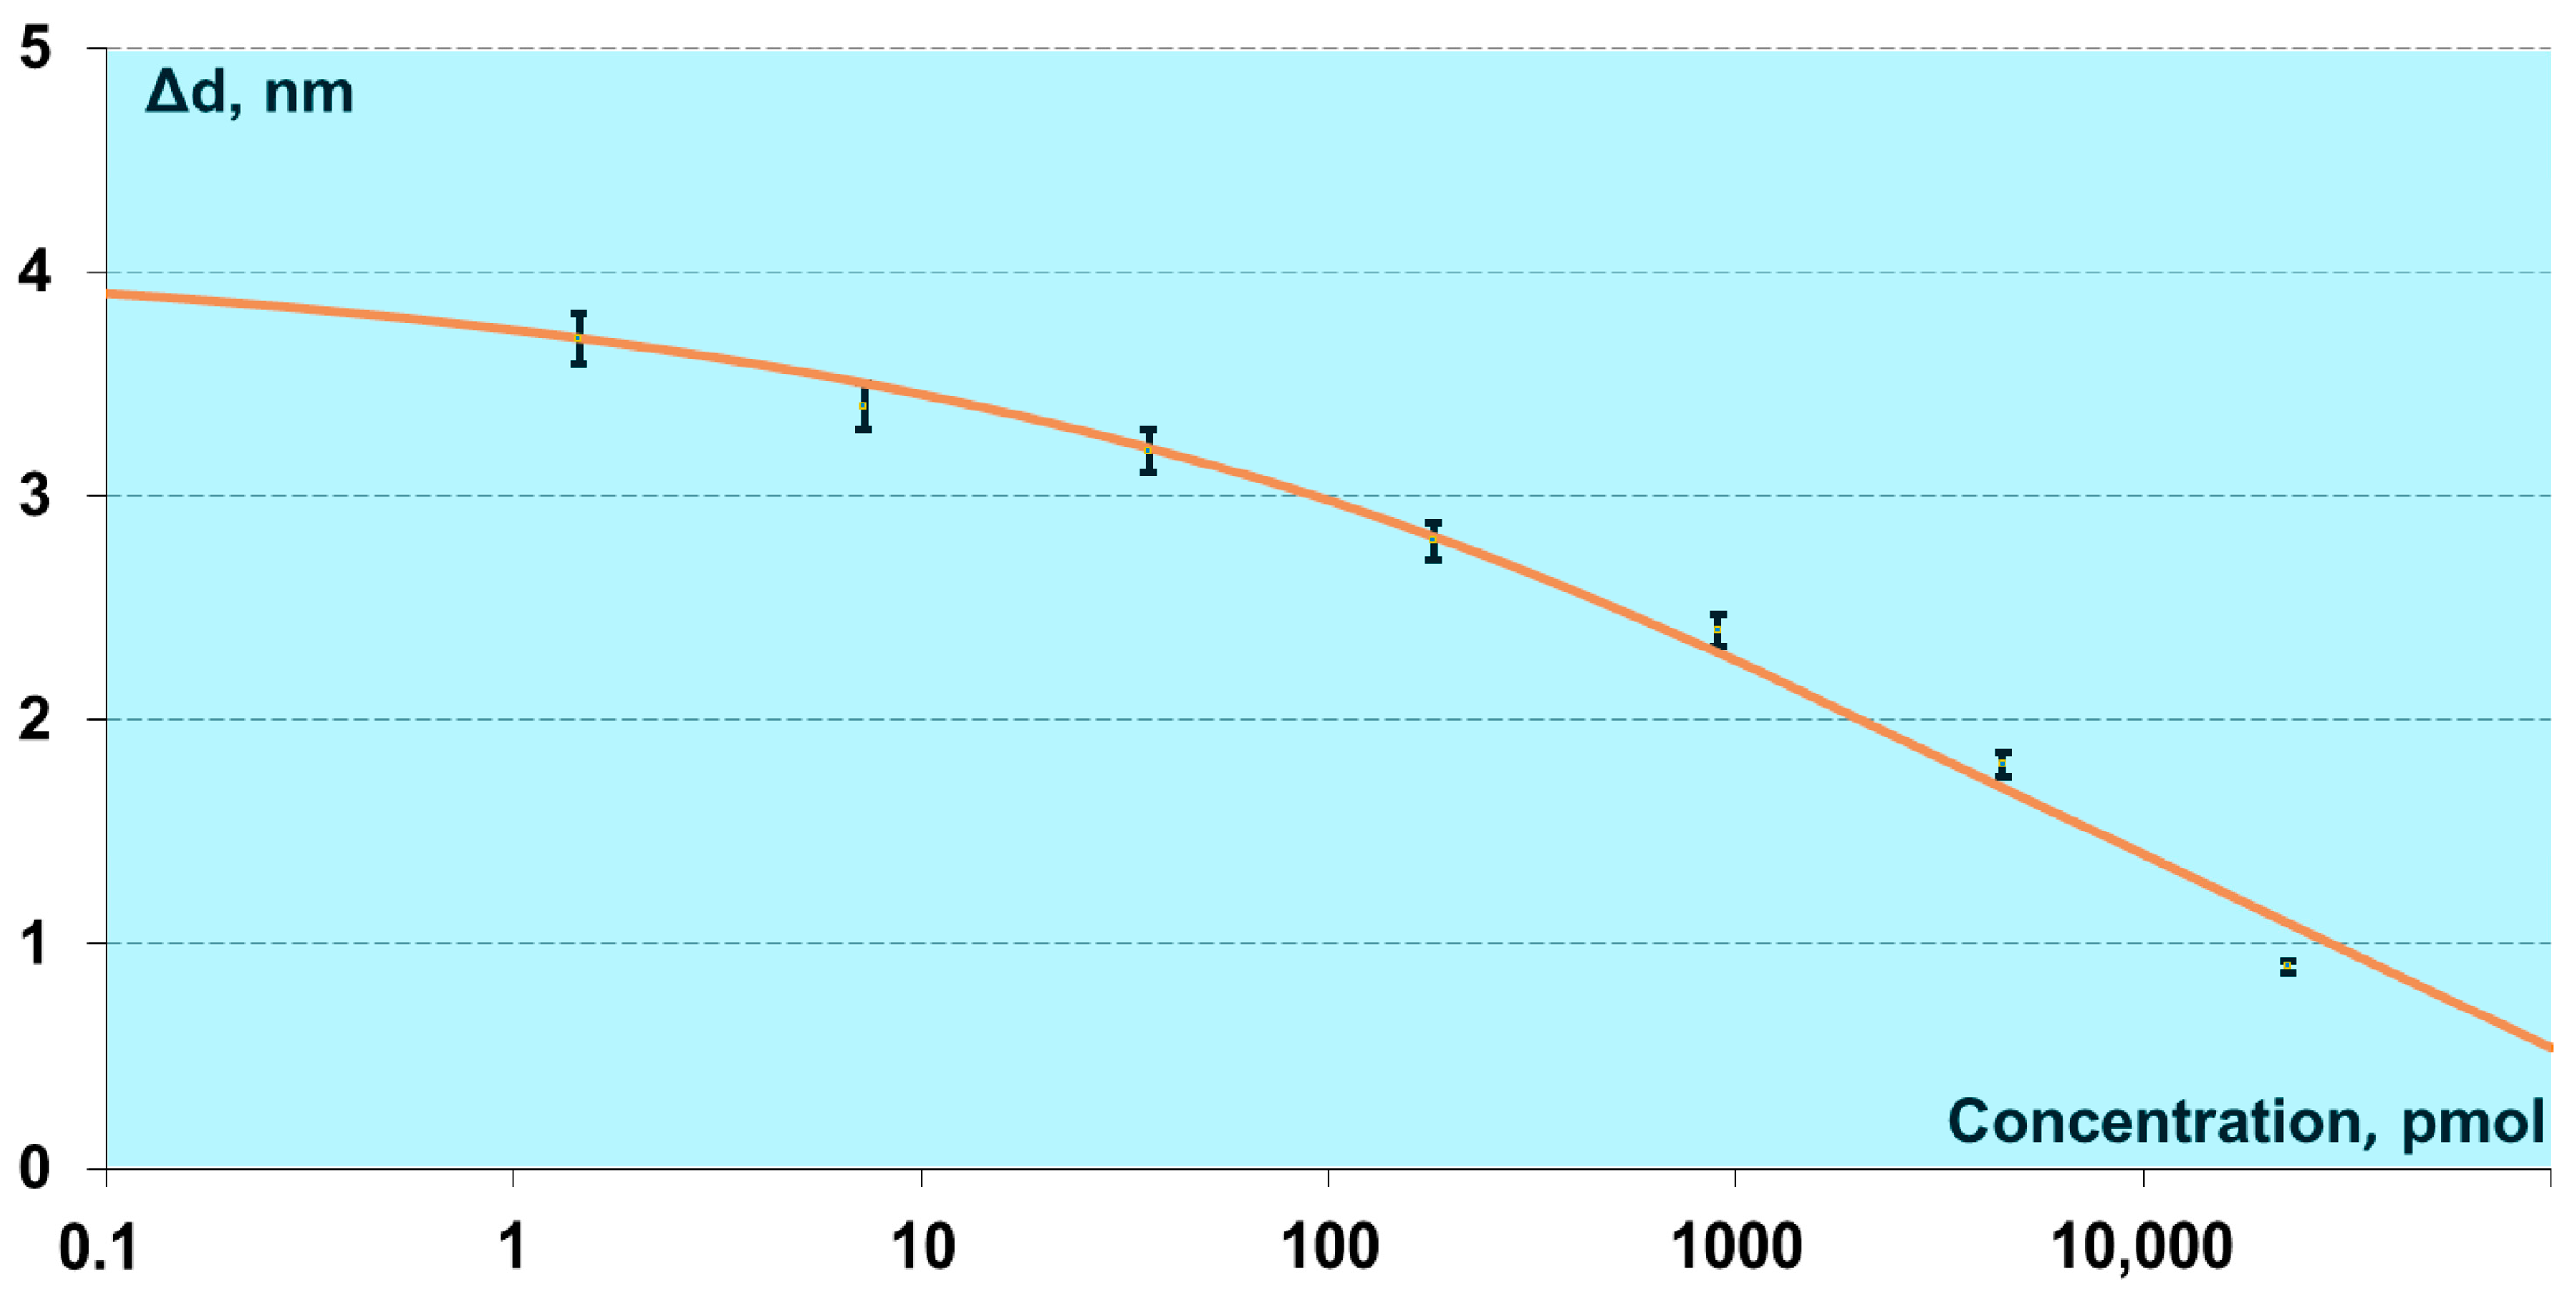
3.3. Determination of the Detection Limit and Demonstration of Long-Term Chemosensor Operation

The limit of detection (LOD) of free FA in a solution was determined as follows. Free folic acid samples (a series of several different dilutions to obtain the concentrations of 22,650 pM, 4500 pM, 900 pM, 180 pM, 36 pM, 7.2 pM, and 1.4 pM) were incubated with FA antibody (7 µg/mL) for 10 min. Then, the resulting solution was passed along the sensor chip with attached FA–gelatin conjugate. The results obtained in these experiments were used for plotting the calibration curve and determination of the minimal detectable concentration of free folic acid (by 2σ criterion), which was equal to 0.9 pM (Figure 6). The 5-parameter logistic regression model [48], commonly used for curve-fitting analysis in bioassays, immunoassays, and other dose-response curves, was used for plotting the calibration curve. It should be noted that the clinically significant range of folic acid concentrations is admitted to be 4500–34,000 pM in terms of the physiological content [6]; it can considerably change due to pharmaceutical formulations and nutritional supplements. Therefore, the wide dynamic range shown of 0.9–220,000 pM covers the whole physiological range of folic acid concentrations.
Thus, the developed method of FA detection features excellent analytic characteristics that are not inferior to the most advanced sensitive techniques, which employ various labels, or to the approach of liquid chromatography (Table 1). Moreover, since the proposed method is based on direct optical registration of inter-molecular interactions, it offers all the advantages of label-free techniques, namely: quantitative registration in real-time of all assay stages, an option to analyze kinetic characteristics of interactions, and detection of the unlabeled forms of analytes.
It should be noted that the proposed method offers important advantages over traditional label-free approaches. These include (i) no additional thermal stabilization is needed for the sensing unit; (ii) affordable cost of consumables—glass sensor chips; and (iii) great potential for multiplex analysis using multi-channel optical registration by, for example, a CCD array.
A separate series of experiments was devoted to verification of the sensor performance for the long-lasting experiments exceeding 200 min. Figure 7 demonstrates the stepwise filling of free FA sites on the sensor chip surface by FA antibody applied at growing concentrations. The FA antibody solutions were prepared as mixtures with free folic acid. The FA concentrations gradually reduced (4500 pM; 900 pM; 180 pM; 36 pM; 7.2 pM, and 1.4 pM), so the content of free FA antibody grew accordingly. One can see in the figure that the sensor response to the variations in the analyte concentration was correct during the whole experiment. That indicates the stability of the developed assay, as well as the sensor capacity for registration in real-time of longer experiments.

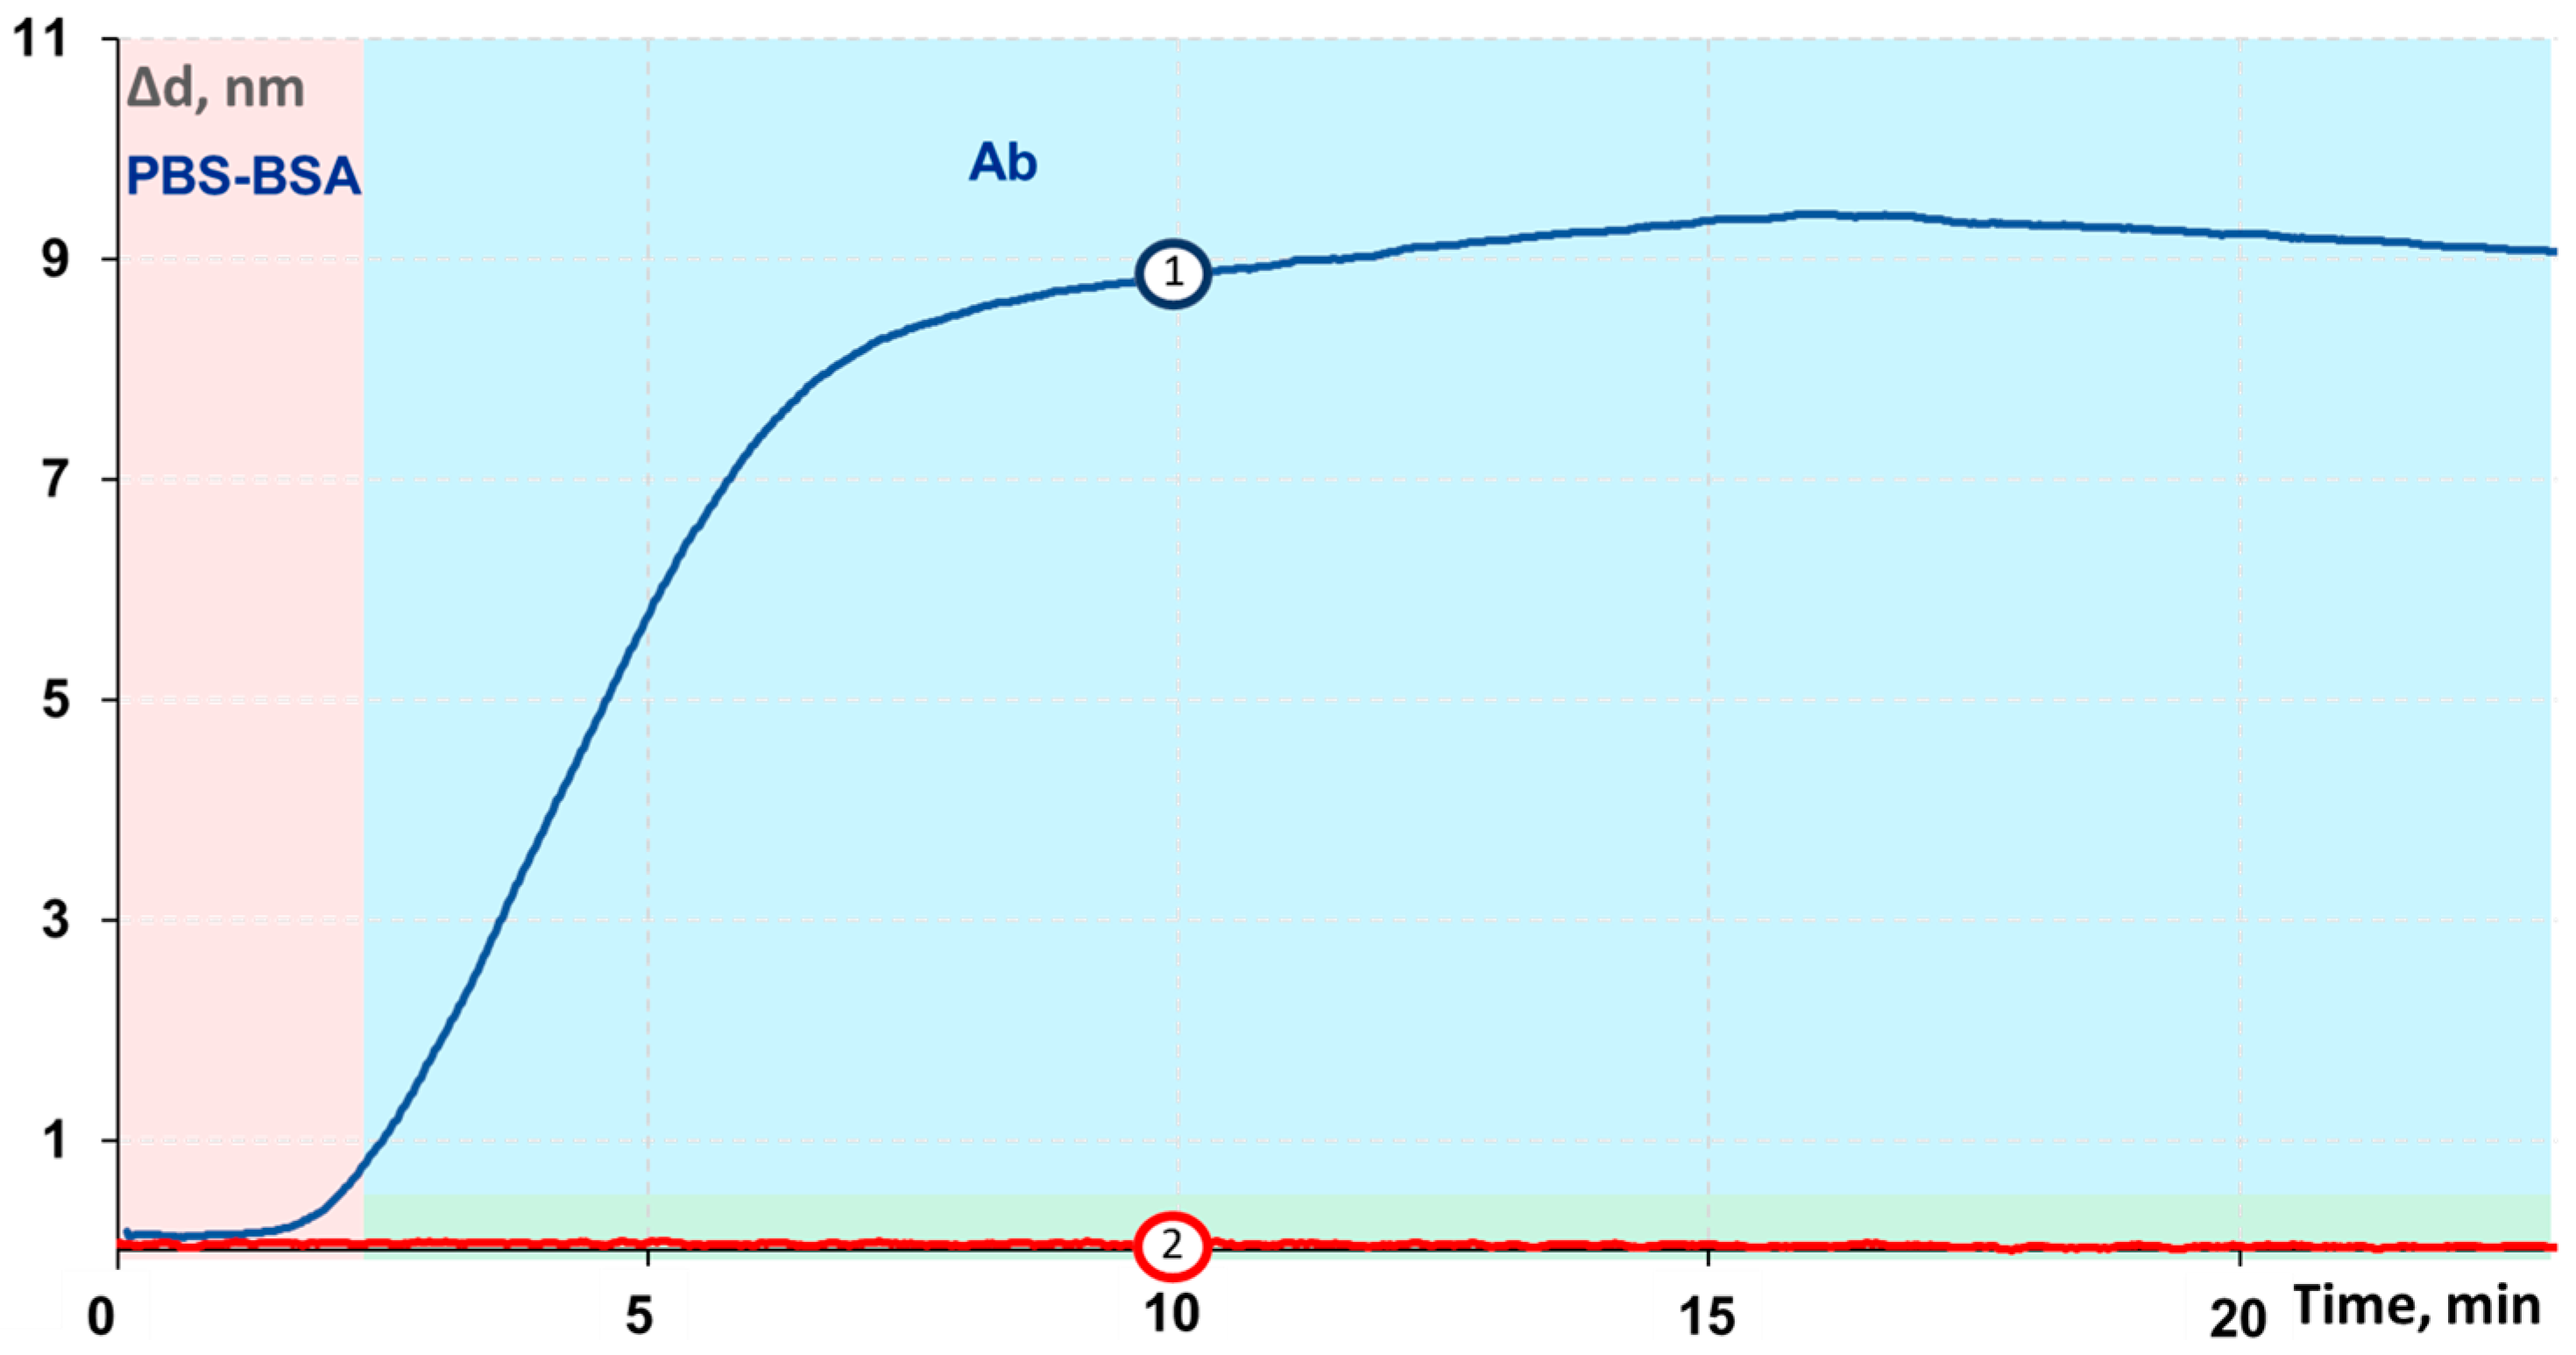
3.4. Investigation of Binding Specificity and Control Experiments

The specificity of antibody-antigen binding was confirmed by experiments with a negative control. The measurements were carried out at the standard conditions, and PBS-BSA buffer without antibodies was used as the negative control. The results exhibited in Figure 8 illustrate that there were no noticeable changes in the biolayer thickness when the FA antibody was not present in the sample and, consequently, non-specific interactions were not registered. Besides, non-specific signals were not registered when using the samples, which contained only one of the following substances: chloramphenicol, thyroxine, ochratoxin A, or large protein molecules—HBsAg, PSA, or cTnI. Besides, control experiments were carried out for: (i) demonstration of absence of FA antibody binding with the surface if the FA–gelatin conjugate immobilization step is omitted (Figure S2); (ii) investigation with an ELISA-based technique of the effect of presence of FA–gelatin conjugates on the glass sensor chip surface onto immune complexes formation (Figure S3); (iii) demonstration of absence of binding of anti-mouse antibody with the surface if the FA-antibody immobilization step is omitted (Figure S4); (iv) study of the effect of FA-antibody presence on formation of complexes on the surface of a glass sensor chip with an ELISA-based technique (Figure S5); (v) demonstration of the absence of FA–gelatin conjugate binding with the sensor chip surface that was not pre-activated by cardiimide (Figure S6); and (vi) studies on selectivity of the developed chemosensor in the presence of non-target analytes (Figure S7). Remarkably, the developed method shows excellent reproducibility: intra- and inter-assay relative coefficients of variation equal 7.3% and 9.6%, respectively.

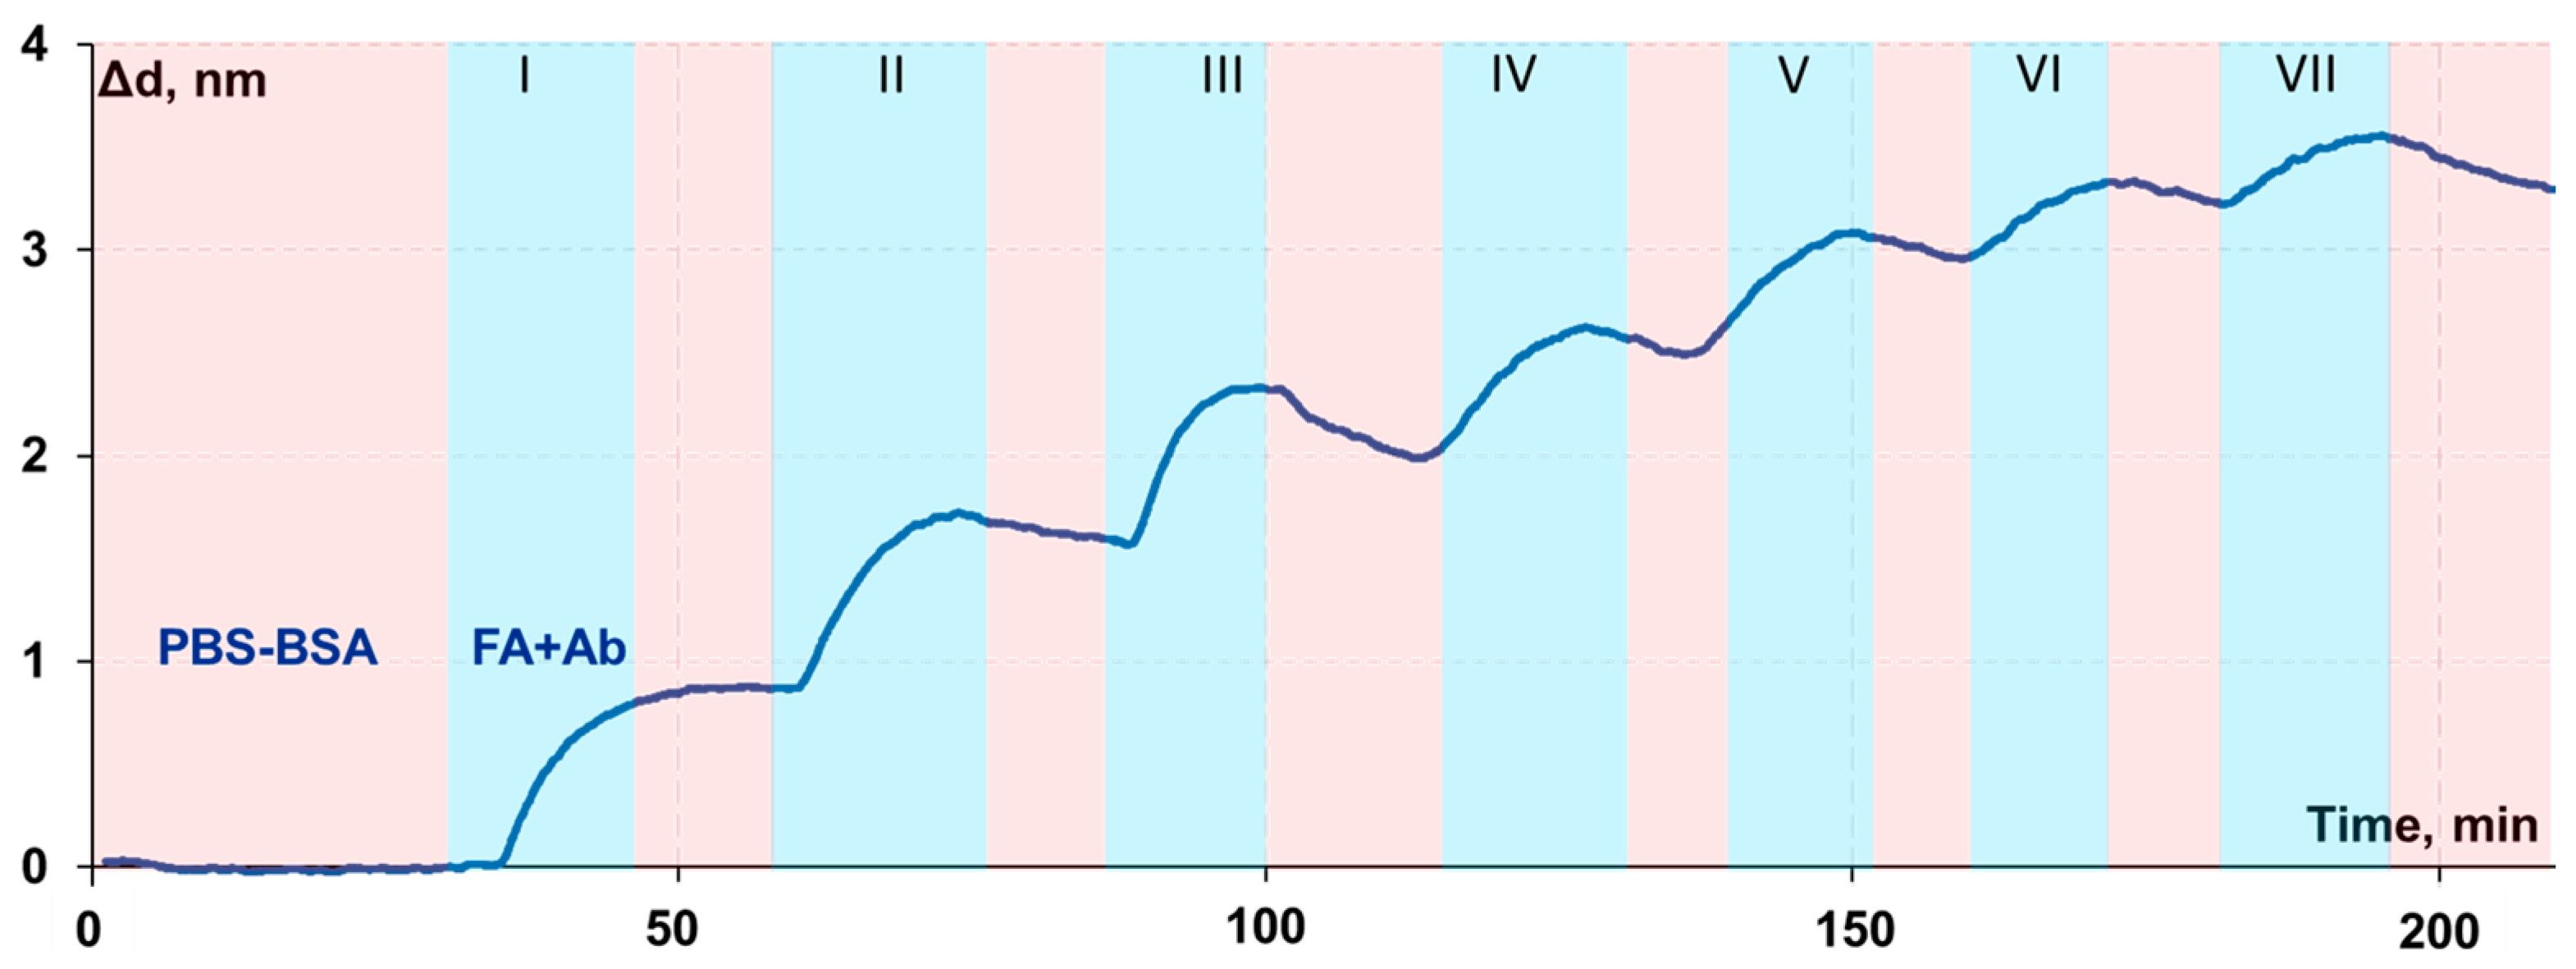
3.5. Investigation of the Biolayer Reconstruction

The reconstruction of biolayer formed by the FA antibody on the sensor chip surface was studied in the experiments, in which low concentration solutions of folic acid were passed along the layer of surface-attached antibody. A decrease in the biolayer thickness was detected during several passes of the solutions containing FA at the following concentrations: 2.2 pM, 22 pM, 226 pM, 2200 pM, and 22,000 pM (Figure 9). Remarkably, the antibody layer could be reconstructed by a simple addition of the antibody solution to the sensor chip. The reconstructed biolayer was less stable than the initial one, nevertheless, it was suitable for further measurements. The procedure of biolayer reconstruction is attractive for multiple use of the biochip with the attached FA–gelatin conjugate.

4. Conclusions

A method has been developed for preparation of inexpensive single-use sensor chips from standard microscope cover glass slips. The method enables real-time adjustments of the procedure parameters. The demonstrated performance of the obtained sensor chips for highly-sensitive and specific measuring of folic acid concentrations using a label-free SCI chemosensor indicates the method prospects for FA determination in pharmaceutical samples and directly in biological liquids. The developed technique does not involve expensive equipment, consumables, or labor-intensive operating procedures. The employment of SCI chemosensor makes the method competitive with the most modern methods of FA measurements, such as electrochemical sensors. The method can be further extended to real-time determination of other low-molecular-weight biomarkers with high specificity and accuracy.

Supplementary Materials

The following supporting information can be downloaded at: https://www.mdpi.com/article/10.3390/chemosensors11010017/s1, Table S1: Results of wettability characterization of the sensor chip surface by contact angle measurement; Figure S1: SEM-based morphological characterizations of the sensor chip surface at different functionalization stages: aminated surface (left), carboxilated surface (center), and surface after FA-gelatin conjugate immobilization (right); Figure S2: Absence of FA antibody binding with the surface if the FA–gelatin conjugate immobilization step is omitted (verified by the label-free spectral correlation interferometry); Figure S3: Effect of presence of FA–gelatin conjugates on the glass sensor chip surface on immune complexes formation studied with an ELISA-based technique; Figure S4: Absence of binding of anti-mouse antibody with the surface if the FA-antibody immobilization step is omitted (verified by the label-free technique of spectral correlation interferometry); Figure S5: Study of the effect of FA-antibody presence on formation of complexes on the surface of a glass sensor chip with an ELISA-based technique; Figure S6: Demonstration of the absence of FA–gelatin conjugate binding with the sensor chip surface that was not pre-activated by cardiimide; Figure S7: Studies on selectivity of the developed chemosensor in the presence of non-target analytes.

Author Contributions

Conceptualization and methodology, D.O.N., A.V.O. and P.I.N.; validation, D.O.N. and A.V.O.; formal analysis, D.O.N. and A.V.O.; investigation, D.O.N., A.V.O. and S.L.Z.; resources, P.I.N.; data curation, D.O.N. and A.V.O.; writing—original draft preparation, M.L.A. and D.O.N.; writing—review and editing, A.V.O. and P.I.N.; visualization, D.O.N.; supervision, A.V.O. and P.I.N.; project administration, A.V.O. and P.I.N.; funding acquisition, A.V.O. and P.I.N. All authors have read and agreed to the published version of the manuscript.

Funding

The research was funded by the Ministry of Science and Higher Education of the Russian Federation, contract No. 075-15-2022-315.

Institutional Review Board Statement

Not applicable.

Informed Consent Statement

Not applicable.

Data Availability Statement

Not applicable.

Acknowledgments

The authors thank Averyan V. Pushkarev for the help with setting up the SCI-based experiments, Andrey Drozdov for taking the SEM images, Irina L. Nikitina for assistance with the manuscript preparation and useful discussions, and Juri Malkerov for proofreading the manuscript.

Conflicts of Interest

P.I.N. is the named inventor of SCI-related patents.

References

  1. Sobczyńska-Malefora, A.; Harrington, D.J. Laboratory Assessment of Folate (Vitamin B 9) Status. J. Clin. Pathol. 2018, 71, 949–956. [Google Scholar] [CrossRef] [PubMed]
  2. Dhar, M.; Bellevue, R.; Carmel, R. Pernicious Anemia with Neuropsychiatric Dysfunction in a Patient with Sickle Cell Anemia Treated with Folate Supplementation. N. Engl. J. Med. 2003, 348, 2204–2207. [Google Scholar] [CrossRef] [PubMed]
  3. di Tinno, A.; Cancelliere, R.; Micheli, L. Determination of Folic Acid Using Biosensors—A Short Review of Recent Progress. Sensors 2021, 21, 3360. [Google Scholar] [CrossRef] [PubMed]
  4. Troen, A.M.; Mitchell, B.; Sorensen, B.; Wener, M.H.; Johnston, A.; Wood, B.; Selhub, J.; McTiernan, A.; Yasui, Y.; Oral, E.; et al. Unmetabolized Folic Acid in Plasma Is Associated with Reduced Natural Killer Cell Cytotoxicity among Postmenopausal Women. J. Nutr. 2006, 136, 189–194. [Google Scholar] [CrossRef] [Green Version]
  5. Protiva, P.; Mason, J.B.; Liu, Z.; Hopkins, M.E.; Nelson, C.; Marshall, J.R.; Lambrecht, R.W.; Pendyala, S.; Kopelovich, L.; Kim, M.; et al. Altered Folate Availability Modifies the Molecular Environment of the Human Colorectum: Implications for Colorectal Carcinogenesis. Cancer Prev. Res. 2011, 4, 530–543. [Google Scholar] [CrossRef] [Green Version]
  6. Batra, B.; Narwal, V.; Kalra, V.; Sharma, M.; Rana, J. Folic Acid Biosensors: A Review. Process Biochem. 2020, 92, 343–354. [Google Scholar] [CrossRef]
  7. Li, J.; Guo, Z.; Liu, T.; Yu, F.; Zeng, J.; Zhang, Y.; Yin, L.; Liu, X.; Jiang, H.; Wang, X. Folic Acid-Modified Cerium-Doped Carbon Dots as Photoluminescence Sensors for Cancer Cells Identification and Fe(III) Detection. Chemosensors 2022, 10, 219. [Google Scholar] [CrossRef]
  8. Cheung, A.; Bax, H.J.; Josephs, D.H.; Ilieva, K.M.; Pellizzari, G.; Opzoomer, J.; Bloomfield, J.; Fittall, M.; Grigoriadis, A.; Figini, M.; et al. Targeting Folate Receptor Alpha for Cancer Treatment. Oncotarget 2016, 7, 52553–52574. [Google Scholar] [CrossRef] [Green Version]
  9. Bryant, C. Nelson The Expanding Role of Mass Spectrometry in Folate Research. Curr. Anal. Chem. 2007, 3, 219–231. [Google Scholar] [CrossRef]
  10. Devendiran, R.M.; kumar Chinnaiyan, S.; Yadav, N.K.; Moorthy, G.K.; Ramanathan, G.; Singaravelu, S.; Sivagnanam, U.T.; Perumal, P.T. Green Synthesis of Folic Acid-Conjugated Gold Nanoparticles with Pectin as Reducing/Stabilizing Agent for Cancer Theranostics. RSC Adv. 2016, 6, 29757–29768. [Google Scholar] [CrossRef]
  11. Advani, P.G.; Schonfeld, S.J.; Curtis, R.E.; Dores, G.M.; Linet, M.S.; Sigel, B.S.; Lam, C.J.K.; Tucker, M.A.; Chanock, S.J.; Morton, L.M. Risk of Therapy-Related Myelodysplastic Syndrome/Acute Myeloid Leukemia after Childhood Cancer: A Population-Based Study. Leukemia 2019, 33, 2947–2978. [Google Scholar] [CrossRef] [PubMed]
  12. Zhang, Z. Progress of Folic Acid-Folate Receptor as Drug Carriers in Targeted Drug Delivery System. SHS Web Conf. 2022, 144, 1002. [Google Scholar] [CrossRef]
  13. Baker, H.; Herbert, V.; Frank, O.; Pasher, I.; Hutner, S.H.; Wasserman, L.R.; Sobotka, H. A Microbiologic Method for Detecting Folic Acid Deficiency in Man. Clin. Chem. 1959, 5, 275–280. [Google Scholar] [CrossRef]
  14. Chanarin, I.; Elmes, P.C.; Mollin, D.L. Folic-Acid Studies in Megaloblastic Anaemia Due to Primidone. BMJ 1958, 2, 80–82. [Google Scholar] [CrossRef] [PubMed] [Green Version]
  15. Sobczyńska-Malefora, A. Methods for Assessment of Folate (Vitamin B9). In Laboratory Assessment of Vitamin Status; Harrington, D., Ed.; Elsevier: Amsterdam, The Netherlands, 2019; pp. 219–264. [Google Scholar] [CrossRef]
  16. Waxman, S.; Schreiber, C.; Herbert, V. Radioisotopic Assay for Measurement of Serum Folate Levels. Blood 1971, 38, 219–228. [Google Scholar] [CrossRef]
  17. Deconinck, E.; Crevits, S.; Baten, P.; Courselle, P.; de Beer, J. A Validated Ultra High Pressure Liquid Chromatographic Method for Qualification and Quantification of Folic Acid in Pharmaceutical Preparations. J. Pharm. Biomed. Anal. 2011, 54, 995–1000. [Google Scholar] [CrossRef] [PubMed]
  18. Bagley, P.J.; Selhub, J. Analysis of Folate Form Distribution by Affinity Followed by Reversed-Phase Chromatography with Electrochemical Detection. Clin. Chem. 2000, 46, 404–411. [Google Scholar] [CrossRef] [Green Version]
  19. Pfeiffer, C.M.; Gregory, J.F., 3rd. Enzymatic Deconjugation of Erythrocyte Polyglutamyl Folates during Preparation for Folate Assay: Investigation with Reversed-Phase Liquid Chromatography. Clin. Chem. 1996, 42, 1847–1854. [Google Scholar] [CrossRef]
  20. Huang, L.; Zhang, J.; Hayakawa, T.; Tsuge, H. Assays of Methylenetetrahydrofolate Reductase and Methionine Synthase Activities by Monitoring 5-Methyltetrahydrofolate and Tetrahydrofolate Using High-Performance Liquid Chromatography with Fluorescence Detection. Anal. Biochem. 2001, 299, 253–259. [Google Scholar] [CrossRef] [PubMed]
  21. Santhosh-Kumar, C.R.; Kolhouse, J.F. Molar Quantitation of Folates by Gas Chromatography-Mass Spectrometry. Vitam. Coenzymes Part K 1997, 281, 26–38. [Google Scholar] [CrossRef]
  22. Pfeiffer, C.M.; Fazili, Z.; McCoy, L.; Zhang, M.; Gunter, E.W. Determination of Folate Vitamers in Human Serum by Stable-Isotope-Dilution Tandem Mass Spectrometry and Comparison with Radioassay and Microbiologic Assay. Clin. Chem. 2004, 50, 423–432. [Google Scholar] [CrossRef] [PubMed]
  23. Kanjilal, G.; Mahajan, S.N.; Rao, G.R. Colorimetric Determination of Folic Acid in Pharmaceutical Preparations. Analyst 1975, 100, 19–24. [Google Scholar] [CrossRef] [PubMed]
  24. Song, Z.; Wang, L. Chemiluminescence Inhibition Assay for Folic Acid Using Flow Injection Analysis. Phytochem. Anal. 2003, 14, 216–220. [Google Scholar] [CrossRef] [PubMed]
  25. Hla-Pe, U. Aung-Than-Batu A Fluorometric Method for Urinary Folic Acid Determination in Folic Acid Absorption and Load Tests. Clin. Chim. Acta 1969, 24, 381–387. [Google Scholar] [CrossRef]
  26. Cruces Blanco, C.; Segura Carretero, A.; Fernández Gutierrez, A.; Román Ceba, M. Micellar-Enhanced Synchronous-Derivative Fluorescence Determination of Derivatized Folic Acid in Pharmaceutical Preparations. J. Pharm. Biomed. Anal. 1995, 13, 1019–1025. [Google Scholar] [CrossRef]
  27. Indyk, H.E. The Determination of Folic Acid in Milk and Paediatric Formulae by Optical Biosensor Assay Utilising Folate Binding Protein. Int. Dairy J. 2010, 20, 106–112. [Google Scholar] [CrossRef]
  28. Indyk, H.E.; Woollard, D.C. Single Laboratory Validation of an Optical Biosensor Method for the Determination of Folate in Foods. J. Food Compos. Anal. 2013, 29, 87–93. [Google Scholar] [CrossRef]
  29. Jana, J.; Ganguly, M.; Pal, T. Enlightening Surface Plasmon Resonance Effect of Metal Nanoparticles for Practical Spectroscopic Application. RSC Adv. 2016, 6, 86174–86211. [Google Scholar] [CrossRef]
  30. Olaru, A.; Bala, C.; Jaffrezic-Renault, N.; Aboul-Enein, H.Y. Surface Plasmon Resonance (SPR) Biosensors in Pharmaceutical Analysis. Crit. Rev. Anal. Chem. 2015, 45, 97–105. [Google Scholar] [CrossRef]
  31. Scherbahn, V.; Nizamov, S.; Mirsky, V.M. Toward Ultrasensitive Surface Plasmon Resonance Sensors. In Label-Free Biosensing: Advanced Materials, Devices and Applications; Schöning, M.J., Poghossian, A., Eds.; Springer International Publishing: Cham, Switzerland, 2018; pp. 409–448. [Google Scholar] [CrossRef]
  32. Altug, H.; Oh, S.-H.; Maier, S.A.; Homola, J. Advances and Applications of Nanophotonic Biosensors. Nat. Nanotechnol. 2022, 17, 5–16. [Google Scholar] [CrossRef]
  33. Dudak, F.C.; Boyaci, İ.H. Peptide-Based Surface Plasmon Resonance Biosensor for Detection of Staphylococcal Enterotoxin B. Food Anal. Methods 2014, 7, 506–511. [Google Scholar] [CrossRef]
  34. Wright, J.D.; Oliver, J.V.; Nolte, R.J.M.; Holder, S.J.; Sommerdijk, N.A.J.M.; Nikitin, P.I. The Detection of Phenols in Water Using a Surface Plasmon Resonance System with Specific Receptors. Sens. Actuators B Chem. 1998, 51, 305–310. [Google Scholar] [CrossRef]
  35. Chang, C.-C. Recent Advancements in Aptamer-Based Surface Plasmon Resonance Biosensing Strategies. Biosensors 2021, 11, 233. [Google Scholar] [CrossRef] [PubMed]
  36. Kochergin, V.E.; Beloglazov, A.A.; Valeiko, M.V.; Nikitin, P.I. Phase Properties of a Surface-Plasmon Resonance from the Viewpoint of Sensor Applications. Quantum Electron. 1998, 28, 444–448. [Google Scholar] [CrossRef]
  37. Thormählen, I.; Straub, J.; Grigull, U. Refractive Index of Water and Its Dependence on Wavelength, Temperature, and Density. J. Phys. Chem. Ref. Data 1985, 14, 933. [Google Scholar] [CrossRef] [Green Version]
  38. Orlov, A.V.; Pushkarev, A.V.; Znoyko, S.L.; Novichikhin, D.O.; Bragina, V.A.; Gorshkov, B.G.; Nikitin, P.I. Multiplex Label-Free Biosensor for Detection of Autoantibodies in Human Serum: Tool for New Kinetics-Based Diagnostics of Autoimmune Diseases. Biosens. Bioelectron. 2020, 159, 112187. [Google Scholar] [CrossRef]
  39. Nikitin, P.I.; Gorshkov, B.G.; Nikitin, E.P.; Ksenevich, T.I. Picoscope, a New Label-Free Biosensor. Sens. Actuators B Chem. 2005, 111–112, 500–504. [Google Scholar] [CrossRef]
  40. Galukande, M.; Jombwe, J.; Fualal, F.; Baingana, R.; Gakwaya, A. Reference Values for Serum Levels of Folic Acid and Vitamin B12 in a Young Adult Ugandan Population. Afr. Health Sci. 2011, 11, 240–243. [Google Scholar] [CrossRef]
  41. Wahlin, Å.; Bäckman, L.; Hultdin, J.; Adolfsson, R.; Nilsson, L.-G. Reference Values for Serum Levels of Vitamin B 12 and Folic Acid in a Population-Based Sample of Adults between 35 and 80 Years of Age. Public Health Nutr. 2002, 5, 505–511. [Google Scholar] [CrossRef] [Green Version]
  42. Snow, C.F. Laboratory Diagnosis of Vitamin B12 and Folate Deficiency: A Guide for the Primary Care Physician. Arch. Intern. Med. 1999, 159, 1289–1298. [Google Scholar] [CrossRef]
  43. Tomasiuk, R.; Zubrzycki, I.Z.; Wiacek, M. Age-Dependent Changes in Fat- and Water-Soluble Vitamins—National Health and Nutrition Examination Surveys Study. Front. Med. 2022, 9, 907067. [Google Scholar] [CrossRef] [PubMed]
  44. Orlov, A.V.; Nikitin, M.P.; Bragina, V.A.; Znoyko, S.L.; Zaikina, M.N.; Ksenevich, T.I.; Gorshkov, B.G.; Nikitin, P.I. A New Real-Time Method for Investigation of Affinity Properties and Binding Kinetics of Magnetic Nanoparticles. J. Magn. Magn. Mater. 2015, 380, 231–235. [Google Scholar] [CrossRef]
  45. Ivanov, A.E.; Solodukhina, N.; Wahlgren, M.; Nilsson, L.; Vikhrov, A.A.; Nikitin, M.P.; Orlov, A.V.; Nikitin, P.I.; Kuzimenkova, M.V.; Zubov, V.P. Reversible Conformational Transitions of a Polymer Brush Containing Boronic Acid and Its Interaction with Mucin Glycoprotein. Macromol. Biosci. 2011, 11, 275–284. [Google Scholar] [CrossRef] [PubMed]
  46. Burenin, A.G.; Urusov, A.E.; Betin, A.V.; Orlov, A.V.; Nikitin, M.P.; Ksenevich, T.I.; Gorshkov, B.G.; Zherdev, A.V.; Dzantiev, B.B.; Nikitin, P.I. Direct Immunosensing by Spectral Correlation Interferometry: Assay Characteristics versus Antibody Immobilization Chemistry. Anal. Bioanal. Chem. 2015, 407, 3955–3964. [Google Scholar] [CrossRef] [PubMed]
  47. Wang, W.; Vaughn, M.W. Morphology and Amine Accessibility of (3-Aminopropyl) Triethoxysilane Films on Glass Surfaces. Scanning 2008, 30, 65–77. [Google Scholar] [CrossRef] [PubMed]
  48. Azadeh, M.; Gorovits, B.; Kamerud, J.; MacMannis, S.; Safavi, A.; Sailstad, J.; Sondag, P. Calibration Curves in Quantitative Ligand Binding Assays: Recommendations and Best Practices for Preparation, Design, and Editing of Calibration Curves. AAPS J. 2018, 20, 22. [Google Scholar] [CrossRef] [PubMed]
  49. Modupe, O.; Maurras, J.B.; Diosady, L.L. A Spectrophotometric Method for Determining the Amount of Folic Acid in Fortified Salt. J. Agric. Food Res. 2020, 2, 100060. [Google Scholar] [CrossRef]
  50. Aviva Systems Biology. Folic Acid ELISA Kit (OKEH02550) from Aviva Systems Biology. Available online: https://www.biocompare.com/25138-Assay-Kit/10144611-Folic-acid-ELISA-Kit-OKEH02550/?pda=9956%7C10144611_0_1%7C%7C4%7CFolate&dfp=true#productspecs (accessed on 19 December 2022).
  51. Lapa, R.A.S.; Lima, J.L.F.C.; Reis, B.F.; Santos, J.L.M.; Zagatto, E.A.G. Photochemical-Fluorimetric Determination of Folic Acid in a Multicommutated Flow System. Anal. Chim. Acta 1997, 351, 223–228. [Google Scholar] [CrossRef]
  52. Bertuzzi, T.; Rastelli, S.; Mulazzi, A.; Rossi, F. LC-MS/MS Determination of Mono-Glutamate Folates and Folic Acid in Beer. Food Anal. Methods 2019, 12, 722–728. [Google Scholar] [CrossRef]
  53. Guignard, L.; Nembrini, C.; Moulin, J.; Meisser, K.; Silva-Zolezzi, I.; Kratzsch, J.; Vogel, M.; Kiess, W.; Eckhardt, E. A Rapid Chemiluminescence Assay for Measurement of Folate in Small Volumes of Breast Milk. Molecules 2019, 24, 2730. [Google Scholar] [CrossRef]
  54. Roche Diagnostics International Ltd. Elecsys® Folate RBC Electrochemiluminescence Immunoassay (ECLIA) for the In Vitro Quantitative Determination of Folate in Erythrocytes (Red Blood Cells, RBC); Roche Diagnostics International Ltd.: Rotkreuz, Switzerland, 2014; Available online: https://diagnostics.roche.com/content/dam/diagnostics/ch/de/gesundheitsthemen/anaemia/Anemia_Factsheet_FolateRBC.pdf (accessed on 19 December 2022).
Figure 1. Chemical modifications of the glass chip surface for measuring folic acid: (a) attachment of aliphatic amino groups by APTES onto a glass surface preliminarily cleaned with a piranha solution, (b) carboxylation of the aminated glass chip by means of succinic anhydride, (c) EDC-mediated activation of the carboxyl groups, (d) attachment of NH2-containing FA–gelatin conjugate to the carboxylated glass surface, (e) assembly of the “antibody–antigen” biolayer by a specific interaction of FA–gelatin conjugate with the FA antibodies.
Chemosensors 11 00017 g001
Figure 2. Scheme of the assay procedure for real-time detection of folic acid with spectral correlation interferometry: (a) FA antibodies are added to the analyzed sample that contains FA antigen; (b) FA antibodies do not bind via the occupied antigen-binding sites with the surface of the glass sensor chip, on which FA−gelatin conjugate is immobilized; (c) FA antibodies are added to the analyzed sample that does not contain FA antigen; (d) FA antibodies bind via free antigen-binding sites with the surface of the glass sensor chip, on which FA−gelatin conjugate is immobilized; (e) schematic of the operation principle of the chemosensor based on the spectral correlation interferometry: a phase shift between the beam reflected from the bottom surface of the sensor chip and the beam reflected from the interface “biolayer−liquid sample”; (f) sensorgrams that show the typical responses in real-time from the SCI chemosensor during analyses of the samples which contain (lower red line) and do not contain FA antigen (upper blue curve).
Chemosensors 11 00017 g002
Figure 3. Complete cycle of assembly of the FA–gelatin conjugate layer on the sensor chip inside the SCI-based chemosensing system: EDS-MES—carboxyl group activator, FA–G—conjugate of folic acid with gelatin, PBS-BSA—blocking buffer.
Chemosensors 11 00017 g003
Figure 4. Sensorgram of FA antibody binding to a sensor chip with attached FA–gelatin conjugate (FA antibody concentration—70 µg/mL).
Chemosensors 11 00017 g004
Figure 5. Comparative analysis of the biolayer thickness and the rate of its formation depending on FA antibody concentration. The solutions of FA antibody in concentrations of 4.66, 7, 17.5, 35, and 70 µg/mL were pumped along the sensor chips that had FA–gelatin immobilized on their surface.
Chemosensors 11 00017 g005
Figure 6. Calibration curve for the SCI-based method of folic acid detection as a dependence of variation of the biolayer thickness upon concentration of folic acid antigen in the analyzed sample (at the FA antibody concentration of 7 µg/mL). FA concentrations in the samples were as follows: 22,650 pM, 4500 pM, 900 pM, 180 pM, 36 pM, 7.2 pM, and 1.4 pM. These data points represent mean values (n = 3), and the error bars show standard deviations. The solid line exhibits fitting with a 5-parameter logistic curve.
Chemosensors 11 00017 g006
Figure 7. Stepwise filling of the attachment sites on the sensor chip by application of gradually decreasing concentrations of free FA in solutions containing FA antibody at 7 µg/mL (concentrations of free FA: I—22,650 pM, II—4500 pM, III—900 pM, IV—180 pM, V—36 pM, VI—7.2 pM, and VII—1.4 pM).
Chemosensors 11 00017 g007
Figure 8. Comparison of the sensorgrams obtained in the negative control studies: 1—sensorgram obtained with samples containing FA antibody; 2—typical sensorgram that demonstrates the absence of non-specific binding with passing the solutions of PBS-BSA or one of the following substances: chloramphenicol, thyroxine, ochratoxin A, or large protein molecules—HBsAg, PSA, cTnI, or HSA.
Chemosensors 11 00017 g008
Figure 9. Investigation of stability of the biolayer formed on the sensor chip surface. The sensorgram demonstrates a gradual decrease in the biolayer thickness according to the FA concentration in the solution: I—2.2 pM, II—22 pM, III—226 pM, IV—2200 pM, and V—22,000 pM. Step VI shows an option of rapid reconstruction of the biolayer by application of the FA antibody solution.
Chemosensors 11 00017 g009
Table 1. Comparison of different methods for FA detection.
Detection MethodDynamic Range, nMAssay TimeLOD, nMRef.
SCI0.0009–22020–30 min0.0009this work
Spectrophotometry2265–56,60025 min 24.9 [49]
ELISA0.71–45.4~3 h0.272[50]
Photochemical-fluorimetric 227–90,702 2–10 min 227[51]
LC-MS/MS0.226–22710–30 min0.226[52]
Chemiluminescence 8.4–120 60 min 1.1 [53]
Electrochemiluminescence immunoassay272–1407 27 min 45 [54]
Disclaimer/Publisher’s Note: The statements, opinions and data contained in all publications are solely those of the individual author(s) and contributor(s) and not of MDPI and/or the editor(s). MDPI and/or the editor(s) disclaim responsibility for any injury to people or property resulting from any ideas, methods, instructions or products referred to in the content.

