Abstract
This work presents the development of a MIP-based screen-printed potentiometric cell for sensing the pesticide atrazine. The cell comprises three screen-printed electrodes; the working and the counter are obtained by graphite-ink and the pseudo-reference by silver/silver chloride-ink. All electrodes are printed on the support of polyester. Obviously, only the working and the pseudo-reference electrodes are connected for potentiometric measurements. The prepolymeric mixture was composed of the reagents at the following molar ratio: 1 atrazine (ATZ):5 methacrylic acids (MAA):4 ethylene glycol dimethacrylate (EGDMA). An amount of 7 µL of the prepolymeric solution was drop coated on the graphite working electrode of the cell, and the polymerization was carried out in an oven at 70 °C overnight. The specific sites obtained after polymerization and template elution can be viewed as the ionophore of a usual ISE membrane. The active ion is the atrazine in its protonated form, positively charged, so the determination was carried out in aqueous solutions at pHs1.5. At these conditions, the potential increases linearly with atrazine concentration ranging from 5 × 10⁻⁷ to 5 × 10⁻⁶ M; the limit of detection obtained is 4 × 10⁻⁷ M. The slope of the calibration curve E vs. log c (obtained as an average value of the slope of different standardization performed with several electrodes) is 40(6) mV/dec; the sub-Nernstian behavior can be ascribed to the interference of the anions present in the solution media.
1. Introduction
The term pesticide refers to many compounds, including herbicides, insecticides, fungicides, plant growth regulators, and others. Organochlorine insecticides, which were applied effectively in controlling several diseases, such as typhus and malaria, were restricted or banned after the 1960s in most countries. Other synthetic pesticides introduced between the 1970s and 1980s contributed efficiently to increasing yields, improving the quality of agricultural production, and controlling the pest. Although ideally, pesticides have to be lethal to pests but not for non-target species, including humans, this is not that, so the debate on the use and abuse of pesticides has emerged and still continues [1].
Atrazine (2-chloro-4-ethylamino-6-isopropylamino-1,3,5-triazine) is a triazine pesticide. It is a highly toxic herbicide; its use has been banned in some countries since it is one of the endocrine disrupters, can provoke several types of cancers, and interrupt regular hormone functions. It can cause reproductive tumors, weight loss in embryos and mothers, and congenital disabilities [2,3]. Its widespread use in the past implies that residues of this contaminant can still be found in the environment, and due to its persistence and solubility, it can diffuse in natural waters, causing severe environmental and human health problems [4]. Consequently, the determination and following removal of atrazine from the environment is of paramount importance.
Atrazine detection in water bodies and soils is generally performed by chromatographic techniques such as high-performance liquid chromatography coupled with mass spectroscopy (HPLC–MS) [5,6], ultra-performance liquid chromatography (UPLC) [7,8], and gas chromatography coupled with mass spectroscopy (GC–MS) [9,10,11]; HPLC–MS and GC–MS being the most effective, thanks to their low detection limits (µg/L levels or lower) in different environmental matrices. Moreover, mid/near-infrared spectroscopy, Raman spectroscopy methods, and enzyme-linked immunosorbent assays (ELISA) were developed [12]. Nevertheless, these techniques are expensive and time-consuming; they require trained personnel, are not portable, are not predisposed to miniaturization, and cannot be applied for in situ determination [13]. Conversely, the researchers’ emergent challenge is the development of portable and cheap devices of simple realization and applicable in situ.
Electrochemical sensors have several pros compared to conventional techniques, such as the low cost of instruments, the low sample required, and the relatively brief analysis. The main sensing or biosensing electrochemical pesticides determination is based on the direct detection of electroactive pesticides or bio-detection using specific antibodies, microorganisms, or aptamers as receptors [14]. In particular, electrochemical biosensors have attracted huge attention due to their extreme specificities and sensitivities. The core of such sensors is the receptor, i.e., the biological molecular recognition element that can specifically bind the analyte. The receptor is in close contact with a transducer, usually amperometric or potentiometric, able to convert the bio-recognition event into a quantifiable signal [15].
Since biomolecules have relatively low physical and chemical stability, synthetic receptors are increasingly important as an alternative to natural ones. The most promising materials in this field are molecular imprinted polymers (MIPs). Compared to biological receptors, MIPs are robust, stable, and resistant to degradation in acids and alkaline media or at high temperatures; they show high selectivity and affinity constants adapted for sensing. Additionally, MIPs are less expensive than biological materials and can be dried and stored at room temperature for extended periods [15,16].
MIPs can be obtained through template synthesis; this means that the polymerization is realized in the presence of the analyte that acts as a mold molecule (template). The polymerization of the functional monomer and cross-linker around the target molecule will allow, once the template is removed, the formation of cavities suitable to host the target molecule itself, just like the enzymatic key-lock model. Subsequently, the target molecule in a sample placed in contact with the polymer will be retained within the cavities, generally through weak, non-covalent interactions (Van der Waals forces, H-bridge interactions) [17].
As for biosensors, in MIP-based electrochemical sensors, the polymer has to be in close contact with the transducer that, in this specific case, is a voltammetric or potentiometric electrode. The employment of traditional electrodes requires a quite large volume of samples and a tricky cell setup; moreover, they are inappropriate for in situ applications. Screen-printed electrodes (SPEs) have emerged as great alternatives, overcoming the traditional electrodes’ limits. Screen printing technology is a well-established technique for fabricating easy-to-use, cheap, portable and disposable electrodes. By this technique, the whole electrode cell, including working (pseudo)reference and counter electrodes, is printed on the same substrate surface [14,18].
Very few works reported the application of non-modified screen-printed electrodes to determine analytes of biological and environmental interest. Several modification methods of SPEs open a wide range of their applications. Modifying screen-printed electrodes is more accessible than the procedure for classical electrodes, which generally includes several steps. For example, the composition of the printing inks can be modified by adding metal nanoparticles, electrochemical mediators, bioreceptors, or complexing agents. Moreover, it is possible to modify the electrode surface by deposition of polymeric or metal films [19].
Thanks to the high selectivity of molecularly imprinted polymers, the development of MIP-based screen-printed electrodes has been growing in the last twenty years, particularly for environmental monitoring.
In this context, the present research proposes a MIP-based screen-printed potentiometric cell for sensing the pesticide atrazine. A few papers reported potentiometric methods for this analyte, and all developed classical membrane electrodes or ISFET [20,21,22,23].
When preparing a MIP-based screen-printed working electrode, a key issue is creating a connection between the polymer and the conducting surface of the working electrode. The usual method is bulk polymerization, but the drawback is the formation of a wide dimensional distribution of small particles, which cannot be easily immobilized as a layer over the electrode. This problem can be somewhat solved by including MIP beads in a paste of conducting carbon [24]. Otherwise, some classical deposition methods, such as electropolymerization, grafting, layer-by-layer deposition, spin-coating, or drop-coating, usually employed for solid working electrodes, have also been suggested for the screen-printed ones [25]. The effective approach we have previously used for other sensors [26,27] and here re-proposed is the simplest one, i.e., the drop coating of a few µL of the prepolymeric mixture on the working electrode surface and the formation of the MIP film by in situ thermal polymerizations.
The realization of a screen-printed potentiometric cell was proposed here since the straightforward methodology, the low-cost apparatus, the limited use of reagents, and the relatively quick response. The working electrode acts as an ion-selective one, so the measurements must be performed in very acid media since the protonated form of atrazine is predominant at pH lower than 1.5 (the dissociation constant of atrazine is pKa = 1.7 [28,29]). The effect of different inorganic acids used as electrolyte solutions on the sensitivity (slope of the calibration curve) was deeply examined.
2. Materials and Methods
2.1. Reagents and Materials
Methacrylic acid (MAA) (Sigma-Aldrich, Milan, Italy) and ethylene glycol dimethacrylate (EGDMA) (Sigma-Aldrich) were filtered by using a column of aluminum oxide (Sigma-Aldrich) in order to remove stabilizers.
2,2-azobisisobutyronitrile (AIBN), atrazine, simazine, ametryn, bentazone, ethanol, methanol, and toluene were used as obtained from Sigma-Aldrich.
Concentrated acetic acid, hydrochloric acid, nitric acid, perchloric acid, sulfuric acid, and phosphoric acid (Sigma-Aldrich) were properly diluted with ultrapure water to obtain the required solutions for potentiometric measurements.
Solutions for the electrode surface characterization were prepared from sodium chloride, potassium chloride, and potassium hexacyanoferrate (III) (Sigma Aldrich).
Tap water samples were obtained from the lab sink (Department of Chemistry, University of Pavia).
Screen-printed cells with three electrodes, the working and the counter by graphite-ink and the pseudo-reference by silver/silver chloride-ink, were obtained from Topflight Italia (S.P.A.). A picture of a screen-printed cell is reported in Figure S1 of the Supplementary Material. Screen-printed cells with pseudo-reference electrodes; thanks to the low-cost fabrication, robust designs, easy-to-use, and rapid responses, are widespread nowadays for both potentiometric and voltammetric measurements [30,31,32,33,34,35,36,37,38,39].
2.2. Instruments
For pH measurements, a pH meter Mettler Toledo mod. SevenMulti equipped with a combined glass electrode InLab Pro (Mettler Toledo) was used.
Potentiometric analyses and impedance spectroscopy measures were performed by the potentiostat/galvanostat EmStat4s-PalmSens BV (Houten-The Netherlands https://www.palmsens.com/product/emstat4s/ (accessed on 7 June 2022)). Figure S2 of the Supplementary Material shows the experimental setup.
Scanning electron microscopy (SEM) images were acquired by EVO MA10 Scanning Electron Microscope. The measurements were performed under an ultra-high vacuum with an electron generation voltage of 20 kV and a working distance of 8.5 mm.
2.3. MIP’s Prepolymeric Mixture
The prepolymeric mixture consisted of 25 mg of atrazine (ATZ), 48 µL of MAA, 95 µL of EGDMA, and 28 mg of AIBN with a molar ratio of 1:5:4 (ATZ:MAA:EGDMA).
The mixture was deaerated with a gentle flow of N2 for 5 min and sonicated to dissolve atrazine and AIBN. The minimum amount of toluene was added to facilitate and completely dissolve the mixture’s components. An equal prepolymeric mixture not containing atrazine was prepared for functionalizing the working electrode with the NIP (non-imprinted polymer).
2.4. Modification of the Working Electrode Surface by MIP (or NIP)
Each screen-printed cell (SPC) was washed with ethanol and left to dry at room temperature under a hood. A small volume of the prepolymeric mixture (7 µL MIP or NIP mixture) was drop-coated on the cleaned surface of the working electrode. After drop coating, the screen-printed cell was placed in a vacuum desiccator before the subsequent thermal polymerization to avoid oxygen absorption. Then, the thermal polymerization was carried out in a thermostatic oven at 70 °C overnight.
The SPC was then subjected to 5 cleaning cycles by immersion for 1 h in 10 mL of a mixture of acetic acid/ethanol = 1/4 to remove the template (ATZ) and unreacted monomers. The functionalized SPC was stored at room temperature and hydrated in ultrapure water for 10 min before use.
2.5. Electrochemically Active Area of the Working Electrode Surface
The electrochemically active area was determined by cyclic voltammetry (CV) employing as electrochemical probe 5 mM K4Fe(CN)6/0.1 M KCl solution at pH 7.2 (Estart = −1V, Eend = +1 V, scan rate 0.025 ÷ 0.5 V/s). Scan rate’s square root vs. intensity of the anodic or cathodic peak was plotted; from the slope (K), through the modified Randles–Sevick’s equation [38,39], the effective area is obtained by applying the following equation:
C is the concentration of the probe K4Fe(CN)6 (5 mM), D is the diffusion coefficient of the electrochemical probe (for K4Fe(CN)6 D = 3.09 × 10⁻⁶ cm2/s), and n is the number of the electron exchanged in the reduction reaction: Fe(CN)63−+ e− → Fe(CN)64− (n = 1). The computed area is compared with the geometrical one.
The characterization was performed before and after the working graphite electrode surface modification with MIP or NIP.
2.6. Electrochemical Impedance Spectroscopy (EIS) Measurements
EIS determinations were performed, connecting working and counter electrodes of the screen-printed cell to the potentiostat/galvanostat EmStat4s according to the PalmSens instrument guidelines (https://www.palmsens.com/product/emstat4s/ (accessed on 7 June 2022)).
As reported in several papers, screen-printed cells are often used as impedimetric sensors measuring impedance between the two screen-printed electrodes (working and counter) [40,41,42,43,44,45,46] without needing an external counter electrode.
The MIP-modified screen-printed cell was firstly immersed in 15 mL of HCl at pH 1.5 containing atrazine, kept gently stirring for 20 min. In this step, the analyte was accumulated in the MIP’s cavities. Then, the screen-printed cell was immersed in 15 mL of the electrochemical probe 5 mM K4Fe(CN)6/0.1 M KCl solution at pH 7.2, and the impedance measurements were registered at a frequency range from 100 kHz to 10 mHz, with a signal amplitude of 50 mV.
2.7. Potentiometric Measurements
Potentiometric measurements were performed by immersing the MIP-modified screen-printed cell in 15 mL of HCl (or other inorganic acids) at pH = 1.5, gently stirring, and adding portions of 0.01 mL atrazine standard solution 0.47 mM in methanol. The potential was registered after waiting for the stability (stability criterium ΔE/Δt = 0.05 mV/s), i.e., after 5 min, and it was reported as the average of the values sampled in the last 10 s.
3. Results
3.1. Working Electrode Functionalization by MIP
The surface of the graphite working electrode was functionalized by drop-coating a prepolymeric mixture of atrazine-MIP or NIP, following a thermal polymerization at 70 °C. The composition of the prepolymeric mixture was similar to a previously reported one [47,48], with the addition of toluene as a porogen and for better solubilizing atrazine, as previously suggested [49,50,51].
As earlier demonstrated [48], to ensure the largest number of interactions between the polymer and the template in the specific binding sites, the ratio of methacrylic acid to atrazine in the solution must be 5:1.
A drop volume of 7 µL was selected to functionalize only the working electrode and avoid compromising and contamination of the pseudo-reference and counter electrodes. After testing with different volumes, from 3 to 15 µL, the correct quantity was 7 µL since enough to cover the entire surface of the working electrode without encroaching the other two electrodes.
After the thermal polymerization, the complete removal of the template was performed with five cycles of cleaning using a mixture of ethanol/acetic acid = 4/1. After each cycle, the mother liquor was analyzed (by HPLC-UV) for atrazine content, verifying that, after the last cleaning, all template molecules were removed.
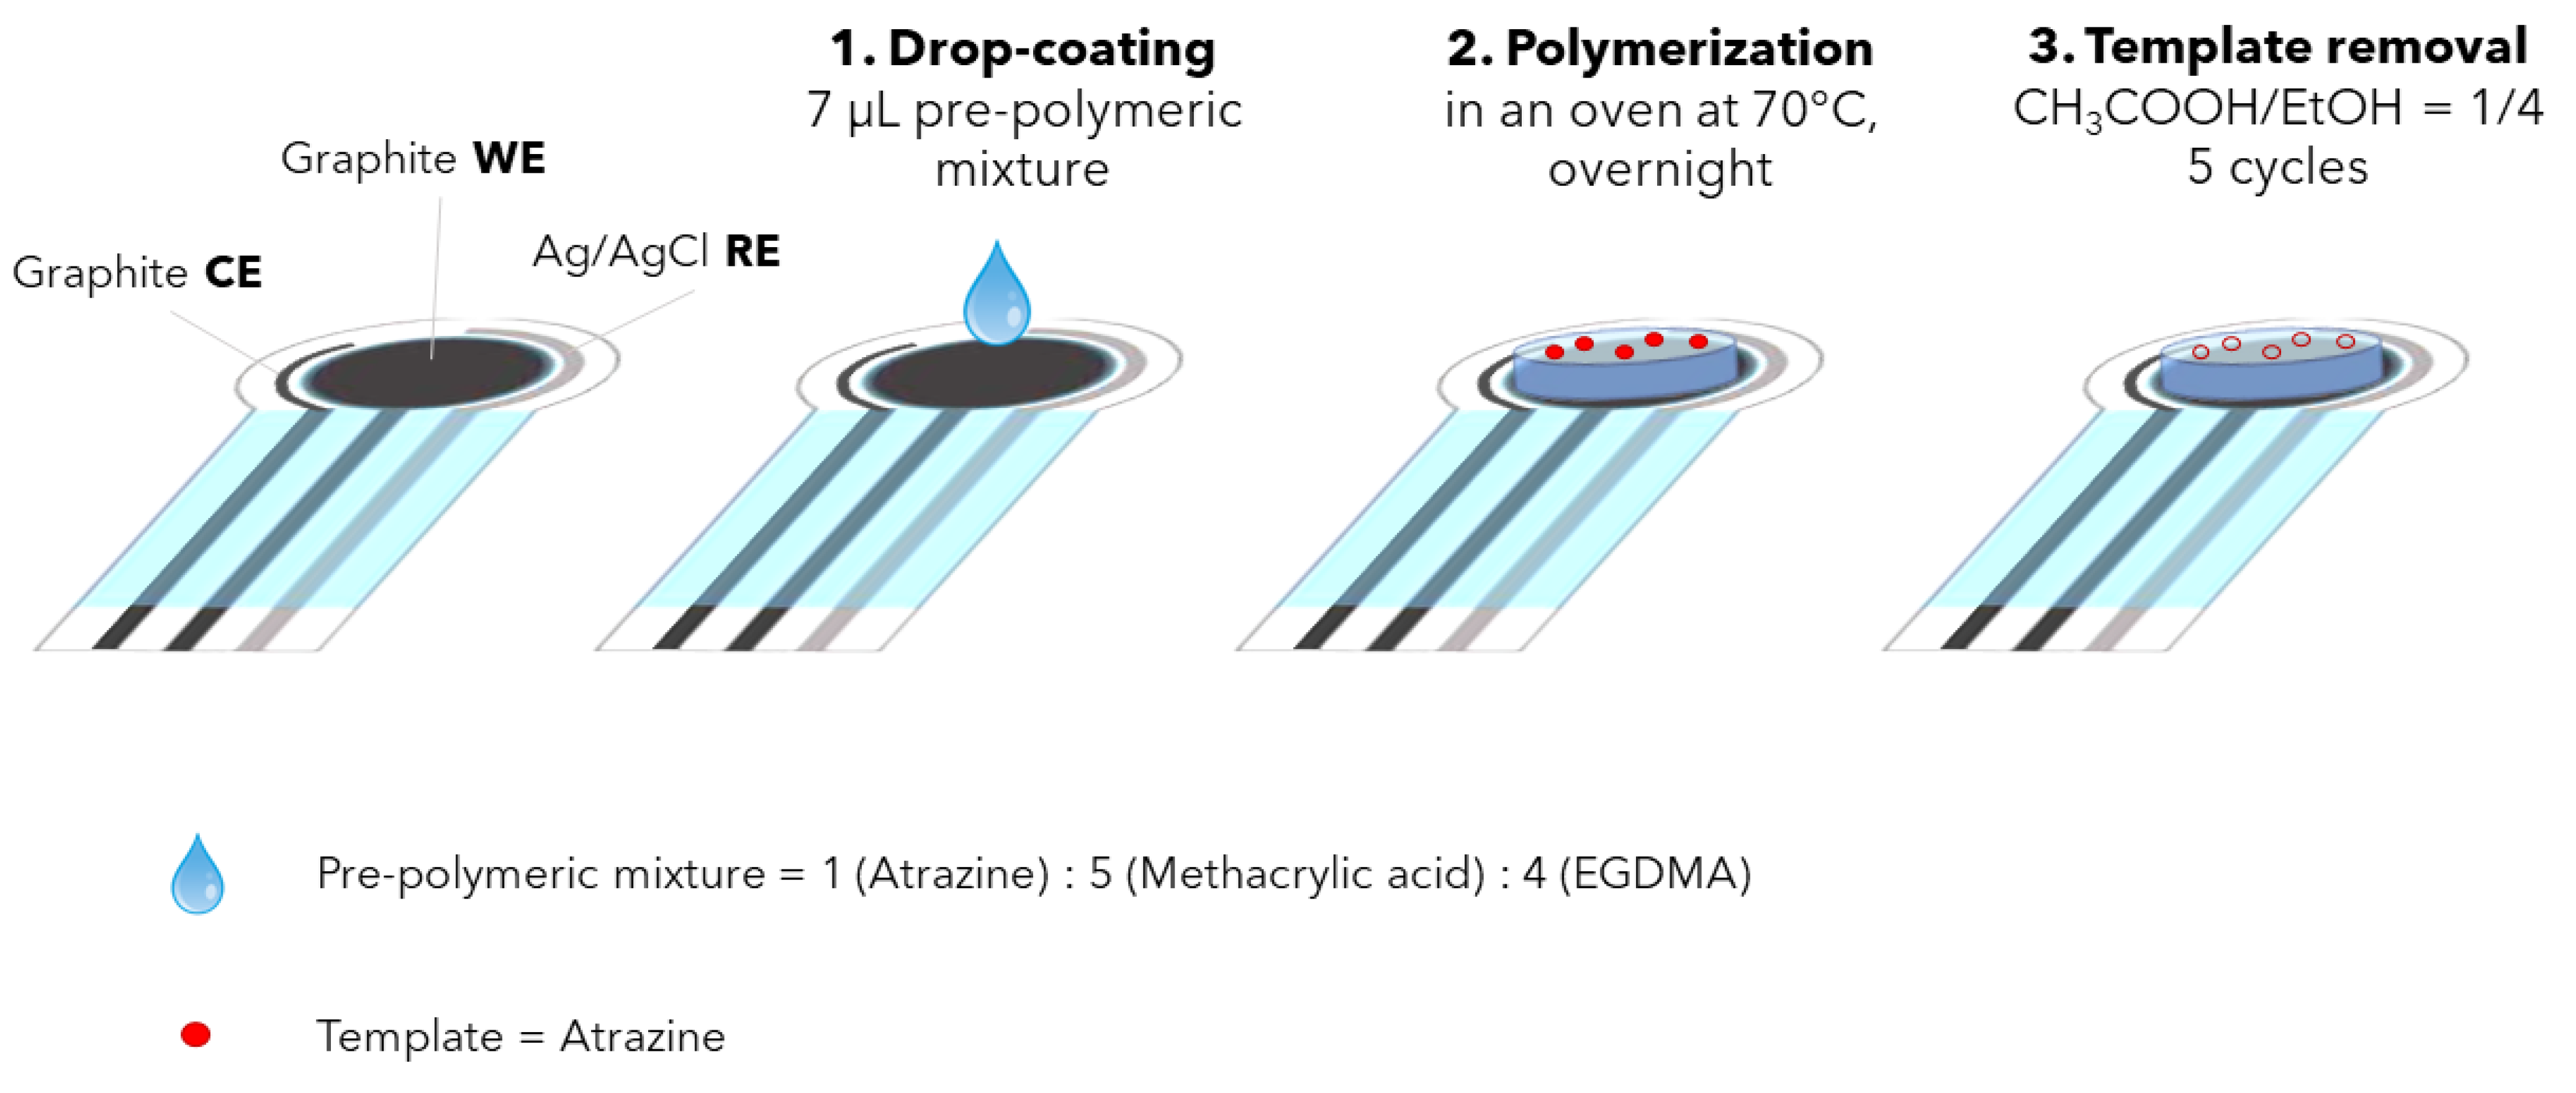
Figure 1 schematized the whole functionalization procedure.
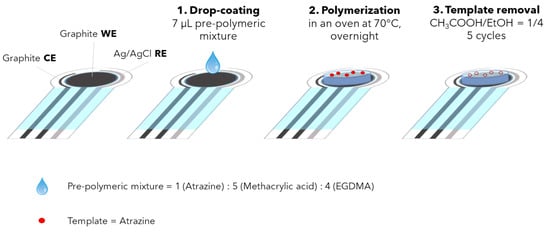
Figure 1.
Procedure for the working electrode’s functionalization with MIP.
The SEM images of the bare and functionalized screen-printed electrodes with MIP or NIP were reported in the Supplementary Material (Figure S3). For the bare electrode (panels a–d), a homogeneous layer of grains (panels c and d) or large platelets (panel b) can be observed due to the gold spattered on the surface, as required for the measurements. For the other sensors (panels e–h for MIP-modified electrode and panels i–n for NIP-modified electrode), compact particles are superimposed on the fine grains layer forming clusters of different sizes and shapes. In particular, the MIP-based electrode has both filamentous and compact particles of 10/20 microns above the material surface. Compared to NIP, MIP has an irregular, rough morphological structure due to the presence of binding cavities. Conversely, the NIP has a regular structure, more similar to that of the bare electrode, due to the absence of imprinted cavities.
3.2. Electrochemically Active Area of the Working Electrode Surface
Before and after modification, the working electrode’s surface was characterized to evaluate the electrochemically active area.
The determination was performed by CV analysis, employing Fe(CN)63− as electrochemical probe. Figure S4 in Supplementary Materials shows the cyclic voltammograms for the bare, MIP, and NIP-modified electrodes.
The modified Randles–Sevcik equation [38,39] was applied for the active area computation obtaining a value of 50(1) mm2 for the cleaned bare electrode, not significantly different from the area provided by the manufacturer, i.e., 50.3 mm2; consequently, the area electrochemically active is the same as the total graphite working electrode surface. The same determination was made on the graphite working electrode covered with the polymer film, either MIP or NIP. In both cases, the area value is lower than that obtained for the bare electrode, and equal to 4.0(8) mm2 and 2.3(3) mm2, respectively, for MIP and NIP. This empirical evidence demonstrated how the presence of the polymer film above the working electrode reduces the electronic transfer capability of the graphite. Moreover, a slightly high area value was obtained for the MIP functionalized electrode, justifiable by the higher porosity than the NIP.
3.3. Electric Characterization of the Working Electrode by Electrochemical Impedance Spectroscopy
Electrochemical impedance spectroscopy (EIS) is an effective technique for understanding modified electrode surface features, providing helpful information such as the kinetics of phenomena at the electrode/electrolyte interface and the successful surface modifications [52]. The data obtained from the EIS plot can be correlated to the physical and chemical properties of the electrode surface, modeling the electrochemical responses by an equivalent electrical circuit (Randles circuit) [53]. In this work, EIS is applied to characterize the atrazine-MIP film on the screen-printed graphite electrode, using Fe(CN)63− as an external electrochemical probe.
The EIS plot (Nyquist plot) typically includes a semicircle and a line. The semicircle at higher frequencies corresponds to a process limited by electron transfer, and its diameter is equivalent to the electron transfer resistance at the electrode/electrolyte interface. The linear part at lower frequencies corresponds to a mass diffusion-limited process [54].
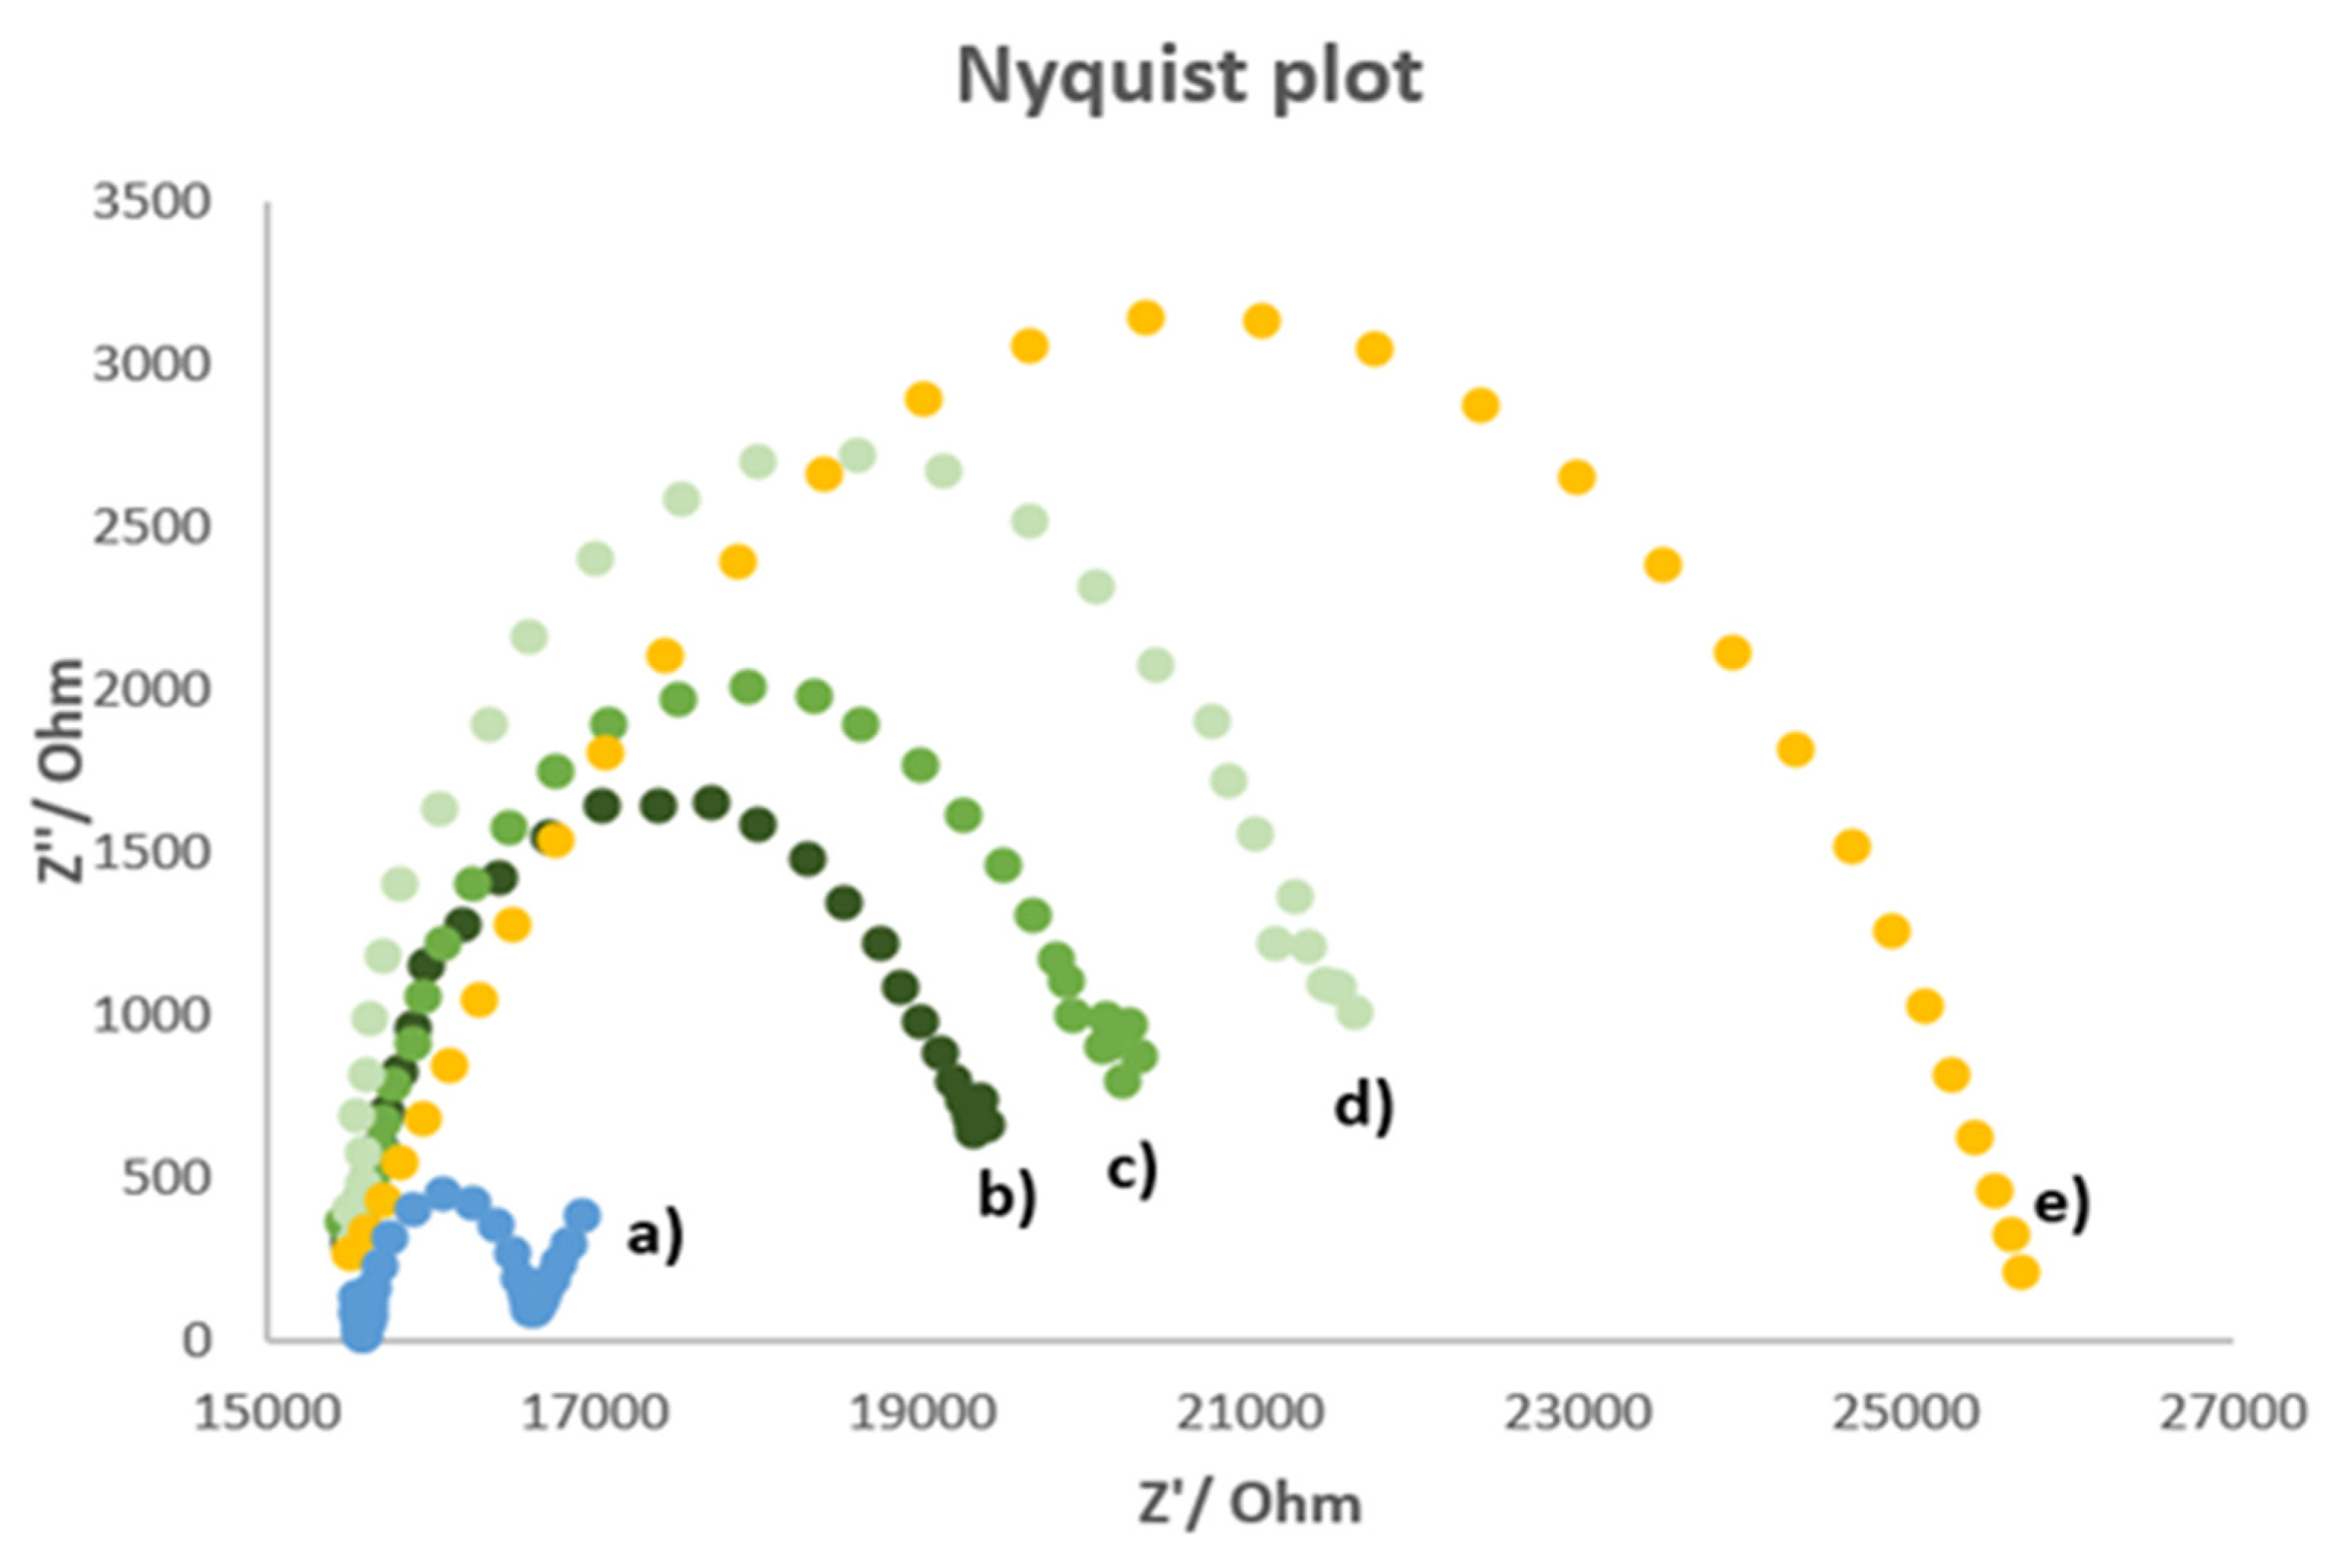
Figure 2 shows the Nyquist plot (imaginary impedance Z” vs. real impedance Z’) obtained for the unmodified electrode (bare electrode) and the MIP-modified electrode before and after the accumulation of atrazine at two different concentrations.
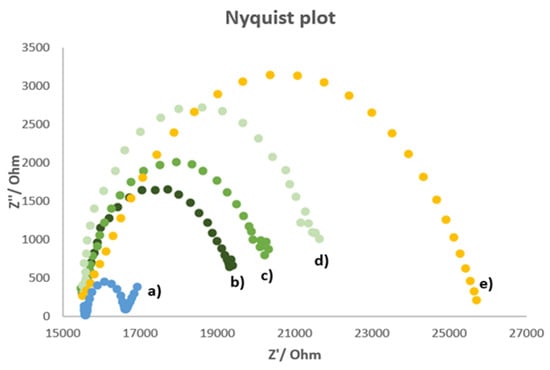
Figure 2.
Nyquist plot of (a) bare electrode, (b) MIP-modified electrode, (c) MIP-modified electrode charged with 10−6 M atrazine, (d) MIP-modified electrode charged with 7.7 × 10⁻⁶ M atrazine, (e) NIP-modified electrode. Measurements performed in 5 mM K3Fe(CN)6/0.1 M KCl solution; frequency range 100 kHz ÷ 10 mHz; signal amplitude = 50 mV.
All phenomena at the MIP- and NIP- modified electrodes (a) and at the bare electrode (b) may be schematized with the Randles circuits shown in Figure 3. R1 corresponds to the solution resistance, R2 is the electron transfer resistance (i.e., the diameter of the semicircle in the Nyquist plot), C1 is the double-layer capacitance, and Zw is the Warburg impedance which is due to the mass diffusion-limited process.

Figure 3.
Randles equivalent circuit of (a) MIP-modified electrode, (b) bare electrode.
As can be observed from Figure 2, only for the bare electrode’s plot appeared the linear part characteristic for a process limited by mass diffusion. Moreover, the bare electrode had the lowest charge transfer resistance. This phenomenon can be attributed to the non-conductive nature of the imprinted polymer. Indeed, the resistance increases if there is an obstacle to the electrons’ movement, such as the polymeric film on the electrode surface. Since some cavities are present in the MIP film, a lower resistance was observed for the cleaned MIP-modified electrode compared to that of the electrodes with the polymeric film recharged with atrazine. This behavior can be explained by considering the atrazine molecules as shutters of the polymer’s cavities obstructing the charge transfers; in fact, the resistance increases by increasing the atrazine concentration. The NIP-modified electrode has the highest charge transfer resistance; this behavior is due to the absence of cavities formed by the template. In this way, the non-imprinted polymer passivates the working electrode surface preventing the charge transfer.
3.4. Potentiometric Determination of Atrazine by the MIP-Based Screen-Printed Cell
After functionalization and characterization of the screen-printed cell’s working electrode, an analytical method to determine potentiometrically atrazine was developed. Firstly, for making the MIP-functionalized working electrode an ion-selective potentiometric sensor, it was necessary to perform the measurements at a sufficiently acidic pH to be sure that the main species of atrazine in the aqueous solution was its protonated form; therefore, HCl solution at pH 1.5 was used as the ionic medium.
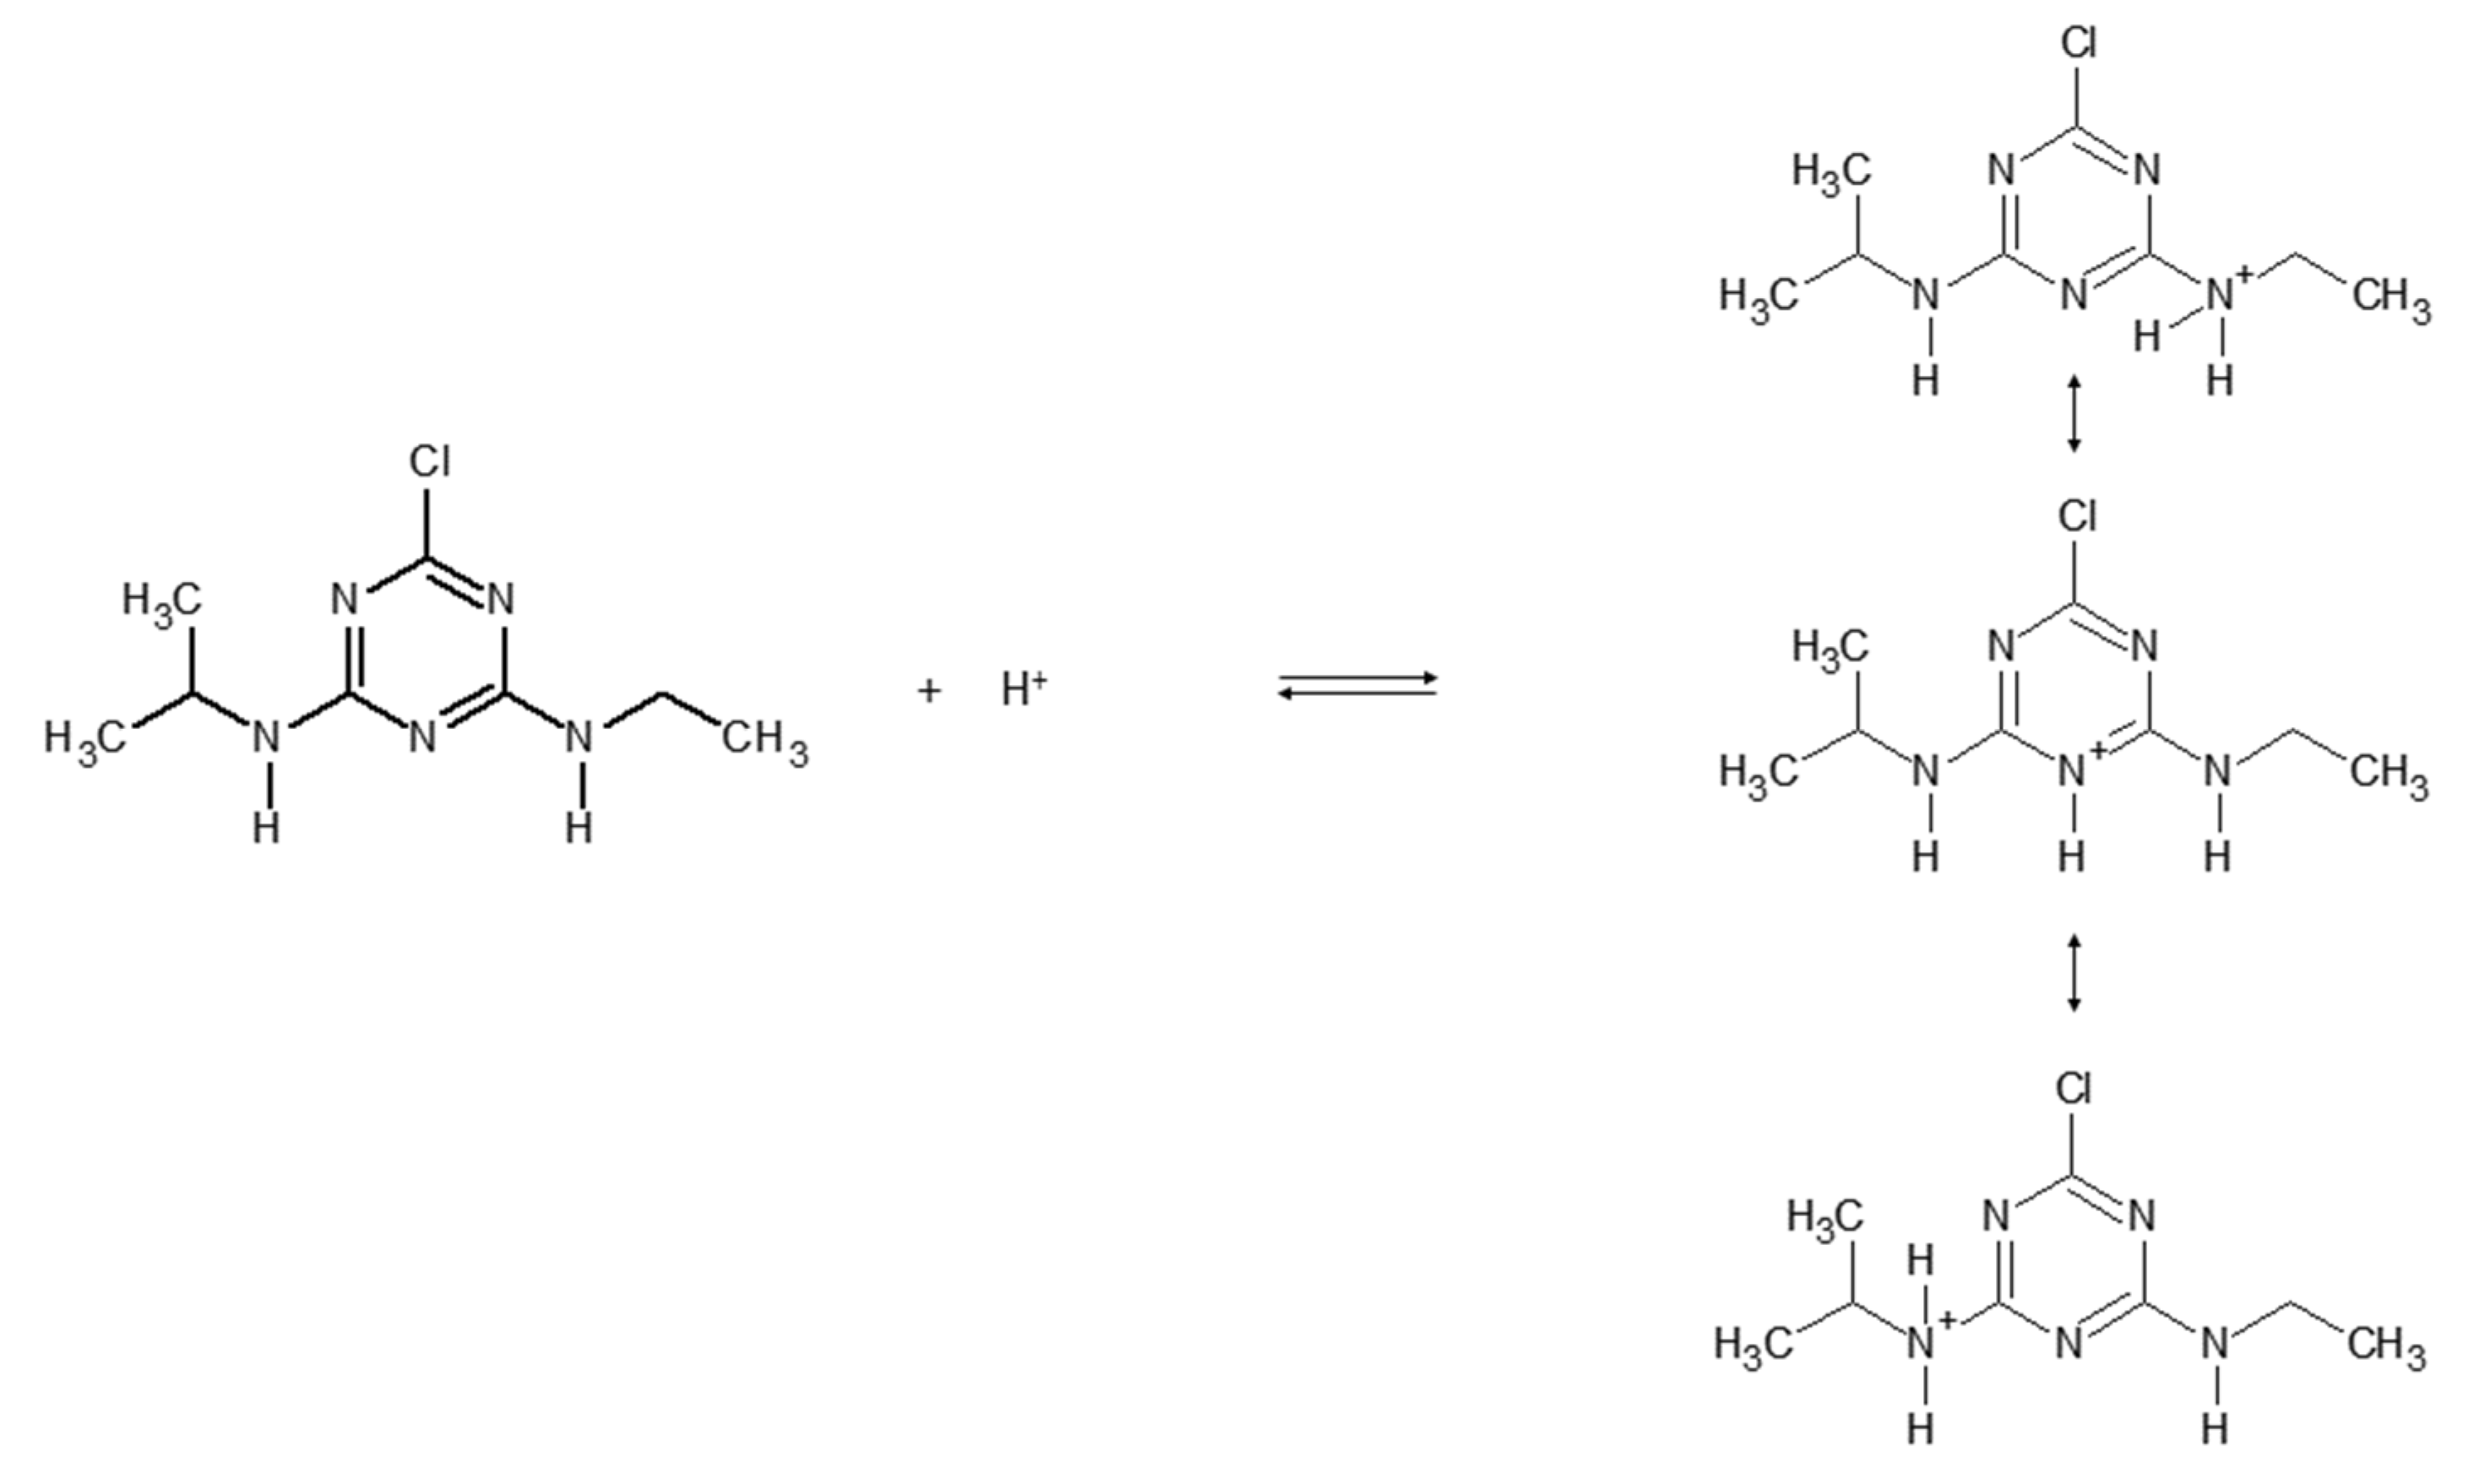
Figure 4 reports the protonation equilibria of atrazine, with a dissociation constant pKa = 1.7 [28,29].
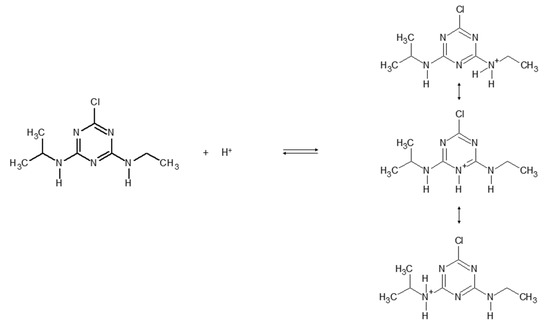
Figure 4.
Protonation equilibria of atrazine.
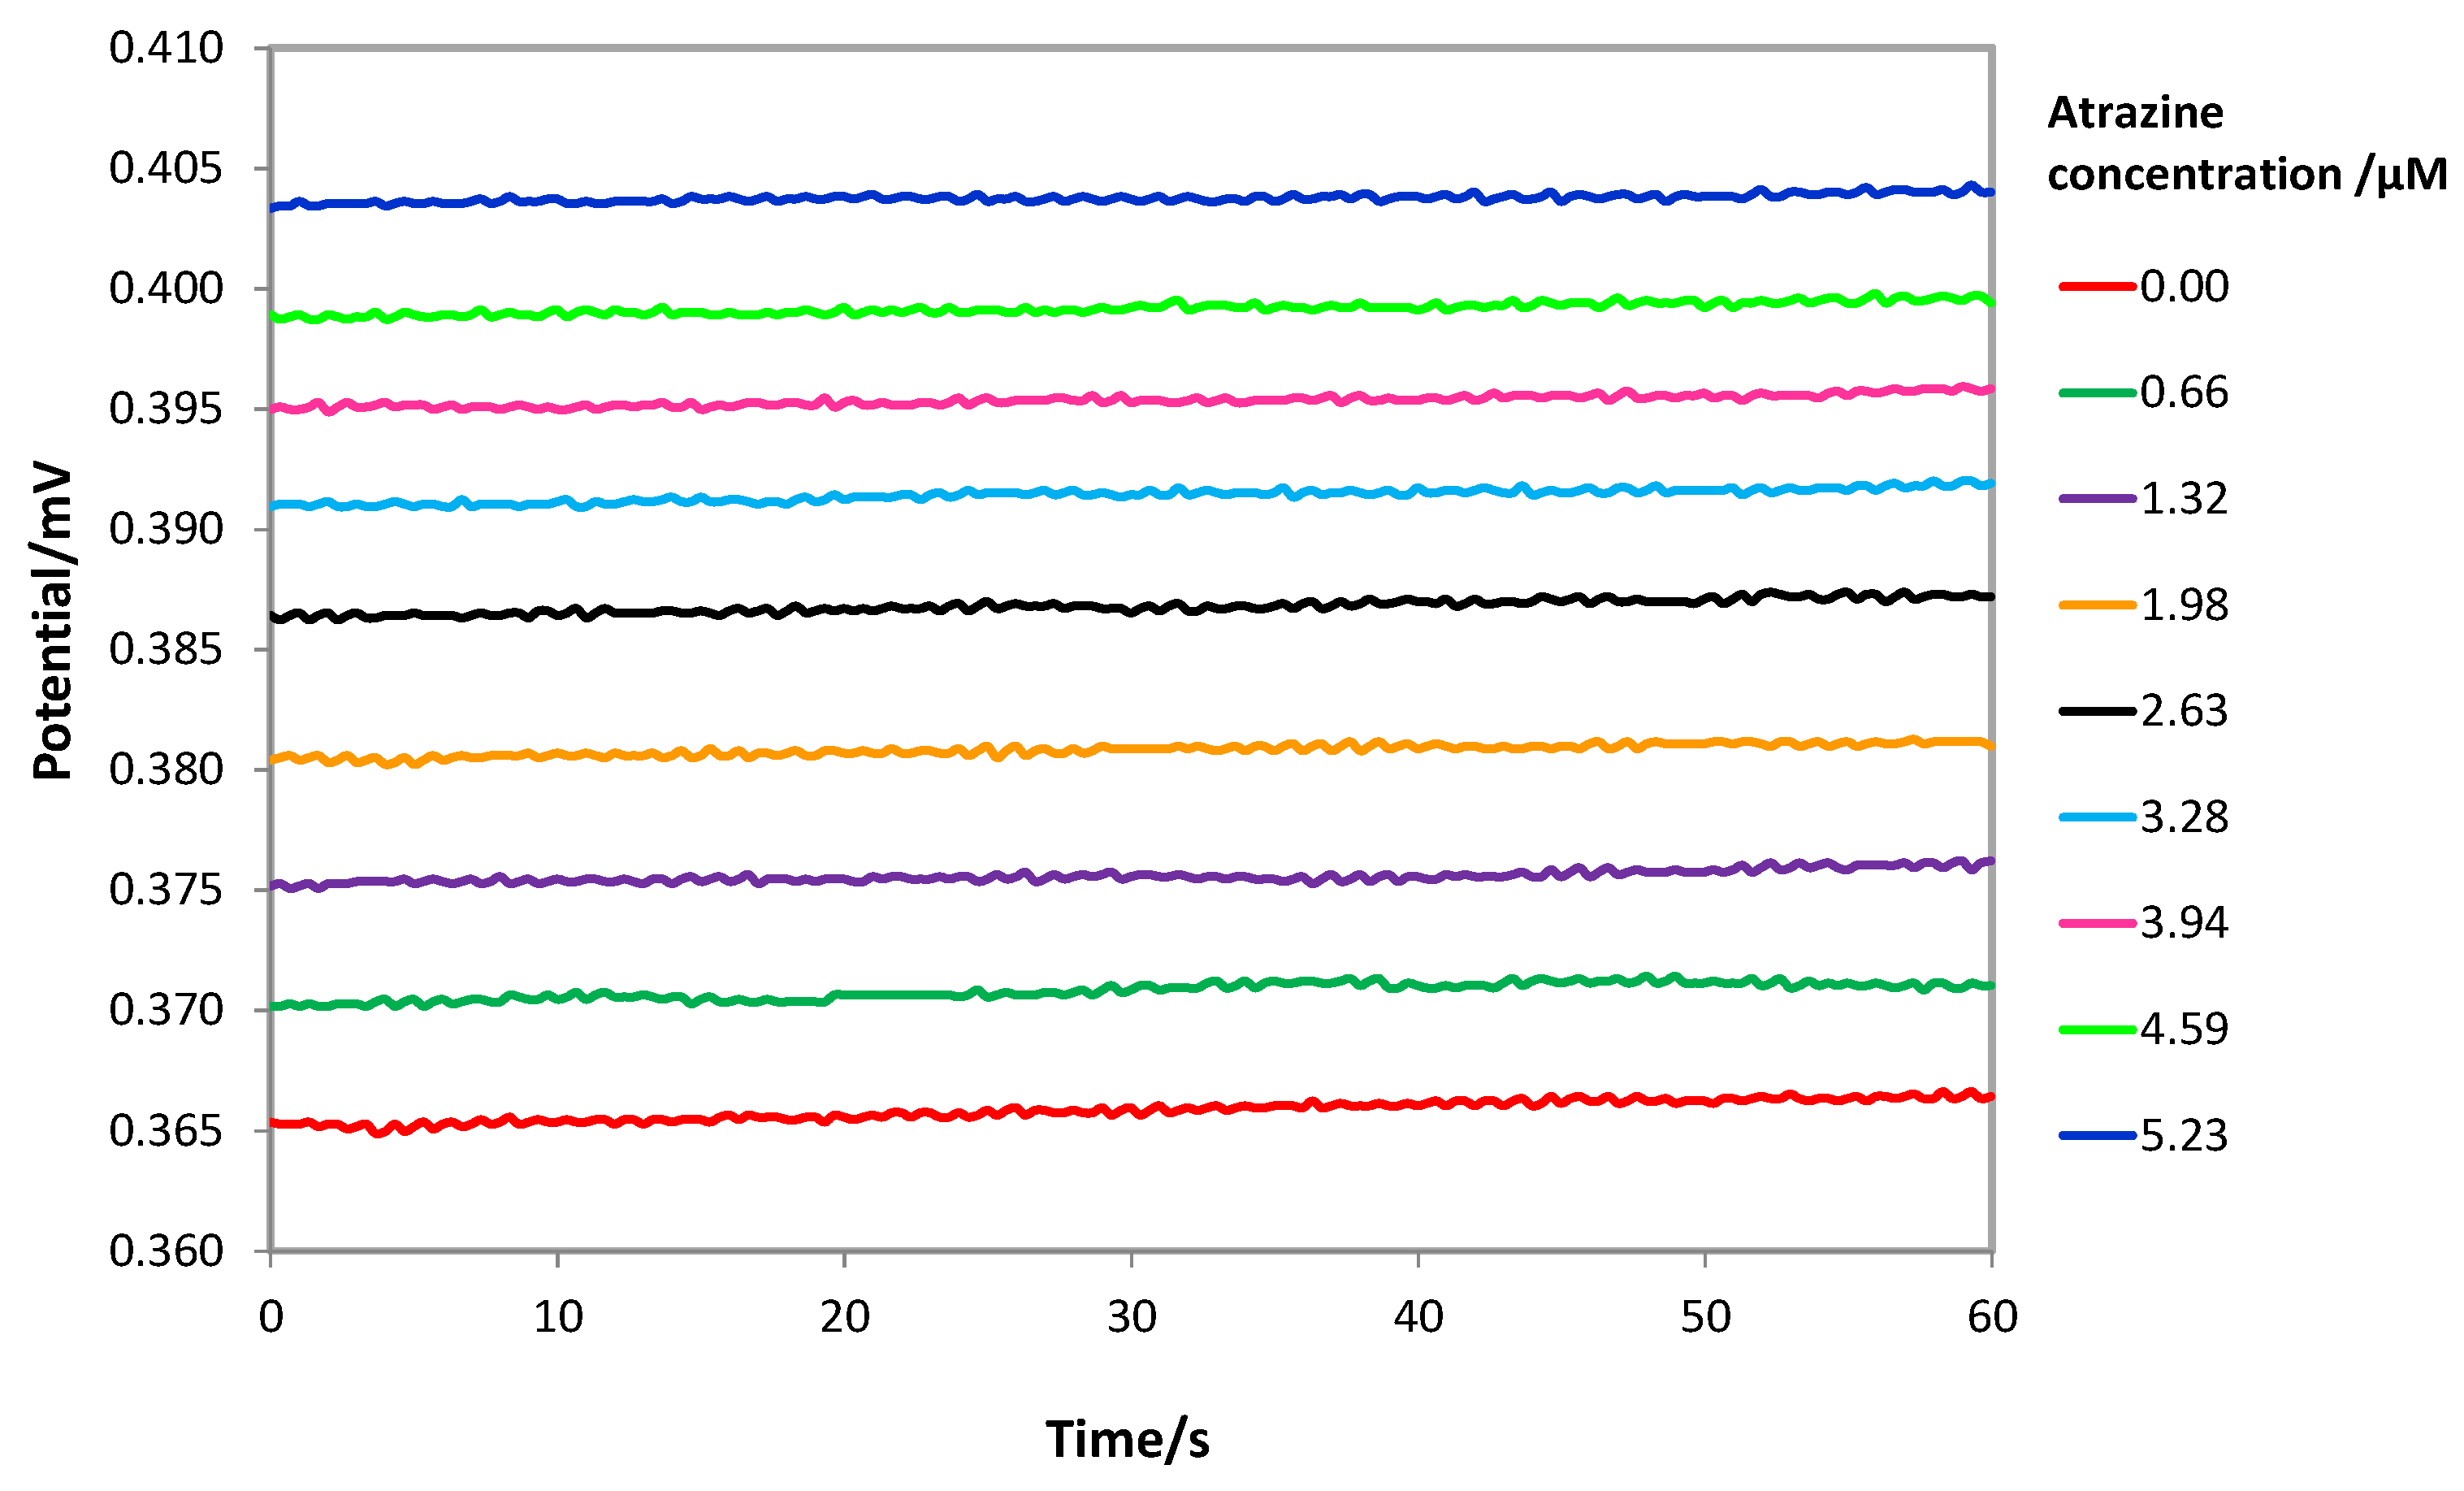
Measurements were performed by immersing the screen-printed cell in 15 mL of the acid solution, gently stirring. At each addition of a standard atrazine solution, the potential was registered and reported as the average of the values sampled in the last 60 s after waiting for the steady state (stability criterium ΔE/Δt = 0.05 mV/s). It was verified that the steady state could be reached in 5 min (See Figure S5 in Supplementary Materials), which is a relatively long time, and it is probably due to the slow diffusion of atrazine across the MIP layer. As an example, Figure 5 shows the potentiometric response of a MIP-based screen-printed cell at different atrazine concentrations.
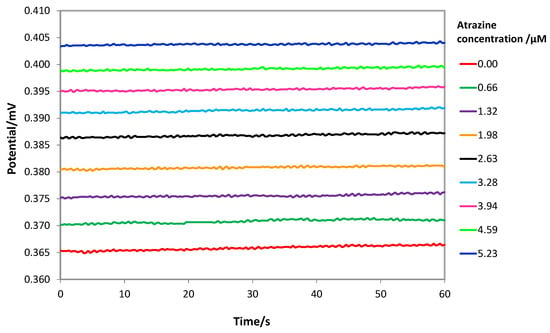
Figure 5.
Potentiometric response of a MIP-based screen-printed cell at different atrazine concentrations in HCl solution at pH = 1.5. Steady state reached in 5 min. Cell potential registered in the last 60 s.
By adding atrazine, the potential increased with the logarithm of the analyte concentration according to the well-known Nernst’s law.
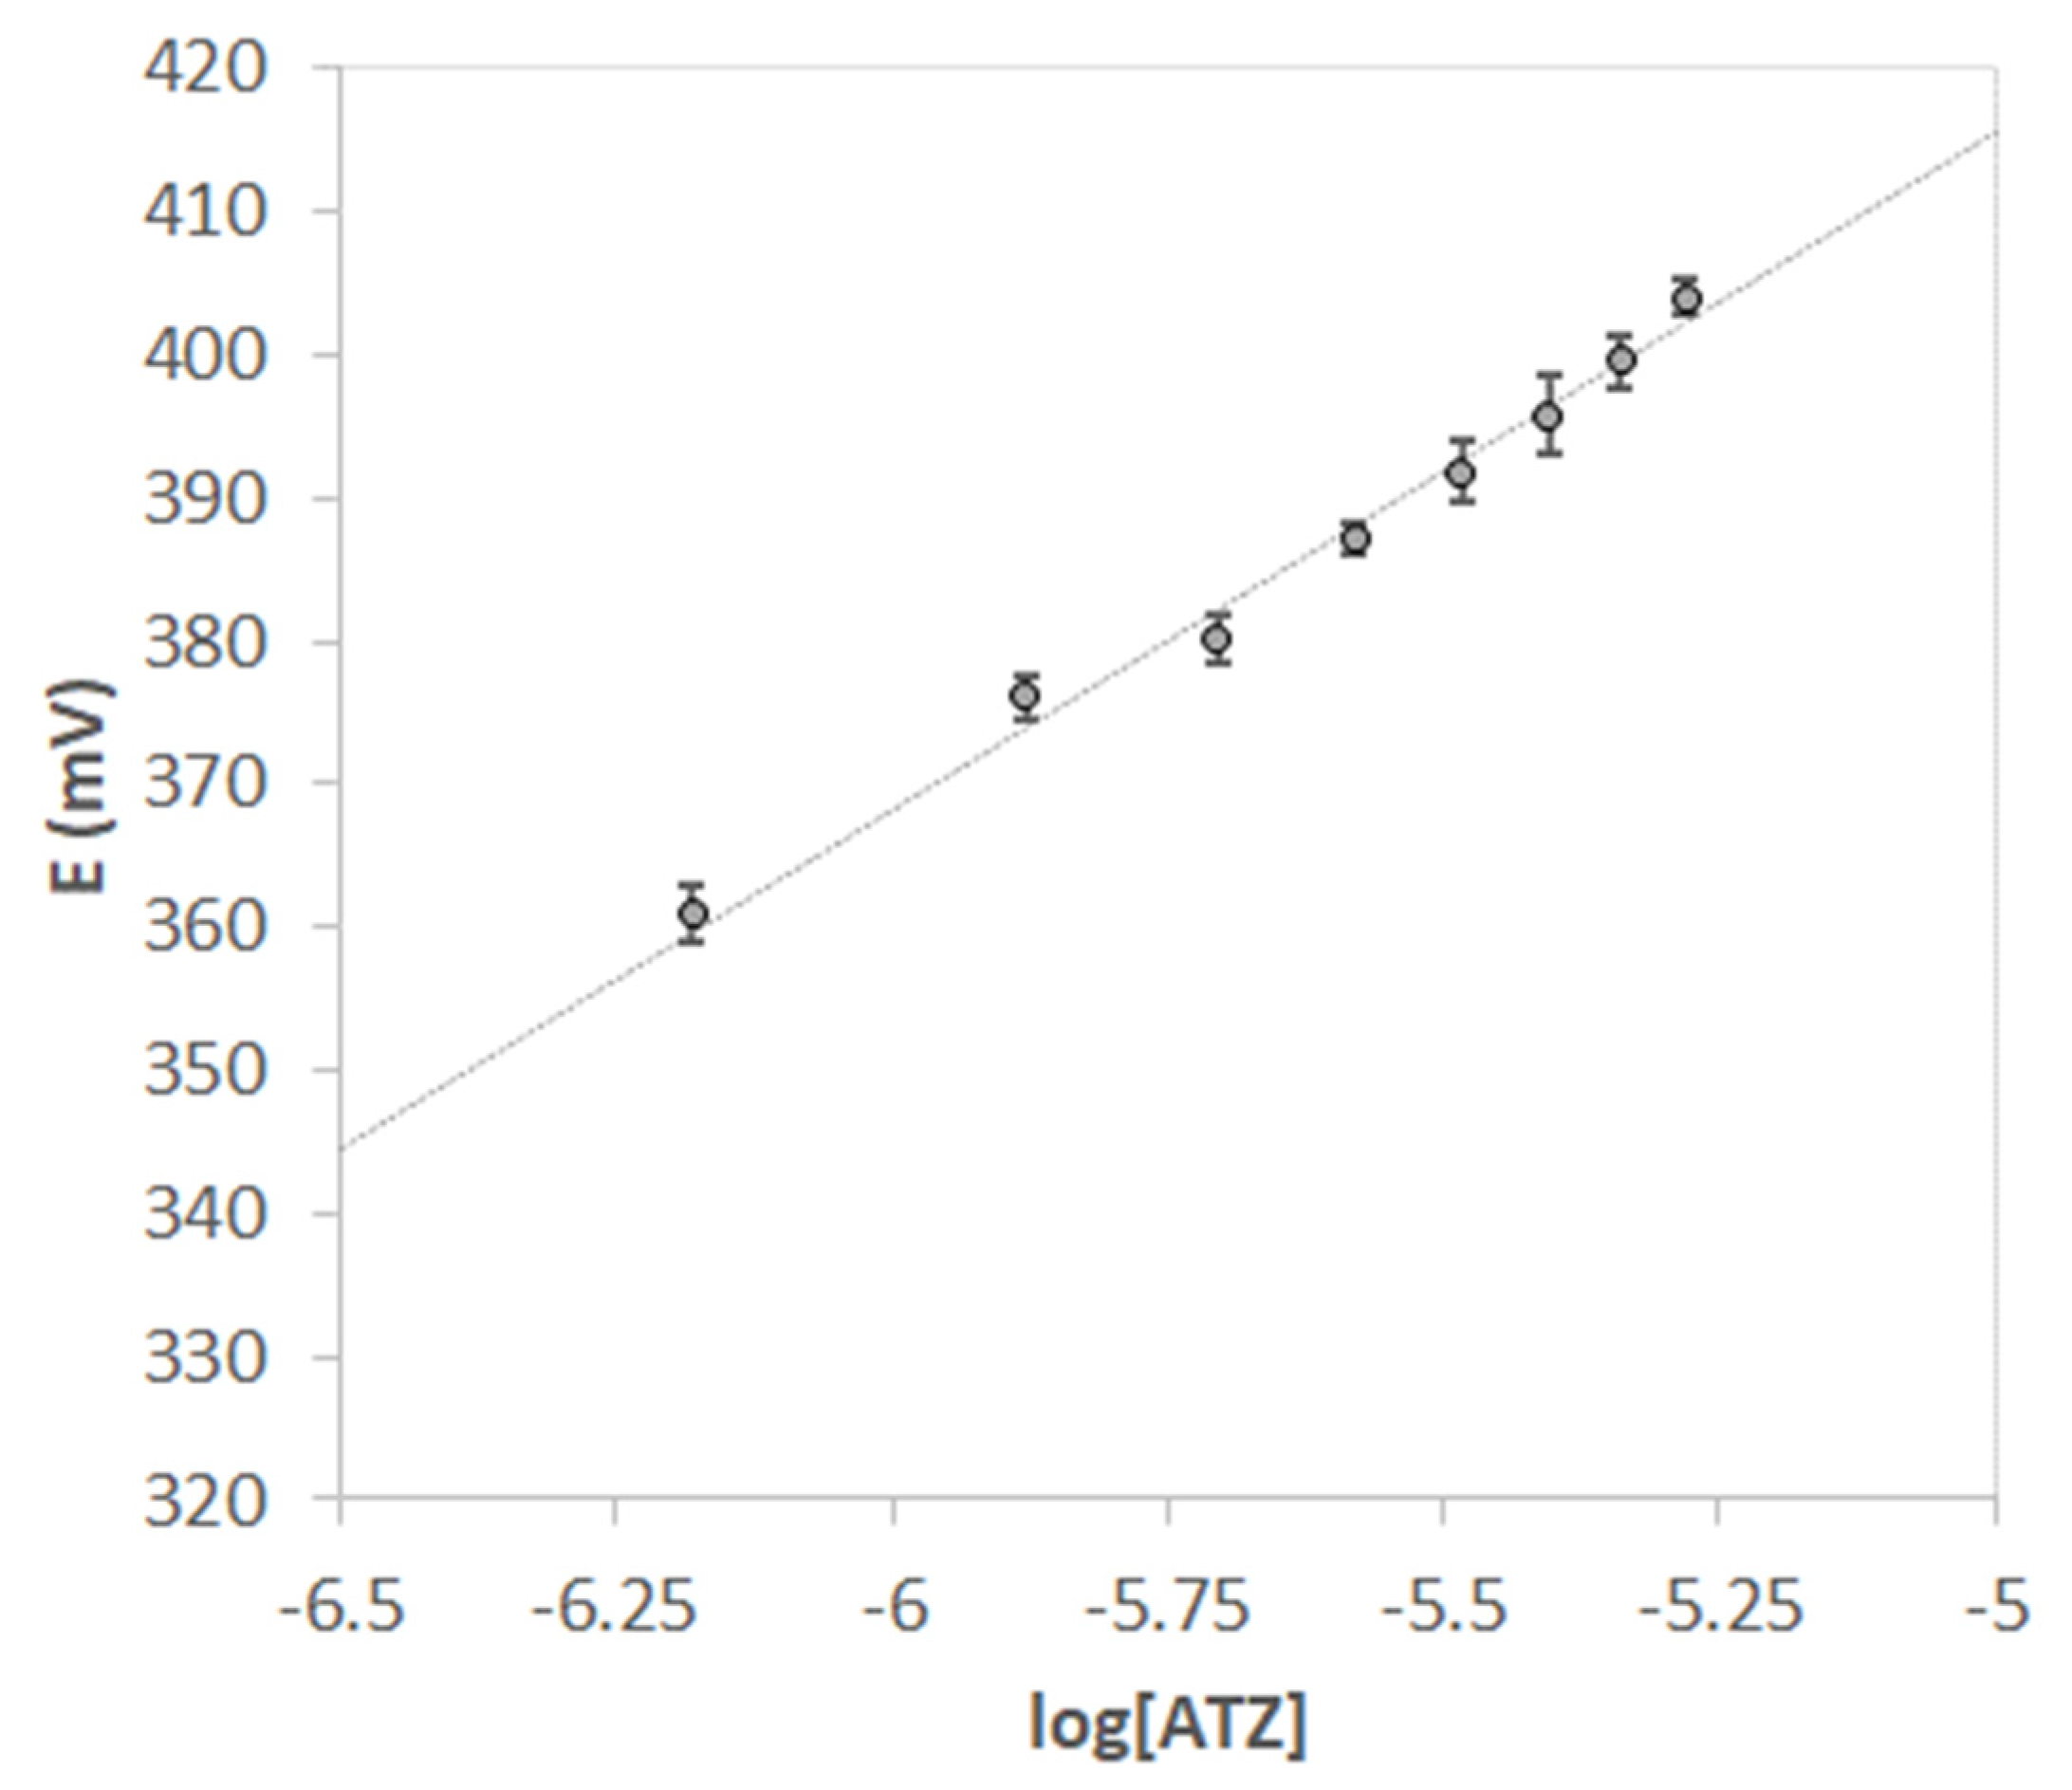
Since the screen-printed cells are disposable and removing the MIP layer would require a cleaning procedure that could compromise the electrodes, calibration curves were realized using five screen-printed cells, all functionalized with the same procedure. The calibration curve of Figure 6 shows the average of the potential values (mV) vs. the logarithm of atrazine concentration (M); error bars represent the standard deviation of the measurements performed with the different screen-printed cells.
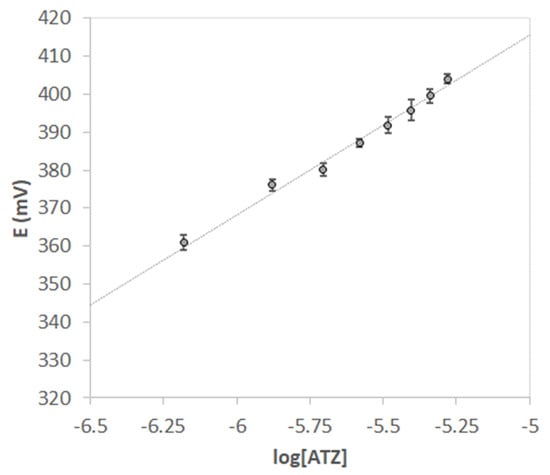
Figure 6.
Nernst’s plot E vs. log [ATZ]. V = 15 mL of HCl pH = 1.5. Each point is the mean of 5 measurements obtained with different screen-printed cells. Error bars correspond to the standard deviation of the measurements.
For potentiometric measurements, when the potential is correlated with the logarithm of the analyte concentration, the limit of detection (LOD) is usually determined according to the IUPAC definition, i.e., the point of intersection between the Nernstian part of the graph at high analyte concentrations and the nearly horizontal one at low concentration [55]. The LOD so defined depends on the given electrode calibration performed in a particular set of experimental conditions. On the other hand, the most general definition of LOD is the concentration of the analyte that can be measured with an assumed degree of confidence. This definition accounts for both the method’s sensitivity and precision. It is also perfectly consistent with potentiometric measurements; moreover, it is a more rigorous approach and allows a direct comparison with other analytical methods [56]. Based on the last definition, the value of the LOD was here computed by the following relation:
where sy/x is the standard deviation of y-residuals (i.e., the random errors in the y-direction) and b the slope of the linearized Nernst’s plot (10E/slope vs. [ATZ]); sy/x is considered not significantly different from the standard deviation of multiple measurements of blank solutions [57].
The value of the LOD obtained from the five electrodes calibration was 0.40(2) µM (here and after in the text, numbers in parenthesis are the standard deviation on the last digit).
Although the low detection limit was obtained, the standardization curve’s linearity range is fairly small, only one decade of concentration change, but enough to determine atrazine residuals in polluted environmental samples.
Compared to other previously proposed potentiometric methods (see Table 1), the presented MIP-based screen-printed potentiometric cell allows the atrazine detection at less than 1 µM concentration level, using a simple functionalization procedure, disposable sensors, and low-cost apparatus; moreover, it is adaptable for in situ measurements.

Table 1.
Comparison with other potentiometric methods for atrazine detection.
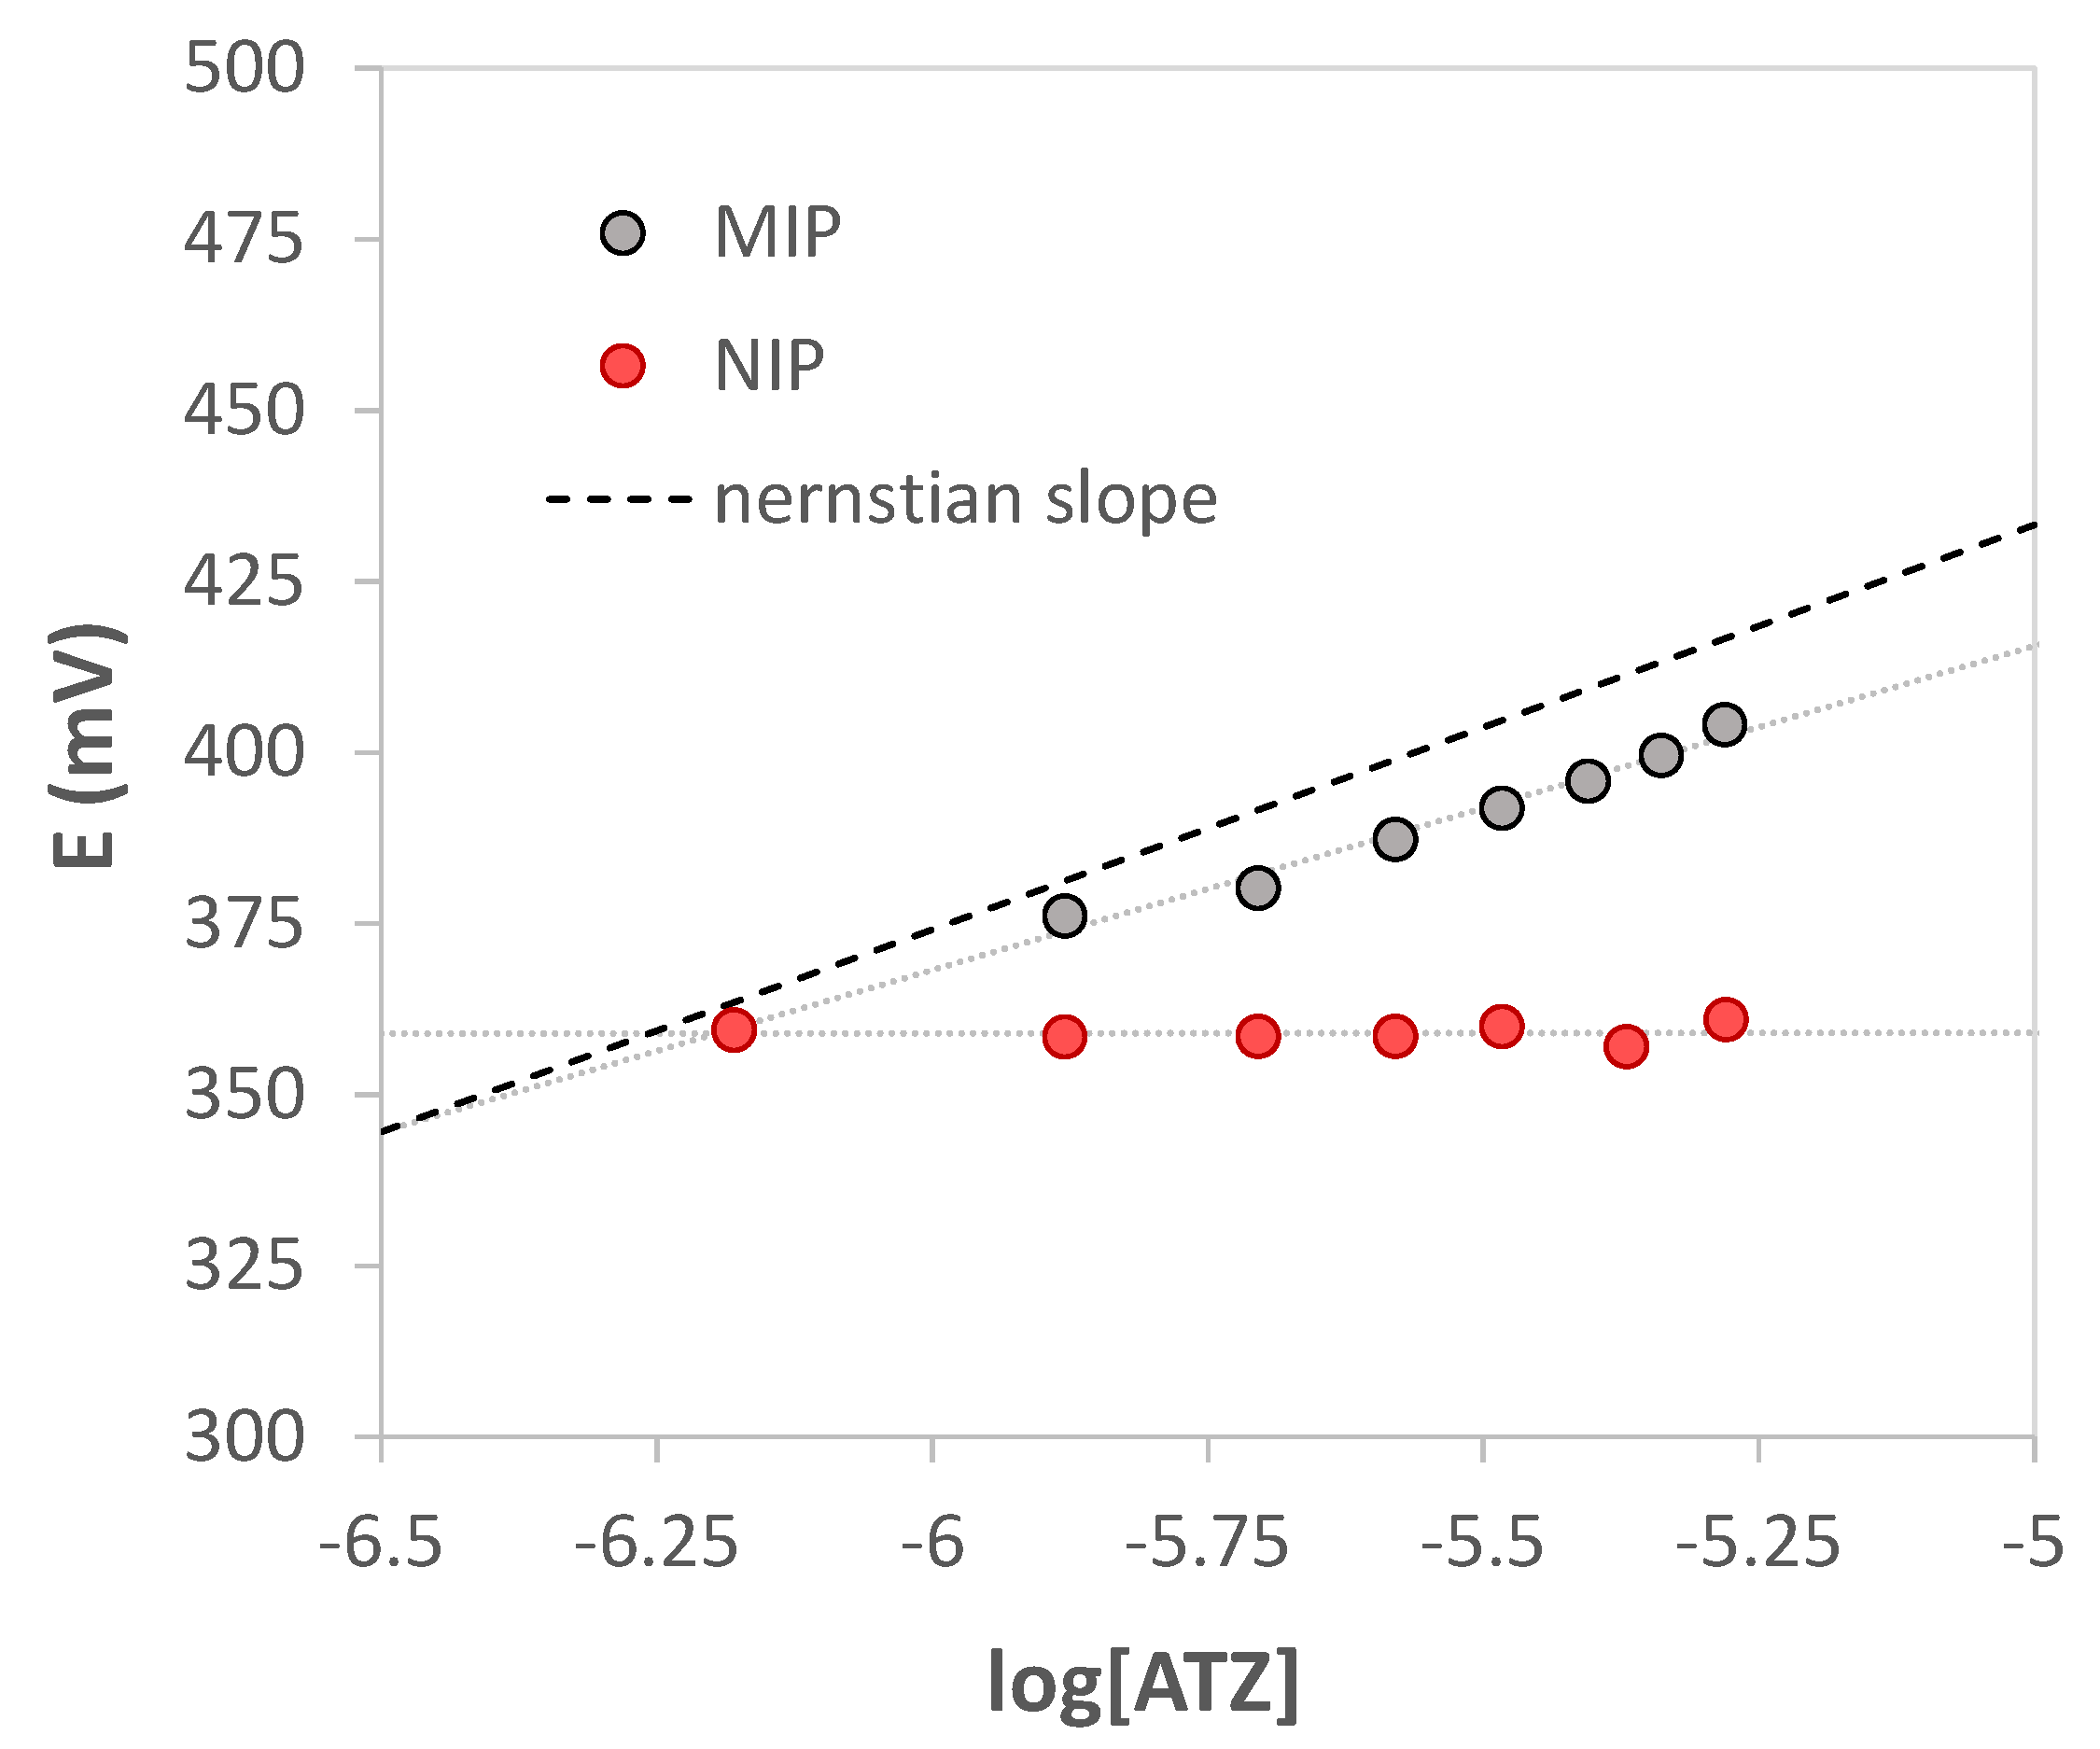
Analogous calibration curves were performed with the working electrode modified with the non-imprinted polymer (NIP); the slope near zero indicated the poor interaction with atrazine since the absence of the specific cavities in the polymer. A comparison between two calibration curves obtained with electrodes functionalized with MIP and NIP, respectively, is shown in Figure 7.
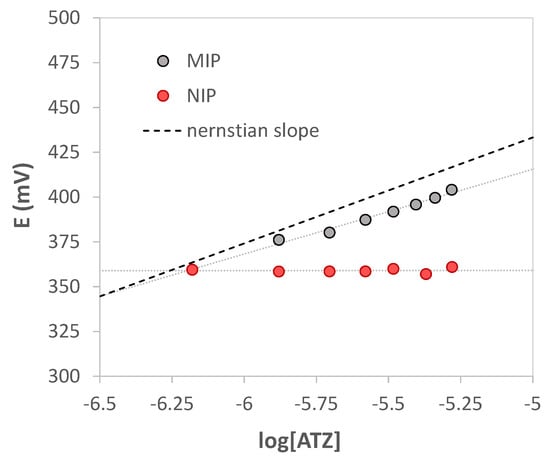
Figure 7.
Nernst’s plot E vs. log [ATZ]. V = 15 mL of HCl pH = 1.5. grey bullets MIP, red bullets NIP. The dotted black line represents the theoretical Nernstian slope for monovalent cation.
Since atrazine at pH 1.5 is monoprotonated, from the graphs E (mV) vs. log [ATZ], a Nernstian slope of about 59.2 mV/dec should be expected. Nevertheless, a sub-Nernstian slope was obtained equal to 40(6) mV/dec (see Figure 5). An attempt was therefore made to understand this behavior.
In an interesting work by S. Amemiya et al. [60], the sub-Nernstian slope is justified for neutral ion-selective membranes, considering the effect of ions of opposite charge to the primary one (see pages 3336–3337 of ref. [60]), which can interact with the active site of the polymer. In several other papers, the same interpretation for the non-Nernstian behavior was considered both for classical ISEs and also for potentiometric screen-printed electrodes [61,62,63,64,65,66,67]. So, taking a cue from this work, by assuming the MIP film over the screen-printed electrode as a neutral membrane since the carboxylic groups of the methacrylic acid (used as the monomer in MIP synthesis) is undissociated at pH 1.5, we wondered how anions could “enter” the membrane. Presumably, an ion pair is formed between the protonated atrazine and the anion (conjugate base) of the acid used as the ionic medium.
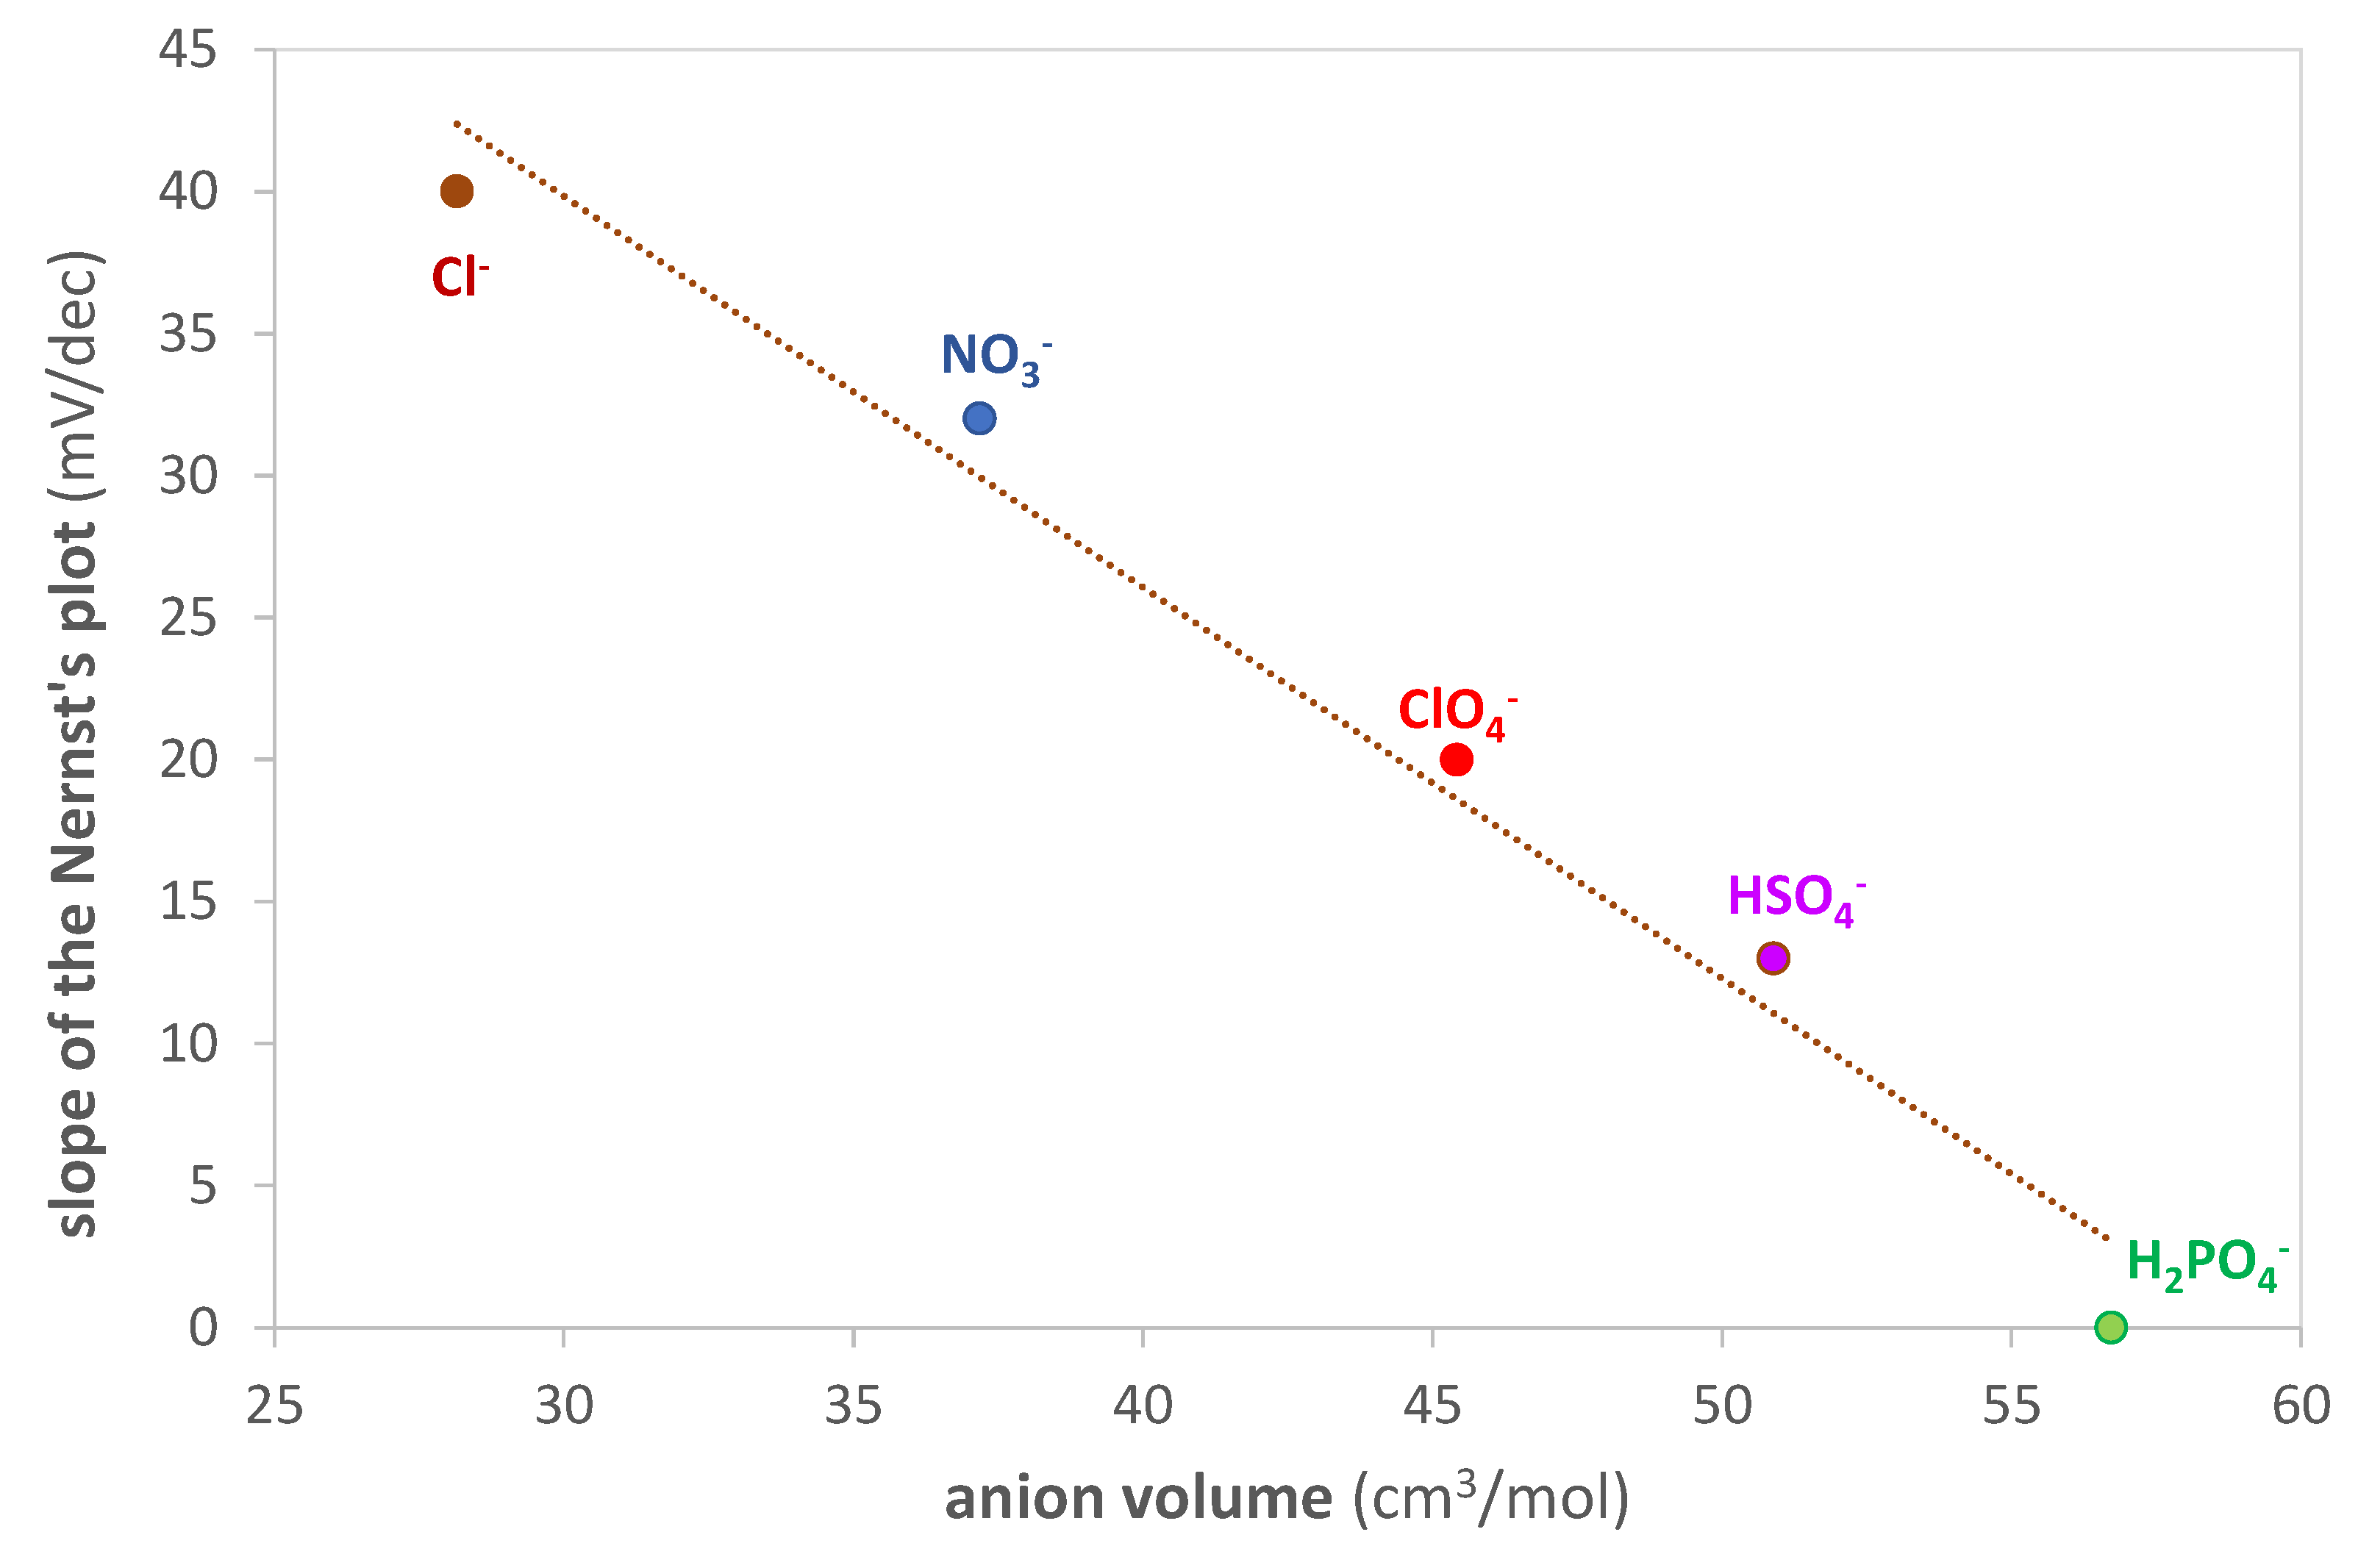
Therefore, it was decided to investigate this aspect deeply by performing standardization curves always at pH 1.5 but using different inorganic acids (HCl, HNO3, HClO4, H2SO4, H3PO4).
An interesting linear correlation is obtained by graphing the standardization curve’s slope as a function of the anion volume (calculated using Gaussian 6.0 software [68]), as shown in Figure 8. In particular, as the size of the anion increases, the slope decreases. The larger size of the ion pair probably results in greater difficulty for the analyte to reach the active site of the polymer.
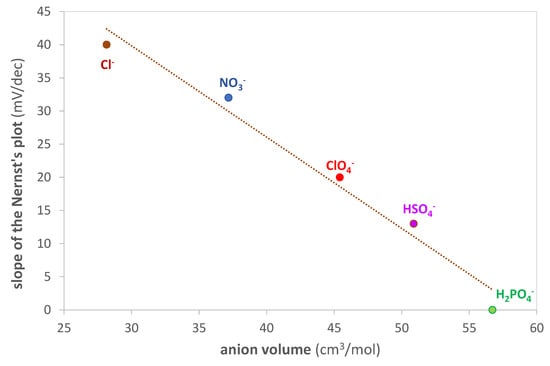
Figure 8.
Slope of the Nernst’s plot (mV/dec) vs. anion volume (cm3/mol) of the inorganic acids used as the ionic medium. Anion volume computed with Gaussian 6.0 software [68].
Given these results, it is evident that using an acid with a small anion, such as Cl−, is appropriate for obtaining a sufficiently sensitive sensor.
3.5. Interferences
The selectivity of the prepared sensor was determined by building standardization curves with three different pesticides: simazine, ametryn, and bentazone; the first two are triazine herbicides, while the last one is diazinic. The structures of the three pesticides are shown in Figure 9.

Figure 9.
Structure of the pesticide used for interferent’s test.
The following Table 2 reports the slopes of the standardization curve (E vs. log concentration) obtained by analyzing solutions of each of the three pesticides taken individually; the last row reports the value of the slope obtained for atrazine to have an immediate comparison.

Table 2.
Slopes of standardization curves (in HCl at pH 1.5) for the pesticides, analyzed as interferents: simazine, ametryn, and bentazone. For comparison, the slope of the standardization curve for atrazine is shown in the last row. Numbers in parenthesis are the standard deviations on the last digit.
As can be observed from the table, the bentazone does not cause interference; in fact, the electrode responded with a variation of the potentiometric signal irrelevant to increasing the analyte concentration. This behavior was predictable considering the quite different structure compared to atrazine.
Simazine and ametryn are structurally similar to atrazine; indeed, the signal varies proportionally with increasing analyte concentration. The slope is lower than that for atrazine but not enough to define their presence as negligible. These results were also relatively unsurprising, and for samples containing triazine pesticides, the proposed method cannot distinguish between them, and only a total concentration can be achieved.
3.6. Real Sample Analysis
To demonstrate the applicability of the potentiometric MIP-based screen-printed cells, portions of a tap water sample, acidified at pH 1.5, and fortified with different concentrations of atrazine, were analyzed using the standard additions method.
Table 3 summarizes the results of the recovery experiments.

Table 3.
Recovery experiments. Portions of a tap water sample, acidified at pH 1.5 with HCl and fortified with atrazine.
As shown in Table 3, the % recovery values between 91.7% and 105.1% were obtained; the precision was pretty good since the highest value of the % RDS is 5.4.
These results were promising for successfully applying the developed method to atrazine detection in environmental samples.
4. Conclusions
A new potentiometric MIP-based screen-printed sensor for pesticide atrazine detection was developed. The imprinted polymer can sorb atrazine thanks to the weak interaction between the analyte and the monomer’s acidic groups.
The MIP’s prepolymeric mixture was drop coated on the surface of the graphite working electrode of the screen-printed cell.
Before and after modification with the MIP film, the working electrode surface’s features were investigated using CV and EIS techniques using a ferrocyanide/ferricyanide external probe.
The specific sites obtained after polymerization and template elution can be viewed as the ionophore of a usual ISE membrane. The active ion is the atrazine in its protonated form, positively charged, so the determination was carried out in acid solutions at pH 1.5.
The measurements obtained showed pretty good sensitivity for atrazine sensing with a detection limit of 0.4 µM.
The sensor’s selectivity is closely related to the geometry of the polymer cavity; for this reason, the sensor cannot discriminate herbicides with molecular structures very similar to atrazine (triazine herbicides) while does not respond to other diazinic herbicides or of very different structures.
The slope of the standardization curve is sub-Nernstian; as previously observed, this behavior is attributable to the interaction of the anion of the acid used as the ionic medium with the polymer cavities. Indeed, it has been demonstrated that as the size of the anion increases, the slope decreases, deviating more and more from the Nernstian value.
The method’s applicability to actual samples was verified by analyses of fortified tap water. The satisfying results and the rapid and simple procedure, adaptable for in situ analysis, make the method promising for atrazine detection in environmental samples. The LOD is indeed higher than the atrazine concentrations found in unpolluted or low-polluted waters; however, the electrode can sense atrazine in contaminated wastewaters or soils.
Supplementary Materials
The following supporting information can be downloaded at: https://www.mdpi.com/article/10.3390/chemosensors10080339/s1, Figure S1: (a) Picture of the screen-printed cell Topflight Italia (S.P.A.). The working (WE) and the counter electrodes (CE) by graphite-ink and the pseudoreference electrode (RE) by silver/silver chloride-ink. (b) a drawing showing the dimensions of the screen-printed cell; Figure S2: Picture of the experimental setup for potentiometric and electrochemical impedance spectroscopy (EIS) measurements; Figure S3: SEM images of the sensors:-bare (a–d), MIP modified electrode (e–h), and NIP modified electrode (i–l); Figure S4: Cyclic voltammograms for the (a) bare, (b) MIP, and (c) NIP modified electrodes; Figure S5: Potentiometric response of a MIP-based screen-printed cell at three different atrazine concentrations in HCl solution at pH = 1.5. Steady-state reached in 5 min.
Author Contributions
Conceptualization, G.A. and C.Z.; methodology, G.A. and C.Z; investigation, S.S., C.Z. and G.A.; data curation, S.S., C.Z. and G.A.; writing—original draft preparation, G.A. and C.Z.; writing—review and editing, S.S., R.B., L.R.M. All authors have read and agreed to the published version of the manuscript.
Funding
This research received no external funding.
Institutional Review Board Statement
Not applicable.
Informed Consent Statement
Not applicable.
Data Availability Statement
Not applicable.
Acknowledgments
We thank Topflight Italia (S.P.A.) for providing us with the screen-printed cells free of charge, Alessandro Girella and Chiara Milanese for SEM analyses, and MIUR for funding Camilla Zanoni’s PhD grants.
Conflicts of Interest
The authors declare no conflict of interest.
References
- Aktar, M.W.; Sengupta, D.; Chowdhury, A. Impact of pesticides use in agriculture: Their benefits and hazards. Interdiscip. Toxicol. 2009, 2, 1–12. [Google Scholar] [CrossRef]
- Gebel, T.; Kevekordes, S.; Pav, K.; Edenharder, R.; Dunkelberg, H. In vivo genotoxicity of selected herbicides in the mouse bone-marrow micronucleus test. Arch. Toxicol. 1997, 71, 193–197. [Google Scholar] [CrossRef]
- Kniewald, J.; Jakominić, M.; Tomljenović, A.; Simić, B.; Romać, P.; Vranesić, D.; Kniewald, Z. Disorders of male rat reproductive tract under the influence of atrazine. J. Appl. Toxicol. 2000, 20, 61–68. [Google Scholar] [CrossRef]
- Pichon, V.; Chapuis-Hugon, F. Role of molecularly imprinted polymers for selective determination of environmental pollutants—a review. Anal. Chim. Acta 2008, 622, 48–61. [Google Scholar] [CrossRef]
- Tan, F.; Zhao, C.; Li, L.; Liu, M.; He, X.; Gao, J. Graphene oxide based in-tube solid-phase microextraction combined with liquid chromatography tandem mass spectrometry for the determination of triazine herbicides in water. J. Sep. Sci. 2015, 38, 2312–2319. [Google Scholar] [CrossRef]
- Mei, M.; Huang, X.; Yang, X.; Luo, Q. Effective extraction of triazines from environmental water samples using magnetism-enhanced monolith-based in-tube solid phase microextraction. Anal. Chim. Acta 2016, 937, 69–79. [Google Scholar] [CrossRef]
- Chen, D.; Zhang, Y.; Miao, H.; Zhao, Y.; Wu, Y. Determination of triazine herbicides in drinking water by dispersive micro solid phase extraction with ultrahigh-performance liquid chromatography–high-resolution mass spectrometric detection. J. Agric. Food Chem. 2015, 63, 9855–9862. [Google Scholar] [CrossRef]
- Gonzáleza, N.R.; Gonzáleza, E.B.; González-Castroa, M.J.; Mlpendurada, M.F. On-line solid-phase extraction method for determination of triazine herbicides and degradation products in seawater by ultra-pressure liquid chromatography–tandem mass spectrometry. J. Chromatogr. A 2016, 1470, 33–41. [Google Scholar] [CrossRef]
- Hernandez, F.; Beltran, J.; Lopez, F.J.; Gaspar, J.V. Use of solid-phase microextraction for the quantitative determination of herbicides in soil and water samples. Anal. Chem. 2000, 72, 2313–2322. [Google Scholar] [CrossRef]
- Brzezicki, J.M.; Andersen, M.E.; Cranmer, B.K.; Tessari, J.D. Quantitative identification of atrazine and its chlorinated metabolites in plasma. J. Anal. Toxicol. 2003, 27, 569–573. [Google Scholar] [CrossRef]
- Yokley, R.A.; Mayer, L.C.; Rezaaiyan, R.; Manuli, M.E.; Cheung, M.W. Analytical method for the determination of cyromazine and melamine residues in soil using LC-UV and GC-MSD. J. Agric. Food Chem. 2000, 48, 3352–3358. [Google Scholar] [CrossRef]
- Singh, S.; Kumar, V.; Chauhan, A.; Datta, S.; Wani, A.B.; Singh, N.; Singh, J. Toxicity, degradation and analysis of the herbicide atrazine. Environ. Chem. Lett. 2018, 16, 211–237. [Google Scholar] [CrossRef]
- Zahran, M.; Khalifa, Z.; Zahran, M.A.H.; Abdel Azzem, M. Dissolved organic matter-capped silver nanoparticles for electrochemical aggregation sensing of atrazine in aqueous systems. ACS Appl. Nano Mater. 2020, 3, 3868–3875. [Google Scholar] [CrossRef]
- Pérez-Fernández, B.; Costa-García, A.; De La Escosura-Muñiz, A. Electrochemical (Bio)Sensors for Pesticides Detection Using Screen-Printed Electrodes. Biosensors 2020, 10, 32. [Google Scholar] [CrossRef]
- Suryanarayanan, V.; Wu, C.-T.; Ho, K.-C. Molecularly Imprinted Electrochemical Sensors. Electroanalysis 2020, 22, 1795–1811. [Google Scholar] [CrossRef]
- Merkoçi, A.; Alegret, S. New materials for electrochemical sensing IV. Molecular imprinted polymers. TrAC-Trends Anal. Chem. 2002, 21, 717–725. [Google Scholar] [CrossRef]
- Sajini, T.; Mathew, B. A brief overview of molecularly imprinted polymers: Highlighting computational design, nano and photo-responsive imprinting. Talanta Open 2021, 4, 100072. [Google Scholar] [CrossRef]
- Hayat, A.; Marty, J.L. Disposable Screen Printed Electrochemical Sensors: Tools for Environmental Monitoring. Sensors 2014, 14, 10432–10453. [Google Scholar] [CrossRef]
- Taleat, Z.; Khoshroo, A.; Mazloum-Ardakani, M. Screen-printed electrodes for biosensing: A review (2008–2013). Microchim. Acta 2014, 181, 865–891. [Google Scholar] [CrossRef]
- D’agostino, G.; Alberti, G.; Biesuz, R.; Pesavento, M. Potentiometric sensor for atrazine based on a molecular imprinted membrane. Biosens. Bioelectron. 2006, 22, 145–152. [Google Scholar] [CrossRef]
- Gao, B.; Liu, H.; Cui, K. Preparation and molecule-recognition characteristics of grafting type molecule-imprinted membrane and potentiometric sensor for atrazine. Sens. Actuators B Chem. 2018, 254, 1048–1056. [Google Scholar] [CrossRef]
- Royani, I.; Abdullah, M. The effect of atrazine concentration on galvanic cell potential based on molecularly imprinted polymers (MIPS) and aluminium as contact electrode. J. Phys. Conf. Ser. 2019, 1282, 012029. [Google Scholar] [CrossRef]
- Pogorelova, S.P.; Bourenko, T.; Kharitonov, A.B.; Willner, I. Selective sensing of triazine herbicides in imprinted membranes using ion-sensitive field-effect transistors and microgravimetric quartz crystal microbalance measurements. Analyst 2002, 127, 1484–1491. [Google Scholar] [CrossRef]
- Akhoundian, M.; Alizadeh, T.; Ganjali, M.R.; Rafiei, F. A new carbon paste electrode modified with MWCNTs and nano-structured molecularly imprinted polymer for ultratrace determination of trimipramine: The crucial effect of electrode components mixing on its performance. Biosens. Bioelectron. 2018, 111, 27–33. [Google Scholar] [CrossRef]
- Malitesta, C.; Mazzotta, E.; Picca, R.A.; Poma, A.; Chianella, I.; Piletsky, S.A. MIP sensors—The electrochemical approach. Anal. Bioanal. Chem. 2012, 402, 1827–1846. [Google Scholar] [CrossRef]
- Pesavento, M.; D’Agostino, G.; Alberti, G.; Biesuz, R.; Merli, D. Voltammetric platform for detection of 2,4,6-trinitrotoluene based on a molecularly imprinted polymer. Anal. Bioanal. Chem. 2013, 405, 3559–3570. [Google Scholar] [CrossRef] [PubMed]
- Pesavento, M.; Merli, D.; Biesuz, R.; Alberti, G.; Marchetti, S.; Milanese, C. A MIP-based low-cost electrochemical sensor for 2-furaldehyde detection in beverages. Anal. Chim. Acta 2021, 1142, 201–210. [Google Scholar] [CrossRef]
- Smolková, E.; Pacáková, V. Liquid chromatographic separation and behaviour of some substituted s-triazines on a CN-bonded stationary phase. Chromatographia 1978, 11, 698–702. [Google Scholar] [CrossRef]
- Skopalová, J.; Kotouček, M. Polarographic behaviour of some s-triazine herbicides and their determination by adsorptive stripping voltammetry at the hanging mercury drop electrode. Fresenius J. Anal. Chem. 1995, 351, 650–655. [Google Scholar] [CrossRef]
- Kamel, A.H.; Amr, A.E.-G.E.; Galal, H.R.; Al-Omar, M.A.; Almehizia, A.A. Screen-Printed Sensor Based on Potentiometric Transduction for Free Bilirubin Detection as a Biomarker for Hyperbilirubinemia Diagnosis. Chemosensors 2020, 8, 86. [Google Scholar] [CrossRef]
- Khaled, E.; Mohamed, G.G.; Awad, T. Disposal screen-printed carbon paste electrodes for the potentiometric titration of surfactants. Sens. Actuators B Chem. 2008, 135, 74–80. [Google Scholar] [CrossRef]
- Mohamed, G.G.; Ali, T.A.; El-Shahat, M.F.; Al-Sabagh, A.M.; Migahed, M.A.; Khaled, E. Potentiometric determination of cetylpyridinium chloride using a new type of screen-printed ion selective electrodes. Anal. Chim. Acta 2010, 673, 79–87. [Google Scholar] [CrossRef] [PubMed]
- Zhao, Y.; Xu, L.; Li, S.; Chen, Q.; Yang, D.; Chen, L.; Wang, H. “One-drop-of-blood” electroanalysis of lead levels in blood using a foam-like mesoporous polymer of melamine–formaldehyde and disposable screen-printed electrodes. Analyst 2015, 140, 1832–1836. [Google Scholar] [CrossRef] [PubMed]
- Mulyasuryani, A.; Mustaghfiroh, A.M. Development of potentiometric phenol sensors by nata de coco membrane on screen-printed carbon electrode. J. Anal. Methods Chem. 2019, 2019, 4608135. [Google Scholar] [CrossRef]
- Moschou, D.; Trantidou, T.; Regoutz, A.; Carta, D.; Morgan, H.; Prodromakis, T. Surface and Electrical Characterization of Ag/AgCl Pseudo-Reference Electrodes Manufactured with Commercially Available PCB Technologies. Sensors 2015, 15, 18102–18113. [Google Scholar] [CrossRef]
- da Silva, E.T.S.G.; Miserere, S.; Kubota, L.T.; Merkoçi, A. Simple on-plastic/paper inkjet-printed solid-state Ag/AgCl pseudoreference electrode. Anal. Chem. 2014, 86, 10531–10534. [Google Scholar] [CrossRef]
- Papamatthaiou, S.; Zupancic, U.; Kalha, C.; Regoutz, A.; Estrela, P.; Moschou, D. Ultra stable, inkjet-printed pseudo reference electrodes for lab-on-chip integrated electrochemical biosensors. Sci. Rep. 2020, 10, 17152. [Google Scholar] [CrossRef]
- Burak, D.; Emregul, E.; Emregul, K.C. Copper–Zinc Alloy Nanoparticle Based Enzyme-Free Superoxide Radical Sensing on a Screen-Printed Electrode. Talanta 2015, 134, 206–214. [Google Scholar]
- Hassan, S.S.; Kamel, A.H.; Fathy, M.A. A novel screen-printed potentiometric electrode with carbon nanotubes/polyaniline transducer and molecularly imprinted polymer for the determination of nalbuphine in pharmaceuticals and biological fluids. Anal. Chim. Acta 2022, 340239. [Google Scholar] [CrossRef]
- Tasić, N.; Cavalcante, L.; Deffune, E.; Góes, M.S.; Paixão, T.R.L.C.; Gonçalves, L.M. Probeless and label-free impedimetric biosensing of D-dimer using gold nanoparticles conjugated with dihexadecylphosphate on screen-printed carbon electrodes. Electrochim. Acta 2021, 397, 139244. [Google Scholar] [CrossRef]
- Escamilla-Gómez, V.; Campuzano, S.; Pedrero, M.; Pingarrón, J.M. Gold screen-printed-based impedimetric immunobiosensors for direct and sensitive Escherichia coli quantisation. Biosens. Bioelectron. 2009, 24, 3365–3371. [Google Scholar] [CrossRef] [PubMed]
- Rafiee, B.; Fakhari, A.R.; Ghaffarzadeh, M. Impedimetric and stripping voltammetric determination of methamphetamine at gold nanoparticles-multiwalled carbon nanotubes modified screen printed electrode. Sens. Actuators B Chem. 2015, 218, 271–279. [Google Scholar] [CrossRef]
- Lien, T.T.N.; Takamura, Y.; Tamiya, E.; Vestergaard, M.C. Modified screen printed electrode for development of a highly sensitive label-free impedimetric immunosensor to detect amyloid beta peptides. Anal. Chim. Acta 2015, 892, 69–76. [Google Scholar] [CrossRef] [PubMed]
- de Faria, R.A.D.; Iden, H.; Dias Heneine, L.G.; Matencio, T.; Messaddeq, Y. Non-enzymatic impedimetric sensor based on 3-aminophenylboronic acid functionalized screen-printed carbon electrode for highly sensitive glucose detection. Sensors 2019, 19, 1686. [Google Scholar] [CrossRef]
- Lucarelli, F.; Marrazza, G.; Mascini, M. Enzyme-based impedimetric detection of PCR products using oligonucleotide-modified screen-printed gold electrodes. Biosens. Bioelectron. 2005, 20, 2001–2009. [Google Scholar] [CrossRef]
- Rohrbach, F.; Karadeniz, H.; Erdem, A.; Famulok, M.; Mayer, G. Label-free impedimetric aptasensor for lysozyme detection based on carbon nanotube-modified screen-printed electrodes. Anal. Biochem. 2012, 421, 454–459. [Google Scholar] [CrossRef]
- Pesavento, M.; D’Agostino, G.; Biesuz, R.; Alberti, G. Molecularly Imprinted Polymer-Based Sensors for Amperometric Determination of Nonelectroactive Substances. Electroanalysis 2009, 21, 604–611. [Google Scholar] [CrossRef]
- Sergeyeva, T.A.; Piletsky, S.A.; Brovko, A.A.; Slinchenko, E.A.; Sergeeva, L.M.; El’Skaya, A.V. Selective recognition of atrazine by molecularly imprinted polymer membranes. Development of conductometric sensor for herbicides detection. Anal. Chim. Acta 1999, 392, 105–111. [Google Scholar] [CrossRef]
- Zhang, M.; Gu, L.; Kong, G.; Zheng, Y.; Han, Y.; Li, Z.; Shi, J.; Peng, J. Comparative analysis of atrazine molecularly imprinted polymers using acetonitrile and toluene as solvents. J. Appl. Polym. Sci. 2019, 136, 47190. [Google Scholar] [CrossRef]
- Cacho, C.; Turiel, E.; Martin-Esteban, A.; Pérez-Conde, C.; Camara, C. Clean-up of triazines in vegetable extracts by molecularly-imprinted solid-phase extraction using a propazine-imprinted polymer. Anal. Bioanal. Chem. 2003, 376, 491–496. [Google Scholar] [CrossRef]
- Carabias-Martínez, R.; Rodríguez-Gonzalo, E.; Herrero-Hernández, E. Behaviour of triazine herbicides and their hydroxylated and dealkylated metabolites on a propazine-imprinted polymer: Comparative study in organic and aqueous media. Anal. Chim. Acta 2006, 559, 186–194. [Google Scholar] [CrossRef]
- Proud, W.G.; Müller, C. The electrodeposition of nickel on vitreous carbon: Impedance studies. Electrochim. Acta 1993, 38, 405–413. [Google Scholar] [CrossRef]
- Janata, J. Electrochemical sensors and their impedances: A tutorial. Crit. Rev. Anal. Chem. 2002, 32, 109–120. [Google Scholar] [CrossRef]
- Kor, K.; Zarei, K. Development and characterization of an electrochemical sensor for furosemide detection based on electropolymerized molecularly imprinted polymer. Talanta 2016, 146, 181–187. [Google Scholar] [CrossRef]
- IUPAC. Recommendations for nomenclature of ion-selective electrodes. Pure Appl. Chem. 1976, 48, 127–132. [Google Scholar] [CrossRef]
- Midgley, D. Limits of detection of ion-selective electrodes: Theory and practice. Trans. Inst. Meas. Control 1987, 9, 25–36. [Google Scholar] [CrossRef]
- Miller, J.N.; Miller, J.C. Calibration methods in instrumental analysis: Regression and correlation. In Statistics and Chemometrics for Analytical Chemistry, 6th ed.; Pearson Education Limited: Harlow Essex, UK, 2010; pp. 124–126. [Google Scholar]
- Hassan, S.S.; Abbas, M.N.; Moustafa, G.A.E. Flow injection potentiometric determination of atrazine in herbicide formulations. Anal. Lett. 1998, 31, 777–791. [Google Scholar] [CrossRef]
- Prasad, K.; Prathish, K.P.; Gladis, J.M.; Naidu, G.R.K.; Rao, T.P. Molecularly imprinted polymer (biomimetic) based potentiometric sensor for atrazine. Sens. Actuators B Chem. 2007, 123, 65–70. [Google Scholar] [CrossRef]
- Amemiya, S.; Bühlmann, P.; Odashima, K. A Generalized Model for Apparently “Non-Nernstian” Equilibrium Responses of Ionophore-Based Ion-Selective Electrodes. 1. Independent Complexation of the Ionophore with Primary and Secondary Ions. Anal. Chem. 2003, 75, 3329–3339. [Google Scholar] [CrossRef]
- Shao, Y.; Ying, Y.; Ping, J. Recent advances in solid-contact ion-selective electrodes: Functional materials, transduction mechanisms, and development trends. Chem. Soc. Rev. 2020, 49, 4405–4465. [Google Scholar] [CrossRef]
- Dulay, S.; Rivas, L.; Miserere, S.; Pla, L.; Berdún, S.; Parra, J.; Eixarch, E.; Gratacós, E.; Illa, M.; Mir, M.; et al. In vivo monitoring with micro-implantable hypoxia sensor based on tissue acidosis. Talanta 2020, 226, 122045. [Google Scholar] [CrossRef] [PubMed]
- Maurya, D.K.; Sardarinejad, A.; Alameh, K. Ruthenium oxide ion selective thin-film electrodes for engine oil acidity monitoring. Meas. Sci. Technol. 2015, 26, 065102. [Google Scholar] [CrossRef]
- Rousseau, C.R.; Bühlmann, P. Calibration-free potentiometric sensing with solid-contact ion-selective electrodes. TrAC—Trends Anal. Chem. 2021, 140, 116277. [Google Scholar] [CrossRef]
- Fan, Y.; Xu, C.; Wang, R.; Hu, G.; Miao, J.; Hai, K.; Lin, C. Determination of copper (II) ion in food using an ionic liquids-carbon nanotubes-based ion-selective electrode. J. Food Compos. Anal. 2017, 62, 63–68. [Google Scholar] [CrossRef]
- Riad, S.; Rezk, M.; Khattab, F.I.; Abd El-Rahman, M.K.; Marzouk, H.M. Anions Selective Electrodes with Unusual Half Nernstian Response. Anal. Bioanal. Electrochem. 2014, 6, 392–402. [Google Scholar]
- Abdel-Haleem, F.M.; Mahmoud, S.; Abdel-Ghani, N.E.T.; El Nashar, R.M.; Bechelany, M.; Barhoum, A. Polyvinyl Chloride Modified Carbon Paste Electrodes for Sensitive Determination of Levofloxacin Drug in Serum, Urine, and Pharmaceutical Formulations. Sensors 2021, 21, 3150. [Google Scholar] [CrossRef]
- Frisch, M.J.; Trucks, G.W.; Schlegel, H.B.; Scuseria, G.E.; Robb, M.A.; Cheeseman, J.R.; Scalmani, G.; Barone, V.; Petersson, G.A.; Nakatsuji, H.; et al. Gaussian 16 Revision A 03 (software); Gaussian Inc.: Wallingford, CT, USA, 2016. [Google Scholar]
Publisher’s Note: MDPI stays neutral with regard to jurisdictional claims in published maps and institutional affiliations. |
© 2022 by the authors. Licensee MDPI, Basel, Switzerland. This article is an open access article distributed under the terms and conditions of the Creative Commons Attribution (CC BY) license (https://creativecommons.org/licenses/by/4.0/).

