Abstract
In the context of personalized medicine, the paraxanthine-to-caffeine ratio is an accepted standard for the optimization of the dose-response effect of many pharmaceuticals in individual patients. There is a strong drive towards the development of cheaper and portable devices for the detection of biomarkers, including paraxanthine and caffeine, which requires materials with high binding efficiency and specificity. We designed a recognition unit specific for paraxanthine which can discriminate molecules with small structural differences and can be used to increase the sensitivity of sensors. A number of functional units were screened by nuclear magnetic resonance for their ability to form specific binding interactions with paraxanthine in water and negligible interactions with its structural analogue caffeine. Imidazole was identified as the unit showing the most promising results and its two polymerizable derivatives were evaluated by isothermal titration calorimetry to identify the best monomer. The data suggested that 4-vinylimidazole was the most promising unit forming specific and strong binding interaction with paraxanthine. The calorimetry experiments allowed also the determination of the thermodynamic parameters of all interactions and the association constant values. Optimization of polymerization protocols in water, achieving high monomer conversions and chemical yields, demonstrate the suitability of the selected functional monomer for polymer preparations, targeting the detection of paraxanthine in aqueous environments.
1. Introduction
Paraxanthine (1,7-dimethylxanthine, PX) is the major primary metabolite of caffeine (CAF) in humans, and has recently attracted a lot of interest because of its biological activity [1,2,3], lower anxiogenic activity, and toxicity compared to CAF [4,5]. In the human body, CAF is metabolized to PX (81.5%), theobromine (TB), and theophylline (TP) present in 10.8% and 5.4%, respectively (Figure 1) [6]. All dimethylxanthines are purine derivatives and have in common the xanthine core with a different number of methyl groups attached to the nitrogens in different combinations. The human enzyme CYP1A2 is solely responsive for the formation of PX in the body, but it is also involved in the metabolism of more than 200 clinically important drugs [7,8,9].
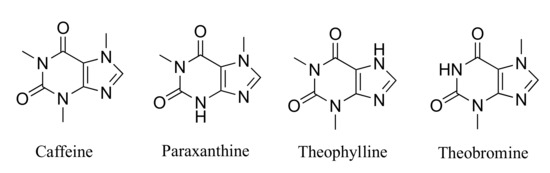
Figure 1.
Chemical structure of caffeine and its primary metabolites. Reproduced with permission from reference [10].
CYP1A2 activity shows significant inter-individual variability of up to 200-fold, which can seriously influence drugs’ metabolism and efficacy [11,12]. Hence, measuring the metabolic activity of CYP1A2 can be a useful tool for personalised medicine, in order to optimize the drug-response effect on individual patients and monitor drug therapy [13,14]. Substantial progress has been made in estimating drug pharmacokinetics in humans by CYP1A2 phenotyping, however, its regular application in clinical settings remains a challenge [15]. A widely accepted metric to achieve CYP1A2 phenotyping is to measure the PX-to-CAF (PX/CAF) concentration ratio, at a single time point, 4 to 8 h upon oral administration of a single CAF dose [12,13,15,16]. In terms of biological matrix, blood, plasma, urine, and saliva can be used, with saliva being a more viable approach, being non-invasive and also easier to acquire outside of clinical settings.
When developing protocols for the quantification of PX and CAF, it is important to evaluate the presence of any complexes derived from self-assembly. We investigated this recently and found that both PX and CAF are predominantly present as monomers with less than 0.05% dimers in solution at the concentrations found in biological samples (5–20 μM) [16]. To date, PX and CAF have been quantified using high-performance liquid chromatography (HPLC) coupled with ultraviolet (UV) detector [17,18], or mass spectrometer (MS) [19,20], and nuclear magnetic resonance [21] to a lesser extent. Although these techniques provide very good selectivity and sensitivity, their initial and running costs are significant, and the large volumes of solvents required do not make these techniques environmentally friendly. Nowadays, cheaper, portable, robust, and easy-to-use techniques that can allow point-of-care testing are attracting increasing interest for the detection of a wide range of biomarkers including methylxanthines. CAF is the most popular and extensively studied methylxanthine, and numerous chemical sensors and biosensors have been reported for its quantification including modifications with a number of entities such as polymers and peptides [22,23]. However, PX has been less studied, with limited data reported in literature, to the best of our knowledge. Our group recently reported on the potential use of electrochemical sensors for the detection of CAF and other dimethylxanthines (PX, TP and TB) in biofluids such as urine [24], blood [25], and saliva [10], although the limits of sensitivity are yet to be improved further. Together with sensitivity, specificity is a key parameter that needs to be optimized.
Among the most interesting approaches to further increase the specificity of a sensor involves the use of biomimetic receptors with molecular recognition properties which can be obtained through rational design and chemical synthesis. Synthetic receptors have been designed based on the concept of “antibody mimics” and have been synthesized in the laboratory [26]. These tailor-made materials specific towards target analytes offer multiple advantages, such as being less expensive than antibodies, easier to obtain, and physically and chemically more stable [27,28]. Materials specific for CAF [29,30], in particular, have been extensively reported and to a lesser extent for TP [31,32] and TB [33]. However, to the best of our knowledge, no example of a synthetic receptor with recognition properties specific towards PX has been reported. The careful choice of a binding unit is fundamental in order to rationally design materials with high affinity and specificity. The quality and quantity of the recognition sites is directly correlated to the mechanisms and extent of the analyte-functional monomer interactions in the pre-polymerization mixture [34]. Numerous works over the past 15–20 years have highlighted the increasingly higher importance of studying the analyte-functional monomer interaction prior to starting the polymerization, in order to identify the molecule that can selectively form strong interactions with the analyte [35,36]. The maximization of such interaction is a key factor to obtain successful recognition properties [35].
Here, we report, for the first time, the identification of a polymerizable unit with specific binding interactions towards PX that could be used to obtain a polymeric matrix for the development of sensors. 1H NMR was initially used to identify the functional unit showing the highest selectivity towards PX. Isothermal titration calorimetry (ITC) experiments were carried out to identify the structure of the most suitable polymerizable derivative and the thermodynamic profile of the interactions, including the association constant (Kass) values. Polymerization studies were carried out in water to demonstrate the suitability of the selected functional monomer to be used for sensing applications in aqueous environments. This study provides a new insight on designing recognition units which can discriminate molecules with small structural differences, such as a methyl group, relying on specific interactions of a different nature.
2. Materials and Methods
2.1. Materials
Paraxanthine (~98%), caffeine (≥99%), theophylline (≥99%), theobromine (≥98%), imidazole (IM), 1-vinylimidazole, 4-imidazolylacrylic acid (urocanic acid), acrylamide (AM), N,N′-methylenebis(acrylamide) (MBA), ammonium persulfate (APS, ≥98%), dimethylsulfone, palladium on activated charcoal 10 wt% dry basis (Pd/C), sulfuric acid, ethyl acetate, and methanol were purchased from Sigma-Aldrich (Gillingham, UK), and were used as received. Deuterium oxide (D2O) and deuterated chloroform (CDCl3) were purchased from Goss Scientific Ltd. (Crewe, UK). All chemicals and solvents were of analytical grade purity. Distilled water was obtained from a Milli-Q unit (Millipore) with resistivity not lower than 18 MΩ cm at 25 °C.
Polytetrafluoroethylene (PTFE)-faced rubber septa and WheatonTM transparent glass bottles (various volumes) were purchased from Sigma-Aldrich (Gillingham, UK). Regenerated cellulose dialysis membranes (molecular weight cut-off 3500 Da, width 34 mm, diameter 22 mm) were purchased from Medicell International Ltd. (London, UK).
2.2. Apparatus
1H NMR spectra were recorded at 298 K using a Bruker AVIII 400 MHz BBO Probe spectrometer. The spectra were analyzed using MestReNova 11 software from Mestrelab Research S.L. (UK). 1H NMR peak multiplicity was reported as observed on the NMR spectra and as follows: s (singlet), d (doublet), dd (doublet of doublet), t (triplet), q (quartet), quin (quintet), sex (sextet), m (multiplet), br (broad). Solvents’ proton resonance frequency was set on the values reported by Gottlieb et al. 1997 [37]. Chemical shifts (δ) for 1H are reported in parts per million (ppm) and the coupling constant (J) was reported in Hz; δH values were referenced to the residual solvent signal of D2O at 4.80 ppm. Isothermal titration calorimetry (ITC) measurements were carried out on a VP-ITC and a PEAQ-ITC Microcalorimeter (MicroCal) equipped with a ThermoVac vacuum pump, for degassing the samples, purchased from Malvern Panalytical Ltd. (Malvern, UK). Sample freeze drying was performed using a Labconco freeZone 6 freeze-dryer purchased from LTE Scientific Ltd. (Oldham, UK). Varian Cary 100 UV-Vis spectrophotometer equipped with an internal thermostat was purchased from Agilent Technologies Inc (Cheadle, UK). Background correction was possible by recording the spectrum of the solvent employed prior to sample analysis. Dynamic light scattering (DLS) measurements were performed using a Zetasizer Nano ZS290 equipped with a 4 mV He-Ne laser operating at λ = 633 nm and a detector placed at 173° angle purchased from Malvern Panalytical Ltd. (UK). The data were analyzed using the Zetasizer software 7.11 purchased from Malvern Panalytical Ltd. (UK). All data were analyzed and plotted using OriginPro 8.0 software purchased from OriginLab Corporation, (Northampton, MA, USA) at a confidence level of 95%.
2.3. 1H NMR Titrations
A known amount of functional monomer was dissolved in deuterated solvent and a 1H NMR spectrum was recorded. Then, 0.5 to 10 equivalents of the analyte (PX or CAF) solution, prepared in D2O, were added step-wise. 1H NMR spectra were recorded upon every addition and the chemical shifts (δ) of the protons of the functional monomer were monitored. The variations of the chemical shift (Δδ) of the proton with the largest chemical shift was monitored, using as a reference the proton chemical shifts containing only the functional unit. All experiments were carried out at 25 °C.
2.4. ITC Titrations
A solution of IM, 4-ethylimidazole (4EI), 1- or 4-vinylimidazole (1VI or 4VI) was loaded in the syringe and stepwise injected in the reference cell containing a solution of PX, CAF, TP or TB. The interaction between the functional monomer and the template was measured by the heat generated or absorbed upon each injection. All experiments were carried out in water at 25 °C. Heats of dilutions of all studied functional monomers were carried out and subtracted from the titration data prior to curve fitting. The reference power was set at 20 μcal s−1 with an initial delay of 60 s. The stirring speed was set at 400 rpm using fast equilibration and high feedback mode. For every experiment conducted, the first injection (5 μL) was discarded because it may have a systematic error due to diffusion effect and the rest had a volume of 15 μL with 300 s spacing between each injection to ensure that the signal returned to the baseline. The filter period was 2 s. The duration between the first and second injection was 10 s and 30 s between all the following ones. The total number of injections was 20 with the volume capacity of the syringe being 300 μL. The integrated heat changes (shown in the raw ITC graphs) were plotted against the molar ratio of the analytes and analyzed with Origin software 8.0 using one set of sites fitting model. The dissociation constant (Kdiss) and enthalpy change of association (ΔHass) were directly obtained after fitting with the non-linear, least-square, regression, one set of sites model that had the lowest x2 value. The rest of the thermodynamic parameters, namely the association constant (Kass), change in entropy (ΔSass), and in Gibbs free energy (ΔGass) of the binding were calculated using the following equations:
A control (heat dilution) experiment for IM, 1VI, 4VI, and 4EI was carried out first to study its self-association behavior in water, by injecting stepwise a solution of it in pure water. The results were subtracted when the interaction of these molecules with PX and CAF were investigated.
2.5. Synthesis of 4-Vinylimidazole
4VI was obtained via thermal decarboxylation of trans-urocanic acid according to C. G. Overberger and N. Vorchheimer [38]. Anhydrous urocanic acid (5 g, 36 mmol) was placed into a round-bottom flask attached to a short-necked distilling apparatus under pressure (1 mbar). The temperature was slowly increased to 220 °C and the material distilled as a pale yellow oil into the receiver flask which was placed in dry ice. The product was transferred into a separatory funnel using three times 10 mL of ethyl acetate and was washed with saturated aq. Na2CO3 (25 mL). The aqueous phase was extracted twice with 30 mL ethyl acetate each time and the organic layer was collected in a round-bottom flask. The solvent was evaporated and an off-white powder was obtained with a yield of 56%. The structure of 4-vinylimidazole was confirmed by 1H NMR spectroscopy (see 1H NMR spectrum in Figure S1, ESI).
1H NMR (400 MHz, CDCl3) δ 7.61 (s, 1H), 7.04 (s, 1H), 6.63 (dd, J = 17.6, 11.1 Hz, 1H), 5.67 (d, J = 17.6 Hz, 1H), 5.15 (dd, J = 11.1, 1.0 Hz, 1H).
2.6. Synthesis of 4-Ethylimidazole
The catalytic hydrogenation of 4VI (obtained as described in Section 2.4) to 4EI was carried out by placing 4VI (188 mg, 2 mmol) and Pd/C as the catalyst (21 mg, 10% wt, 0.2 mmol, 0.02 equivalents of Pd) into a round-bottom flask. The flask was closed with a stopper, was purged with N2 to remove the atmospheric oxygen and 21 mL of anhydrous ethanol were added. Subsequently, a hydrogen source was connected and the reaction was stirred for 20 h at room temperature. The progress of the reaction was monitored via thin layer chromatography (TLC). After 20 h, full conversion was achieved, the mixture was filtered through celite to remove the Pd, and the organic solvent was evaporated. 4EI yielded a transparent yellow oil and it was confirmed by 1H NMR spectroscopy (see 1H NMR spectrum in Figure S2, ESI).
1H NMR (400 MHz, CDCl3) δ 9.33 (s, NH), 7.55 (d, J = 1 Hz, 1H), 6.78 (d, J = 1 Hz, 1H), 2.65 (qd, J = 7.6, 0.8 Hz, 2H), 1.25 (t, J = 7.6 Hz, 3H).
2.7. Polymer Synthesis
Polymers were prepared by high dilution radical polymerization (HDRP) in either deuterated or de-ionized water. The pre-polymerization mixtures were prepared by dissolving the required amount of functional monomer (4VI) in H2O into a WheatonTM bottle, followed by the addition of MBA as the crosslinker, AM as the comonomer and APS as the initiator. All polymer formulations presented in the following sections are shown in Table 1.

Table 1.
Microgels (MGs) composition synthesized using 4-vinylimidazole (4VI), acrylamide (AM), and N,N′-methylenebisacrylamide (MBA), and 10% w/w ammonium persulfate (based on the total moles of double bonds) in deuterated water (D2O) or de-ionized water (H2O) at 70 °C or for 24 h.
The volume of H2O was adjusted to result in the appropriate total monomer concentration (CM = 0.25% or 0.5%). The mass of the comonomer and crosslinker (mmonomer) was calculated by the following equation:
The mass of APS (mAPS) was calculated according to the total moles of double bonds (10% and 25%) in the polymerization mixture, using the following equation:
where ncrosslinker = moles of crosslinker and Mr APS = molecular weight of APS.
At last, the volume of H2O (VH2O) required, given a certain total monomer concentration (CM), was calculated using the following equation:
where mTOTAL monomers = mfunctional monomer + mcomonomer + mcrosslinker and CM = total monomer concentration (% w/w).
After all monomers were fully dissolved, the bottles were sealed using PTFE-faced rubber septa. The solutions were degassed under vacuum and purged with N2 in order to remove the atmospheric oxygen. The bottles were heated at 70 °C to polymerize for 24 h. The nanogel solutions were then transferred into hydrated dialysis membranes and were dialyzed against water, and then transferred into Falcon tubes; these were frozen using liquid N2 and lyophilized to yield a white fluffy powder. The polymerization yields were calculated using the following equation:
All microgels were stored as dry powder at room temperature.
2.8. 1H NMR Conversion Studies
Polymerization solutions used for the quantification of the monomer conversions by 1H NMR were prepared in a smaller scale (VD2O = 4 mL) in WheatonTM bottles as described in Section 2.7. Dimethylsulfone was added as internal standard for quantitative 1H NMR measurements. Before sealing the WheatonTM bottle, a 500 μL aliquot of the pre-polymerization mixture was transferred into an NMR tube and the 1H NMR spectrum was recorded (t = 0 spectrum). The remaining polymerization solution was sealed, purged with N2, and heated at 70 °C for 24 h. After polymerization, another 500 μL aliquot of the mixture was transferred to a different NMR tube and the 1H NMR spectrum was recorded. The 1H NMR spectra acquired were phased and integrated identically using an automated procedure. The concentration of the monomers and crosslinker in the initial and final polymerization solutions were determined by comparing the intensities of the monomer peaks against the intensities of the internal standard peaks. The monomer peaks were recorded at 6.60 ppm (4VI), 5.76 ppm (AM), and 5.73 ppm (MBA), against the intensities of the dimethylsulfone peak at 3.08 ppm. The polymers were purified and freeze-dried, and the chemical yields and the percentages of the incorporated monomers were calculated.
2.9. Particle Size Characterization by Dynamic Light Scattering
Microgels’ hydrodynamic diameters (dh) were obtained by dynamic light scattering (DLS). Powder of freeze-dried microgels was reconstituted in de-ionized water at a concentration of 0.25 mg/mL. The solution was then filtered using 0.2 μm filters to ensure complete disaggregation of remaining aggregates; 1 mL of the solution was transferred into a DLS cuvette and was placed into the instrument, the material method was set to polymer latex and the temperature was set at 25 °C. The data were obtained by cumulated analyses of the correlation function using the Stokes–Einstein equation. Particle sizes given for the microgels represent estimates of the mean of hydrodynamic diameter by number. Size distribution is given by intensity and number for all measurements.
3. Results and Discussion
3.1. Selection of Binding Unit to Form Specific Interactions with Paraxanthine
The first step focused on the identification of a molecule able to form specific interactions with paraxanthine (PX), the main metabolite of caffeine (CAF) and the target of this work. As both molecules can be found simultaneously in varying concentrations, the interactions of any potential recognition unit needed to be evaluated with both molecules. In this context, π-π stacking and hydrophobic interactions were expected to be the main ones, occurring in aqueous environments, while hydrogen bonding would be less significant. Adenine, 5-caffeoylquinic acid (5-CQA), 8-hydroxypyrene-1,3,6-trisulfonic acid trisodium salt (HPTS), and imidazole (shown in Figure 2) were considered and their affinity for PX and CAF in water was evaluated by 1H NMR.
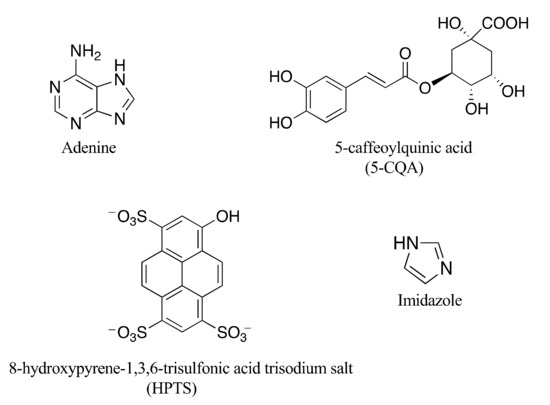
Figure 2.
Molecules evaluated as potential binding units specific for paraxanthine.
All these molecules contain at least one aromatic unit, contributing to strong π-π stacking interactions and, therefore, were considered good candidates. Moreover, they could contribute to the formation of hydrophobic interactions with PX in water due to their hydrophobic surface and planarity. Adenine was identified as a potential functional unit due to its well reported stacking interactions with other purines in DNA, which are responsible for a large part of the conformational stability of its structure [39,40]. PX and CAF molecules can be considered structural analogues of the purine bases and therefore a similar behavior was expected. Chlorogenic acid (5-CQA) was also selected, because of its known interaction with CAF, demonstrated by data from fluorescence quenching [41], FTIR [42], UV/Vis [43], and NMR spectroscopy [44,45]. D’Amelio et al. and Belay et al. have suggested that the stacking of CAF onto the aromatic plane of 5-CQA resulted in 1:1 complexes [43]. HPTS, a commercially available fluorescence dye, has been reported to form π-π stacking interactions with CAF in water forming 1:1 complexes (Kass = 245 M−1) while its interaction with two of its metabolites, theophylline (TP; Kass = 148 M−1) and theobromine (TB; Kass = 113 M−1) was considerably lower, showing a greater selectivity towards CAF [46,47]. However, its interaction with PX has not been reported, to the best of our knowledge. Finally, imidazole (IM) was selected because of its well-known role in substrate-enzyme interactions within proteolytic and esterolytic enzymes [38,48]. It has been reported that an histidine residue present in the active site of CYP1A2 enzyme, the main enzyme responsible for the metabolism of CAF, plays a key role in its catalytic activity [49]. IM is generally considered to act as a moderate σ-donor and a weak π-acceptor, with σ-donor and π-acceptor abilities in between saturated amines, such as ammonia, and unsaturated amines, such as pyridine [50]. In some rare cases also π-donor abilities have been reported [51,52].
1H NMR titrations were carried out by increasing the concentration of PX and CAF from 0 to 9 equivalents for each of the potential units. All 1H NMR stacked plots and titrations can be found in the ESI (Figures S3–S9). The results of the titrations are summarized in Table 1.
Adenine and 5-CQA showed a strong interaction with CAF but negligible interaction with PX, potentially due to stronger hydrophobic interactions formed with CAF compared to PX which contains one less methyl group, and were not considered further. HPTS showed a strong interaction with CAF, consistent with literature data [46,47], however, similar behavior was observed with PX, and so this molecule was also discarded. Binding interaction studies using 1H NMR titrations were carried out with PX and CAF using IM at different concentrations due to the lower solubility of PX (1 mg/mL) in water compared to CAF (16 mg/mL) [6,53]. Figure 3a shows the changes in chemical shift of one of the key protons as a function of analyte concentration, while the same data for PX are used to estimate the apparent association constant (app Kass) using the one-site binding model, as shown in Figure 3b.
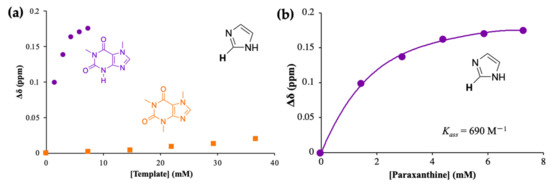
Figure 3.
(a) 1H NMR titrations of imidazole (IM) with paraxanthine (PX, purple) and caffeine (CAF, orange) in D2O, at 25 °C: variation of the chemical shift of the indicated proton of IM upon stepwise increase of either PX (0–5 equivalents) or CAF concentration (0–5 equivalents) and (b) Variation of the chemical shift of the indicated proton of IM upon subsequent addition of PX (0–5 equivalents) in D2O, at 25 °C. The one site-specific binding model was employed to fit the hyperbola and obtain the app Kass.
The data provide evidence of strong binding between IM and PX in water with an app Kass equal to 690 M−1, but a negligible interaction between IM and CAF. The interactions and thermodynamic profile of IM with PX and CAF were evaluated by ITC. Figure 4 presents the raw ITC data for the titration of PX (5.6 mM, Figure 4a) and CAF (5.6 mM, Figure 4b) with IM (20 mM). The heat dilution of the control experiments (see Figure S10; ESI) was subtracted from all titrations before calculating the kinetic and thermodynamic parameters of the binding events.
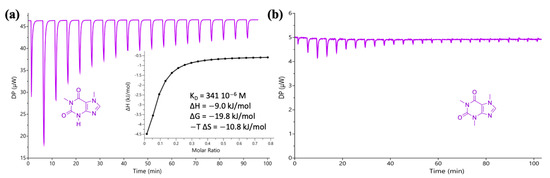
Figure 4.
(a) Raw ITC data for the stepwise injection of imidazole (IM; 20 mM) into a solution of paraxanthine (5.6 mM), at 25 °C. Inset: integrated heat plot (enthalpogram). One site-specific binding model was employed to fit the hyperbola and obtain the Kdiss (341 × 10−6 M). (b) Raw ITC data for the stepwise injection of IM (20 mM) into a solution of caffeine (5.6 mM), at 25 °C. All solutions were prepared in water.
PX forms a complex with IM via an exothermic reaction with an app Kass equal to 2933 M−1 while the interaction with CAF is negligible, consistent with the NMR data. The higher values of Kass obtained by ITC compared to NMR, up to 1000 times higher, have been already reported in literature [54,55,56]; these were justified by the different type of interactions being considered, with NMR focusing on specific protons involved in hydrogen bonding, while calorimetric measurements take into account other types of interactions as well [54]. Interestingly Hornung et al. reported lower association constants by NMR, justified in their view by the presence of impurities in deuterated solvents, that can compete for binding [55]. Having identified IM as a molecule capable of specific interactions with PX, the next step focused on the design and synthesis of a polymerizable IM-based unit.
3.2. Choice of Polymerizable Imidazole-Based Unit
In order to incorporate IM in polymeric matrices, two polymerizable derivatives were considered: 1-vinylimidazole (1VI) and 4-vinylimidazole (4VI), whose structures are shown in Figure 5.
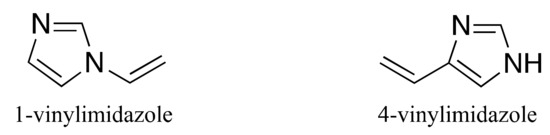
Figure 5.
Chemical structure of the polymerizable derivatives of imidazole as potential polymerizable monomers, 1- and 4-viynlimidazole.
1VI is commercially available while 4VI had to be synthesized via the thermal decarboxylation of urocanic acid, following a previously reported procedure by C. G. Overberger et al. Its chemical structure was confirmed by 1H NMR (see Figure S1, ESI). Although 4VI resembles much better than 1VI the functional groups of histidine, both molecules were investigated as potential polymerizable groups in order to evaluate their selectivity towards PX rather than CAF. Publications on polymers containing 4VI are rare in comparison to 1VI [57], yet interesting due to the unsubstituted pyrrole-like nitrogen as found in the histidine residues and therefore more relevant in attempting to mimic natural receptors [58].
3.3. Interaction Studies of the Polymerizable Units with PX and CAF by NMR and ITC
1H NMR titrations were carried out in D2O by keeping constant 4VI or 1VI and increasing the amounts of PX and CAF from 0 to 5 equivalents (Figure 6a,b), with the data used to estimate an app Kass of 660 M−1 determined using the one-site binding model (Figure 6c).
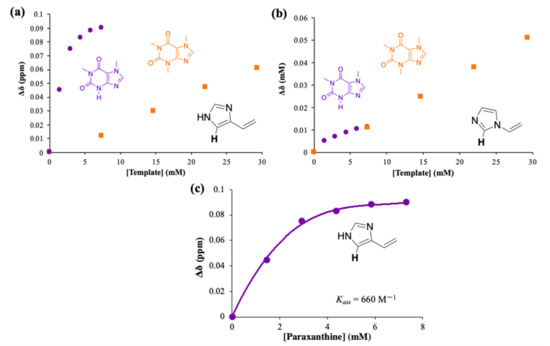
Figure 6.
1H NMR titration of: (a) 4-vinylimidazole with paraxanthine (PX, purple circles) and caffeine (CAF, orange squares) in D2O, at 25 °C; (b) 1-vinylimidazole with paraxanthine (PX, purple circles) and caffeine (CAF, orange squares) in D2O, at 25 °C. (c) Variation of the chemical shift of the indicated proton of 4-vinylimidazole upon subsequent addition of PX (0–5 equivalents) in D2O, at 25 °C. The one site-specific binding model was employed to fit the hyperbola and obtain the app Kass.
The introduction of the vinyl group in position C4 resulted in some loss of the specificity initially identified with IM (Figure 3a) but the app Kass between PX and 4VI was found to be 660 M−1, which is similar to the value determined for the interaction with IM (app Kass = 690 M−1). The unsubstituted nitrogens in both PX and the IM group clearly play a critical role in the interactions, possibly via a hydrogen bond interaction, which is not possible with CAF. It is interesting to observe the different impact that the vinyl group had, depending on its position on the IM ring. When introduced on N1, the strength of the interaction with PX was significantly lowered (see Figure 6b and Figure 3a), and there was loss of specificity. In the case of 4VI, instead, both the strength of the interaction and the specificity were retained.
ITC titrations in water were carried out to confirm the NMR findings, by the stepwise injection of 10 mM 4VI or 1VI into a 2 mM PX or CAF solution. The raw ITC data are shown in Figure 7.
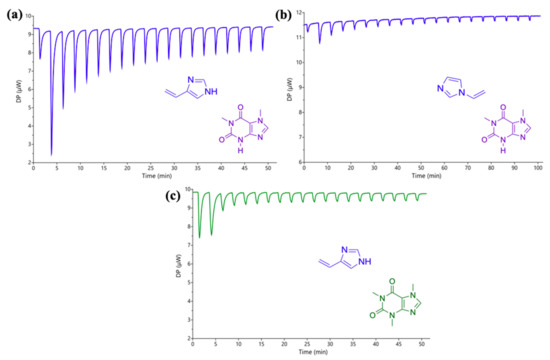
Figure 7.
Raw ITC data for the stepwise injection of (a) 4-vinylimidazole (4VI; 10 mM) into a solution of paraxanthine (PX; 2 mM); (b) 1-vinylimidazole (1VI; 10 mM) into a solution of PX (2 mM) and (c) 4VI (10 mM) into a solution of caffeine (2 mM). All solutions were prepared in water and the titrations were carried out at 25 °C.
The addition of 4VI into PX was shown to be an exothermic event, similarly to what was observed with IM (Figure 4a) suggesting complexation with an app Kass equal to 3135 M−1. Similarly to the NMR results, 4VI showed considerably stronger interaction with PX (see Figure 6a and Figure 7a) compared with 1VI, that showed very little heat release and therefore negligible interaction between the two (see Figure 6b and Figure 7b). Regarding the effect resulting from varying the position of the vinyl bond in the structure of the vinylimidazoles, both NMR and ITC provide very similar results, confirming that the free pyrrole-like nitrogen in the IM ring plays a critical role in the complexation. The difference in the strength of the interaction between the two vinylimidazoles could potentially be explained by the presence of cation-π interactions (NH··· π surface) which have been well documented in a number of studies, being less in the presence of water (approx. 5.5 kcal/mol) compared to most of the organic solvents [59,60,61]. ITC also confirms the considerably weaker interaction of 4VI with CAF (Figure 7c) compared with PX, suggesting that it is the most promising binding unit for the specific detection of PX.
In order to gain a better insight into the nature of the interactions occurring between IM and the vinylimidazoles with PX, the changes in Gibbs free energy (ΔG) and entropy (–TΔS) were calculated. The thermodynamic profiles of the interactions are summarized in Table 2. The thermodynamic signature plots of IM and 4VI with PX can be found in Figures S11 and S12 in the ESI.
Table 2.
Interactions of adenine, 5-caffeoylquinic acid (5-CQA), 8-hydroxypyrene-1,3,6-trisulfonic acid trisodium salt (HPTS), and imidazole (IM) with paraxanthine (PX) and caffeine (CAF). ‘Yes’ indicates evidence of strong interactions. ‘No’ suggests absence of any significant interactions.
The app Kass values of IM and 4VI with PX, shown in Table 3, when using either technique are very close, suggesting a similar strength of the interaction also in the presence of the vinyl group. The app Kass for the interaction of PX with IM and 4VI by ITC displayed a difference of a factor of four compared to the ones by 1H NMR. The Gibbs free energies suggested a spontaneous binding process between IM or 4VI and PX, with both the changes in entropy (hydrophobic interactions) and enthalpy (electrostatic interactions; mainly van der Waals interactions) contributing in this interaction. The interaction with 4VI resulted in a larger enthalpic contribution (−12 kJ/mol) compared with IM (−9 kJ/mol) suggesting the presence of a larger number of electrostatic interactions due to the vinyl bond.
Table 3.
Thermodynamic profiles: apparent association constants (app Kass) by ITC and NMR, changes in Gibbs free energy (ΔG), changes in enthalpy (ΔH), and changes in entropy (−TΔS) for the interaction of paraxanthine (PX) with imidazole (IM) and 4-vinylimidazole (4VI).
3.4. Additional Interaction Studies by ITC
Additional ITC studies were carried between PX and 4-ethylimidazole (4EI), to estimate the impact on the complexation that would be derived by the loss of the double bond as a result of the polymerization. 4EI was obtained via hydrogenation of 4VI (see Experimental) and its structure was confirmed by 1H NMR (see Figure S2; ESI). 4EI (20 mM) was stepwise injected into an aqueous solution of PX (1 mM) and the raw ITC data as well as the plotted data are shown in Figure 8.
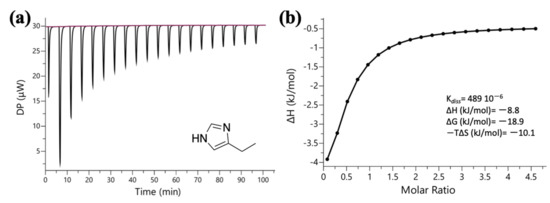
Figure 8.
(a) Raw ITC data for the titration of 4-ethylimidazole (20 mM) into paraxanthine (1 mM), at 25 °C. Both solutions were prepared in water; (b) Integrated heat plot (enthalpogram) of the interaction. The ITC data were plotted using the one-site binding model in order to calculate the app Kdiss (489 × 10−6 M).
The Kass (2045 M−1) was smaller compared with the values obtained for 4VI (3135 M−1) and IM (2933 M−1) suggesting that the functionality of the IM group is maintained but the presence of the ethyl group contributes less than the vinyl group in the complexation. Based on the thermodynamic signature plot of the interaction (see Figure S13; ESI), the Gibbs free energy (−18.9 kJ/mol) was very similar to the ones obtained for PX with IM (−19.8 kJ/mol) and 4VI (−20.0 kJ/mol). The interaction of 4EI with PX resulted in a smaller enthalpic contribution (−9 kJ/mol) compared with 4VI (−12 kJ/mol) but identical to the one of IM (−9 kJ/mol) confirming that the binding capability of the IM group is maintained. In the case of IM and 4EI, the change in entropy, −10.8 kJ/mol and −10.1 kJ/mol, respectively, was the main contributor due to the presence of more hydrophobic interactions.
Given the susceptibility of the interaction with the different imidazole derivatives, the complexation of 4EI was investigated also with all structural analogues of PX, namely, CAF, TP, and TB, to evaluate its specificity (Figure 9; see ITC raw data in Figure S14 in the ESI).
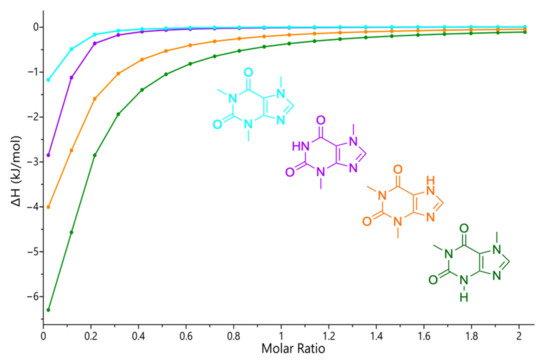
Figure 9.
Integrated heat plots (enthalpograms) for the ITC titrations of 4-ethylimidazole (2.8 mM) with caffeine (28 mM, light blue), theobromine (28 mM, purple), theophylline (28 mM, orange), and paraxanthine (28 mM, green), at 25 °C. All solutions were prepared in water.
PX showed the strongest complexation followed by the rest of the methylxanthines in the following order: PX > TP > TB > CAF. There is therefore evidence that upon incorporation of 4VI, the functional unit maintains a strong interaction and continues to be more selective towards PX.
3.5. Incorporation of the IM Group in a Polymer Matrix
Given the interesting data on binding interactions and specificity of the IM ring towards PX, we decided to carry out some experiments targeting the incorporation of 4VI in an acrylamide-based polymeric matrixref. As the detection of PX was aimed to take place in aqueous solutions and, therefore, the polymer synthesis was also performed in water, using high dilution radical polymerization. Over the past 15 years, we have used this methodology to obtain microgels and nanogels, polymeric particles that are covalently crosslinked and able to swell in aqueous systems, due to the hydrophilic nature of the monomers and crosslinkers, forming strong hydrogen bonds and resulting in a stable colloidal system. Formulations were optimized to ensure high monomer conversions, determined by 1H NMR, and chemical yields, both essential to ensure consistency between compositions and polymer chemical structures. Acrylamide (AM)-based polymers crosslinked with N,N′-methylenebisacrylamide (MBA) were synthesized (Figure 10) based on previous work carried out in our group [62]; our data demonstrated that concentrations of crosslinker ranging between 10 mol% and up to 80 mol% could be used to obtain polymeric particles with catalytic properties towards carbonate hydrolysis [63,64], cross-aldol reaction [65], antibody-mimics [66,67], and also as drug delivery systems [68,69].
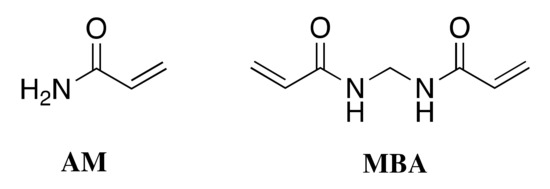
Figure 10.
Chemical structure of acrylamide (AM) and N,N′-methylenebisacrylamide (MBA). Reproduced with permission from reference [62].
In this work, the polymeric particles were prepared using 4VI (10 mol%) as functional monomer, AM (40 mol%) as the backbone monomer, MBA (50 mol%) as the crosslinker. The choice of using initially 50% crosslinker was driven by the objective of having a three-dimensional structure sufficiently rigid to allow specific binding while retaining the swelling properties of the matrix. A total monomer concentration (CM) of 0.25% and 0.5% was used and 10% or 25% of ammonium persulfate (APS) as the initiator. All polymerizations were performed at 70 °C for 24 h. The CM values, initiator quantities, total monomer conversions (TMC), and chemical yields for the initial polymer formulations are shown in Table 4.
Table 4.
Total monomer concentration (CM, % w/w) and ammonium persulfate (APS % w/w, based on the total moles of the double bonds) values investigated for microgels (MGs) prepared in D2O together with total monomer conversions (TMC) and chemical yields. Feed composition for all polymerizations: 4VI (10 mol%), AM (40 mol%), and MBA (50 mol%).
Changes in CM and APS concentration were evaluated resulting in high chemical yields and monomer conversions (>91%). The monomer conversions and final polymer compositions are shown in Figure S15a,b, respectively. Quantitative conversion of 4VI and MBA was observed for nearly all preparations, while AM showed initially a lower reactivity that was increased by raising the CM from 0.25 to 0.5% (Figure S15a). Based on these results, 4VI can be successfully used as a functional monomer in polymerization leading to very high chemical yields. This ensures an excellent match between feed and final polymer composition with 4VI being present at 10–11% in the final matrix (Figure S15b). On the basis of these results, polymers with a CM 0.5% were prepared in non-deuterated H2O at a larger scale to confirm the NMR results and produce the formulations that could be used for characterization (see Table 5). Similar formulations but with higher crosslinker content (70 mol%) were also investigated, to evaluate the effect of matrix rigidity on the binding properties.
Table 5.
Microgels (MGs) synthesized using 10 mol% 4-vinylimidazole (4VI), acrylamide (AM), and N,N′-methylenebisacrylamide (MBA), and 10% w/w ammonium persulfate (based on the total moles of double bonds) in de-ionized water at 70 °C or for 24 h together with their chemical yields.
In order to develop recognition units with chemical yields over 99%, the CM had to be increased from 0.25% to 0.5%. The high yield was maintained when the MBA content was increased to 70 mol%. The purpose of such increase was to evaluate how the yields and particle size would be affected by such a change, should higher crosslinker content be required by the applications. The chemical yields of the large-scale polymerizations were in complete agreement with the NMR conversion studies (Table 3) with quantitative yields obtained for the microgels MG-5 and MG-6. The particle size of the microgels MG-5 and MG-6 was ranged from 100 to 200 nm and polydispersity index from 0.30–0.45 (see Figures S16 and S17 in the ESI).
4. Conclusions
In this work, different functional units were screened by 1H NMR for their ability to form specific binding interactions with PX in water, and negligible interactions with its structural analogue CAF. Imidazole was identified as the unit showing the most promising results. Two polymerizable derivatives of IM, 1VI, and 4VI, were investigated by 1H NMR and ITC, and the data were in agreement in suggesting that 4VI was the promising unit for its ability to form specific and strong binding interaction with PX. Interestingly, it was observed that the additional methyl group on CAF appeared to interfere significantly, limiting the complex formation with the IM unit. The ITC experiments not only confirmed the NMR results but also allowed the evaluation of the thermodynamic parameters of all interactions, and allowed us to estimate the Kass values. In addition, the interaction of 4EI was investigated with PX in order to evaluate the impact on complexation as a result of the polymerization; the results suggested that the functional unit maintains strong interaction and specificity for PX compared to its analogues.
We then carried out some investigations to monitor the suitability of this functional monomer for polymer synthesis. Given the random nature of free radical polymerization, the effect of monomer reactivities and reaction conditions were investigated in order to maximize monomer conversions and chemical yields. The polymerizations in water with CM equal to 0.5% using 10% APS resulted in monomer conversions and yields higher than 97% showing an excellent agreement between feed and final composition. 4VI content was maintained constant at 10 mol% throughout all polymerizations proving its suitability as a functional monomer for developing materials specific for the detection of PX. This study provides a new insight on designing recognition units which can discriminate molecules with small structural differences, such as a methyl group, relying on specific interactions of a different nature. The proposed synthetic material could be used as a recognition element to increase the sensitivity of sensors and achieve specific detection of PX in aqueous environments in the presence of its structural analogues.
Supplementary Materials
The following supporting information can be downloaded at: https://www.mdpi.com/article/10.3390/chemosensors10080301/s1, Figure S1: 1H NMR spectrum of 4-vinylimidazole in CDCl3, at 25 °C, Figure S2: 1H NMR spectrum of 4-ethylimidazole in CDCl3, at 25 °C, Figure S3: Partial 1H NMR spectra for the titration of adenine (0.4 mM) with increasing amounts of paraxanthine (0–5 equivalents) in D2O, at 25 °C. The indicated proton of adenine with a star was the one to be monitored, Figure S4: Partial 1H NMR spectra for the titration of adenine (3.7 mM) with increasing amounts of caffeine (0–10 equivalents) in D2O, at 25 °C. The indicated proton of adenine with a star was the one to be monitored, Figure S5: 1H NMR titrations of adenine with paraxanthine (purple circles) and caffeine (orange squares) in D2O, at 25 °C: variation of the chemical shift of the indicated proton of adenine upon stepwise increase of either paraxanthine (0–5 equivalents) or caffeine concentration (0–9 equivalents). The chemical structures of paraxanthine and caffeine are indicated in purple and orange, respectively, Figure S6: 1H NMR titrations of 5-caffeoylquinic acid (5-CQA) with caffeine in D2O, at 25 °C: variation of the chemical shift of the indicated proton of 5-CQA acid upon stepwise increase of caffeine concentration (0–9 equivalents). The chemical structure of caffeine is indicated in orange, Figure S7: 1H NMR stacked plot (partial 1H NMR spectra) for the titration of HPTS (1.4 mM) with increasing amounts of paraxanthine from 0 to 5 equivalents, in D2O, at 25 °C. The indicated proton of 8-hydroxypyrene-1,3,6-trisulfonic acid trisodium salt (HPTS) with a star was the one to be monitored, Figure S8: 1H NMR titrations of 8-hydroxypyrene-1,3,6-trisulfonic acid trisodium salt (HPTS) with paraxanthine (purple circles) and caffeine (orange squares) in D2O, at 25 °C: variation of the chemical shift of the indicated proton of HPTS upon stepwise increase of either paraxanthine (0–5 equivalents) or caffeine concentration (0–9 equivalents). The chemical structures of paraxanthine and caffeine are indicated in purple and orange, respectively, Figure S9: 1H NMR stacked plot (partial 1H NMR spectra) of solutions containing imidazole (1.5 mM) upon stepwise addition of paraxanthine (0–5 equivalents) in D2O, at 25 °C. The indicated proton of imidazole with a star was the one to be monitored, Figure S10: Raw ITC data for the heat dilution (control) experiment of imidazole (20 mM) in water, at 25 °C, Figure S11: Thermodynamic signature plot (ΔG, ΔH and −TΔS values) for the ITC titration of paraxanthine (5.6 mM) upon stepwise injection of imidazole (20 mM) in water, at 25 °C, Figure S12: Thermodynamic signature plot (ΔG, ΔH and −TΔS values) for the ITC titration of paraxanthine (2 mM) upon stepwise injection of 4-vinylimidazole (10 mM) in water, at 25 °C, Figure S13: Thermodynamic signature plot (ΔG, ΔH and −TΔS values) for the ITC titration of paraxanthine (1 mM) upon stepwise injection of 4-ethylimidazole (20 mM) in water, at 25 °C, Figure S14: Raw ITC data for the stepwise injection of 4-ethylimidazole (27.8 mM) in: (a) paraxanthine (2.8 mM); (b) theophylline (2.8 mM); (c) theobromine (2.8 mM), and (d) caffeine (2.8 mM) in water, at 25 °C, Figure S15: Graphs showing the (a) conversions of 4-vinylimidazole (4VI), acrylamide (AM), and N,N′-methylenebisacrylamide (MBA) determined by 1H NMR, and (b) final polymer composition of the obtained microgels. All polymerizations were carried out in D2O (70 co., 24 h) at two different CM values and ammonium persulfate (APS) concentrations, Figure S16: Particle size distribution by intensity and number of MG-5 as measured by dynamic light scattering at a concentration of 0.5 mg/mL in D2O, Figure S17: Particle size distribution by intensity and number of MG-6 as measured by dynamic light scattering at a concentration of 0.5 mg/mL in D2O. Figure S18: 1H-NMR interaction study between PX (0.5 mg/mL, 2.78 mM) and AM (1-5 equivalents), Figure S19: 1H-NMR interaction study between PX (0.5 mg/mL, 2.78 mM) and MBA (1-5 equivalents).
Author Contributions
Conceptualization, R.-M.A. and M.R.; Funding acquisition, M.R.; Investigation, R.-M.A., F.T.; Supervision, M.R.; Writing—original draft, R.-M.A.; Writing—review and editing, R.-M.A. and M.R. All authors have read and agreed to the published version of the manuscript.
Funding
This research was funded by the European Commission via the ITN-EID IPCOS (Marie Skłodowska-Curie Actions GA, No. 642014).
Acknowledgments
Ben Stieglitz is gratefully acknowledged for helpful discussions on ITC data.
Conflicts of Interest
The authors declare no conflict of interest.
References
- Jäger, R.; Purpura, M.; Wells, S.D.; Liao, K.; Godavarthi, A. Paraxanthine Supplementation Increases Muscle Mass, Strength, and Endurance in Mice. Nutrients 2022, 14, 893. [Google Scholar] [CrossRef] [PubMed]
- Xing, D.; Yoo, C.; Gonzalez, D.; Jenkins, V.; Nottingham, K.; Dickerson, B.; Leonard, M.; Ko, J.; Faries, M.; Kephart, W.; et al. Dose-response of paraxanthine on cognitive function: A double blind, placebo controlled, crossover trial. Nutrients 2021, 13, 4478. [Google Scholar] [CrossRef] [PubMed]
- Orrú, M.; Guitart, X.; Karcz-Kubicha, M.; Solinas, M.; Justinova, Z.; Barodia, S.K.; Zanoveli, J.; Cortes, A.; Lluis, C.; Casado, V.; et al. Psychostimulant pharmacological profile of paraxanthine, the main metabolite of caffeine in humans. Neuropharmacology 2013, 67, 476–484. [Google Scholar] [CrossRef] [PubMed]
- Monteiro, J.P.; Alves, M.G.; Oliveira, P.F.; Silva, B.M. Structure-bioactivity relationships of methylxanthines: Trying to make sense of all the promises and the drawbacks. Molecules 2016, 21, 974. [Google Scholar] [CrossRef] [PubMed]
- Purpura, M.; Jäger, R.; Falk, M. An assessment of mutagenicity, genotoxicity, acute-, subacute and subchronic oral toxicity of paraxanthine (1,7-dimethylxanthine). Food Chem. Toxicol. 2021, 158, 112579. [Google Scholar] [CrossRef]
- Adén, U.; Arnaud, M.J.; Ashihara, H.; Beaudoin, M.-S.; Bellezza, I.; Chen, J.-F.; Chern, Y.; Corbin, J.D.; Cronstein, B.; Crozier, A.; et al. Methylxanthines; Fredholm, B.B., Ed.; Springer: Berlin/Heidelberg, Germany, 2011; Volume 258, Available online: https://link.springer.com/book/10.1007/978-3-642-13443-2 (accessed on 1 July 2022)ISBN 354022565X.
- Zhou, S.-F.; Wang, B.; Yang, L.-P.; Liu, J.-P. Structure, function, regulation and polymorphism and the clinical significance of human cytochrome P450 1A2. Drug Metab. Rev. 2010, 42, 268–354. [Google Scholar] [CrossRef] [PubMed]
- Brinholi, F.F.; de Farias, C.C.; Bonifácio, K.L.; Higachi, L.; Casagrande, R.; Moreira, E.G.; Barbosa, D.S. Clozapine and olanzapine are better antioxidants than haloperidol, Quetiapine, Risperidone and ziprasidone in in vitro models. Biomed. Pharmacother. 2016, 81, 411–415. [Google Scholar] [CrossRef] [PubMed]
- Sala, G.; Arosio, A.; Conti, E.; Beretta, S.; Lunetta, C.; Riva, N.; Ferrarese, C.; Tremolizzo, L. Riluzole selective antioxidant effects in cell models expressing amyotrophic lateral sclerosis endophenotypes. Clin. Psychopharmacol. Neurosci. 2019, 17, 438–442. [Google Scholar] [CrossRef]
- Anastasiadi, R.M.; Berti, F.; Colomban, S.; Tavagnacco, C.; Navarini, L.; Resmini, M. Simultaneous quantification of antioxidants paraxanthine and caffeine in human saliva by electrochemical sensing for CYP1A2 phenotyping. Antioxidants 2021, 10, 1–18. [Google Scholar] [CrossRef]
- Zanger, U.M.; Schwab, M. Cytochrome P450 enzymes in drug metabolism: Regulation of gene expression, enzyme activities, and impact of genetic variation. Pharmacol. Ther. 2013, 138, 103–141. [Google Scholar] [CrossRef]
- Dobrinas, M.; Cornuz, J.; Oneda, B.; Kohler Serra, M.; Puhl, M.; Eap, C.B. Impact of smoking, smoking cessation, and genetic polymorphisms on CYP1A2 activity and inducibility. Clin. Pharmacol. Ther. 2011, 90, 117–125. [Google Scholar] [CrossRef] [PubMed]
- De Kesel, P.M.M.; Lambert, W.E.; Stove, C.P. Alternative Sampling Strategies for Cytochrome P450 Phenotyping. Clin. Pharmacokinet. 2016, 55, 169–184. [Google Scholar] [CrossRef] [PubMed]
- Fuhr, U.; Jetter, A.; Kirchheiner, J. Appropriate phenotyping procedures for drug metabolizing enzymes and transporters in humans and their simultaneous use in the “cocktail” approach. Clin. Pharmacol. Ther. 2007, 81, 270–283. [Google Scholar] [CrossRef]
- Holmes, E.; Wilson, I.D.; Nicholson, J.K. Metabolic Phenotyping in Health and Disease. Cell 2008, 134, 714–717. [Google Scholar] [CrossRef]
- Redivo, L.; Anastasiadi, R.M.; Pividori, M.; Berti, F.; Peressi, M.; Di Tommaso, D.; Resmini, M. Prediction of self-assembly of adenosine analogues in solution: A computational approach validated by isothermal titration calorimetry. Phys. Chem. Chem. Phys. 2019, 21, 4258–4267. [Google Scholar] [CrossRef] [PubMed]
- Perera, V.; Gross, A.S.; McLachlan, A.J. Caffeine and paraxanthine HPLC assay for CYP1A2 phenotype assessment using saliva and plasma. Biomed. Chromatogr. 2010, 24, 1136–1144. [Google Scholar] [CrossRef] [PubMed]
- Jordan, N.Y.; Mimpen, J.Y.; van den Bogaard, W.J.M.; Flesch, F.M.; van de Meent, M.H.M.; Torano, J.S. Analysis of caffeine and paraxanthine in human saliva with ultra-high-performance liquid chromatography for CYP1A2 phenotyping. J. Chromatogr. B. Analyt. Technol. Biomed. Life Sci. 2015, 995–996, 70–73. [Google Scholar] [CrossRef] [PubMed]
- Lajin, B.; Schweighofer, N.; Goessler, W.; Obermayer-Pietsch, B. The determination of the Paraxanthine/Caffeine ratio as a metabolic biomarker for CYP1A2 activity in various human matrices by UHPLC-ESIMS/MS. Talanta 2021, 234, 122658. [Google Scholar] [CrossRef]
- Martínez-López, S.; Sarriá, B.; Baeza, G.; Mateos, R.; Bravo-Clemente, L. Pharmacokinetics of caffeine and its metabolites in plasma and urine after consuming a soluble green/roasted coffee blend by healthy subjects. Food Res. Int. 2014, 64, 125–133. [Google Scholar] [CrossRef]
- Schievano, E.; Finotello, C.; Navarini, L.; Mammi, S. Quantification of caffeine in human saliva by nuclear magnetic resonance as an alternative method for cytochrome CYP1A2 phenotyping. Talanta 2015, 140, 36–41. [Google Scholar] [CrossRef]
- Huang, P.J.J.; Liu, J. Selection of Aptamers for Sensing Caffeine and Discrimination of Its Three Single Demethylated Analogues. Anal. Chem. 2022, 94, 3142–3149. [Google Scholar] [CrossRef] [PubMed]
- Wang, Y.; Ding, Y.; Li, L.; Hu, P. Nitrogen-doped carbon nanotubes decorated poly (L-Cysteine) as a novel, ultrasensitive electrochemical sensor for simultaneous determination of theophylline and caffeine. Talanta 2018, 178, 449–457. [Google Scholar] [CrossRef]
- Kesavan, S.; Gowthaman, N.S.K.; Alwarappan, S.; John, S.A. Real time detection of adenosine and theophylline in urine and blood samples using graphene modified electrode. Sens. Actuators B Chem. 2019, 278, 46–54. [Google Scholar] [CrossRef]
- Gao, Y.; Wang, H.; Guo, L. Simultaneous determination of theophylline and caffeine by large mesoporous carbon/Nafion modified electrode. J. Electroanal. Chem. 2013, 706, 7–12. [Google Scholar] [CrossRef]
- Ye, L.; Mosbach, K. Molecularly imprinted microspheres as antibody binding mimics. React. Funct. Polym. 2001, 48, 149–157. [Google Scholar] [CrossRef]
- Haupt, K.; Mosbach, K. Molecularly imprinted polymers and their use in biomimetic sensors. Chem. Rev. 2000, 100, 2495–2504. [Google Scholar] [CrossRef] [PubMed]
- Wackerlig, J.; Lieberzeit, P.A. Molecularly imprinted polymer nanoparticles in chemical sensing—Synthesis, characterisation and application. Sens. Actuators B Chem. 2015, 207, 144–157. [Google Scholar] [CrossRef]
- Hu, R.; Tang, R.; Xu, J.; Lu, F. Chemical nanosensors based on molecularly-imprinted polymers doped with silver nanoparticles for the rapid detection of caffeine in wastewater. Anal. Chim. Acta 2018, 1034, 176–183. [Google Scholar] [CrossRef]
- Tian, D.-T.; Zhou, Y.-C.; Xiong, L.; Lu, F.-T. Synthesis and Properties of Caffeine Molecularly Imprinted Polymers Based on Konjac Glucomannan. Adv. Polym. Technol. 2015, 36, 68–76. [Google Scholar] [CrossRef]
- Ratautaite, V.; Janssens, S.D.; Haenen, K.; Nesládek, M.; Ramanaviciene, A.; Baleviciute, I.; Ramanavicius, A. Molecularly imprinted polypyrrole based impedimentric sensor for theophylline determination. Electrochim. Acta 2014, 130, 361–367. [Google Scholar] [CrossRef]
- Algieri, C.; Parisi, O.I.; Gullo, M.R.; Puoci, F.; Drioli, E.; Donato, L. Development of novel hybrid imprinted membranes for selective recovery of theophylline. Sep. Purif. Technol. 2018, 192, 513–519. [Google Scholar] [CrossRef]
- Zhu, Q.; Ma, C.; Chen, H.; Wu, Y.; Huang, J. A molecular imprint-coated stirrer bar for selective extraction of caffeine, theobromine and theophylline. Microchim. Acta 2014, 181, 303–311. [Google Scholar] [CrossRef]
- Chen, L.; Wang, X.; Lu, W.; Wu, X.; Li, J. Molecular imprinting: Perspectives and applications. Chem. Soc. Rev. 2016, 45, 2137–2211. [Google Scholar] [CrossRef] [PubMed]
- Karim, K.; Breton, F.; Rouillon, R.; Piletska, E.V.; Guerreiro, A.; Chianella, I.; Piletsky, S.A. How to find effective functional monomers for effective molecularly imprinted polymers? Adv. Drug Deliv. Rev. 2005, 57, 1795–1808. [Google Scholar] [CrossRef]
- Shahar, T.; Tal, N.; Mandler, D. Molecularly imprinted polymer particles: Formation, characterization and application. Aspects 2016, 495, 11–19. [Google Scholar] [CrossRef]
- Gottlieb, H.E.; Kotlyar, V.; Nudelman, A. NMR chemical shifts of common laboratory solvents as trace impurities. J. Org. Chem. 1997, 62, 7512–7515. [Google Scholar] [CrossRef] [PubMed]
- Overberger, C.G.; Vorchheimer, N. Imidazole-containing Polymers. Synthesis and Polymerization of the Monomer 4(5)-Vinylimidazole. J. Am. Chem. Soc. 1963, 85, 951–955. [Google Scholar] [CrossRef]
- Tavagnacco, L.; Di Fonzo, S.; D’Amico, F.; Masciovecchio, C.; Brady, J.W.; Cesàro, A. Stacking of purines in water: The role of dipolar interactions in caffeine. Phys. Chem. Chem. Phys. 2016, 18, 13478–13486. [Google Scholar] [CrossRef]
- Tavagnacco, L.; Gerelli, Y.; Cesàro, A.; Brady, J.W. Stacking and Branching in Self-Aggregation of Caffeine in Aqueous Solution: From the Supramolecular to Atomic Scale Clustering. J. Phys. Chem. B 2016, 120, 9987–9996. [Google Scholar] [CrossRef]
- Belay, A.; Kim, H.K.; Hwang, Y.-H. Binding of caffeine with caffeic acid and chlorogenic acid using fluorescence quenching, UV/vis and FTIR spectroscopic techniques. Luminescence 2016, 31, 565–572. [Google Scholar] [CrossRef] [PubMed]
- Li, Y.-L.; Huang, Y.-W.; Wu, M.-Z.; Wu, T.-Y.; Lai, P.-S.; Sun, N.-N.; Saw, C.-Y.; Li, C.-W.; Chau, C.-F. Enhanced Resistance to Amylolysis in Rice Kernels through Interaction with Chlorogenic Acid. Processes 2021, 9, 788. [Google Scholar] [CrossRef]
- Belay, A.; Ture, K.; Redi, M.; Asfaw, A. Measurement of caffeine in coffee beans with UV/vis spectrometer. Food Chem. 2008, 108, 310–315. [Google Scholar] [CrossRef]
- D’Amelio, N.; Fontanive, L.; Uggeri, F.; Suggi-Liverani, F.; Navarini, L. NMR reinvestigation of the caffeine-chlorogenate complex in aqueous solution and in coffee brews. Food Biophys. 2009, 4, 321–330. [Google Scholar] [CrossRef]
- D’Amelio, N.; Papamokos, G.; Dreyer, J.; Carloni, P.; Navarini, L. NMR Studies of Hetero-Association of Caffeine with di-O-Caffeoylquinic Acid Isomers in Aqueous Solution. Food Biophys. 2015, 10, 235–243. [Google Scholar] [CrossRef] [PubMed][Green Version]
- Luisier, N.; Ruggi, A.; Steinmann, S.N.; Favre, L.; Gaeng, N.; Corminboeuf, C.; Severin, K. A ratiometric fluorescence sensor for caffeine. Org. Biomol. Chem. 2012, 10, 7487. [Google Scholar] [CrossRef] [PubMed]
- Rochat, S.; Steinmann, S.N.; Corminboeuf, C.; Severin, K. Fluorescence sensing of caffeine in water with polysulfonated pyrenes. Chem. Commun. 2011, 47, 10584. [Google Scholar] [CrossRef]
- Zhou, S.-F.; Yang, L.-P.; Zhou, Z.-W.; Liu, Y.-H.; Chan, E. Insights into the substrate specificity, inhibitors, regulation, and polymorphisms and the clinical impact of human cytochrome P450 1A2. AAPS J. 2009, 11, 481–494. [Google Scholar] [CrossRef]
- Mayuzumi, H.; Shimizu, T.; Sambongi, C.; Hioya, K.; Hatano, M. Essential role of His163 in Cytochrome P450 1A2 in catalytic functions associated with Cytochrome b5. Arch. Biochem. Biophys. 1994, 310, 367–372. [Google Scholar] [CrossRef]
- Sundberg, R.J.; Martin, R.B. Interactions of histidine and other imidazole derivatives with transition metal ions in chemical and biological systems. Chem. Rev. 1974, 74, 471–517. [Google Scholar] [CrossRef]
- Rannulu, N.S.; Amunugama, R.; Yang, Z.; Rodgers, M.T. Influence of s and d orbital occupation on the binding of metal ions to imidazole. J. Phys. Chem. A 2004, 108, 6385–6396. [Google Scholar] [CrossRef]
- Epstein, L.M.; Straub, D.K.; Maricondi, C. Moessbauer Spectra of Some Porphyrin Complexes with Pyridine, Piperidine, and Imidazole. Inorg. Chem. 1967, 6, 1720–1724. [Google Scholar] [CrossRef]
- Carlucci, L.; Gavezzotti, A. Molecular recognition and crystal energy landscapes: An X-ray and computational study of caffeine and other methylxanthines. Chem. A Eur. J. 2005, 11, 271–279. [Google Scholar] [CrossRef] [PubMed]
- Dethlefs, C.; Eckelmann, J.; Kobarg, H.; Weyrich, T.; Brammer, S.; Näther, C.; Lüning, U. Determination of binding constants of hydrogen-bonded complexes by ITC, NMR CIS, and NMR diffusion experiments. European J. Org. Chem. 2011, 2066–2074. [Google Scholar] [CrossRef]
- Hornung, J.; Fankhauser, D.; Shirtcliff, L.D.; Praetorius, A.; Schweizer, W.B.; Diederich, F. Cycloalkane and alicyclic heterocycle complexation by new switchable resorcin[4]arene-based container molecules: NMR and ITC binding studies. Chem. A Eur. J. 2011, 17, 12362–12371. [Google Scholar] [CrossRef]
- Krstulja, A.; Lettieri, S.; Hall, A.J.; Roy, V.; Favetta, P.; Agrofoglio, L.A. Tailor-Made Molecularly Imprinted Polymer for Selective Recognition of the Urinary Tumor Marker Pseudouridine. Macromol. Biosci. 2017, 17, 1–9. [Google Scholar] [CrossRef]
- Andersson Trojer, M.; Movahedi, A.; Blanck, H.; Nydén, M. Imidazole and Triazole coordination chemistry for antifouling coatings. J. Chem. 2013, 2013, 946739. [Google Scholar] [CrossRef]
- Ribeiro, A.; Veiga, F.; Santos, D.; Torres-Labandeira, J.J.; Concheiro, A.; Alvarez-Lorenzo, C. Bioinspired Imprinted PHEMA-Hydrogels for ocular delivery of carbonic anhydrase inhibitor drugs. Biomacromolecules 2011, 12, 701–709. [Google Scholar] [CrossRef]
- Crowley, P.B.; Golovin, A. Cation-π interactions in protein-protein interfaces. Proteins Struct. Funct. Genet. 2005, 59, 231–239. [Google Scholar] [CrossRef]
- Gallivan, J.P.; Dougherty, D.A. A computational study of cation-π interactions vs salt bridges in aqueous media: Implications for protein engineering. J. Am. Chem. Soc. 2000, 122, 870–874. [Google Scholar] [CrossRef]
- Zacharias, N.; Dougherty, D.A. Cation-π interactions in ligand recognition and catalysis. Trends Pharmacol. Sci. 2002, 23, 281–287. [Google Scholar] [CrossRef]
- Liu, P.; Pearce, C.M.; Anastasiadi, R.M.; Resmini, M.; Castilla, A.M. Covalently crosslinked nanogels: An NMR study of the effect of monomer reactivity on composition and structure. Polymers 2019, 11, 1–10. [Google Scholar] [CrossRef] [PubMed]
- Pasetto, P.; Maddock, S.C.; Resmini, M. Synthesis and characterisation of molecularly imprinted catalytic microgels for carbonate hydrolysis. Anal. Chim. Acta 2005, 542, 66–75. [Google Scholar] [CrossRef]
- Maddock, S.C.; Pasetto, P.; Resmini, M. Novel imprinted soluble microgels with hydrolytic catalytic activity. Chem. Commun. 2004, 10, 536–537. [Google Scholar] [CrossRef] [PubMed]
- Carboni, D.; Flavin, K.; Servant, A.; Gouverneur, V.; Resmini, M. The first example of molecularly imprinted nanogels with aldolase type I activity. Chem. A Eur. J. 2008, 14, 7059–7065. [Google Scholar] [CrossRef] [PubMed]
- Çakir, P.; Cutivet, A.; Resmini, M.; Bui, B.T.S.; Haupt, K. Protein-size molecularly imprinted polymer nanogels as synthetic antibodies, by localized polymerization with multi-initiators. Adv. Mater. 2013, 25, 1048–1051. [Google Scholar] [CrossRef] [PubMed]
- Servant, A.; Haupt, K.; Resmini, M. Tuning molecular recognition in water-soluble nanogels with enzyme-like activity for the Kemp elimination. Chem. A Eur. J. 2011, 17, 11052–11059. [Google Scholar] [CrossRef]
- Salinas, Y.; Castilla, A.M.; Resmini, M. An l-proline based thermoresponsive and pH-switchable nanogel as a drug delivery vehicle. Polym. Chem. 2018, 9, 2271–2280. [Google Scholar] [CrossRef]
- Papadimitriou, S.A.; Robin, M.P.; Ceric, D.; O’Reilly, R.K.; Marino, S.; Resmini, M. Fluorescent polymeric nanovehicles for neural stem cell modulation. Nanoscale 2016, 8, 17340–17349. [Google Scholar] [CrossRef]
Publisher’s Note: MDPI stays neutral with regard to jurisdictional claims in published maps and institutional affiliations. |
© 2022 by the authors. Licensee MDPI, Basel, Switzerland. This article is an open access article distributed under the terms and conditions of the Creative Commons Attribution (CC BY) license (https://creativecommons.org/licenses/by/4.0/).