Article

An Enzyme-Based Interdigitated Electrode-Type Biosensor for Detecting Low Concentrations of H2O2 Vapor/Aerosol

1
Institute of Nano- und Biotechnologies (INB), FH Aachen, 52428 Jülich, Germany
2
Research & Development Department, SKAN Deutschland GmbH, 02827 Görlitz, Germany
3
Research Department, SKAN AG, 4123 Allschwil, Switzerland
*
Author to whom correspondence should be addressed.
Chemosensors 2022, 10(6), 202; https://doi.org/10.3390/chemosensors10060202
Submission received: 29 March 2022 / Revised: 6 May 2022 / Accepted: 23 May 2022 / Published: 26 May 2022
(This article belongs to the Special Issue Bioinspired Chemical Sensors and Micro-Nano Devices)

Abstract

:
This work introduces a novel method for the detection of H2O2 vapor/aerosol of low concentrations, which is mainly applied in the sterilization of equipment in medical industry. Interdigitated electrode (IDE) structures have been fabricated by means of microfabrication techniques. A differential setup of IDEs was prepared, containing an active sensor element (active IDE) and a passive sensor element (passive IDE), where the former was immobilized with an enzymatic membrane of horseradish peroxidase that is selective towards H2O2. Changes in the IDEs’ capacitance values (active sensor element versus passive sensor element) under H2O2 vapor/aerosol atmosphere proved the detection in the concentration range up to 630 ppm with a fast response time (<60 s). The influence of relative humidity was also tested with regard to the sensor signal, showing no cross-sensitivity. The repeatability assessment of the IDE biosensors confirmed their stable capacitive signal in eight subsequent cycles of exposure to H2O2 vapor/aerosol. Room-temperature detection of H2O2 vapor/aerosol with such miniaturized biosensors will allow a future three-dimensional, flexible mapping of aseptic chambers and help to evaluate sterilization assurance in medical industry.

1. Introduction

Hydrogen peroxide (H2O2) is applied widely as a sterilant in aseptic processes for sterilization of materials, objects or food, in liquid or gas phase, with or without combination with other methods [1,2,3,4]. In that regime, monitoring and controlling its physical and chemical properties during the aseptic process is of great importance. Previous studies present investigations regarding the detection of gaseous H2O2 and controlling its conditions (concentration range up to 8% v/v) at high temperatures (up to 240 °C), as it is applied for aseptic food packaging [5,6,7,8,9,10,11]. Therefore, calorimetric gas sensors have been micro-fabricated for the detection of gaseous H2O2 by means of a differential setup, utilizing a catalyst (e.g., MnO2). In addition, interdigitated electrode structures (IDEs) have been suggested for evaluating sterilization efficacy using a chip-based biosensing approach with the help of resistant spores of Bacillus atrophaeus DSM 675 [12,13,14]. These studies benefit from the miniaturized structures and the combination of different electrode setups, which also, in their most sophisticated stage of expansion, can simultaneously determine the H2O2 concentration and the microbiological activity of the spores after sterilization treatment.
On the other hand, when it comes to the detection of low concentrations of H2O2 in ambient conditions (<1000 ppm), not much research has been conducted lately (e.g., a detection range of <1 ppm is discussed in [15,16,17,18]). In one study, colorimetric/fluorescence detection methods were used [15]. However, the detection was not online and did not quantitatively evaluate the signals toward various concentrations. In addition, the reaction of the setup to the humidity, as an important factor, was not discussed.
Another study reported the vapor detection of H2O2 by means of nanocomposites and single-walled carbon nanotube sensors [18]. In this study, a vapor concentration detection range from 0.1 to 10 ppm was reported. The changes of resistance by applying the H2O2 vapor are measured. However, no differential setup was used to allow elimination of disturbing external factors. Other strategies described the use of carbon nanotubes for the detection of H2O2 vapor [19]. Typically, the initial liquid concentration, e.g., 50 ppm, was given as information. However, the gas concentrations of H2O2 were often not discussed in detail.
A recent review article overviews the different types of sensors for detection of H2O2 [20]. Here, no enzyme-based-H2O2 vapor detection was reported, which functioned similarly to the present biosensor. There are several recent studies where H2O2 was detected in solution (not in the vapor/aerosol phase), in a concentration range similar or close to the range discussed in this manuscript (<1000 ppm) [21,22,23,24]. To the best of the author’s knowledge, there are currently no reports which indicate the vapor/aerosol detection of H2O2 by HRP in the discussed concentration range. Literature data have mainly focused on the detection of low concentrations of H2O2 in solutions (concentration range of <10 ppm), and there is only little information on H2O2 detection in the vapor/aerosol phase [17,18,25,26,27,28,29,30,31]. These physical/chemical conditions are, however, typically applied in the sterilization of medical tools and materials (e.g., in medical or pharmaceutical isolators), where the monitoring of low concentrations of H2O2 in the vapor or aerosol phase at room temperature is critical [1,32,33,34,35,36]. In such an isolator, a sterile atmosphere is accomplished by a proper circulation of the vapor/aerosol phase H2O2, which facilities the surface sanitization through contact interaction over a predetermined exposure time with all internal surfaces of the isolator chamber and filling machine parts during the decontamination phase. Following the H2O2 decontamination phase, the chamber will undergo an aeration phase which decreases the concentration of residual H2O2 below 1 ppm. During the aeration phase, gaseous H2O2 is removed from the chamber. Currently, commercial gas detectors are applied to monitor and control the conditions inside medical isolators at “one spot”. Their properties are not satisfying for a multi-dimensional mapping in medical isolators. These specific gas detectors are expensive (costing about EUR 2000–3000). Most of these detectors also have bulky sizes, which excludes the possibility of multi-dimensional mapping of the isolators without influencing the gas streaming conditions inside the sterilization chamber. Therefore, there is still an ongoing demand in developing miniaturized H2O2 sensors for the vapor/aerosol phase, which can (i) cover the required concentration range of interest (100 to 1000 ppm) and (ii) be fabricated by means of cost-effective chip technologies to allow three-dimensional H2O2 mapping inside the pharmaceutical isolator.
To address these challenges, the present work deals with a cost-efficient, miniaturized and flat novel IDE-based capacitive enzyme-type biosensor for the detection of low concentrations of H2O2 vapor/aerosol (<630 ppm) at room temperature. Taking advantage of previous research papers on the detection of H2O2 in aqueous solutions, we employ the enzyme horseradish peroxidase (HRP), which is selective against H2O2 [37,38,39,40]. HRP remains stable over a long time-span when stored at 2–8 °C [41]. The utilization of this enzyme in a differential setup of IDE structures enables direct and fast detection of H2O2 in the vapor/aerosol phase with a response time of less than 1 min. The sensor setup has been physically characterized by microscopic studies. Electrochemical sensor characterization by means of impedance spectroscopy (capacitive monitoring/read-out) was performed with regard to the sensitivity behavior (linear concentration range, response time, repeatability). In addition, the influence of relative humidity was studied. This achievement, for the first time, leads to the application of a miniaturized biosensor setup in sterilization chambers such as medical or pharmaceutical isolators in order to monitor and record low H2O2 concentrations during the sterilization process.

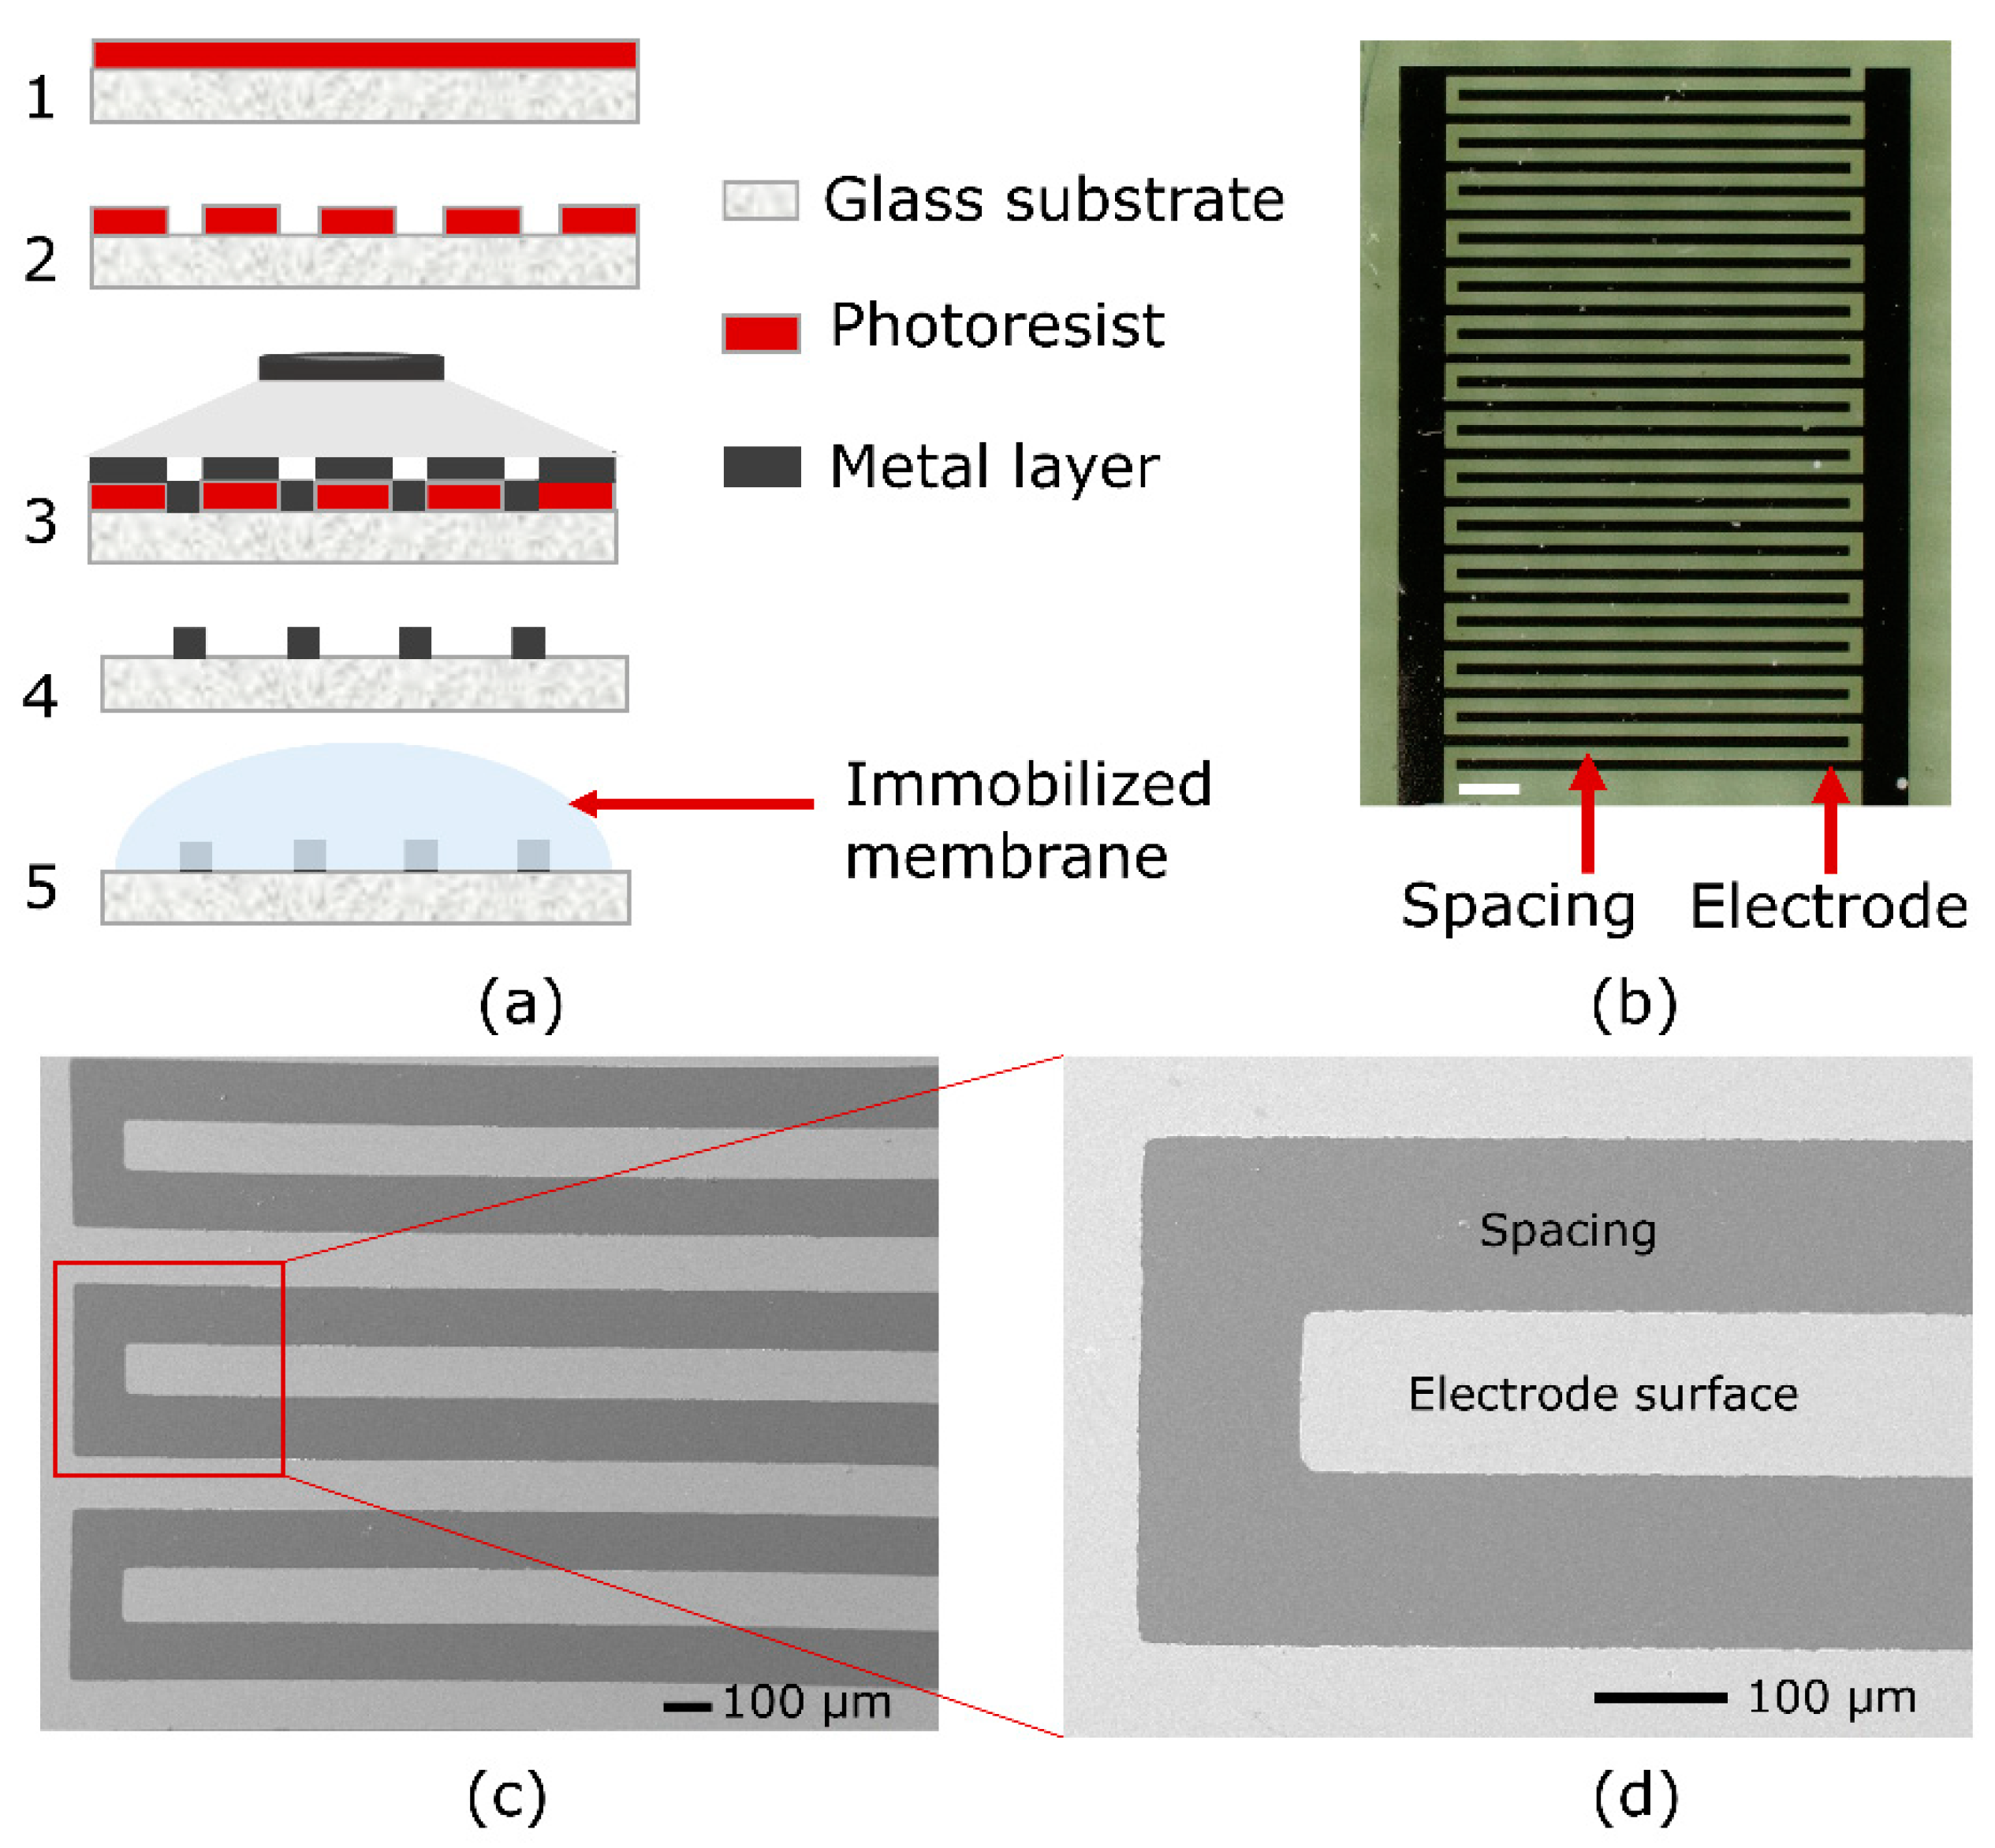
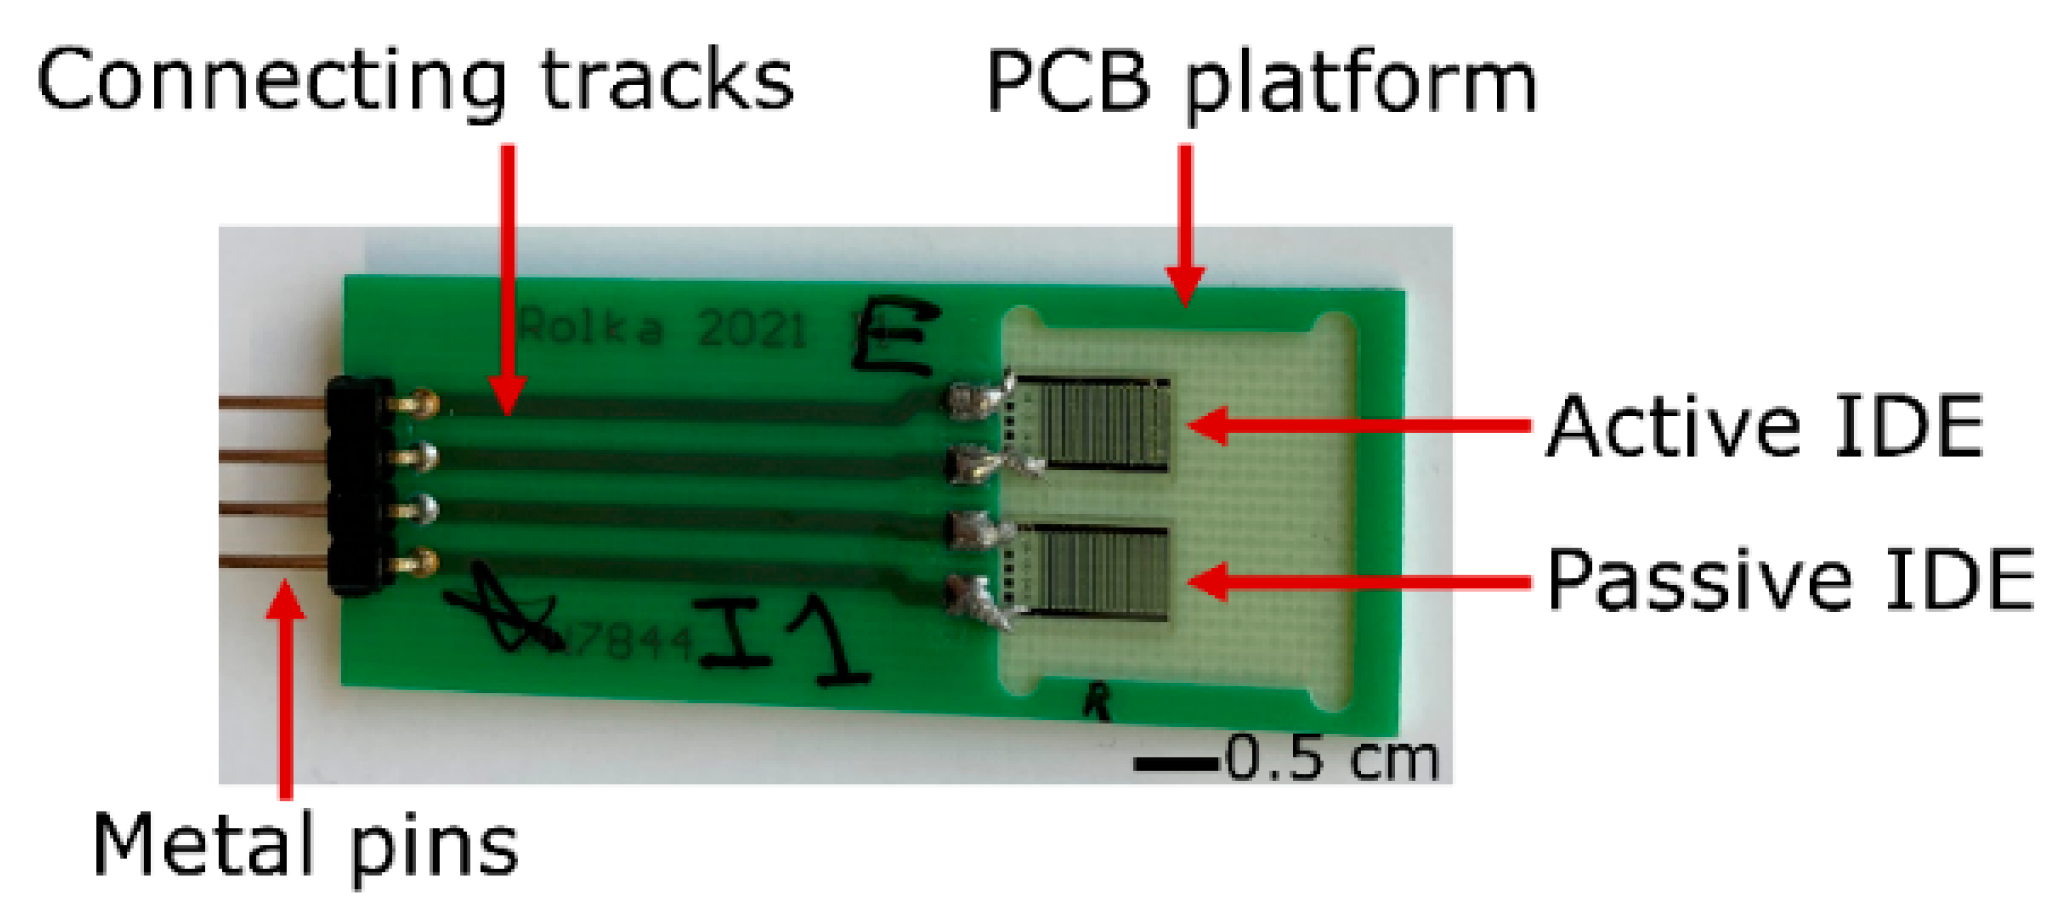
2. Materials and Methods

Sensor fabrication and preparation. Dzyadevich et al. introduced the conductometric detection of hydrogen peroxide (e.g., urea) in liquids by means of a differential setup of IDEs with enzymatic activation [42]. Motivated by these studies, IDE structures of Ti/Pt on glass substrates were prepared in this experiment (see process scheme, Figure 1a).
For that, a 3 inch borosilicate glass wafer (MicroChemicals GmbH, Ulm, Germany) was used as a substrate material. After the photoresist (AZ 5214 E photoresist, MicroChemicals GmbH, Germany) was spin coated onto the glass wafer, it was baked on a hot plate for 5 min at 95 °C. One UV exposure step (mask aligner Karl Suss MJB 3, i-line intensity: 100 mJ/cm2) was carried out with a photomask to finish the patterning of the photoresist. Subsequently, the developer (MIF 326, MicroChemicals GmbH, Ulm, Germany) was used to develop the photoresist for 1 min. Figure 1a, step 2, schematically shows the patterned photoresist. Then, 20 nm of titanium and 200 nm of platinum were deposited by means of electron-beam evaporation (Univex, Leybold GmbH, Köln, Germany), shown in Figure 1a, step 3 (metal layer deposition). After metal evaporation (step 3), a lift-off process followed (step 4) and finally, the interdigitated electrode structures were achieved. The wafer was diced into chips of 5 mm × 10 mm, where each chip included one IDE sensor. For the later-on sensor setup (that consists of two IDE structures), one IDE structure was activated (next to the passive IDE structure) by enzyme immobilization with HRP; see Figure 1a, step 5, and Figure 2. A pair of active and passive IDE sensor elements was employed for the capacitive detection of the H2O2 vapor/aerosol.
As the capacitive measurement of the enzyme-based IDE biosensor depends on the design, i.e., the geometry and surface of the sensor, different sensor designs have been investigated regarding changes towards varying H2O2 concentrations. Figure 1b depicts an exemplary microscopic image of an IDE structure, containing 30 fingers with 95 µm width and 110 µm spacing. Figure 1c,d presents scanning electron microscopic (SEM) images of the fabricated IDE structures with a magnification of 75× and 220× (high-resolution Jeol JSM-7800F Schottky field-emission microscope, Fa. JEOL GmbH, Freising, Germany), having a detailed view of the electrodes.
Sensor principle of the IDE biosensor for H2O2 detection. IDE structures allow measurement of impedance changes and, consequently, capacitance variation with respect to the electrode surface and electrochemical interactions on top of it. Two identical IDE structures, as the active and passive element, respectively, were arranged in a differential sensor setup, electrically connected, and soldered on a printed circuit board (PCB) next to each other (see Figure 2). The PCB (except the IDE) was encapsulated by an insulating silicone paste (Silicone Rubber, Adhesive Sealant, RTV 1180, Momentive, Leverkusen, Germany) in order to protect the electronic part from the surroundings.
The active sensor element was coated with a colorless membrane containing HRP (Peroxidase from Horseradish, Type VI, 250 U/mg, Sigma-Aldrich, Taufkirchen, Germany), to react with H2O2 and finally, to detect it in the vapor/aerosol phase (see [41] for more details on HRP). The HRP was dissolved in phosphate-buffered saline (PBS: NaH2PO4 + Na2HPO4 + deionized (DI) water, pH = 6.8). Next, 5 μL of this solution was applied onto the surface of the active IDE sensor by means of drop coating, i.e., physical adsorption was selected as the immobilization strategy. The immobilized HRP membrane was then let dry at room temperature for 2 h. When not in use, the sensors were stored at 4 °C. Since the present experiments were not performed in solution, an additional encapsulation of the IDE structure (prior to the silicone) was not necessary.
Several characterization techniques were employed in order to assess the surface and the thickness of the HRP membrane layer. According to the reports, which validate the HRP structure by X-ray diffraction, the side length of the HRP in its three-dimensional form can be up to 11 nm long [43,44]. However, for an enzyme with adsorptive immobilization, both the surface coverage and the amount of enzyme on the surface are important, and consequently correspond with the functionality of the sensor [45,46].
In that regime, profilometry was employed to assess the thickness of the membrane layer. The thickness of the HRP membrane on the biosensor surface proved to be <1 µm, which is typical for adsorptively immobilized enzymatic membranes [46]. An exemplary result of the profilometric investigation on the enzyme membrane-coated and passive IDE structure is presented in Figure 3. The surface is scanned across the interdigitated electrodes. At the left side of Figure 3, the results show the pattern of the examined passive IDE chip with the profile of the interdigitated electrodes of about ~220 nm. This corresponds to the thickness of the metallic electrodes. At the right side of Figure 3, the surface of the membrane-coated IDE (active IDE) is scanned, which indicates a change of profile, presenting the membrane layer on the sensor. This study shows a thickness of around 500 nm for the enzymatic layer. The volume of the membrane was adequate to cover the whole surface of the active IDE structure. These results are comparable to literature data with adsorptively immobilized enzymes; in general, the amount of the adsorptively immobilized enzyme on the sensor surface corresponds with the sensor functionality [45]. What has always been an important factor is the sensor sensitivity, which is evaluated regarding the membrane composition. Here, factors such as the enzyme concentration or the enzyme activity mainly determine the sensor performance (see [45,47]).
The surface of the IDE structure with the coated enzyme membrane layer is also investigated by optical microscopy (Figure 4a). A blurry surface of the examined IDE sensor can be seen. Therefore, for investigating the layer morphology in more detail, a SEM technique is employed as well. Figure 4b presents a 5000× magnification on the enzyme membrane-coated surface. The layer is shown to homogeneously cover the IDE sensor. Figure 4c presents a 20,000× magnification inside Figure 4b, for a better observation of the membrane layer. This series of characterizations confirms a dense and homogenous membrane layer on top of the IDE structures, following the adsorptive coating of the HRP membrane on the IDE.
The mechanism behind the reaction of H2O2 with HRP and its sequences, depending on the methods and application, is discussed elsewhere [25,38,39,40,48,49]. As it is well understood by far, the HRP immobilized on the sensor surface will react with the present H2O2 and is oxidized. This oxidized form of HRP is then reduced to the native HRP by an electron transfer reaction [40,50]. The process of this enzymatic reaction can be explained step by step by the following chain Equations (1)–(3). In the first step, the HRP is oxidized, and its first oxidized form is called Compound–I or C–I (Equation (1)). At the second step, C–I is reduced to form Compound–II or C–II by an electron transfer reaction (Equation (2)). Two completely environmentally friendly end-products, namely water and oxygen, result during these two reactions [50]. Then, by means of a second electron transfer reaction, C–II is reduced again to form the HRP original state (Equation (3)). Studies show that the HRP, which is incorporated in the membrane on the sensor surface, catalyzes the reduction of H2O2, while its enzymatic activity remains intact. This enzymatic activity has also been confirmed by electrochemical and cyclic voltammetry detection elsewhere [40].
H2O2 + HRP → C–I + H2O
C–I + e → C–II + O2
C–II + e → HRP
Figure 5 (left) schematically represents the enzymatic reaction of H2O2 with HRP. On the right side, the predicted sensor signal change (due to this reaction) is depicted. It is assessed by capacitive measurements in this study.
The enzymatic reaction between the HRP and H2O2 can also be discussed from a physical point of view, as it impacts the impedance and, subsequently, the capacitance of the sensor structure. As discussed elsewhere [51,52,53], the IDE structure holds specific characteristics which allow its impedimetric analysis. The capacitance of the system ( C ) is described as follows:
C = L ( N 1 ) ( ε 0 ε r , t 2 K ( ( 1 k 2 ) 1 2 ) K ( k ) + 2 ε 0 ε r , m t S )
Equation (4) includes L as the length of the fingers, N as the number of fingers and t as the thickness of the electrode fingers. ε 0 represents the dielectric permittivity of the vacuum and ε r , t is the total relative permittivity which surrounds the IDE electrode; i.e., for the active IDE sensor element, it is the enzyme membrane incorporated on the surface and the glass substrate, and for the passive IDE structure, it is air and the glass substrate. K ( k ) is the first-order elliptic integral, which represents the fringing field. The influence of the periodic structure of the IDEs, namely the fingers’ spacing and width, is reflected in k precisely, as described by Equation (5):
k = cos ( π 2 ω s + ω )
Here, s is the fingers’ spacing and ω is the width of the fingers (see also in Figure 1d). Considering the physical specifications of the periodic IDE structure, the impedance and capacitance of the structure hold a relationship [51,52,54], where the capacitance can be described by the following formula:
C = sin ( φ )   2 π f Z
In case of impedimetric characterization, the impedance behavior ( Z ) across a defined frequency range ( f ) is assessed. φ is the phase angle between the impedance and capacitance ( C ). From Equation (6), one can acquire the capacitive response behavior of the IDE sensor structure, which is discussed in this research. The capacitive signal change of the IDEs, therefore, mainly corresponds to the impedance change in the immobilized enzyme membrane (in this case, due to the enzymatic reaction of HRP with H2O2; see also Figure 5, right).
Some studies show that the enzymatic activity of the HRP could be possibly influenced by metal ions (e.g., Mn2+, Co2+, Ni2+, Fe3+, Cu2+, Hg2+, Cd2+, Pb2+, etc., which might also be used in alloys in the surrounding measurement area), and this influence has to be taken into account [55,56]. The reports show that metal ions have a larger effect at higher concentrations [55]. On the other hand, some metal ions, such as Ni2+, are effective for higher enzymatic activity and for increased functional stability of the HRP (which is caused by activatory concentration of Ni2+). In that case, it is notable that the enzymatic activity increased and remained for a longer time-span in comparison to the native enzyme. The metal ions might also block the substrate interaction and cause inhibition. However, the study is performed in the liquid phase, where high concentrations of the metal ions are applied [55]. On the other hand, metal ions such as Fe3+ and Cu2+ demonstrate a higher activation effect when the enzyme is immobilized on an Fe3O4Np–PMMA film [56]. Nevertheless, one must keep in mind that the sterilization process in medical isolators follows very well-defined conditions (without varying metal ion concentrations) to avoid any re-contamination [32,35].
Experimental setup of the glass box for H2O2 detection. The IDE structures’ signal change against low concentrations of H2O2 in vapor/aerosol phase was assessed first in a glass box to simulate a medical/pharmaceutical sterilization isolator. The box was employed for a simplified proof-of-concept experiment to evaluate the H2O2 detection by the prepared differential setup. The glass box (L, W, H: 18 × 15 × 6 cm3) contained 20 mL of 35% w/w H2O2. Figure 6a shows the schematic design of the box including the different detectors and sensors: The PCB loaded with the chip-based H2O2 biosensor (IDE arrangement), as well as a SHT 31-D (Sensirion AG, Stäfa, Schweiz) reference sensor for the detection of the relative humidity and a H2O2 reference gas detector (Vaisala sensor, HPP270 series, Vaisala GmbH, Bonn, Germany) were inserted in the box.
The capacitance values of the active and passive IDE sensor elements, as well as the humidity data from the SHT 31-D, were read out and recorded by a micro-controller board (Arduino Duemilanove, Arduino IDE 1.8.15). The microcontroller was adjusted for a timing 5 V signal and a sampling rate of 300 ms. The H2O2 concentration values were monitored in addition by the Vaisala H2O2 gas detector to be able to compare the data with the developed H2O2 IDE-based sensor. The values from Vaisala were recorded by a Yokogawa DAQ system (Touch Screen GP10/GP20, Yokogawa electric corporation, Musashino, Japan).
Monitoring the sensors’ values started when the box was opened and the sensors were outside of the box. Then, the sensors were inserted, the lid of the box was closed firmly, and the measurement continued for about 10 min. Consequently, the concentration of H2O2 vapor increased in the atmosphere of the box (blue color in Figure 6a). Here, the evaporated H2O2, which was captured inside the box, reacted with the enzyme membrane on the active IDE sensor element and influenced the detected capacitive values, as discussed above. The Vaisala gas detector and the SHT 31-D recorded changes in the H2O2 concentration and relative humidity, respectively, providing reference data. In the next phase, the lid of the box was opened, the concentration decreased, and this reduction was recorded again. The results of these measurements are considered as proof of concept for the capacitive biosensor detection of H2O2 in the vapor/aerosol phase at room temperature.
Sterilization test rig as experimental setup for H2O2 aerosol detection. For continuous sensor operation with varying H2O2 and humidity, experiments were performed in ambient conditions inside an experimental sterilization test rig, which is described in [6,57]. For room temperature and aerosol dosing of H2O2, a spray nozzle (Skan fog nozzle system) was mounted on the chamber wall of the test rig in order to dose 35% w/w H2O2. The dosing rate was assessed as 47.8 mg/min. The PCB containing the active and passive IDE-sensing element, as well as the SHT 31-D and a H2O2 detector Dräger (Dräger Polytron 7000, Dräger Safety AG & CO. KGaA, Lübeck, Germany) were mounted inside the chamber. Figure 6b sketches the experimental setup, including the IDE arrangement as well as other detectors/sensors positioned inside the chamber. The biosensors and the reference detectors were positioned according to the accessibility to their read-out devices, and besides that, at a certain distance to avoid undesired possible turbulations, which might affect the sensor signals.
Here, H2O2 was injected by means of the spray nozzle and reached a maximum concentration (monitored by the Dräger detector), considering the humidity and the size of the chamber. Afterwards, the injection stopped until there was no remaining H2O2 signal by the Dräger gas detector, while the exhaust was on. The data from the Dräger detector were recorded with the help of the Yokogawa system, mentioned above. The chamber humidity was observed by the SHT 31-D and the capacitive signal changes of the active and passive IDE sensor elements were simultaneously recorded by means of the Arduino micro-controller (see above).
Assessment of the differential IDE setup reaction toward humidity. In order to study a possible influence of the relative humidity on the fabricated differential IDE setup, an experiment utilizing deionized (DI) water was performed. The same arrangement similar to Figure 6b was employed. This time, by means of the spray nozzle, DI water was injected into the chamber of the sterilization test rig (instead of H2O2) in two intervals with the same characterization as for the H2O2 monitoring (e.g., injection rate). The results of the detected signals from the IDE structures under the exposure of H2O2 and H2O are compared and discussed in the results section.

3. Results and Discussion

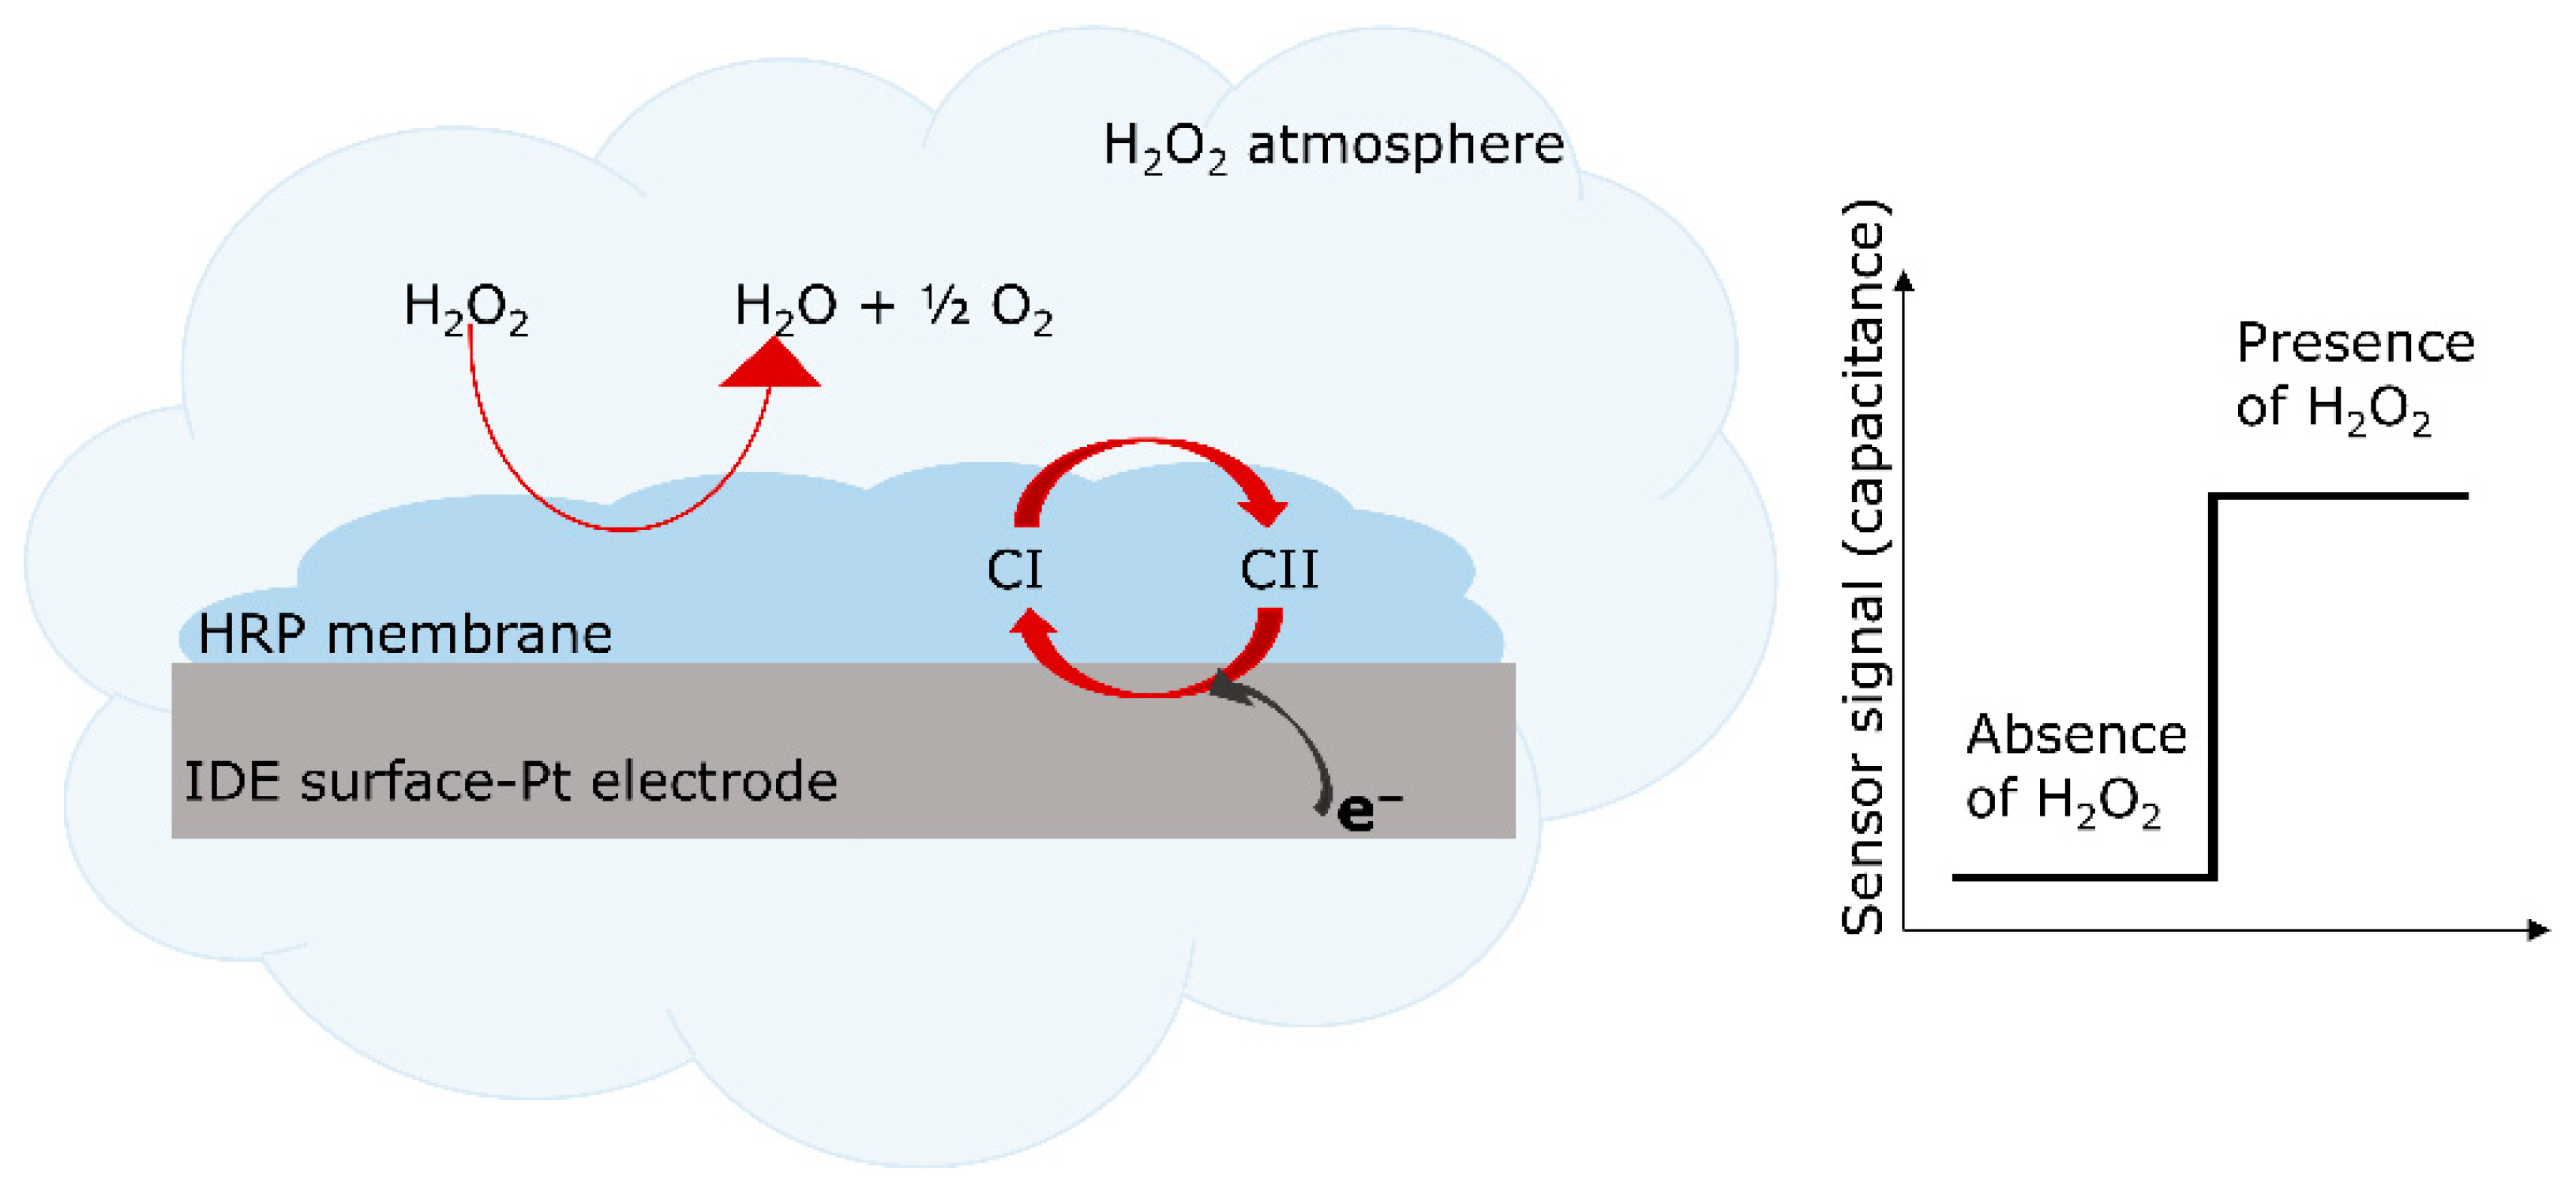
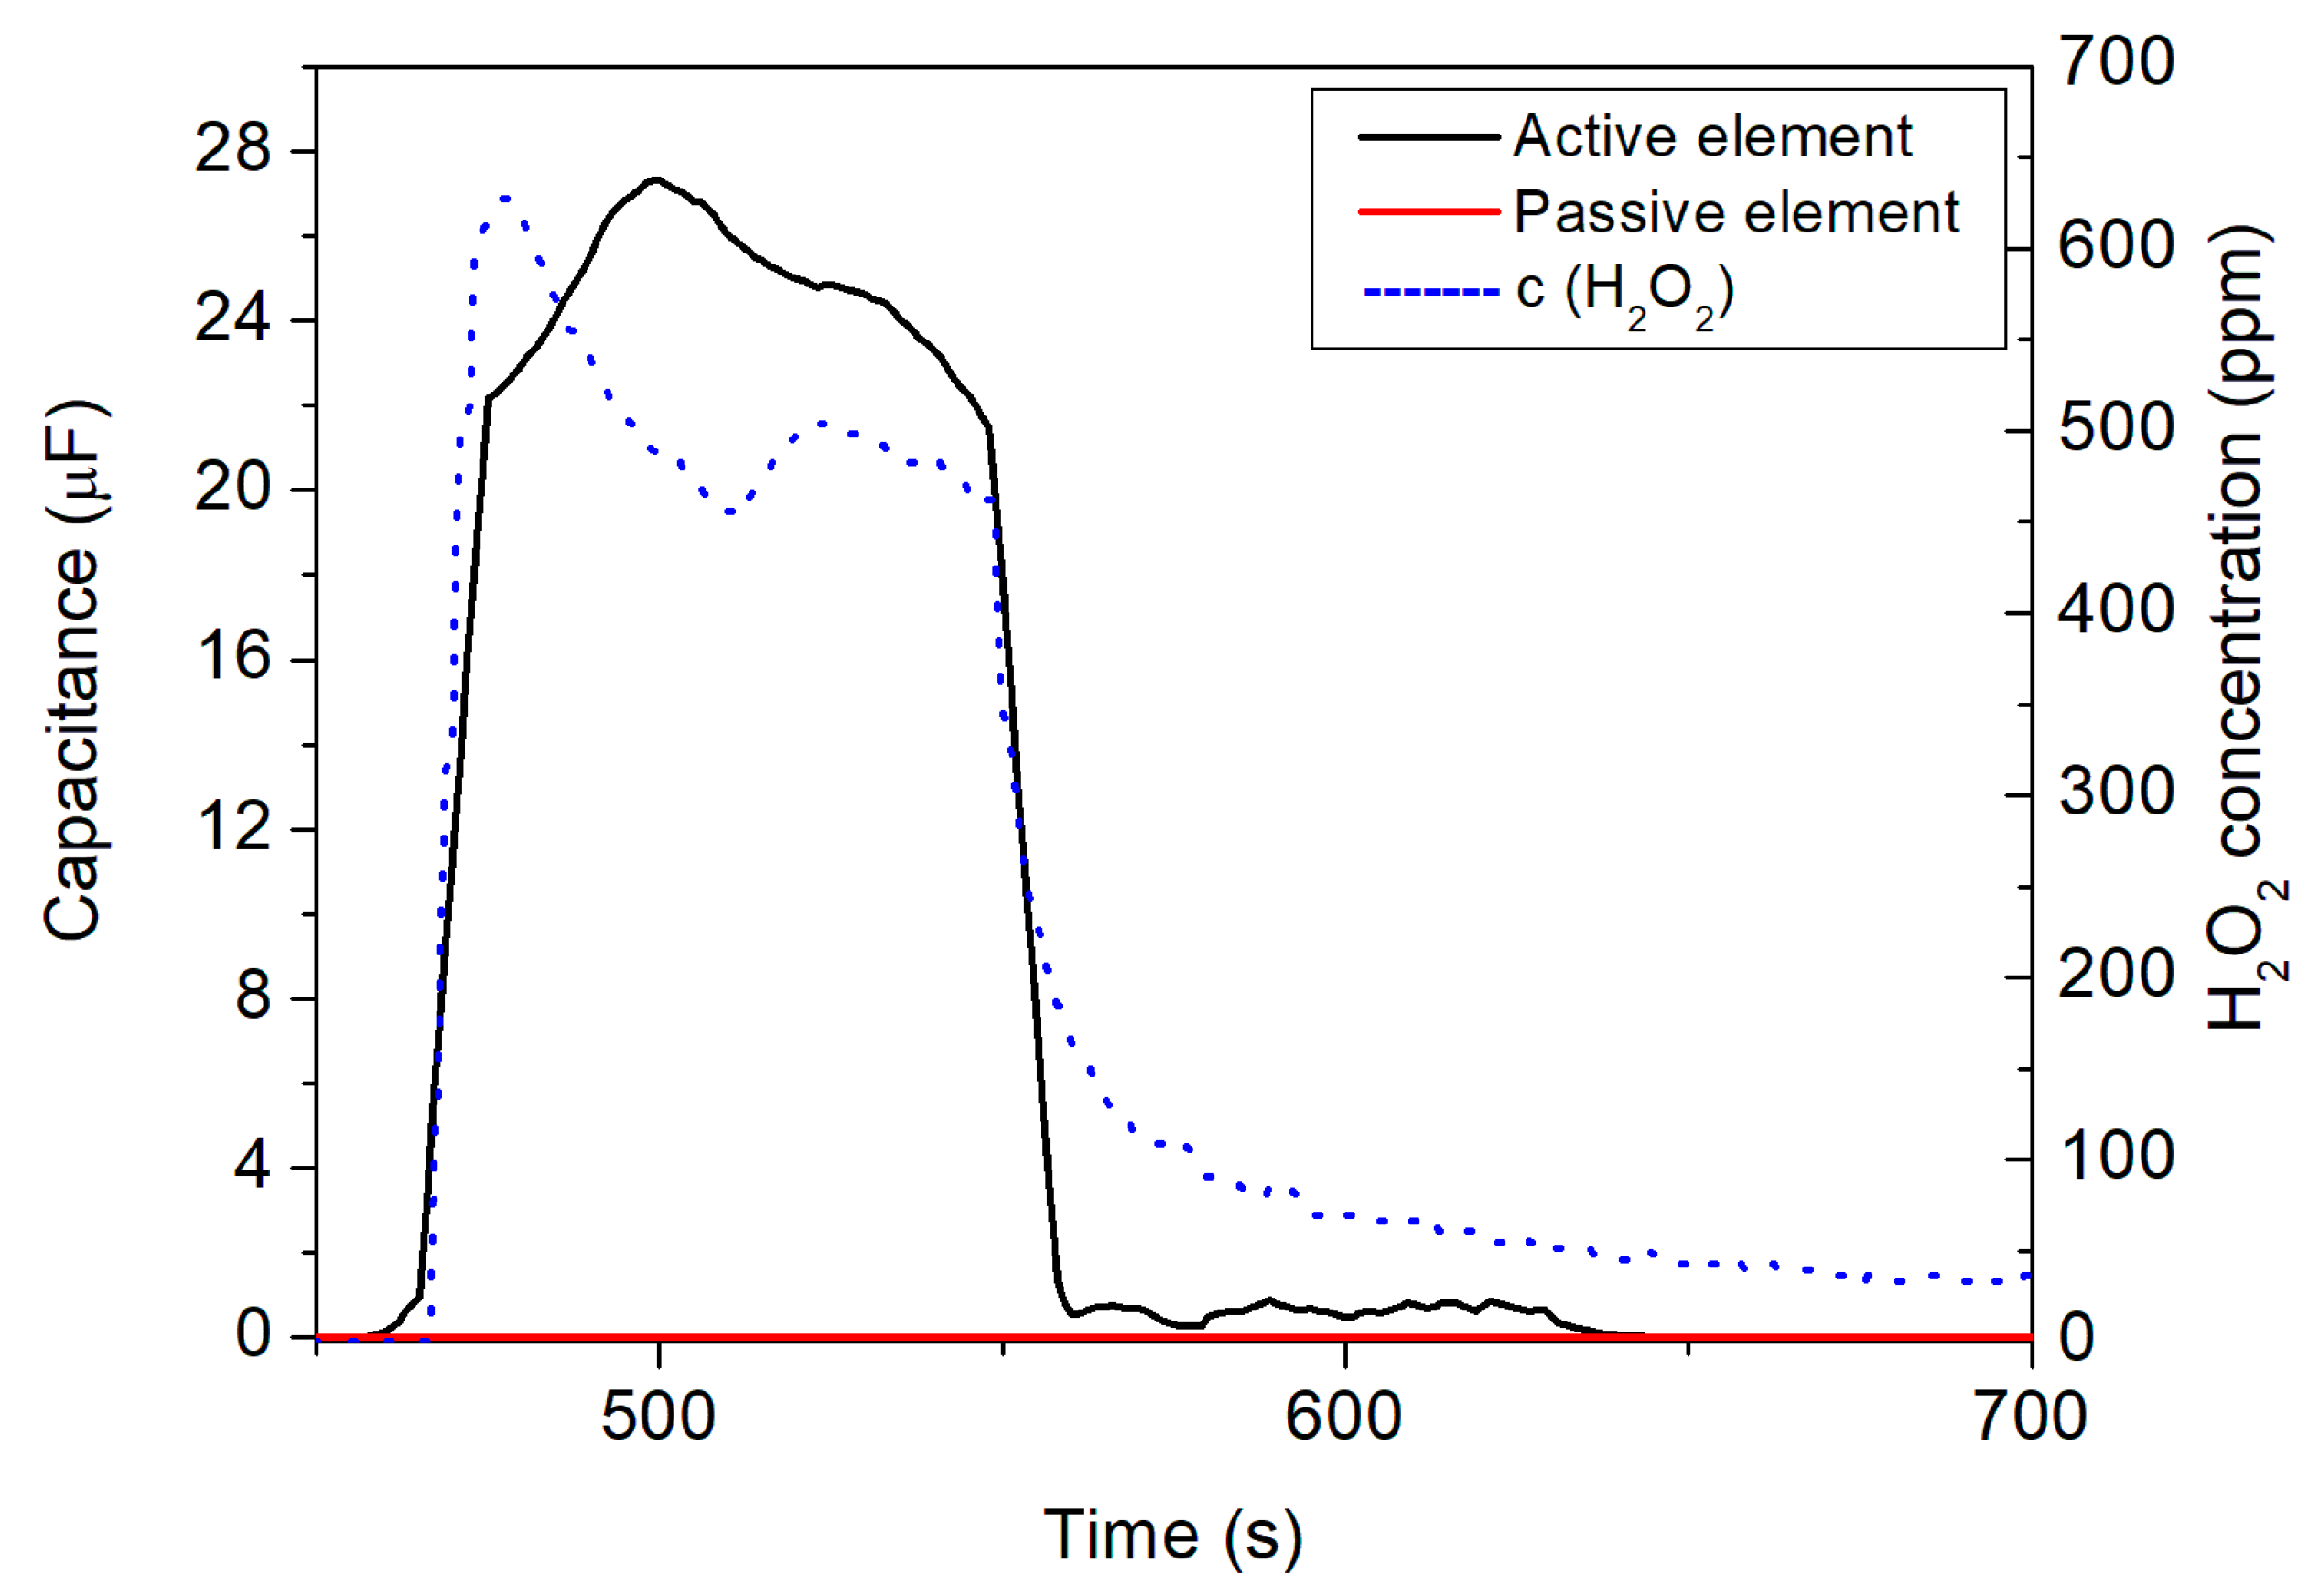
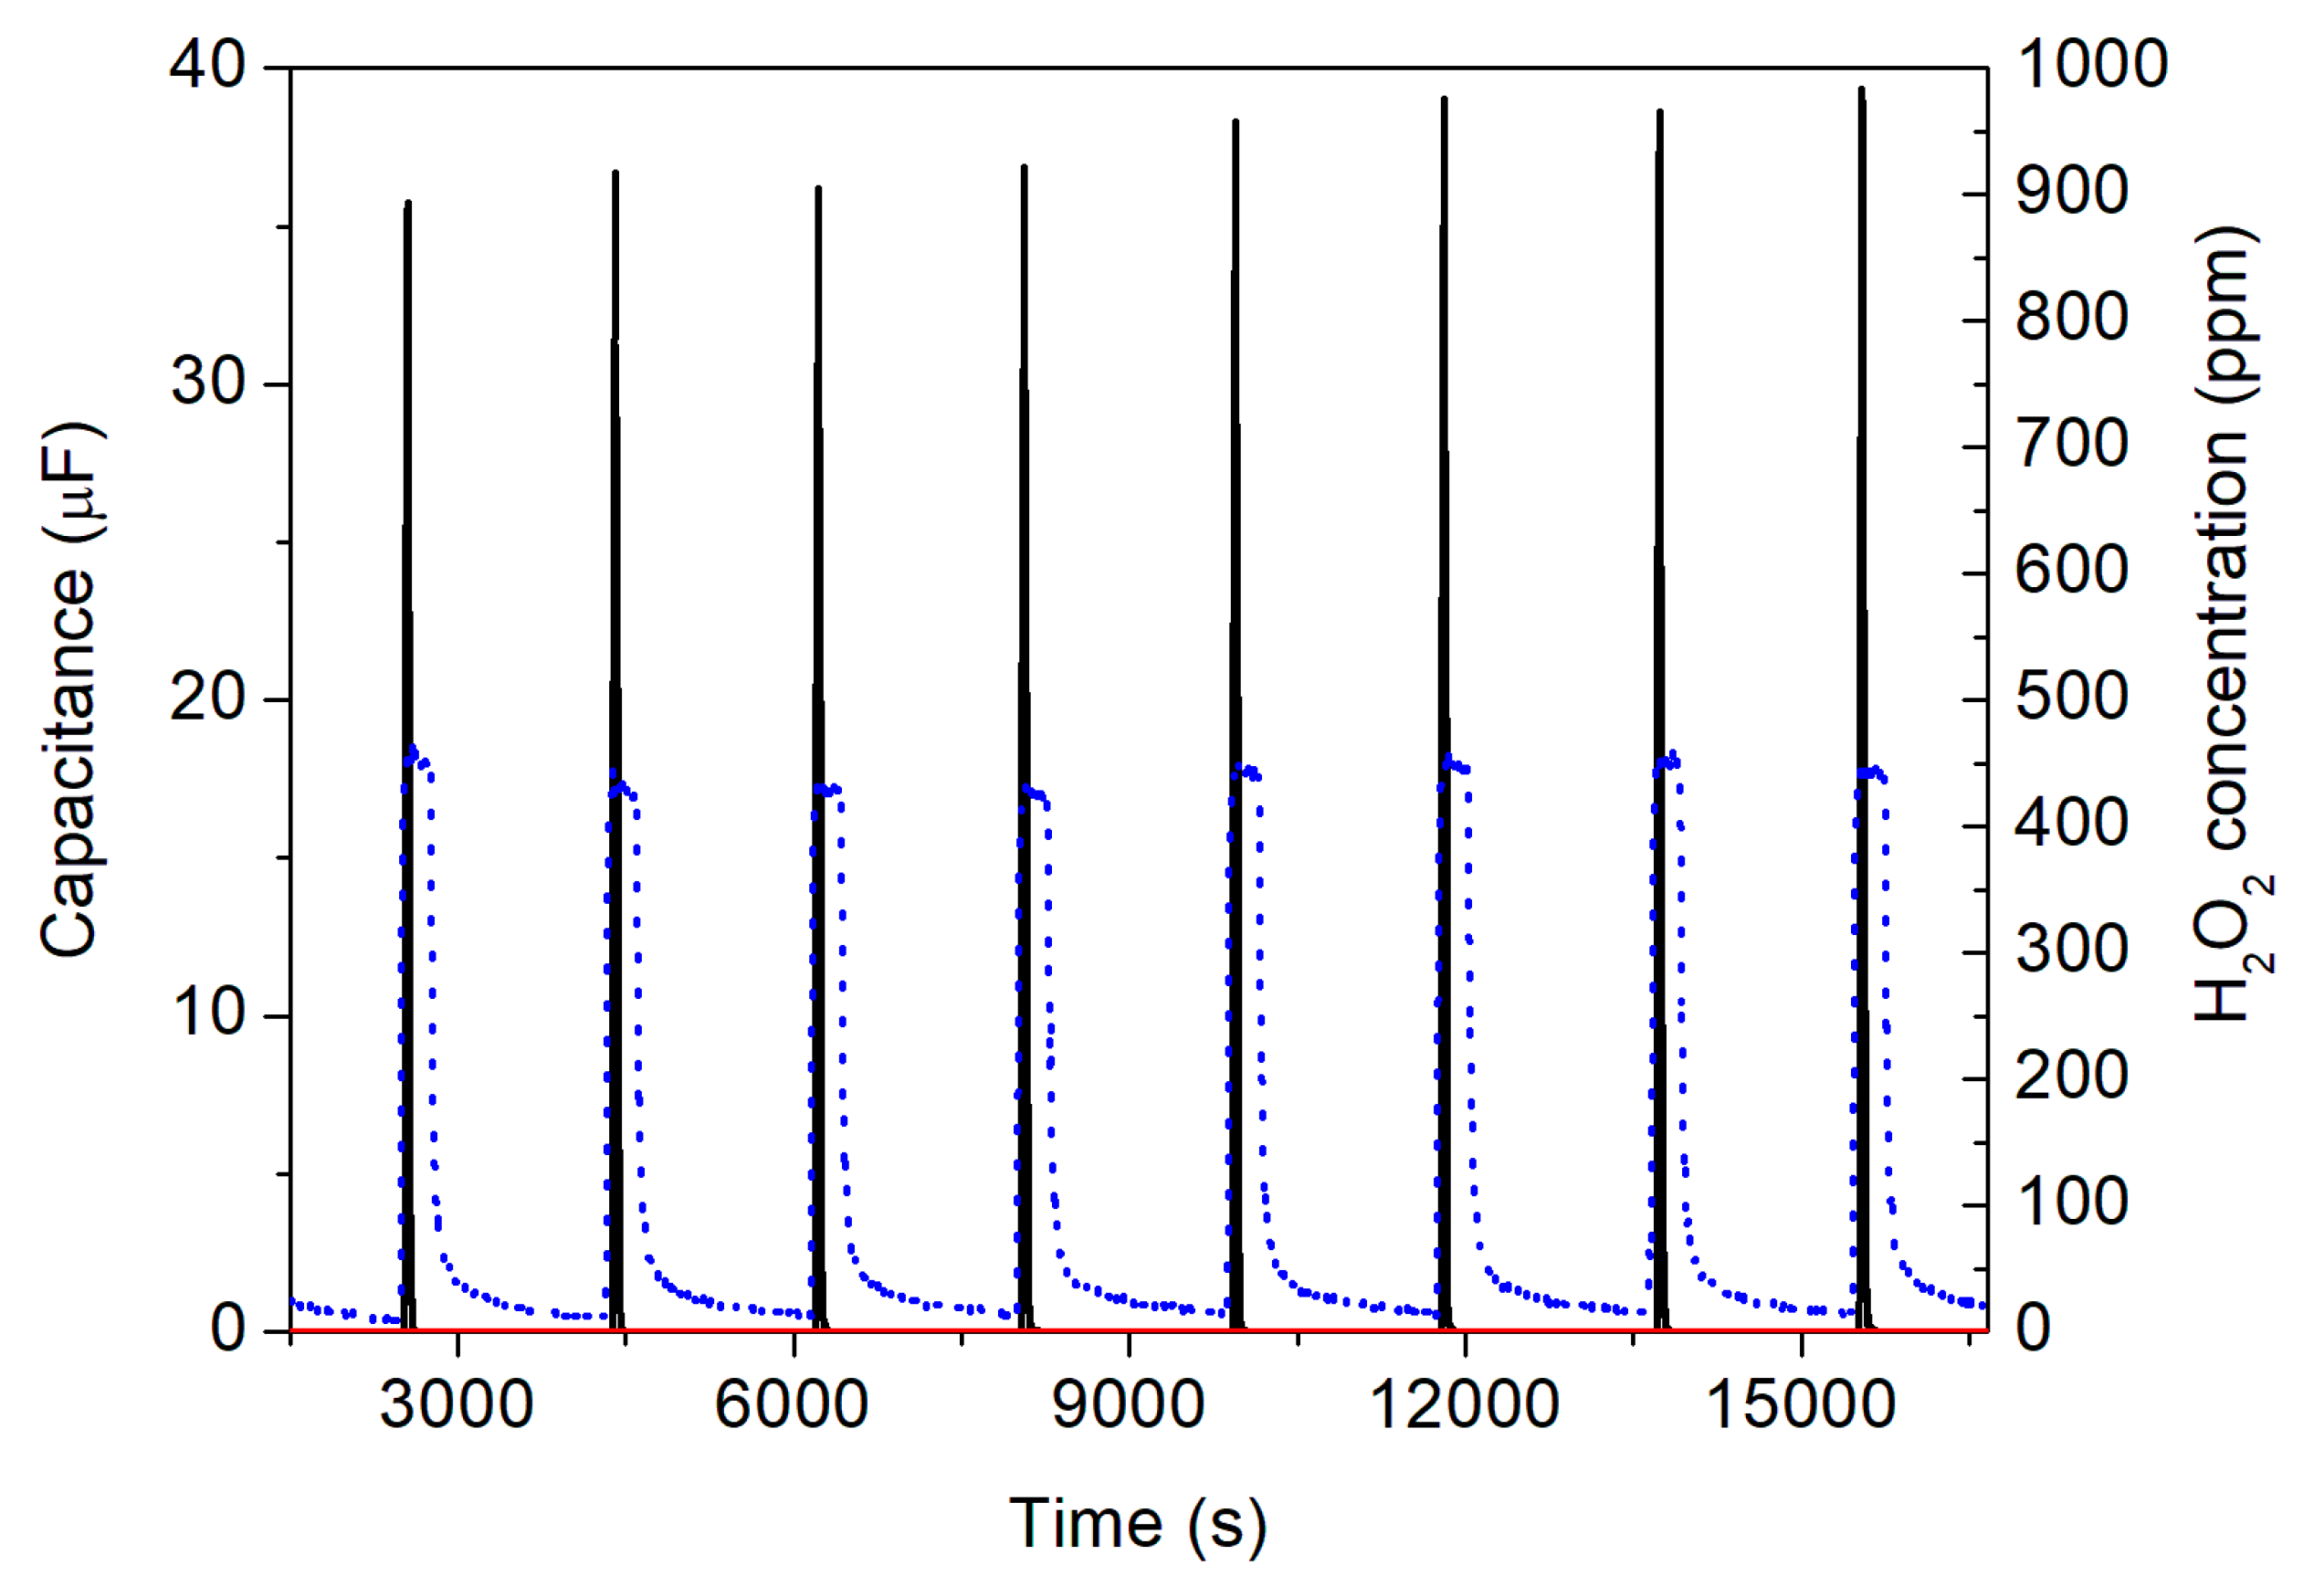
3.1. Capacitive Detection of the H2O2 Vapor Inside the Glass Box as Proof-of-Concept Experiment

Figure 7 presents the capacitive measurement results from the active and passive IDE elements inside the glass box, loaded with 20 mL of 35% w/w H2O2. In this experiment, the sensors were inside the glass box in two “time windows”. From 1900 to 4000 s and from 5200 to 6600 s the box was closed, whereas from 0 to 1900 s, 4000 to 5200 s, and 6600 to the end, it was opened. During the closing phase, the H2O2 evaporated, increasing the gaseous H2O2 concentration that could be monitored by the commercial Vaisala reference detector; these values (Figure 7, blue dashed lines and right y-axis) served as a control for the developed IDE sensor structure. As the box was opened, the concentration continuously decreased to zero. Then, to conduct a second cycle, the box was closed again, knowing well that due to constant H2O2 evaporation (note: original load of 20 mL), the H2O2 concentration in the box will somewhat decrease. This behavior can be seen by the blue dashed line of the reference detector. The maximum H2O2 concentration reaches up to around 128 ppm for the first peak and to about 116 ppm for the second peak.
More interestingly, these changes in H2O2 concentration were also detected by the developed IDE sensor setup when the box was closed or opened, respectively. The capacitive signal of the active sensor element with immobilized HRP (black curve) changed significantly and had a very good correlation with the Vaisala reference detector. The response characteristic was even faster (see, e.g., a sharp decrease in the IDE sensor signal). In contrast, the passive IDE element (red curve) did not show any H2O2 concentration dependence. Even though, in this regime, the passive element seems not to be necessary, subtracting the two signals of the active and passive IDE elements (as differential signal) might be helpful to eliminate external disturbances (e.g., temperature variations) and intrinsic sensor drift. In addition, the presence of the passive IDE element next to the active one under H2O2 atmosphere is essential to validate the functionality of the enzymatic membrane for the capacitive detection of H2O2.
The measurement results in Figure 7 showed that the enzyme membrane of HRP on the active element reacts to H2O2 vapor, present in the atmosphere in the closed box (as discussed in Section 2 and elsewhere [39,40]), whereas no signal change was found for the passive IDE element. From the physical point of view, the enzymatic reaction affects the surface of the IDE sensor, which modulates the impedimetric/capacitive signal. If the surface stayed unchanged (in case of the passive sensor element), the capacitive signal did not change either (see the red curve in Figure 7). However, for the case of the active IDE sensor, if the surface dielectric behavior of the sensor was influenced with regard to the reaction of the enzyme membrane with H2O2 vapor in the box, the capacitance of the IDE sensor changed. The proof-of-concept experiment allowed successful H2O2 vapor detection in the <150 ppm H2O2 concentration range and encouraged us to perform further measurements for the detection of H2O2 in an experimental sterilization test rig.

3.2. Capacitive Detection of the H2O2 Vapor/Aerosol in the Sterilization Test Rig

Motivated by the proof-of-concept experiments in Section 3.1, the detection of the injected H2O2 vapor/aerosol was investigated in the experimental sterilization test rig. To apply the H2O2 vapor/aerosol in the chamber, the spray nozzle, mounted on the chamber wall, was adjusted to inject fine particles of H2O2 inside the sterilization chamber, as described in Section 2. This scenario indicates typical conditions for medical/pharmaceutical isolators, employed to sterilize medical equipment. For the detection of the H2O2 vapor/aerosol, the same active and passive IDE sensor elements, of which the result of vapor detection is presented in Section 3.1, were employed in the sterilization chamber.
Figure 8 presents an exemplary measurement of the developed IDE sensor setup with an applied H2O2 concentration of 630 ppm: the PCB loaded with the active and passive IDE sensor elements was mounted inside the chamber, as well as the reference detector (see Figure 6b). As can be seen, the nozzle began dosing of the H2O2 vapor/aerosol in the time window of 460 until 560 s (blue dashed lines corresponds to the signal from the H2O2 reference detector). Before and after this period, no H2O2 was applied. The Dräger reference gas detector monitored the increase in H2O2 concentration when the spray nozzle started H2O2 dosing. Additionally, the active IDE (black curve in Figure 8), holding the enzymatic HRP membrane, reacted accordingly to the increase in the H2O2 concentration, and its capacitive sensor signal increased. The signal behavior of the Dräger reference gas detector and the active IDE sensor did not perfectly overlap, which might be explained by somewhat different positions of the gas detector and the IDE sensor setup inside the gas chamber, which had unequal distances to the gas inlet nozzle. On the other hand, the peak amplitudes showed good correlation, which demonstrated the functionality of the developed IDE sensor setup. In contrast with the active IDE element, the passive IDE element (red curve in Figure 8) did not react to the presence of H2O2, as proved and discussed already in the experiments in Section 3.1.
When the dosing of the H2O2 vapor/aerosol stopped, the active IDE element signal also dropped accordingly, similar to the signal of the reference Dräger gas detector. As for the measurements in the glass box, the response behavior of the IDE sensor was “sharper” (faster) than for the reference gas detector and can be estimated to be <60 s. It is important to note that no cross-sensitivity was found between the active and passive IDE elements against the H2O2 vapor/aerosol. The differential IDE setup enables detection of the presence of H2O2 vapor/aerosol in a smaller (e.g., glass box) or a bigger (sterilization test rig) sterilization environment by changes in the capacitive sensor signal. Again, the presence of the passive IDE sensor element (no reaction to the H2O2 aerosol) can be assessed to avoid any environmental or intrinsic perturbations. In general, due to the miniaturized and flexible IDE sensor setup, a mapping of the H2O2 concentration at different positions of the sterilization test rig might be realized in the future to provide a higher grade of information compared to commercial gas detectors.
A series of different H2O2 gas concentrations were applied and detected by the IDE sensor elements in the setups described above. From the results of these measurements, a calibration plot is depicted in Figure 9.
Here, the corresponding capacitive sensor signal toward the following H2O2 concentrations was evaluated: 116, 128, 165, 330, 340, 350, 380, 450, 548, 570, 630 ppm. The data points show the average values from a set of measurements in each concentration, with their standard errors (note: some data points have a smaller error, so they might not be visible). From this series of measurements, a linear relationship between the H2O2 vapor/aerosol concentration and the change in the capacitive sensor signal arises. The result presents a linear sensitivity of 57.8 ± 1.4 nF per c(H2O2) in ppm, which can be determined by Equation (7):
C = S × c(H2O2)
where C is the capacitance measured by the IDE sensor setup (active enzyme-immobilized sensor element) at the particular H2O2 concentration defined as c(H2O2). S indicates the sensitivity of the sensor setup. The calculated Pearson correlation coefficient of the fit shows r = 0.9922.
Additionally, the IDE differential setup was assessed for repeatability studies in detecting the H2O2 vapor/aerosol. This set of experiments included an about 5 h long continuous measurement inside the sterilization test rig, including eight subsequent “on”/“off” cycles of the H2O2 vapor/aerosol with a concentration of 450 ppm. Figure 10 presents the results of the repetitive capacitive detection of the H2O2 vapor/aerosol by the IDE differential setup. As an example, the spray nozzle started to inject H2O2 from 2500 s for 5 min. These cycles occurred with intervals of 10 min “resting time” with the spray nozzle closed, in order to reach a minimum of the H2O2 concentration close to zero. The changes of H2O2 concentration in ppm is depicted by the blue dashed lines (right y-axis).
The active sensor of the IDE setup (black curve) immediately followed the changes in the H2O2 concentration with a very fast response characteristic. For a maximum H2O2 vapor/aerosol concentration of 450 ppm, the capacitance of the biosensor amounted to be around 35 µF. This value is slightly higher than expected from the calibration curve (see Figure 9). One possible reason for this behavior might be the fact that for the repeatability experiments, a freshly prepared active IDE sensor (with immobilized HRP) was utilized, in contrast with the calibration measurements (where the active IDE sensor was already in operation for several weeks). At the same time, the passive IDE element (red curve) did not show any change in its capacitance signal, as expected. Interestingly, with repeated inflow of the H2O2 vapor/aerosol (i.e., with increasing number of cycles), due to some remaining portion of the vapor/aerosol in the chamber (cycle 1–450 ppm, cycle 8–441 ppm), there was also a modest rise in the sensor’s capacitance from originally 35.7 µF (cycle 1) to 39.3 µF (cycle 8), whose effect seemed not to be present for the reference gas detector from Dräger company.

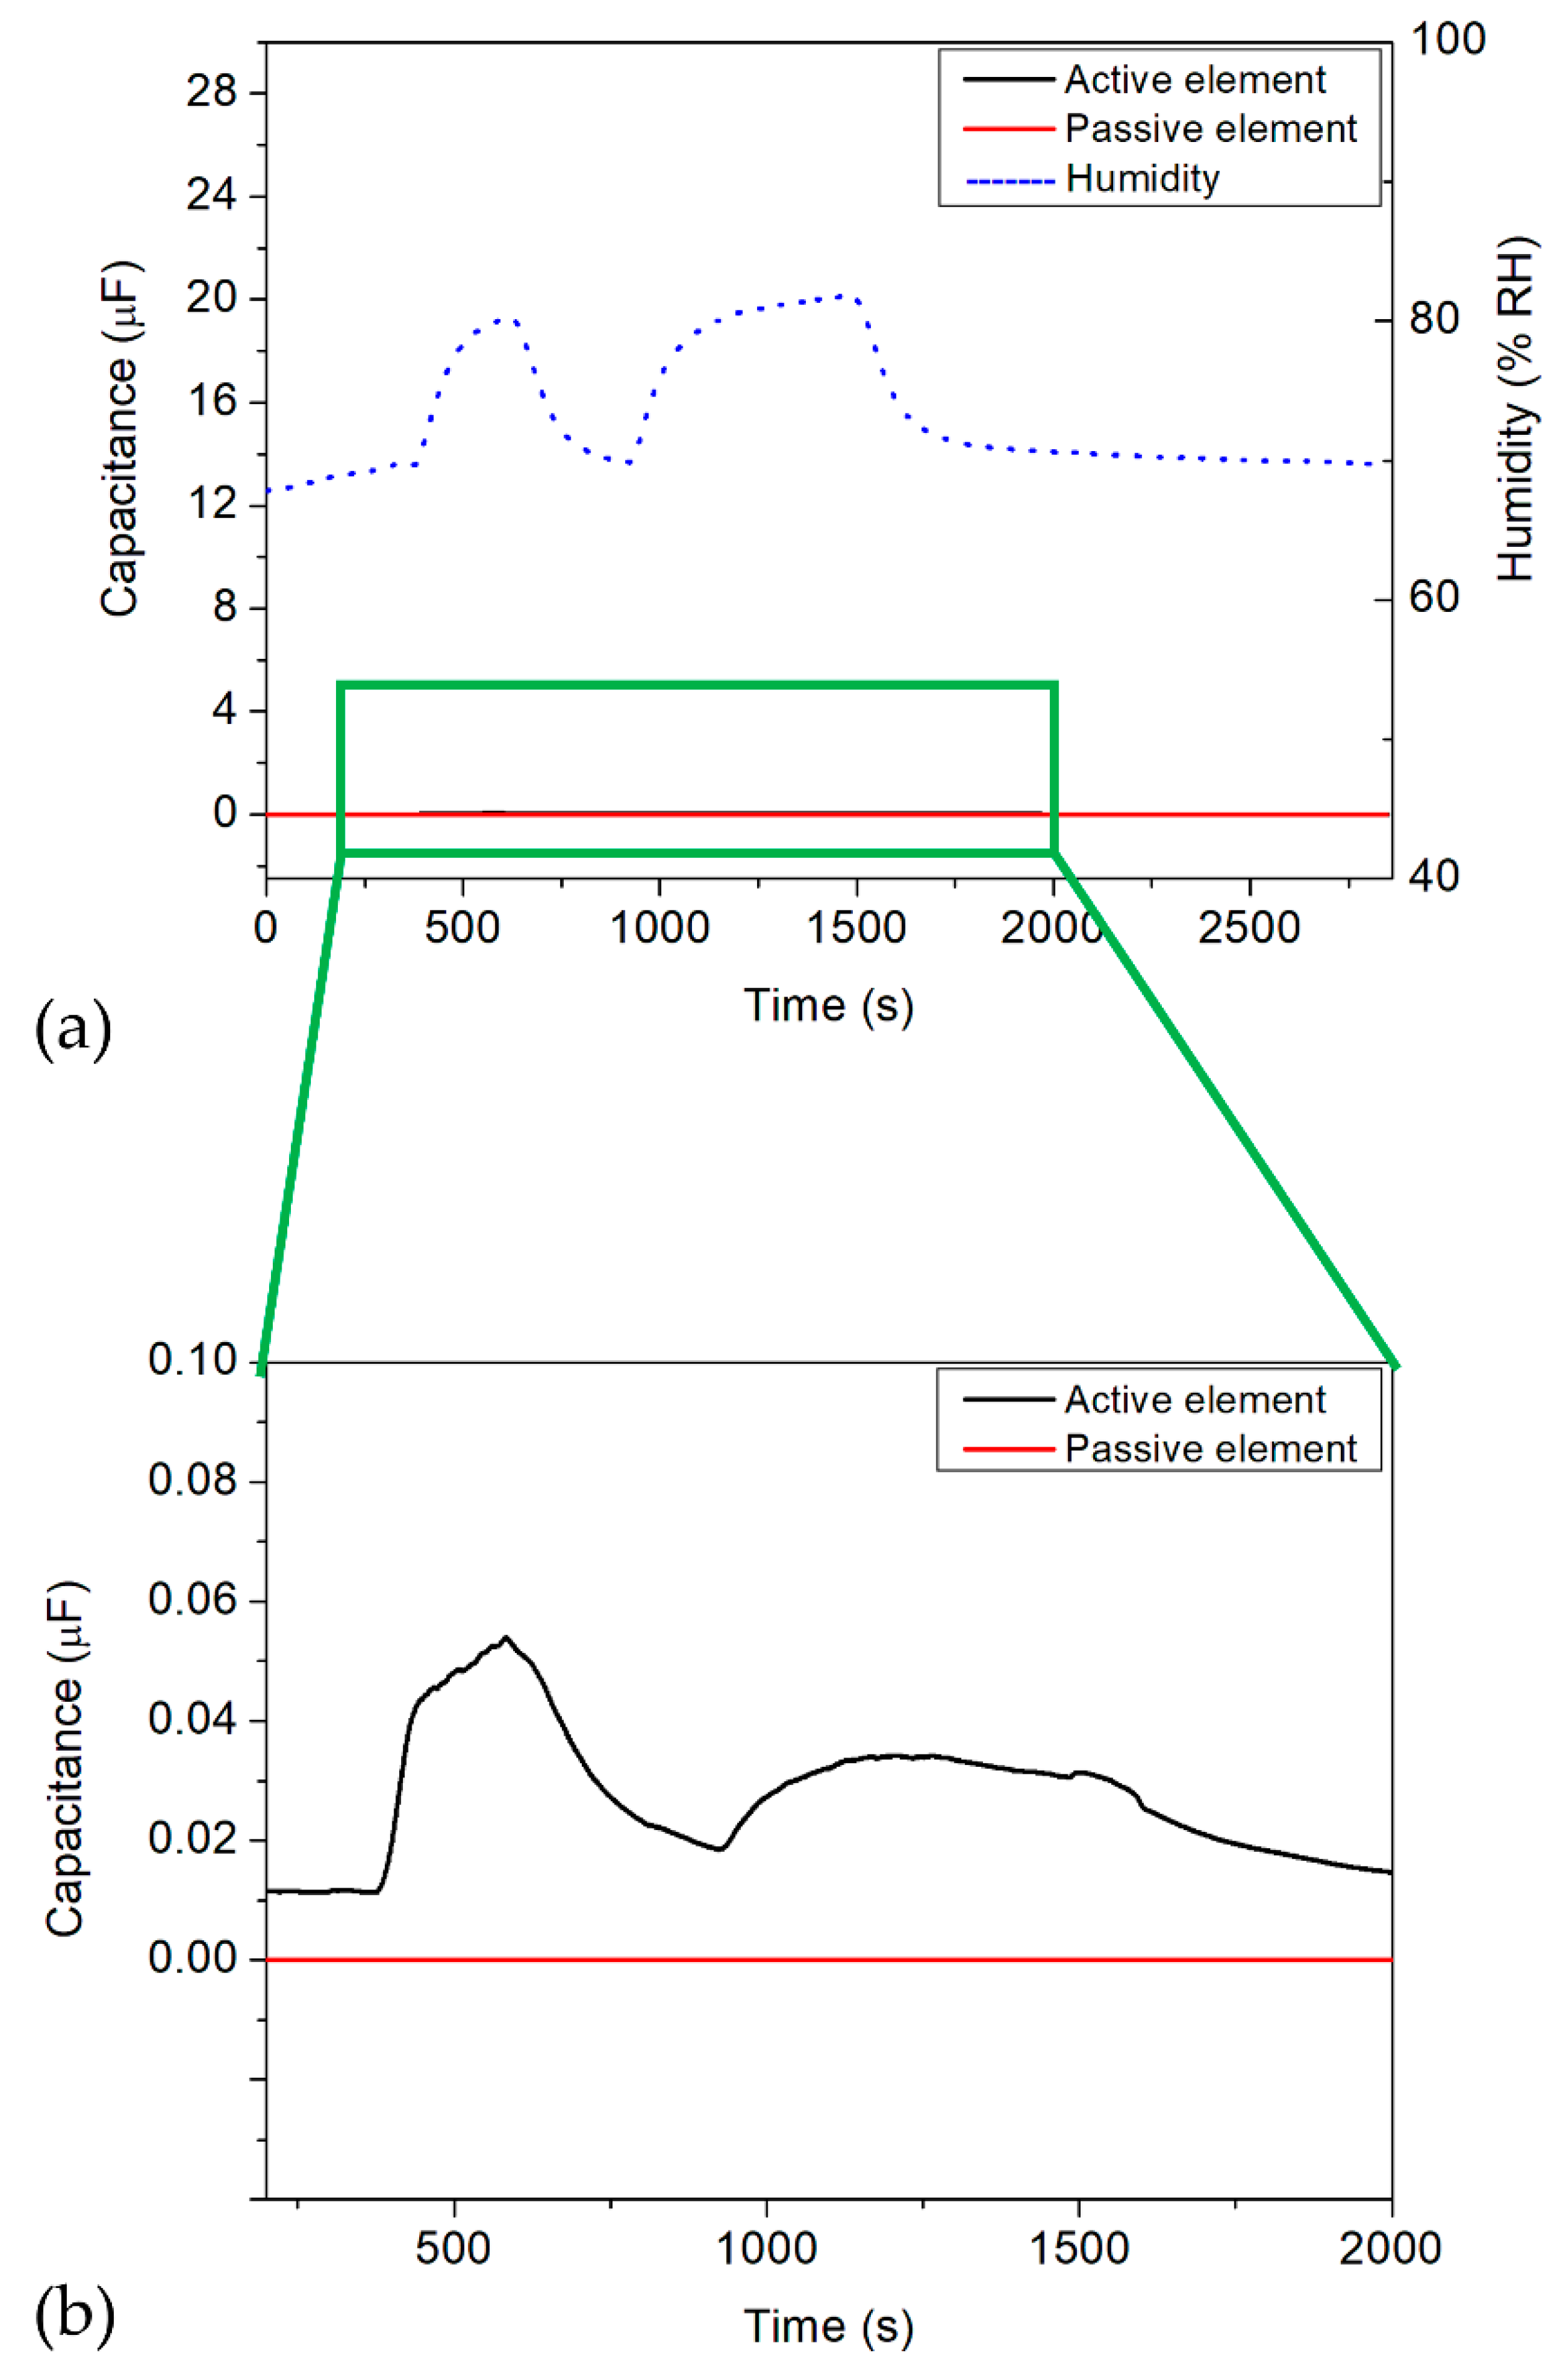
3.3. Influence of the Relative Humidity on the Capacitive Detection of the H2O2 Aerosol

The differential setup of the IDEs detected the presence of different concentrations of H2O2 vapor/aerosol. However, since the applied 35% w/w H2O2 is originally an aqueous solution (before being evaporated to its gaseous form), the influence of the water/humidity in these experiments onto the capacitive sensor signal should be studied. As discussed in Section 2, therefore, in a separate experiment, DI water was injected inside the experimental test rig to provide a humid atmosphere. Both the IDE sensor setup and a reference humidity sensor (SHT 31-D, Sensirion) monitored these conditions. This way, the influence of the IDE sensor setup towards the relative humidity can be excluded.
Figure 11 presents a typical example of a capacitive measurement in a humid atmosphere for the active (black curve) and passive (red curve) IDE sensor element with regard to the water addition (blue dashed line, right y-axis). In this experiment, DI water was injected into the chamber of the experimental test rig by the spray nozzle in two “time windows”, from 350 to 600 s and from 950 to 1500 s. The relative humidity reached a maximum value of 81%, which was controlled by the additional humidity reference sensor SHT 31-D. In between the two dosing intervals, the spray nozzle was switched off, where the relative humidity reached a minimum value of 68% (as the chamber was closed and no dry air was pumped into it at the nozzle-off moments, the humidity cannot decrease to the relative humidity of ambient air).
As can be seen from the global diagram, the active and passive IDE elements did not react to the increase in the relative humidity inside the measurement chamber of the experimental test rig, which is exhibited by the black and red curves in Figure 11a, respectively. For comparison, the scaling of the left axis in this diagram (i.e., the capacitance values) is equal to that in the diagram in Figure 8. Figure 11b shows a detailed view of the influence of the relative humidity onto the IDE sensor structure. Here, the active/passive IDE elements had only small capacitance changes of 53.7 nF when varying the relative humidity to 81%. Such capacitive change would correspond to a change in the H2O2 concentration of less than 1 ppm (see calibration plot in Figure 9). These results indicate that the differential IDE setup, containing the enzymatic HRP membrane, did not show any cross-sensitivity behavior toward humidity. In addition, it also confirms that the HRP membrane on the active IDE sensor does not react to water, meaning neither oxidation nor reduction occurs on the sensor surface, which could lead to a change in the overall sensor signal.

4. Conclusions and Outlook

A differential biosensor setup of two chip-based IDE structures (an active one with immobilized HRP enzyme membrane and a passive one) was developed for the capacitive detection of low H2O2 concentrations in the vapor/aerosol phase. Low H2O2 concentrations are applied, for example, in medical or pharmaceutical isolators for sterilization of medical equipment. Here, it is of great interest to monitor the H2O2 concentration in the isolators online and to ideally have a two or three-dimensional mapping inside the isolator. As a proof-of-concept experiment, the sensor setup was employed for the detection of H2O2 vapor in a firmly closed glass box containing 20 mL of 35% w/w H2O2, where it allowed functionality testing with a dependence of the capacitive sensor signal from a H2O2 concentration regime between 0 and 128 ppm. To more accurately reproduce sterilization processing for medical equipment in an isolator, subsequent studies were performed in a sterilization test rig, where a spray nozzle enabled dosing of the H2O2 vapor/aerosol in a concentration range of ≤630 ppm. The differential setup of the IDE biosensors reacted to the applied H2O2 concentrations directly, with a fast response time and an average sensitivity of 57.8 nF/c(H2O2). It was able to detect all concentrations reliably, which could be demonstrated by an endurance test over 5 h, including eight consecutive sterilization cycles. The biosensor setup did not suffer from any cross-sensitivity toward humidity; similar experiments as for the H2O2 detection were performed utilizing DI water, which was injected via the spray nozzle inside the sterilization chamber. As a result, the novel IDE biosensor is capable of fulfilling the requirement in the medical industry for possible online monitoring and 3D mapping of medical isolators, due to its flat shape, cost-efficient production, miniaturized structure, and less cross-sensitivity towards humidity.
In general, this micro-fabricated enzymatic biosensor has shown a reliable detection pattern explicitly for low concentrations of H2O2, which opens up a new avenue toward future sterilization monitoring in medical or pharmaceutical isolators. Nowadays, monitoring of the sterilization chamber is enabled using reference detectors available on the market, which are also used in this research. To compare with the novel biosensors, one can take a look into the characteristics of the Vaisala gas detector. Several factors could be assessed and compared, including the size (flat and miniaturized size of the novel biosensor vs. the bulky size of commercial detectors), the cost efficiency, the applicability (possibility for simultaneous utilization of several sensors for multi-dimensional mapping of medical isolators also to identify the so-called “cold spots”, where the sterilization does not work properly), and so on. This type of mapping is important for medical isolators for (i) avoiding fluctuations/deviations of the decontamination cycle parameters from the set values, etc. and (ii) running a smooth process and monitoring the conditions simultaneously and accurately. Table 1 gives a summary of the sensor features that have been discussed above.
In order to offer a high-tech solution of the miniaturized biosensor to be applied in the market, further investigations need to proceed, as some additional parameters must be evaluated: for instance, long-term measurements have to be addressed in order to evaluate the lifetime of the biosensor (i.e., the enzyme membrane), check if the sensitivity is intact, and suggest the next sensor renewal. The shelf-life of the stored biosensor needs to be assessed as well. However, the enzymatic reaction of the HRP to H2O2 is catalytic, which means, in case of the right storing condition, the sensor would function for a relatively long time as the enzyme activity stays stable. In order to improve the functionality of the biosensor setup even more and obtain a stronger sensor signal, evaluation of the IDE structures with different electrode designs (e.g., electrode geometry, number and size of fingers, and their distance) are mandatory. Here, additional analysis with modeling and simulation tools will be beneficial, for example, by means of a COMSOL platform. In order to cover mapping of the inner side-surfaces of isolators, even at critical spots such as corners (where monitoring of the sterilization process is difficult), preparing these biosensors on flexible substrates such as polyimide (as a biocompatible material) is promising. Ideally, a two-dimensional mapping of the isolator walls would be possible, using the whole surface of the flexible material and containing the sensors on it, in order to evaluate the conditions perfectly. All of the above-mentioned applications of this miniaturized biosensor indicate great advantages of investing and applying such biosensors in the area of medical sterilization to avoid losing valuable time, labor costs, and other resources. Therefore, continuous, reliable, and fast verification of sterilization conditions will be possible using these novel enzymatic biosensors.

Author Contributions

Conceptualization, F.V., G.H. and M.J.S.; methodology, F.V., G.H. and M.J.S.; software, Y.A., F.V.; validation, F.V. and M.J.S.; formal analysis, Y.A., F.V. and M.J.S.; investigation, Y.A. and F.V.; data curation, Y.A., S.A. and F.V.; writing—original draft preparation, F.V. and M.J.S.; writing—review and editing, F.V., S.A., G.H. and M.J.S.; visualization, Y.A., F.V. and M.J.S.; supervision, M.J.S.; project administration, G.H. and M.J.S. All authors have read and agreed to the published version of the manuscript.

Funding

This research received no external funding.

Informed Consent Statement

Not applicable.

Data Availability Statement

The data presented in this study are available on request from the corresponding author.

Acknowledgments

The authors would also like to thank H. Iken for technical support and D. Özsoylu and K. Janus for scientific discussions.

Conflicts of Interest

The authors declare no conflict of interest.

References

  1. Jildeh, Z.B.; Wagner, P.H.; Schöning, M.J. Sterilization of objects, products, and packaging surfaces and their characterization in different fields of industry: The status in 2020. Phys. Status Solidi Appl. Mater. Sci. 2021, 218, 2170039. [Google Scholar] [CrossRef]
  2. McEvoy, B.; Rowan, N.J. Terminal sterilization of medical devices using vaporized hydrogen peroxide: A review of current methods and emerging opportunities. J. Appl. Microbiol. 2019, 127, 1403–1420. [Google Scholar] [CrossRef] [PubMed] [Green Version]
  3. McDonnell, G. The use of hydrogen peroxide for disinfection and sterilization applications. PATAI’S Chem. Funct. Groups 2014, 2, 1–34. [Google Scholar] [CrossRef]
  4. Johnston, M.D.; Lawson, S.; Otter, J.A. Evaluation of hydrogen peroxide vapour as a method for the decontamination of surfaces contaminated with Clostridium botulinum spores. J. Microbiol. Methods 2005, 60, 403–411. [Google Scholar] [CrossRef] [PubMed]
  5. Vahidpour, F.; Oberländer, J.; Schöning, M.J. Flexible calorimetric gas sensors for detection of a broad concentration range of gaseous hydrogen peroxide: A step forward to online monitoring of food-package sterilization processes. Phys. Status Solidi Appl. Mater. Sci. 2018, 215, 1800044. [Google Scholar] [CrossRef]
  6. Kirchner, P.; Ng, Y.A.; Spelthahn, H.; Schneider, A.; Henkel, H.; Friedrich, P.; Kolstad, J.; Berger, J.; Keusgen, M.; Schöning, M.J. Gas sensor investigation based on a catalytically activated thin-film thermopile for H2O2 detection. Phys. Status Solidi Appl. Mater. Sci. 2010, 207, 787–792. [Google Scholar] [CrossRef]
  7. Kirchner, P.; Oberländer, J.; Friedrich, P.; Berger, J.; Rysstad, G.; Keusgen, M.; Schöning, M.J. Realisation of a calorimetric gas sensor on polyimide foil for applications in aseptic food industry. Sens. Actuators B Chem. 2012, 170, 60–66. [Google Scholar] [CrossRef]
  8. Oberländer, J.; Kirchner, P.; Boyen, H.G.; Schöning, M.J. Detection of hydrogen peroxide vapor by use of manganese (IV) oxide as catalyst for calorimetric gas sensors. Phys. Status Solidi A 2014, 211, 1372–1376. [Google Scholar] [CrossRef] [Green Version]
  9. Kirchner, P.; Oberländer, J.; Suso, H.P.; Rysstad, G.; Keusgen, M.; Schöning, M.J. Monitoring the microbicidal effectiveness of gaseous hydrogen peroxide in sterilisation processes by means of a calorimetric gas sensor. Food Control 2013, 31, 530–538. [Google Scholar] [CrossRef]
  10. Vahidpour, F.; Guthmann, E.; Arreola, J.; Alghazali, Y.; Wagner, T.; Schöning, M.J. Assessment of various process parameters for optimized sterilization conditions using a multi-sensing platform. Foods 2022, 11, 660. [Google Scholar] [CrossRef]
  11. Oberländer, J.; Kirchner, P.; Keusgen, M.; Schöning, M.J. Strategies in developing thin-film sensors for monitoring aseptic food processes: Theoretical considerations and investigations of passivation materials. Electrochim. Acta 2015, 183, 130–136. [Google Scholar] [CrossRef]
  12. Arreola, J.; Keusgen, M.; Wagner, T.; Schöning, M.J. Combined calorimetric gas- and spore-based biosensor array for online monitoring and sterility assurance of gaseous hydrogen peroxide in aseptic filling machines. Biosens. Bioelectron. 2019, 143, 111628. [Google Scholar] [CrossRef] [PubMed]
  13. Arreola, J.; Keusgen, M.; Schöning, M.J. Towards an immobinization method for spore-based biosensors in oxidative environment. Electrochim. Acta 2019, 302, 394–401. [Google Scholar] [CrossRef]
  14. Oberländer, J.; Bromm, A.; Wendeler, L.; Iken, H.; Durán, M.P.; Greeff, A.; Kirchner, P.; Keusgen, M.; Schöning, M.J. Towards a biosensor to monitor the sterilisation efficiency of aseptic filling machines. Phys. Status Solidi A 2015, 212, 1299–1305. [Google Scholar] [CrossRef]
  15. Xu, M.; Bunes, B.R.; Zang, L. Paper-based vapor detection of hydrogen peroxide: Colorimetric sensing with tunable interface. ACS Appl. Mater. Interfaces 2011, 3, 642–647. [Google Scholar] [CrossRef]
  16. Kubo, W.; Tatsuma, T. Detection of H2O2 released from TiO2 photocatalyst to air. Anal. Sci. 2004, 20, 591–593. [Google Scholar] [CrossRef] [PubMed] [Green Version]
  17. Lee, S.H.; Kim, K.H.; Seo, S.E.; il Kim, M.; Park, S.J.; Kwon, O.S. Cytochrome C-decorated graphene field-effect transistor for highly sensitive hydrogen peroxide detection. J. Ind. Eng. Chem. 2020, 83, 29–34. [Google Scholar] [CrossRef]
  18. Lee, J.S.; Jeong, D.W.; Byun, Y.T. Porphyrin nanofiber/single-walled carbon nanotube nanocomposite-based sensors for monitoring hydrogen peroxide vapor. Sens. Actuators B Chem. 2020, 306, 127518. [Google Scholar] [CrossRef]
  19. Verma, A.L.; Saxena, S.; Saini, G.S.S.; Gaur, V.; Jain, V.K. Hydrogen peroxide vapor sensor using metal-phthalocyanine functionalized carbon nanotubes. Thin Solid Films 2011, 519, 8144–8148. [Google Scholar] [CrossRef]
  20. Patel, V.; Kruse, P.; Selvaganapathy, P.R. Solid state sensors for hydrogen peroxide detection. Biosensors 2021, 11, 9. [Google Scholar] [CrossRef]
  21. Wu, S.H.; Huang, X.B.; Tang, Y.; Ma, L.M.; Liu, Y.; Sun, J.J. Temperature controllable electrochemical sensors based on horseradish peroxidase as electrocatalyst at heated Au disk electrode and its preliminary application for H2O2 detection. Anal. Chim. Acta 2020, 1096, 44–52. [Google Scholar] [CrossRef] [PubMed]
  22. Radhakrishnan, S.; Kim, S.J. An enzymatic biosensor for hydrogen peroxide based on one-pot preparation of CeO2-reduced graphene oxide nanocomposite. RSC Adv. 2015, 5, 12937–12943. [Google Scholar] [CrossRef]
  23. Srivastava, A.; Kumar, N.; Singh, P.; Singh, S.K. H2O2 sensing using HRP modified catalyst-free ZnO nanorods synthesized by RF sputtering. Appl. Phys. A Mater. Sci. Process. 2017, 123, 453. [Google Scholar] [CrossRef]
  24. Iwata, T.; Mizutani, S.; Okumura, K.; Okumura, Y.; Takahashi, K.; Sawada, K. H2O2 detection by redox-based potentiometric sensors under biological environments. Sens. Mater. 2018, 30, 2359–2367. [Google Scholar] [CrossRef]
  25. Chen, S.; Yuan, R.; Chai, Y.; Hu, F. Electrochemical sensing of hydrogen peroxide using metal nanoparticles: A review. Microchim. Acta 2013, 180, 15–32. [Google Scholar] [CrossRef]
  26. Song, M.; Wang, J.; Chen, B.; Wang, L. A facile, non-reactive hydrogen peroxide (H2O2) detection method enabled by ion chromatography with UV detector. Anal. Chem. 2017, 89, 11537–11544. [Google Scholar] [CrossRef] [PubMed]
  27. Karyakin, A.A.; Puganova, E.A.; Budashov, I.A.; Kurochkin, I.N.; Karyakina, E.E.; Levchenko, V.A.; Matveyenko, V.N.; Varfolomeyev, S.D. Prussian blue based nanoelectrode arrays for H2O2 detection. Anal. Chem. 2004, 76, 474–478. [Google Scholar] [CrossRef]
  28. Zhang, Y.; Bai, X.; Wang, X.; Shiu, K.K.; Zhu, Y.; Jiang, H. Highly sensitive graphene—Pt nanocomposites amperometric biosensor and its application in living cell H2O2 detection. Anal. Chem. 2014, 86, 9459–9465. [Google Scholar] [CrossRef]
  29. Akahashi, A.T.; Ashimoto, K.H.; Umazawa, S.K.; Akayama, T.N. Determination of hydrogen peroxide by high-performance liquid chromatography with a cation-exchange resin gel column and electrochemical detector. Anal. Sci. 1999, 15, 481–483. [Google Scholar] [CrossRef] [Green Version]
  30. Zhang, J.; Rao, D.; Zheng, J. Synthesis of Ag nanoparticle doped MnO2/GO nanocomposites at a gas/liquid interface and its application in H2O2 detection. Electroanalysis 2016, 28, 588–595. [Google Scholar] [CrossRef]
  31. Gao, Y.C.; Xi, K.; Wang, W.N.; Jia, X.D.; Zhu, J.J. A novel biosensor based on a gold nanoflowers/hemoglobin/carbon nanotubes modified electrode. Anal. Methods 2011, 3, 2387–2391. [Google Scholar] [CrossRef]
  32. Townsend, M. Aseptic processing of protein pharmaceuticals. In Development and Manufacture of Protein Pharmaceuticals; Nail, S.L., Akers, M.J., Eds.; Plenum Publishers: New York, NY, USA, 2002; pp. 129–189. [Google Scholar]
  33. Rutala, W.A.; Weber, D.J. Disinfection and sterilization: An overview. Am. J. Infect. Control 2013, 41, S2–S5. [Google Scholar] [CrossRef]
  34. Doll, M.; Stevens, M.; Bearman, G. Environmental cleaning and disinfection of patient areas. Int. J. Infect. Dis. 2018, 67, 52–57. [Google Scholar] [CrossRef] [PubMed] [Green Version]
  35. Bounoure, F.; Fiquet, H.; Arnaud, P. Comparison of hydrogen peroxide and peracetic acid as isolator sterilization agents in a hospital pharmacy. Am. J. Health Pharm. 2006, 63, 451–455. [Google Scholar] [CrossRef] [PubMed]
  36. Doll, M.; Morgan, D.J.; Anderson, D.; Bearman, G. Touchless technologies for decontamination in the hospital: A review of hydrogen peroxide and UV devices. Curr. Infect. Dis. Rep. 2015, 17, 44. [Google Scholar] [CrossRef] [PubMed]
  37. Yang, L.; Janie, E.; Huang, T.; Gitzen, J.; Kissinger, P.T.; Vreeke, M.; Heller, A. Applications of “wired” peroxidase electrodes for peroxide determination in liquid chromatography coupled to oxidase immobilized enzyme reactors. Anal. Chem. 1995, 67, 1326–1331. [Google Scholar] [CrossRef]
  38. Castilho, T.J.; Sotomayor, M.D.P.T.; Kubota, L.T. Amperometric biosensor based on horseradish peroxidase for biogenic amine determinations in biological samples. J. Pharm. Biomed. Anal. 2005, 37, 785–791. [Google Scholar] [CrossRef]
  39. Negahdary, M.; Asadi, A.; Mehrtashfar, S.; Imandar, M.; Akbari-Dastjerdi, H.; Salahi, F.; Jamaleddini, A.; Ajdary, M. A biosensor for determination of H2O2 by use of HRP enzyme and modified CPE with Zno Nps. Int. J. Electrochem. Sci. 2012, 7, 5185–5194. [Google Scholar]
  40. Tang, J.; Wang, B.; Wu, Z.; Han, X.; Dong, S.; Wang, E. Lipid membrane immobilized horseradish peroxidase biosensor for amperometric determination of hydrogen peroxide. Biosens. Bioelectron. 2003, 18, 867–872. [Google Scholar] [CrossRef]
  41. Horseradish Peroxidase Product Specification. Available online: https://www.sigmaaldrich.com/specification-sheets/342/523/P8375-BULK________SIGMA____.pdf (accessed on 21 February 2022).
  42. Dzyadevich, S.V.; Zhylyak, G.A.; Soldatkin, A.P.; El’skaya, A.V. Conductometric urease microbiosensor based on thin-film interdigitated electrodes for urea determination. Biopolym. Cell 1996, 12, 53–57. [Google Scholar] [CrossRef] [Green Version]
  43. Chemistry Libretexts. Horseradish Peroxidase. Available online: https://chem.libretexts.org/Bookshelves/Biological_Chemistry/Supplemental_Modules_(Biological_Chemistry)/Enzymes/Case_Studies/Horseradish_Peroxidase (accessed on 26 April 2022).
  44. Berglund, G.I.; Carlsson, G.H.; Smith, A.T.; Szöke, H.; Henriksen, A.; Hajdu, J. The Catalytic Pathway of Horseradish Peroxidase at High Resolution. Available online: https://www.rcsb.org/structure/1HCH (accessed on 26 April 2022).
  45. Abouzar, M.H.; Poghossian, A.; Siqueira, J.R.; Oliveira, O.N.; Moritz, W.; Schöning, M.J. Capacitive electrolyte-insulator-semiconductor structures functionalised with a polyelectrolyte/enzyme multilayer: New strategy for enhanced field-effect biosensing. Phys. Status Solidi Appl. Mater. Sci. 2010, 207, 884–890. [Google Scholar] [CrossRef]
  46. Poghossian, A.; Schöning, M.J.; Schroth, P.; Simonis, A.; Lüth, H. An ISFET-based penicillin sensor with high sensitivity, low detection limit and long lifetime. Sens. Actuators B Chem. 2001, 76, 519–526. [Google Scholar] [CrossRef]
  47. Jablonski, M.; Münstermann, F.; Nork, J.; Molinnus, D.; Muschallik, L.; Bongaerts, J.; Wagner, T.; Keusgen, M.; Siegert, P.; Schöning, M.J. Capacitive field-effect biosensor applied for the detection of acetoin in alcoholic beverages and fermentation broths. Phys. Status Solidi Appl. Mater. Sci. 2021, 218, 2000765. [Google Scholar] [CrossRef]
  48. Wu, L.; Yin, W.; Tang, K.; Li, D.; Shao, K.; Zuo, Y.; Ma, J.; Liu, J.; Han, H. Enzymatic biosensor of horseradish peroxidase immobilized on Au-Pt nanotube/Au-graphene for the simultaneous determination of antioxidants. Anal. Chim. Acta 2016, 933, 89–96. [Google Scholar] [CrossRef] [PubMed]
  49. Che, X.; Yuan, R.; Chai, Y.; Ma, L.; Li, W.; Li, J. Hydrogen peroxide sensor based on horseradish peroxidase immobilized on an electrode modified with DNA-L-cysteine-gold-platinum nanoparticles in polypyrrole film. Microchim. Acta 2009, 167, 159–165. [Google Scholar] [CrossRef]
  50. Baker, C.J.; Orlandi, E.W.; Deahl, K.; Domek, J. Scavenging of H2O2 and production of oxygen by horseradish peroxidase. Arch. Biochem. Biophys. 2000, 382, 232–237. [Google Scholar] [CrossRef]
  51. Abu-Abed, A.S.; Lindquist, R.G. Capacitive interdigital sensor with inhomogeneous nematic liquid crystal film. Prog. Electromagn. Res. B 2008, 7, 75–87. [Google Scholar] [CrossRef] [Green Version]
  52. Oberländer, J.; Jildeh, Z.B.; Kirchner, P.; Wendeler, L.; Bromm, A.; Iken, H.; Wagner, P.; Keusgen, M.; Schöning, M.J. Study of interdigitated electrode arrays using experiments and finite element models for the evaluation of sterilization processes. Sensors 2015, 15, 26115–26127. [Google Scholar] [CrossRef] [Green Version]
  53. Oberländer, J.; Jildeh, Z.; Kirchner, P.; Wendeler, L.; Bromm, A.; Iken, H.; Wagner, P.; Keusgen, M.; Schöning, M.J. Experimental and numerical evaluation of interdigitated electrode array for monitoring gaseous sterilization processes. In Proceedings of the 12. Dresdner Sensor-Symposium, Dresden, Germany, 9 December 2015; pp. 163–168. [Google Scholar]
  54. Maupas, H.; Saby, C.; Martelet, C.; Jaffrezic-Renault, N.; Soldatkin, A.P.; Charles, M.H.; Delair, T.; Mandrand, B. Impedance analysis of Si/SiO2 heterostructures grafted with antibodies: An approach for immunosensor development. J. Electroanal. Chem. 1996, 406, 53–58. [Google Scholar] [CrossRef]
  55. Mahmoudi, A.; Nazari, K.; Mohammadian, N.; Moosavi-Movahedi, A.A. Effect of Mn2+, Co2+, Ni2+, and Cu2+ on horseradish peroxidase: Activation, inhibition, and denaturation studies. Appl. Biochem. Biotechnol. Part A Enzym. Eng. Biotechnol. 2003, 104, 81–94. [Google Scholar] [CrossRef]
  56. Abdulaal, W.H.; Almulaiky, Y.Q. Encapsulation of HRP enzyme onto a magnetic Fe3O4 NP—PMMA film via casting with sustainable biocatalytic activity. Catalysts 2020, 10, 181. [Google Scholar] [CrossRef] [Green Version]
  57. Kirchner, P.; Li, B.; Spelthahn, H.; Henkel, H.; Schneider, A.; Friedrich, P.; Kolstad, J.; Keusgen, M.; Schöning, M.J. Thin-film calorimetric H2O2 gas sensor for the validation of germicidal effectivity in aseptic filling processes. Sens. Actuators B Chem. 2011, 154, 257–263. [Google Scholar] [CrossRef]
Figure 1. (a) Process scheme of IDE microfabrication: 1—Photoresist spin-coating on the glass substrate; 2—photoresist patterning after UV exposure; 3—metal deposition; 4—metallic patterning after lift-off process; 5—enzyme membrane coating on the active IDE sensor. (b) Optical microscopy image of the IDE structures (the white scale bar represents 500 µm); (c,d) SEM images (magnified zoom) of the micro-fabricated interdigitated electrodes.
Chemosensors 10 00202 g001
Figure 2. Photograph of two identical IDEs, namely the active and the passive element, soldered on a PCB. The active IDE structure is additionally covered with the immobilized enzymatic membrane containing HRP.
Chemosensors 10 00202 g002
Figure 3. Profilometric scan of the IDE surface. The results on the left side show the surface of the passive IDE sensor structure with the interdigitated electrodes. On the right side, the surface profile of the active IDE depicts the addition of membrane on the surface, which is calculated to be around 500 nm.
Chemosensors 10 00202 g003
Figure 4. Optical microscopy image of the investigated IDE sensor (a). The scale bar is 1000 µm. SEM images of the membrane layer with 5000× magnification (b) and 20,000× magnification (c), zoomed-in region of the enzyme-covered IDE structure.
Chemosensors 10 00202 g004
Figure 5. Schematic presentation of the enzymatic reaction of HRP with H2O2 (left). Here, H2O2 is decomposed to water and oxygen. Schematic expected change of the capacitive sensor signal in the presence of H2O2 (right).
Chemosensors 10 00202 g005
Figure 6. The two experimental setups for the detection of low concentrations of H2O2 vapor/aerosol. (a) Design of the glass box with mounted sensors and 20 mL of H2O2 inside for the detection of H2O2 vapor. (b) Experimental sterilization test rig, containing the spray nozzle and the reference sensors/detector as well as the IDEs for the detection of the H2O2 vapor/aerosol.
Chemosensors 10 00202 g006
Figure 7. Capacitive signal changes of the active (black curve) and the passive sensor element (red curve) with regard to H2O2 concentration changes (blue dashed lines, right y-axis) inside the glass box. The box was closed/opened for two times, where the peaks show the variation in the H2O2 concentration.
Chemosensors 10 00202 g007
Figure 8. Detection of the H2O2 vapor/aerosol in the sterilization test rig by the differential sensor setup with active (black curve) and passive (red curve) IDE element, respectively. The H2O2 concentration, additionally monitored by the Dräger gas reference detector (blue dashed line, right y-axis), reached a maximum concentration of 630 ppm.
Chemosensors 10 00202 g008
Figure 9. The capacitive signals of the IDE differential sensor setup with regard to different H2O2 vapor/aerosol concentrations of 116, 128, 165, 330, 340, 350, 380, 450, 548, 570, 630 ppm. A linear sensitivity of 57.8 ± 1.4 nF per c(H2O2) in ppm is determined.
Chemosensors 10 00202 g009
Figure 10. Repeatability experiment (eight subsequent “on”/”off” cycles) for the detection of the H2O2 vapor/aerosol with a H2O2 concentration of 450 ppm, adjusted by the spray nozzle. The blue dashed lines (right y-axis) indicate the H2O2 concentration additionally detected by the Dräger reference sensor. The black curve shows the signal of the active IDE sensor with the immobilized HRP, whereas the red curve indicates the signal of the passive IDE structure.
Chemosensors 10 00202 g010
Figure 11. Dosing DI water into the chamber of the sterilization test rig. (a) Signal of the commercial SHT 31-D humidity sensor (blue dashed lines, right axis) and the IDE sensor setup with active (black curve) and passive (red curve) element. (b) Magnified scaling for the capacitive signals of the IDE structures between 200 and 2000 s.
Chemosensors 10 00202 g011
Table 1. A comparison of several characteristics of the novel biosensor compared to the commercial H2O2 gas detector, Vaisala.
Commercial H2O2 Detector (e.g., Viasala)Novel Enzymatic Biosensor Setup
SizeLength: 22 mm + 96 mm
Diameter: 16 mm
Sensor: W × H: 5 × 10 mm2
PCB holder: 20 × 48 mm2
(Further miniaturization to about 2 × 2 mm2 for 2D and 3D mapping).
Response timeVaisala: >1 min<1 min
ApplicabilityLess probable application for 2D or 3D mapping
of medical isolators due to the large sizes and
non-flat sensor surface.
Due to flat shape, miniaturized structure, possibility of 2D or 3D mapping of medical isolators with several sensors at once.
CostsEUR ~2500 plus software and read-out devices.<5 Euros, cost-effective read-out by Arduino µ-controller;
for 3D mapping of the medical isolator: EUR ~200–300.
Publisher’s Note: MDPI stays neutral with regard to jurisdictional claims in published maps and institutional affiliations.

