
A Peptide-Based Trap for Metal Ions Studied by Electron Paramagnetic Resonance


Abstract
1. Introduction
2. Materials and Methods
2.1. Peptide Synthesis and Sample Preparation
2.2. EPR Measurements
2.3. Data Processing and Analysis
3. Results and Discussion
3.1. Theoretical Background of the EPR Spectroscopy
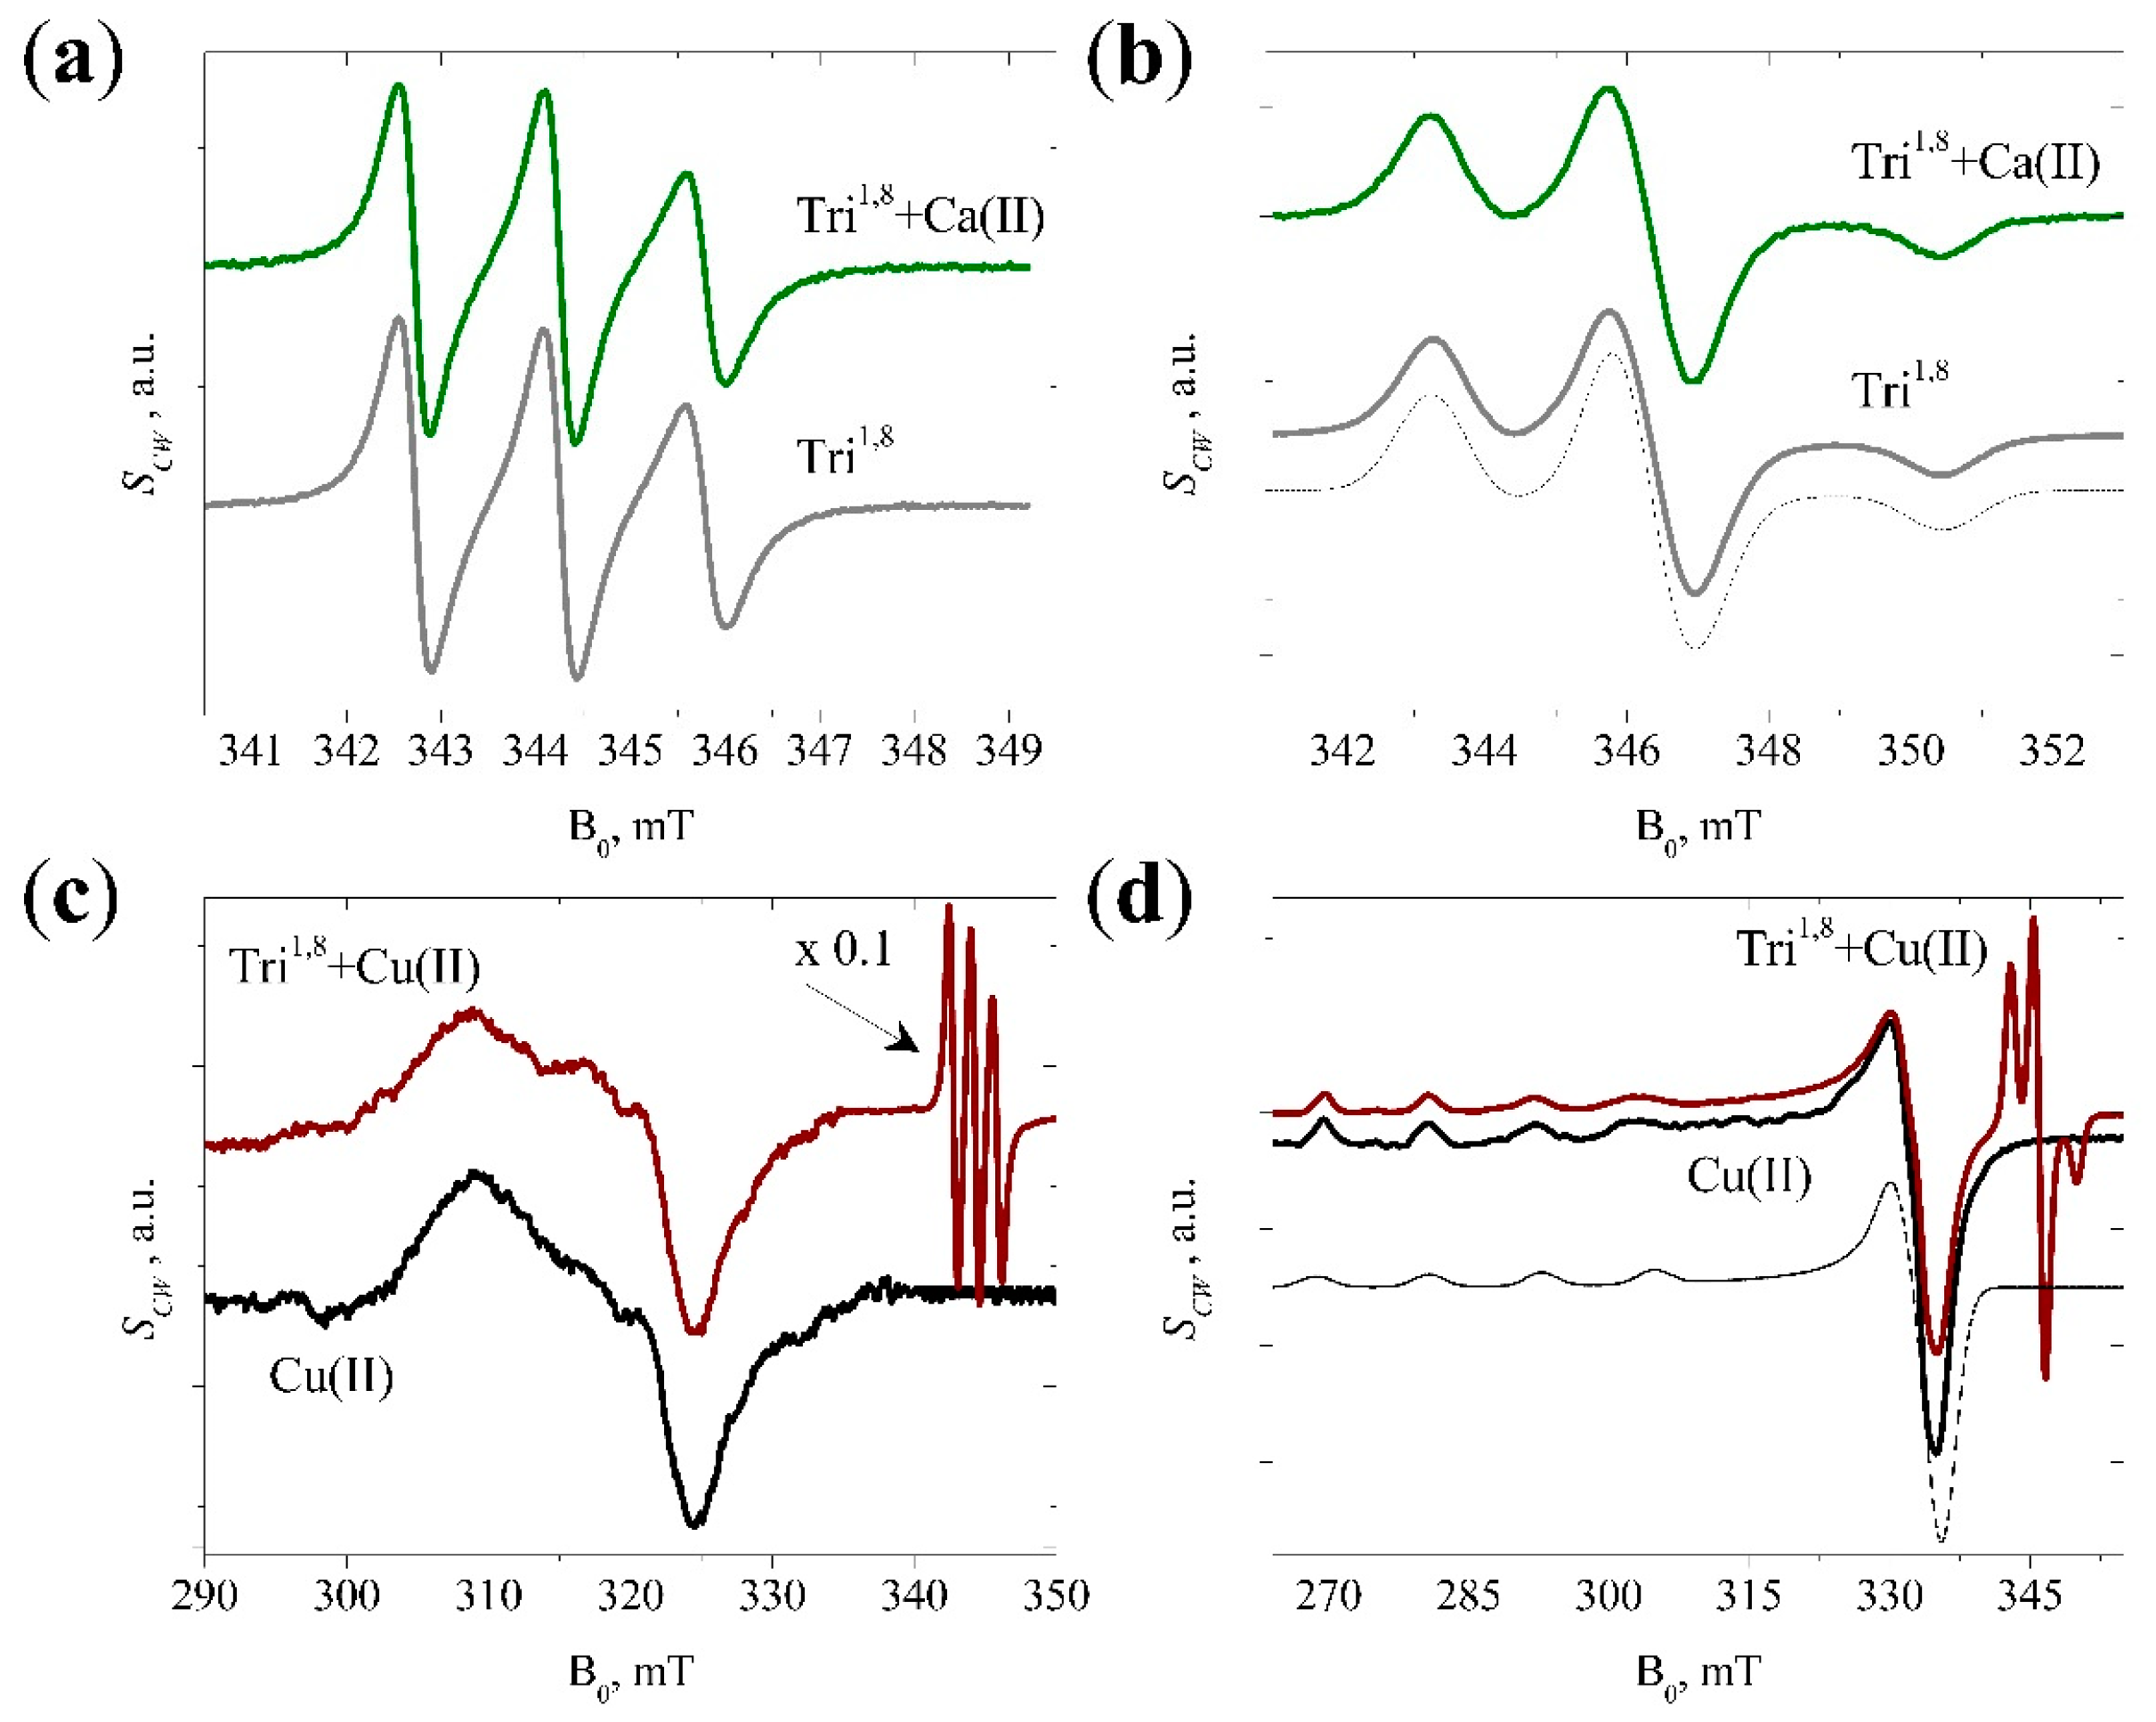
3.2. CW EPR Data
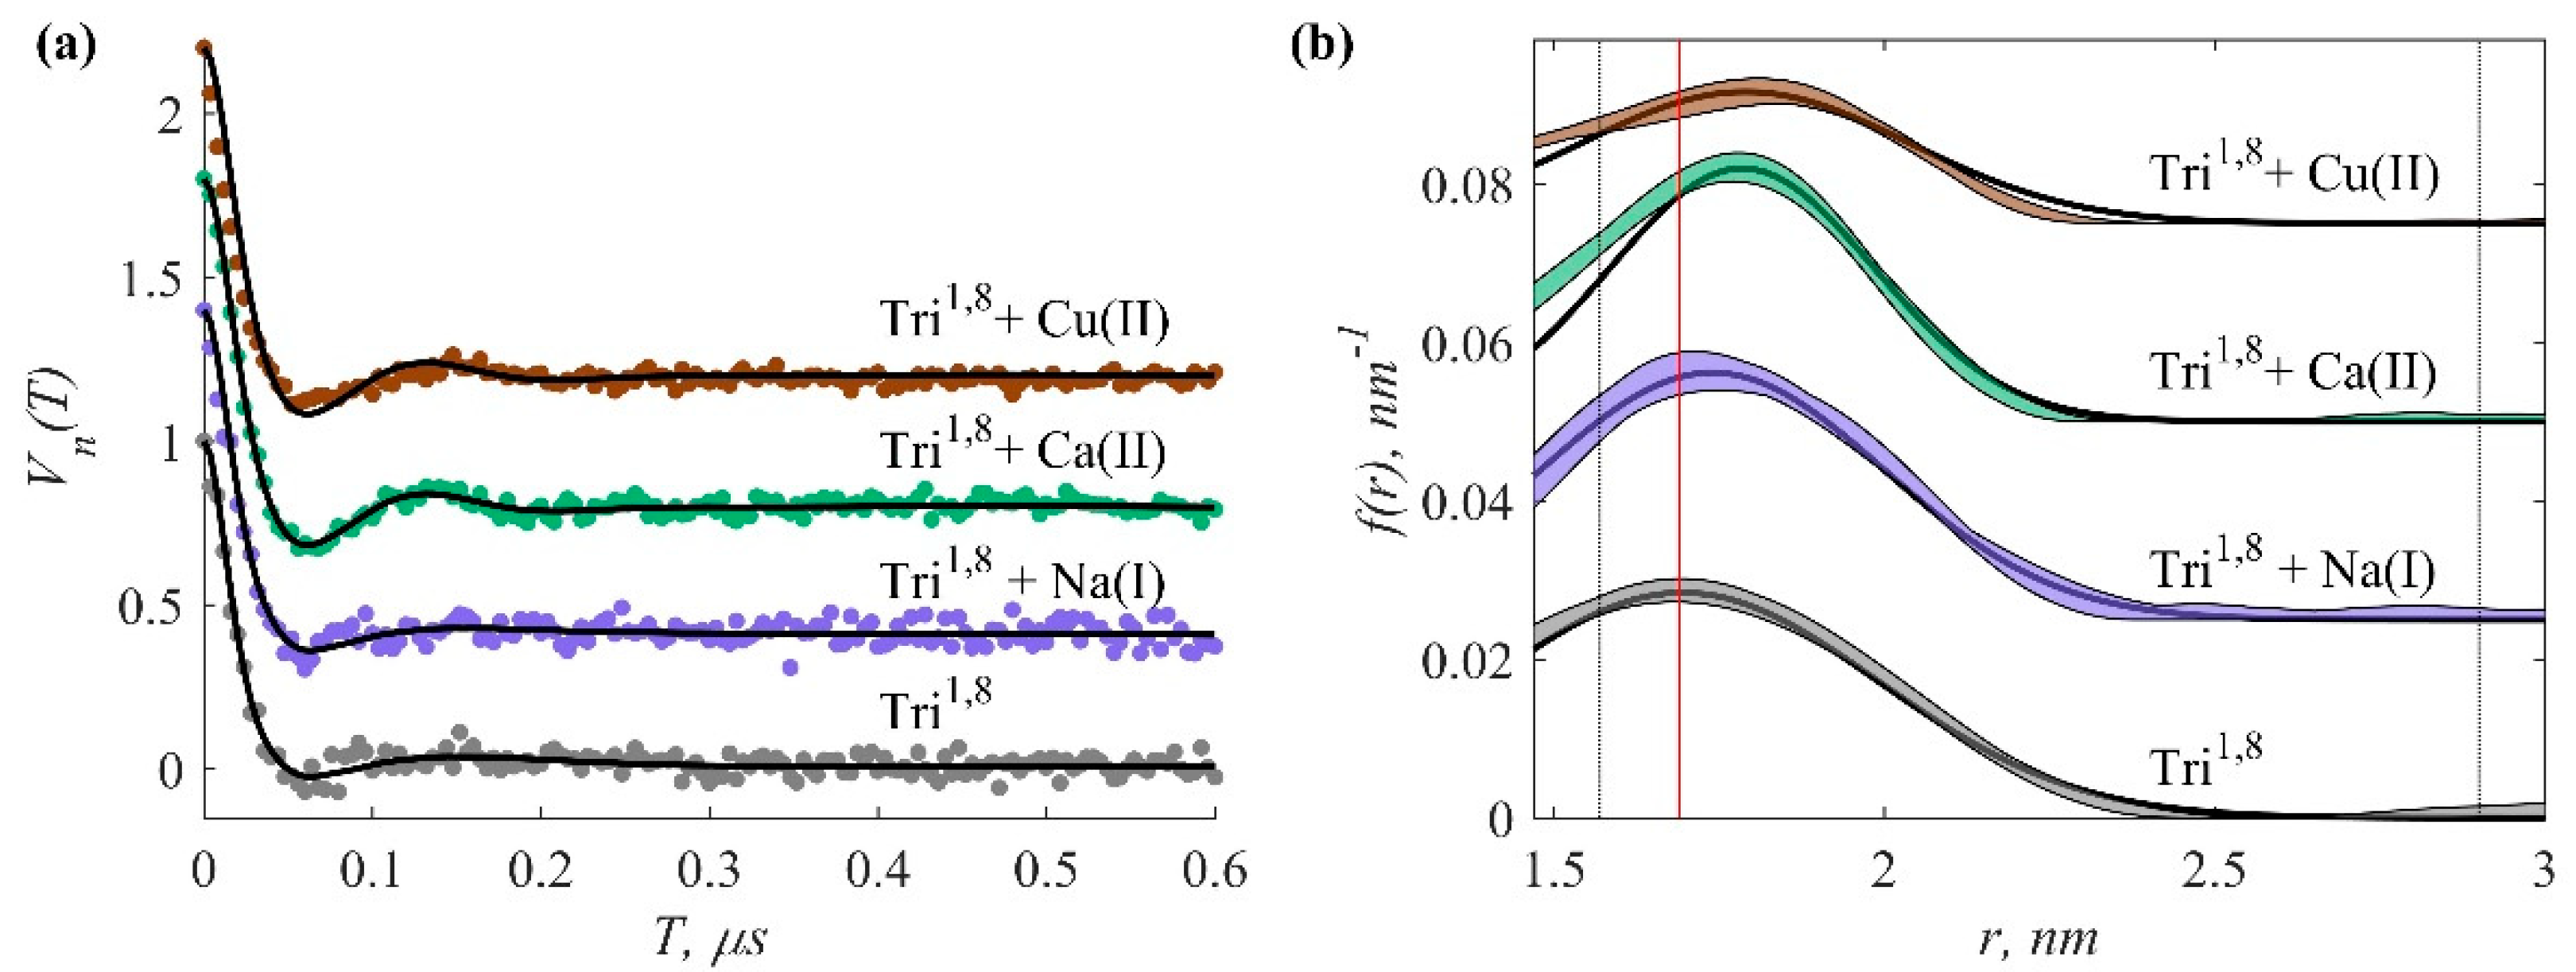
3.3. Pulse EPR Data
4. Conclusions
Supplementary Materials
Author Contributions
Funding
Institutional Review Board Statement
Informed Consent Statement
Data Availability Statement
Acknowledgments
Conflicts of Interest
References
- Zasloff, M. Antimicrobial peptides of multicellular organisms. Nature 2002, 415, 389–395. [Google Scholar] [CrossRef]
- Bechinger, B.; Lohner, K. Detergent-like actions of linear amphipathic cationic antimicrobial peptides. Biochim. Biophys. Acta BBA Biomembr. 2006, 1758, 1529–1539. [Google Scholar] [CrossRef]
- Jenssen, H.; Hamill, P.; Hancock, R.E. Peptide antimicrobial agents. Clin. Microbiol. Rev. 2006, 19, 491–511. [Google Scholar] [CrossRef]
- Ashkenasy, G.; Ghadiri, M.R. Boolean logic functions of a synthetic peptide network. J. Am. Chem. Soc. 2004, 126, 11140–11141. [Google Scholar] [CrossRef]
- Mejáre, M.; Bülow, L. Metal-binding proteins and peptides in bioremediation and phytoremediation of heavy metals. Trends Biotechnol. 2001, 19, 67–73. [Google Scholar] [CrossRef]
- Chow, E.; Gooding, J.J. Peptide modified electrodes as electrochemical metal ion sensors. Electroanalysis 2006, 18, 1437–1448. [Google Scholar] [CrossRef]
- Knerr, P.J.; Branco, M.C.; Nagarkar, R.; Pochan, D.J.; Schneider, J.P. Heavy metal ion hydrogelation of a self-assembling peptide via cysteinyl chelation. J. Mater. Chem. 2012, 22, 1352–1357. [Google Scholar] [CrossRef]
- Zegota, M.M.; Müller, M.A.; Lantzberg, B.; Kizilsavas, G.; Coelho, J.A.S.; Moscariello, P.; Martínez-Negro, M.; Morsbach, S.; Gois, P.M.P.; Wagner, M.; et al. Dual Stimuli-Responsive Dynamic Covalent Peptide Tags: Toward Sequence-Controlled Release in Tumor-like Microenvironments. J. Am. Chem. Soc. 2021, 143, 17047–17058. [Google Scholar] [CrossRef]
- Löwik, D.W.P.M.; Leunissen, E.H.P.; van den Heuvel, M.; Hansen, M.B.; van Hest, J.C.M. Stimulus responsive peptide based materials. Chem. Soc. Rev. 2010, 39, 3394–3412. [Google Scholar] [CrossRef] [PubMed]
- Tertis, M.; Hosu, O.; Feier, B.; Cernat, A.; Florea, A.; Cristea, C. Electrochemical Peptide-Based Sensors for Foodborne Pathogens Detection. Molecules 2021, 26, 3200. [Google Scholar] [CrossRef]
- Ronda, L.; Tonelli, A.; Sogne, E.; Autiero, I.; Spyrakis, F.; Pellegrino, S.; Abbiati, G.; Maffioli, E.; Schulte, C.; Piano, R.; et al. Rational Design of a User-Friendly Aptamer/Peptide-Based Device for the Detection of Staphylococcus aureus. Sensors 2020, 20, 4977. [Google Scholar] [CrossRef]
- Shah, A.; Malik, M.S.; Khan, G.S.; Nosheen, E.; Iftikhar, F.J.; Khan, F.A.; Shukla, S.S.; Akhter, M.S.; Kraatz, H.-B.; Aminabhavi, T.M. Stimuli-responsive peptide-based biomaterials as drug delivery systems. Chem. Eng. J. 2018, 353, 559–583. [Google Scholar] [CrossRef]
- Mart, R.J.; Osborne, R.D.; Stevens, M.M.; Ulijn, R.V. Peptide-based stimuli-responsive biomaterials. Soft Matter 2006, 2, 822–835. [Google Scholar] [CrossRef]
- Liu, G.; Lovell, J.F.; Zhang, L.; Zhang, Y. Stimulus-Responsive Nanomedicines for Disease Diagnosis and Treatment. Int. J. Mol. Sci. 2020, 21, 6380. [Google Scholar] [CrossRef]
- Lee, D.; Rejinold, N.S.; Jeong, S.D.; Kim, Y.-C. Stimuli-Responsive Polypeptides for Biomedical Applications. Polymers 2018, 10, 830. [Google Scholar] [CrossRef]
- La Manna, S.; Di Natale, C.; Onesto, V.; Marasco, D. Self-Assembling Peptides: From Design to Biomedical Applications. Int. J. Mol. Sci. 2021, 22, 12662. [Google Scholar] [CrossRef]
- Arul, A.; Sivagnanam, S.; Dey, A.; Mukherjee, O.; Ghosh, S.; Das, P. The design and development of short peptide-based novel smart materials to prevent fouling by the formation of non-toxic and biocompatible coatings. RSC Adv. 2020, 10, 13420–13429. [Google Scholar] [CrossRef]
- Kubitzky, S.; Venanzi, M.; Biondi, B.; Lettieri, R.; De Zotti, M.; Gatto, E. A pH-Induced Reversible Conformational Switch Able to Control the Photocurrent Efficiency in a Peptide Supramolecular System. Chem. Eur. J. 2021, 27, 2810–2817. [Google Scholar] [CrossRef]
- Cerpa, R.; Cohen, F.E.; Kuntz, I.D. Conformational switching in designed peptides: The helix/sheet transition. Fold. Des. 1996, 1, 91–101. [Google Scholar] [CrossRef]
- Zuber, P.K.; Schweimer, K.; Rösch, P.; Artsimovitch, I.; Knauer, S.H. Reversible fold-switching controls the functional cycle of the antitermination factor RfaH. Nat. Commun. 2019, 10, 702. [Google Scholar] [CrossRef] [PubMed]
- Selegård, R.; Aronsson, C.; Brommesson, C.; Dånmark, S.; Aili, D. Folding driven self-assembly of a stimuli-responsive peptide-hyaluronan hybrid hydrogel. Sci. Rep. 2017, 7, 7013. [Google Scholar] [CrossRef] [PubMed]
- Mueller, C.; Grossmann, T.N. Coiled-Coil Peptide Beacon: A Tunable Conformational Switch for Protein Detection. Angew. Chem. Int. Ed. 2018, 57, 17079–17083. [Google Scholar] [CrossRef]
- Chen, Y.; Cruz-Chu, E.R.; Woodard, J.C.; Gartia, M.R.; Schulten, K.; Liu, L. Electrically Induced Conformational Change of Peptides on Metallic Nanosurfaces. ACS Nano 2012, 6, 8847–8856. [Google Scholar] [CrossRef]
- De Zotti, M.; Syryamina, V.N.; Hussain, R.; Longo, E.; Siligardi, G.; Dzuba, S.; Stella, L.; Formaggio, F. A Temperature-Driven, Reversible, Helical-Handedness Inversion in Peptaibol Analogues Tuned by the C-Terminal Capping Moiety. ChemBioChem 2019, 20, 2125–2132. [Google Scholar] [CrossRef] [PubMed]
- Meron, S.; Shenberger, Y.; Ruthstein, S. The Advantages of EPR Spectroscopy in Exploring Diamagnetic Metal Ion Binding and Transfer Mechanisms in Biological Systems. Magnetochemistry 2022, 8, 3. [Google Scholar] [CrossRef]
- Shults, M.D.; Pearce, D.A.; Imperiali, B. Modular and tunable chemosensor scaffold for divalent zinc. J. Am. Chem. Soc. 2003, 125, 10591–10597. [Google Scholar] [CrossRef] [PubMed]
- Abu-Ali, H.; Nabok, A.; Smith, T.J. Development of novel and highly specific ssDNA-aptamer-based electrochemical biosensor for rapid detection of mercury (II) and lead (II) ions in water. Chemosensors 2019, 7, 27. [Google Scholar] [CrossRef]
- Coskun, A.; Deniz, E.; Akkaya, E.U. Effective PET and ICT switching of boradiazaindacene emission: A unimolecular, emission-mode, molecular half-subtractor with reconfigurable logic gates. Org. Lett. 2005, 7, 5187–5189. [Google Scholar] [CrossRef]
- Zou, R.; Wang, Q.; Wu, J.; Wu, J.; Schmuck, C.; Tian, H. Peptide self-assembly triggered by metal ions. Chem. Soc. Rev. 2015, 44, 5200–5219. [Google Scholar] [CrossRef]
- Johnson, R.A.; Manley, O.M.; Spuches, A.M.; Grossoehme, N.E. Dissecting ITC data of metal ions binding to ligands and proteins. Biochim. Biophys. Acta Gen. Subj. 2016, 1860, 892–901. [Google Scholar] [CrossRef]
- Dawson, W.M.; Lang, E.J.M.; Rhys, G.G.; Shelley, K.L.; Williams, C.; Brady, R.L.; Crump, M.P.; Mulholland, A.J.; Woolfson, D.N. Structural resolution of switchable states of a de novo peptide assembly. Nat. Commun. 2021, 12, 1530. [Google Scholar] [CrossRef]
- Liu, Z.; Chen, S.; Qiao, F.; Zhang, X. Interaction of peptide backbones and transition metal ions: 1. an IM-MS and DFT study of the binding pattern, structure and fragmentation of Pd(II)/Ni(II)-Polyalanine complexes. Int. J. Mass Spectrom. 2019, 438, 87–96. [Google Scholar] [CrossRef]
- Venanzi, M.; Bocchinfuso, G.; Gatto, E.; Palleschi, A.; Stella, L.; Formaggio, F.; Toniolo, C. Metal Binding Properties of Fluorescent Analogues of Trichogin GA IV: A Conformational Study by Time-Resolved Spectroscopy and Molecular Mechanics Investigations. ChemBioChem 2009, 10, 91–97. [Google Scholar] [CrossRef] [PubMed]
- Gatto, E.; Palleschi, M.E.; Zangrilli, B.; De Zotti, M.; Di Napoli, B.; Palleschi, A.; Mazzuca, C.; Formaggio, F.; Toniolo, C.; Venanzi, M. The several facets of Trichogin GA IV: High affinity Tb (III) binding properties. A spectroscopic and molecular dynamics simulation study. Pept. Sci. 2018, 110, e24081. [Google Scholar] [CrossRef]
- She, F.; Teng, P.; Peguero-Tejada, A.; Wang, M.; Ma, N.; Odom, T.; Zhou, M.; Gjonaj, E.; Wojtas, L.; van der Vaart, A.; et al. De Novo Left-Handed Synthetic Peptidomimetic Foldamers. Angew. Chem. 2018, 130, 10064–10068. [Google Scholar] [CrossRef]
- Worswick, S.G.; Spencer, J.A.; Jeschke, G.; Kuprov, I. Deep neural network processing of DEER data. Sci. Adv. 2018, 4, eaat5218. [Google Scholar] [CrossRef]
- Milov, A.D.; Salikhov, K.M.; Shirov, M.D. Application of ELDOR in electron-spin echo for paramagnetic center space distribution in solids. Fizika Tverdogo Tela 1981, 23, 975–982. [Google Scholar]
- Milov, A.D.; Maryasov, A.G.; Tsvetkov, Y.D. Pulsed electron double resonance (PELDOR) and its applications in free-radicals research. Appl. Magn. Reson. 1998, 15, 107–143. [Google Scholar] [CrossRef]
- Jeschke, G. Determination of the nanostructure of polymer materials by electron paramagnetic resonance spectroscopy. Macromol. Rapid Commun. 2002, 23, 227–246. [Google Scholar] [CrossRef]
- Millhauser, G.L. Selective placement of electron spin resonance spin labels: New structural methods for peptides and proteins. Trends Biochem. Sci. 1992, 17, 448–452. [Google Scholar] [CrossRef]
- Hubbell, W.L.; Altenbach, C. Investigation of structure and dynamics in membrane proteins using site-directed spin labeling. Curr. Opin. Struct. Biol. 1994, 4, 566–573. [Google Scholar] [CrossRef]
- Tkach, I.; Diederichsen, U.; Bennati, M. Studies of transmembrane peptides by pulse dipolar spectroscopy with semi-rigid TOPP spin labels. Eur. Biophys. J. 2021, 50, 143–157. [Google Scholar] [CrossRef] [PubMed]
- Chiang, Y.-W.; Borbat, P.P.; Freed, J.H. The determination of pair distance distributions by pulsed ESR using Tikhonov regularization. J. Magn. Reson. 2005, 172, 279–295. [Google Scholar] [CrossRef]
- Milov, A.D.; Tsvetkov, Y.D.; Raap, J.; De Zotti, M.; Formaggio, F.; Toniolo, C. Conformation, self-aggregation, and membrane interaction of peptaibols as studied by pulsed electron double resonance spectroscopy. Pept. Sci. 2016, 106, 6–24. [Google Scholar] [CrossRef]
- Faller, P.; Hureau, C.; Dorlet, P.; Hellwig, P.; Coppel, Y.; Collin, F.; Alies, B. Methods and techniques to study the bioinorganic chemistry of metal–peptide complexes linked to neurodegenerative diseases. Coord. Chem. Rev. 2012, 256, 2381–2396. [Google Scholar] [CrossRef]
- Shenberger, Y.; Gottlieb, H.E.; Ruthstein, S. EPR and NMR spectroscopies provide input on the coordination of Cu (I) and Ag (I) to a disordered methionine segment. JBIC J. Biol. Inorg. Chem. 2015, 20, 719–727. [Google Scholar] [CrossRef]
- Shenberger, Y.; Yarmiayev, V.; Ruthstein, S. Exploring the interaction between the human copper transporter, CTR1, c-terminal domain and a methionine motif in the presence of Cu (I) and Ag (I) ions, using EPR spectroscopy. Mol. Phys. 2013, 111, 2980–2991. [Google Scholar] [CrossRef]
- Biondi, B.; Syryamina, V.; Rocchio, G.; Barbon, A.; Formaggio, F.; Toniolo, C.; Raap, J.; Dzuba, S.A. Is Cys(MTSL) the Best α-Amino Acid Residue to Electron Spin Labeling Helical Peptide Molecules? ACS Omega 2022. [Google Scholar] [CrossRef]
- Venanzi, M.; Gatto, E.; Bocchinfuso, G.; Palleschi, A.; Stella, L.; Formaggio, F.; Toniolo, C. Dynamics of Formation of a Helix–Turn–Helix Structure in a Membrane-Active Peptide: A Time-Resolved Spectroscopic Study. ChemBioChem 2006, 7, 43–45. [Google Scholar] [CrossRef] [PubMed]
- De Zotti, M.; Biondi, B.; Peggion, C.; Formaggio, F.; Park, Y.; Hahm, K.S.; Toniolo, C. Trichogin GA IV: A versatile template for the synthesis of novel peptaibiotics. Org. Biomol. Chem. 2012, 10, 1285–1299. [Google Scholar] [CrossRef]
- De Zotti, M.; Sella, L.; Bolzonello, A.; Gabbatore, L.; Peggion, C.; Bortolotto, A.; Elmaghraby, I.; Tundo, S.; Favaron, F. Targeted Amino Acid Substitutions in a Trichoderma Peptaibol Confer Activity against Fungal Plant Pathogens and Protect Host Tissues from Botrytis cinerea Infection. Int. J. Mol. Sci. 2020, 21, 7521. [Google Scholar] [CrossRef]
- Syryamina, V.N.; Matveeva, A.G.; Vasiliev, Y.V.; Savitsky, A.; Grishin, Y.A. Improving B1 field homogeneity in dielectric tube resonators for EPR spectroscopy via controlled shaping of the dielectric insert. J. Magn. Reson. 2020, 311, 106685. [Google Scholar] [CrossRef]
- Matveeva, A.G.; Syryamina, V.N.; Nekrasov, V.M.; Bowman, M.K. Non-uniform sampling in pulse dipolar spectroscopy by EPR: The redistribution of noise and the optimization of data acquisition. Phys. Chem. Chem. Phys. 2021, 23, 10335–10346. [Google Scholar] [CrossRef] [PubMed]
- Tsvetkov, Y.D.; Milov, A.D.; Maryasov, A.G. Pulsed electron–electron double resonance (PELDOR) as EPR spectroscopy in nanometre range. Russ. Chem. Rev. 2008, 77, 487. [Google Scholar] [CrossRef]
- Milov, A.D.; Grishin, Y.A.; Dzuba, S.A.; Tsvetkov, Y.D. Effect of pumping pulse duration on echo signal amplitude in Four-Pulse PELDOR. Appl. Magn. Reson. 2011, 41, 59–67. [Google Scholar] [CrossRef]
- Jeschke, G.; Polyhach, Y. Distance measurements on spin-labeled biomacromolecules by pulsed electron paramagnetic resonance. Phys. Chem. Chem. Phys. 2007, 9, 1895–1910. [Google Scholar] [CrossRef]
- Fajer, P.G.; Brown, L.; Song, L. Practical pulsed dipolar ESR (DEER). In ESR Spectroscopy in Membrane Biophysics; Springer: Boston, MA, USA, 2007; pp. 95–128. [Google Scholar]
- Schiemann, O.; Heubach, C.A.; Abdullin, D.; Ackermann, K.; Azarkh, M.; Bagryanskaya, E.G.; Drescher, M.; Endeward, B.; Freed, J.H.; Galazzo, L.; et al. Benchmark test and guidelines for DEER/PELDOR experiments on nitroxide-labeled biomolecules. J. Am. Chem. Soc. 2021, 143, 17875–17890. [Google Scholar] [CrossRef] [PubMed]
- Stoll, S.; Schweiger, A. EasySpin, a comprehensive software package for spectral simulation and analysis in EPR. J. Magn. Reson. 2006, 178, 42–55. [Google Scholar] [CrossRef]
- Matveeva, A.G.; Yushkova, Y.V.; Morozov, S.V.; Grygor’ev, I.A.; Dzuba, S.A. Multi-Gaussian Monte Carlo analysis of PELDOR data in the frequency domain. Zeitschrift für Physikalische Chemie 2017, 231, 671–688. [Google Scholar] [CrossRef]
- Pannier, M.; Schädler, V.; Schöps, M.; Wiesner, U.; Jeschke, G.; Spiess, H.W. Determination of ion cluster sizes and cluster-to-cluster distances in ionomers by four-pulse double electron electron resonance spectroscopy. Macromolecules 2000, 33, 7812–7818. [Google Scholar] [CrossRef]
- Jeschke, G.; Chechik, V.; Ionita, P.; Godt, A.; Zimmermann, H.; Banham, J.; Timmel, C.R.; Hilger, D.; Jung, H. DeerAnalysis2006—A comprehensive software package for analyzing pulsed ELDOR data. Appl. Magn. Reson. 2006, 30, 473–498. [Google Scholar] [CrossRef]
- Brandon, S.; Beth, A.H.; Hustedt, E.J. The global analysis of DEER data. J. Magn. Reson. 2012, 218, 93–104. [Google Scholar] [CrossRef]
- Syryamina, V.N.; De Zotti, M.; Toniolo, C.; Formaggio, F.; Dzuba, S.A. Alamethicin self-assembling in lipid membranes: Concentration dependence from pulsed EPR of spin labels. Phys. Chem. Chem. Phys. 2018, 20, 3592–3601. [Google Scholar] [CrossRef]
- Kuznetsova, A.A.; Matveeva, A.G.; Milov, A.D.; Vorobjev, Y.N.; Dzuba, S.A.; Fedorova, O.S.; Kuznetsov, N.A. Substrate specificity of human apurinic/apyrimidinic endonuclease APE1 in the nucleotide incision repair pathway. Nucleic Acids Res. 2018, 46, 11454–11465. [Google Scholar] [CrossRef] [PubMed]
- Edwards, T.H.; Stoll, S. A Bayesian approach to quantifying uncertainty from experimental noise in DEER spectroscopy. J. Magn. Reson. 2016, 270, 87–97. [Google Scholar] [CrossRef] [PubMed]
- Peisach, J.; Blumberg, W.E. Structural implications derived from the analysis of electron paramagnetic resonance spectra of natural and artificial copper proteins. Arch. Biochem. Biophys. 1974, 165, 691–708. [Google Scholar] [CrossRef]
- Abdullin, D.; Schiemann, O. Pulsed Dipolar EPR Spectroscopy and Metal Ions: Methodology and Biological Applications. ChemPlusChem 2020, 85, 353–372. [Google Scholar] [CrossRef]
- Salikhov, K.M.; Khairuzhdinov, I.T.; Zaripov, R.B. Three-pulse ELDOR theory revisited. Appl. Magn. Reson. 2014, 45, 573–619. [Google Scholar] [CrossRef]
- Jeschke, G.; Panek, G.; Godt, A.; Bender, A.; Paulsen, H. Data analysis procedures for pulse ELDOR measurements of broad distance distributions. Appl. Magn. Reson. 2004, 26, 223–244. [Google Scholar] [CrossRef]
- Chiang, Y.W.; Borbat, P.P.; Freed, J.H. Maximum entropy: A complement to Tikhonov regularization for determination of pair distance distributions by pulsed ESR. J. Magn. Reson. 2005, 177, 184–196. [Google Scholar] [CrossRef] [PubMed]
- Dzuba, S.A. The determination of pair-distance distribution by double electron–electron resonance: Regularization by the length of distance discretization with Monte Carlo calculations. J. Magn. Reson. 2016, 269, 113–119. [Google Scholar] [CrossRef] [PubMed]
- Open Source. Avogadro. Available online: https://avogadro.cc/ (accessed on 10 January 2022).
- Figgis, B.N.; Hitchman, M.A. Ligand Field Theory and Its Applications; Wiley-Vch: New York, NY, USA, 2000; p. 158. [Google Scholar]
- Shannon, R.D. Revised effective ionic radii and systematic studies of interatomic distances in halides and chalcogenides. Acta Crystallogr. Sect. A Cryst. Phys. Diffr. Theor. Gen. Crystallogr. 1976, 32, 751–767. [Google Scholar] [CrossRef]
- Harding, M.M. Geometry of metal–ligand interactions in proteins. Acta Crystallogr. Sect. D Biol. Crystallogr. 2001, 57, 401–411. [Google Scholar] [CrossRef]
- Harding, M.M. The architecture of metal coordination groups in proteins. Acta Crystallogr. Sect. D Biol. Crystallogr. 2004, 60, 849–859. [Google Scholar] [CrossRef]
- Harding, M.M. Metal–ligand geometry relevant to proteins and in proteins: Sodium and potassium. Acta Crystallogr. Sect. D Biol. Crystallogr. 2002, 58, 872–874. [Google Scholar] [CrossRef] [PubMed]
- Dudev, T.; Lim, C. Competition among metal ions for protein binding sites: Determinants of metal ion selectivity in proteins. Chem. Rev. 2014, 114, 538–556. [Google Scholar] [CrossRef]
- Kropacheva, T.N.; Raap, J. Ion transport across a phospholipid membrane mediated by the peptide trichogin GA IV. Biochim. Biophys. Acta BBA Biomembr. 2002, 1567, 193–203. [Google Scholar] [CrossRef][Green Version]


| Sample | <r> ± Standard Deviation, nm | δr ± Standard Deviation, nm |
|---|---|---|
| Tri1,8 | 1.695 a 1.69 ± 0.02 b | 0.296 a 0.25 ± 0.03 b |
| Tri1,8 + Na(I) | 1.74 a 1.72 ± 0.02 b | 0.26 a 0.25 ± 0.02 b |
| Tri1,8 + Ca(II) | 1.785 a 1.81 ± v0.02 b | 0.2 a 0.17 ± 0.02 b |
| Tri1,8 + Cu(II) | 1.79 a 1.78 ± 0.02 b | 0.25 a 0.22 ± 0.02 b |
Publisher’s Note: MDPI stays neutral with regard to jurisdictional claims in published maps and institutional affiliations. |
© 2022 by the authors. Licensee MDPI, Basel, Switzerland. This article is an open access article distributed under the terms and conditions of the Creative Commons Attribution (CC BY) license (https://creativecommons.org/licenses/by/4.0/).
Share and Cite
Syryamina, V.N.; Siano, A.S.; Formaggio, F.; De Zotti, M. A Peptide-Based Trap for Metal Ions Studied by Electron Paramagnetic Resonance. Chemosensors 2022, 10, 71. https://doi.org/10.3390/chemosensors10020071
Syryamina VN, Siano AS, Formaggio F, De Zotti M. A Peptide-Based Trap for Metal Ions Studied by Electron Paramagnetic Resonance. Chemosensors. 2022; 10(2):71. https://doi.org/10.3390/chemosensors10020071
Chicago/Turabian StyleSyryamina, Victoria N., Alvaro S. Siano, Fernando Formaggio, and Marta De Zotti. 2022. "A Peptide-Based Trap for Metal Ions Studied by Electron Paramagnetic Resonance" Chemosensors 10, no. 2: 71. https://doi.org/10.3390/chemosensors10020071
APA StyleSyryamina, V. N., Siano, A. S., Formaggio, F., & De Zotti, M. (2022). A Peptide-Based Trap for Metal Ions Studied by Electron Paramagnetic Resonance. Chemosensors, 10(2), 71. https://doi.org/10.3390/chemosensors10020071