Article

Electrochemical Sensor for the Direct Determination of Warfarin in Blood

1
Department of Chemistry, Faculty of Science, Lorestan University, Khoramabad 68137-17133, Iran
2
Department of Chemistry, University of Toronto, Toronto, ON M5S 3H6, Canada
3
Toxicology Research Center, Medical Basic Sciences Institute, Ahvaz Jundishapur University of Medical Sciences, Ahvaz 61357-15794, Iran
4
Medicinal Chemistry Department, Faculty of Pharmacy, Ahvaz Jundishapur University of Medical Sciences, Ahvaz 61357-33184, Iran
*
Authors to whom correspondence should be addressed.
Chemosensors 2022, 10(2), 44; https://doi.org/10.3390/chemosensors10020044
Submission received: 17 December 2021 / Revised: 16 January 2022 / Accepted: 20 January 2022 / Published: 25 January 2022
(This article belongs to the Section Electrochemical Devices and Sensors)

Abstract

:
Detecting warfarin levels in the blood is of critical importance in anticoagulant therapy because it is imperative that the concentration of the drug is maintained within a specific range. In this paper, we present a proof-of-concept of a novel sensing device based on ion-selective electrode (ISE) technology for the direct detection of warfarin in blood samples without any sample pretreatment. We used tetradodecylammonium chloride (TDDA) as an ion-exchanger to fabricate an ion-selective membrane. The ISE we developed showed high sensitivity, with a limit of detection (LOD) of 1.25 × 10⁻⁷ M and 1.4 × 10⁻⁵ M for detecting warfarin in buffer and blood, respectively. The sensor also exhibited promising selectivity in identifying the presence of various ions including chloride and salicylate, the most abundant ions in blood with a calibration slope of 58.8 mV/dec. We envision combining the ISE with a microfluidic system and a simple potentiometer to produce a sensitive, selective, and portable point-of-care testing device for monitoring the level of warfarin in patients’ blood during treatment.

1. Introduction

Prescription drugs play an increasing role in everyday life. This has led the healthcare industry to seek ways to empower patients to be more actively involved in the management and monitoring of their health [1,2]. One of the methods by which patients are able to oversee their health is by monitoring their blood work (including for drug dosage) using point-of-care testing (POCT) devices. An example of this is the universal use of personal glucose meters by patients suffering from diabetes [3,4].
A number of anticoagulant and antiplatelet drugs are employed routinely in the treatment of medical conditions such as blood vessel disease, atrial fibrillation, stroke, pulmonary embolism, pulmonary hypertension, and deep vein thrombosis [5]. Examples of such drugs in common use are Eliquis (apixaban), Pradaxa (dabigatran), Coumadin (warfarin), and Plavix (clopidogrel). Despite the advent of newer drugs, warfarin (C19H15NaO4 (Figure 1)), which is composed of a racemic mixture of two active enantiomers, is still dispensed to millions of patients [6,7,8]. It is used to decrease blood coagulation by acting as a vitamin K antagonist [9]. The drug inhibits the enzyme vitamin epoxide reductase, which catalyzes the carboxylation of various vitamin-K-dependent coagulation factors. As is the case with a number of anticoagulants, dispensed warfarin doses should be carefully managed, because high doses can cause severe headaches, stomach pain, and life-threatening bleeding [10]. Accordingly, monitoring the concentration of warfarin in patients’ blood is critical in avoiding overdose issues [7,11]. The reference methodology for warfarin detection is based on the effect of the drug on blood prothrombin time, which is the time it takes for blood clotting to occur (normally 11–14 s). Clinical laboratories use the international normalized ratio (INR) to monitor the required dose of warfarin:
INR = (PTtest/PTnormal) ISI
where INR is the international normalized ratio, PTtest is the tested prothrombin time, PTnormal is the normal prothrombin time, and ISI is the international sensitivity index. However, this protocol is unable to predict the concentration of free warfarin in a specific blood sample [12,13]. The warfarin therapeutic concentration is 2.0–5.0 μg mL−1 and patients treated with the anticoagulant at this level require close monitoring because the therapeutic index of this drug is narrowly constrained. Therefore, there is a clear need for an accurate, precise, and simple method that can determine the level of warfarin in blood in order to manage and tailor warfarin therapy for patients [14].
Various instrumental analytical techniques, including high-performance liquid chromatography with the use of various detectors [15,16,17], capillary electrophoresis [18], spectrophotometry [19], surface-enhanced Raman scattering [20], and luminescence spectrometry [21], have been applied for the determination of warfarin in blood, serum, and urine, although there is a noticeable dearth of measurements in whole blood. These techniques are time-consuming and often require extensive sample pretreatment. These factors have led to an interest in the use of sensor technology, which potentially offers rapid, direct, and inexpensive assays of warfarin in biological fluids. Optical devices are early examples of attempts to detect warfarin in biological fluids. A resonant mirror sensor was used to measure warfarin via its interaction with human serum albumin bound to the device surface, with the signal being associated with a change in the refractive index [22]. Unsurprisingly, surface plasmon spectroscopy has figured prominently in this area, such as the study by Fitzpatrick et al. [23], in which they determined the drug in a plasma ultrafiltrate via an immune-inhibition-based technique.
A number of electrochemical methods have also been developed to determine various drug concentrations in plasma and blood, which are mostly based on voltammetry [24,25] and potentiometry [26]. Different electrodes were fabricated to determine warfarin in commercial tablets, urine, or serum. Employing square wave anodic stripping voltammetry using a carbon paste electrode modified with magnetic Fe3O4 nanoparticles, a limit of detection (LOD) of 0.2 µM in buffer was achieved [25]. Yawari and Kaykhaii [24] reported an LOD of 1 nM for warfarin in buffer solution using differential pulse voltammetry with an activated screen-printed gold/Au nanoparticles/molecularly imprinted polymer electrode. However, direct determination of the drug in blood samples is challenging due to the interference of various moieties including the presence of interferents associated with non-specific adsorption or fouling such as proteins, cells, sodium chloride, and salicylate [27]. Although many of these methods have been reported for drug detection in general, only a modest number of papers addressed warfarin detection, and nearly all of the reported methods were not performed on whole blood. Shayesteh et al. reviewed electrochemical sensors for detecting warfarin and other drugs [28]. A potentiometric determination of warfarin based on ionophore poly (vinyl chloride) (PVC) membrane electrode was reported by Hassan et al. [26,29]. In their first study, they obtained an LOD of 17 µM for warfarin in drug samples using a PVC ferroin-based membrane [29]. Using iron(II)-phthalocyanine (Pc) as a molecular recognition reagent, they were able to improve the sensitivity of their sensor and reported an LOD of 2 µM with a mean average recovery of 99.7% of warfarin in drug samples [26]. However, they did not study the interference effect of salicylate and chloride in warfarin detection and, therefore, the performance of the reported sensor with respect to blood samples was not evaluated. Hence, the application of electrochemistry, in this case, is limited to the determination of warfarin in pharmaceutical products. Gholivandj et al. [30] reported an assay of warfarin in milk, serum, and urine via the covalent binding of quantum dots onto carbon nanotubes and chitosan-modified glassy carbon electrodes. A limit of detection of 8.5 nM was claimed to be achievable, although it is not clear if this was the case for all fluids.
In this paper, we introduce a sensing device for the real-time monitoring of warfarin in a blood sample without any sample pretreatment. We developed an ion-selective electrode, based on an ion exchanger, which does not use ionophore for warfarin detection. The interference of chloride and salicylate in warfarin detection was investigated in order to mimic the assay of an actual blood sample. We describe a novel proof-of-concept for a POCT device capable of detecting warfarin in whole blood, which can be used to evaluate and manage the presence of the drug in terms of the therapeutic dose.

2. Materials and Methods

2.1. Reagents

High-molecular-weight poly (vinyl chloride) (PVC), tetradodecylammonium chloride (TDDA), (2-nitrophenyloctylether (o-NPOE), tetra-hydro-furan (THF), and warfarin were of analytical grade and purchased from Sigma-Aldrich (St. Louis, MO, USA). Ethanol, di-hydrogen potassium phosphate, hydrogen potassium phosphate, sodium chloride, boric acid, and other reagents were obtained from Merck (Darmstadt, Germany). Because the solubility of warfarin in distilled water is limited to 17 mgL−1, a stock solution of 1 × 10⁻² M in absolute ethanol was prepared and diluted to the desired concentration using 0.05 M phosphate buffer solution with a pH of 7.4. For investigating the effect of the pH on the potentiometric response of the sensor, a 1 mM warfarin solution was prepared in 0.04 M universal buffer with a pH range of 5–12.
To evaluate the performance of the developed sensor, warfarin was added to the blood samples. A blood sample without warfarin was used as a control experiment. Human blood was made available from a single source through the Golestal hospital biobank (Ahvaz, Iran). No individual donor was employed or associated with the research conducted in this paper.

2.2. Instrumentation

A single-junction Ag/AgCl, 3 M KCl (Model 6.0733.10 0, Metrohm AG, Ionenstrasse, Herisau, Switzerland) was used as the reference electrode. Electrode bodies (Oesch Sensor Technology, Sargans, Switzerland) were used to mount the polymeric membranes. Potentiometric measurements were determined by zero current potentiometry employing an Autolab PGSTAT302N (Metrohm Autolab, Utrecht, The Netherlands), which was managed by NOVA software (v 1.10). A Faraday cage was used to protect the system from undesired noise.

2.3. Preparation of PVC Membrane

Warfarin-selective PVC-based membranes were prepared in a conventional protocol, using a mass ratio of plasticizer and PVC (2:1). Predetermined TDDA, O-NPOE, and PVC were dissolved in THF. Then, the mixture was poured into a glass ring (20 mm ID) affixed onto a glass slide and the THF was evaporated overnight to form PVC-based membranes with a thickness of ca. 20 mm. This membrane was cut into circular pieces with 8 mm diameters, using a hole-puncher, and was conditioned in 10−3 M warfarin solution for 24 h. Finally, the membrane was mounted on an Ostec electrode body (Oesch Sensor Technology) and filled with an inner filling solution of 1 mM warfarin and 1 mM NaCl in 0.05 M phosphate buffer (pH = 7.4). The potential difference depended on the activity of warfarin ions in the solution and is reported as electromotive force (emf). The effect of warfarin pH solution on the potential response of the developed ion-selective electrode (ISE) was studied using 1 mM warfarin in 0.01 M universal buffer in a pH range of 5–12. This PVC-based membrane electrode was used to measure the warfarin levels in untreated blood.

3. Results and Discussion

The aim of this research was to provide the proof-of-concept for a POCT device for direct detection of warfarin in a whole-blood sample without the need for any pretreatment. For this purpose, we developed a novel ion-selective electrode (ISE) to be used as a selective and sensitive POCT device. Potentiometric ISEs have been applied to develop many analytical sensors for clinical applications. They consist of a reference electrode, ion-selective membrane, and voltmeter. The ion-selective membrane is the essential part of the ISE as the detection is based on the selective transportation of analyte from the sample to the inner solution. The potential difference across the membrane is measured by a stable reference electrode and is used to measure the concentration of the analyte. To develop the ISE for warfarin detection, we used a PVC-based membrane and tetradodecylammonium chloride (TDDA) as both an ion exchanger and an ionophore to provide a selective membrane with a thickness of 20 mm and a diameter of 8 mm, which was conditioned in 10−3 M warfarin solution for 24 h. A response time of less than 1 min was achieved after optimization. The sensing mechanism can be explained on the basis of electrostatic interaction and coordination of warfarin by TDDA. The interaction is due to the acid-base reaction of the acidic enol of warfarin (Figure 1) and the ammonium group of TDDA at pH 7.4. PVC is commonly used as a membrane to fabricate ISEs. Hassan et al. previously reported on the capability of PVC membrane to determine warfarin, using two different molecular recognition systems [26,29] In this study, we used the PVC plasticizer as a base for fabricating a selective membrane (see Section 2.3 for membrane preparation).
The selectivity of ISEs greatly depends on the membrane composition, and the optimization of the membrane composition is the most important aspect of ISE development. Therefore, we initially optimized the membrane composition and other parameters for warfarin detection in the whole-blood sample to enhance the sensitivity and selectivity of the sensor. A mass ratio of PVC to plasticizer (1:2) and various concentrations of anion exchanger (TDDA) were prepared to perform the potentiometric experiments (total weight of membrane cocktail was 200 mg). Our results indicated that while increasing the amount of TDDA from 1 to 100 mmol/kg led to an increase in the limit of detection from 10−8 to 10−5 M, the selectivity of the developed IES improved as a Nernstian slope of −59.1 mV/dec. This was achieved using 100 mmol/kg TDDA (see Table 1). Therefore, the membrane with TDDA 5 mmol/kg (M3) was chosen as an optimum membrane composition, which showed a Nernstian slope of −58.8 mV/dec and a limit of detection (LOD) of 10−7 M.
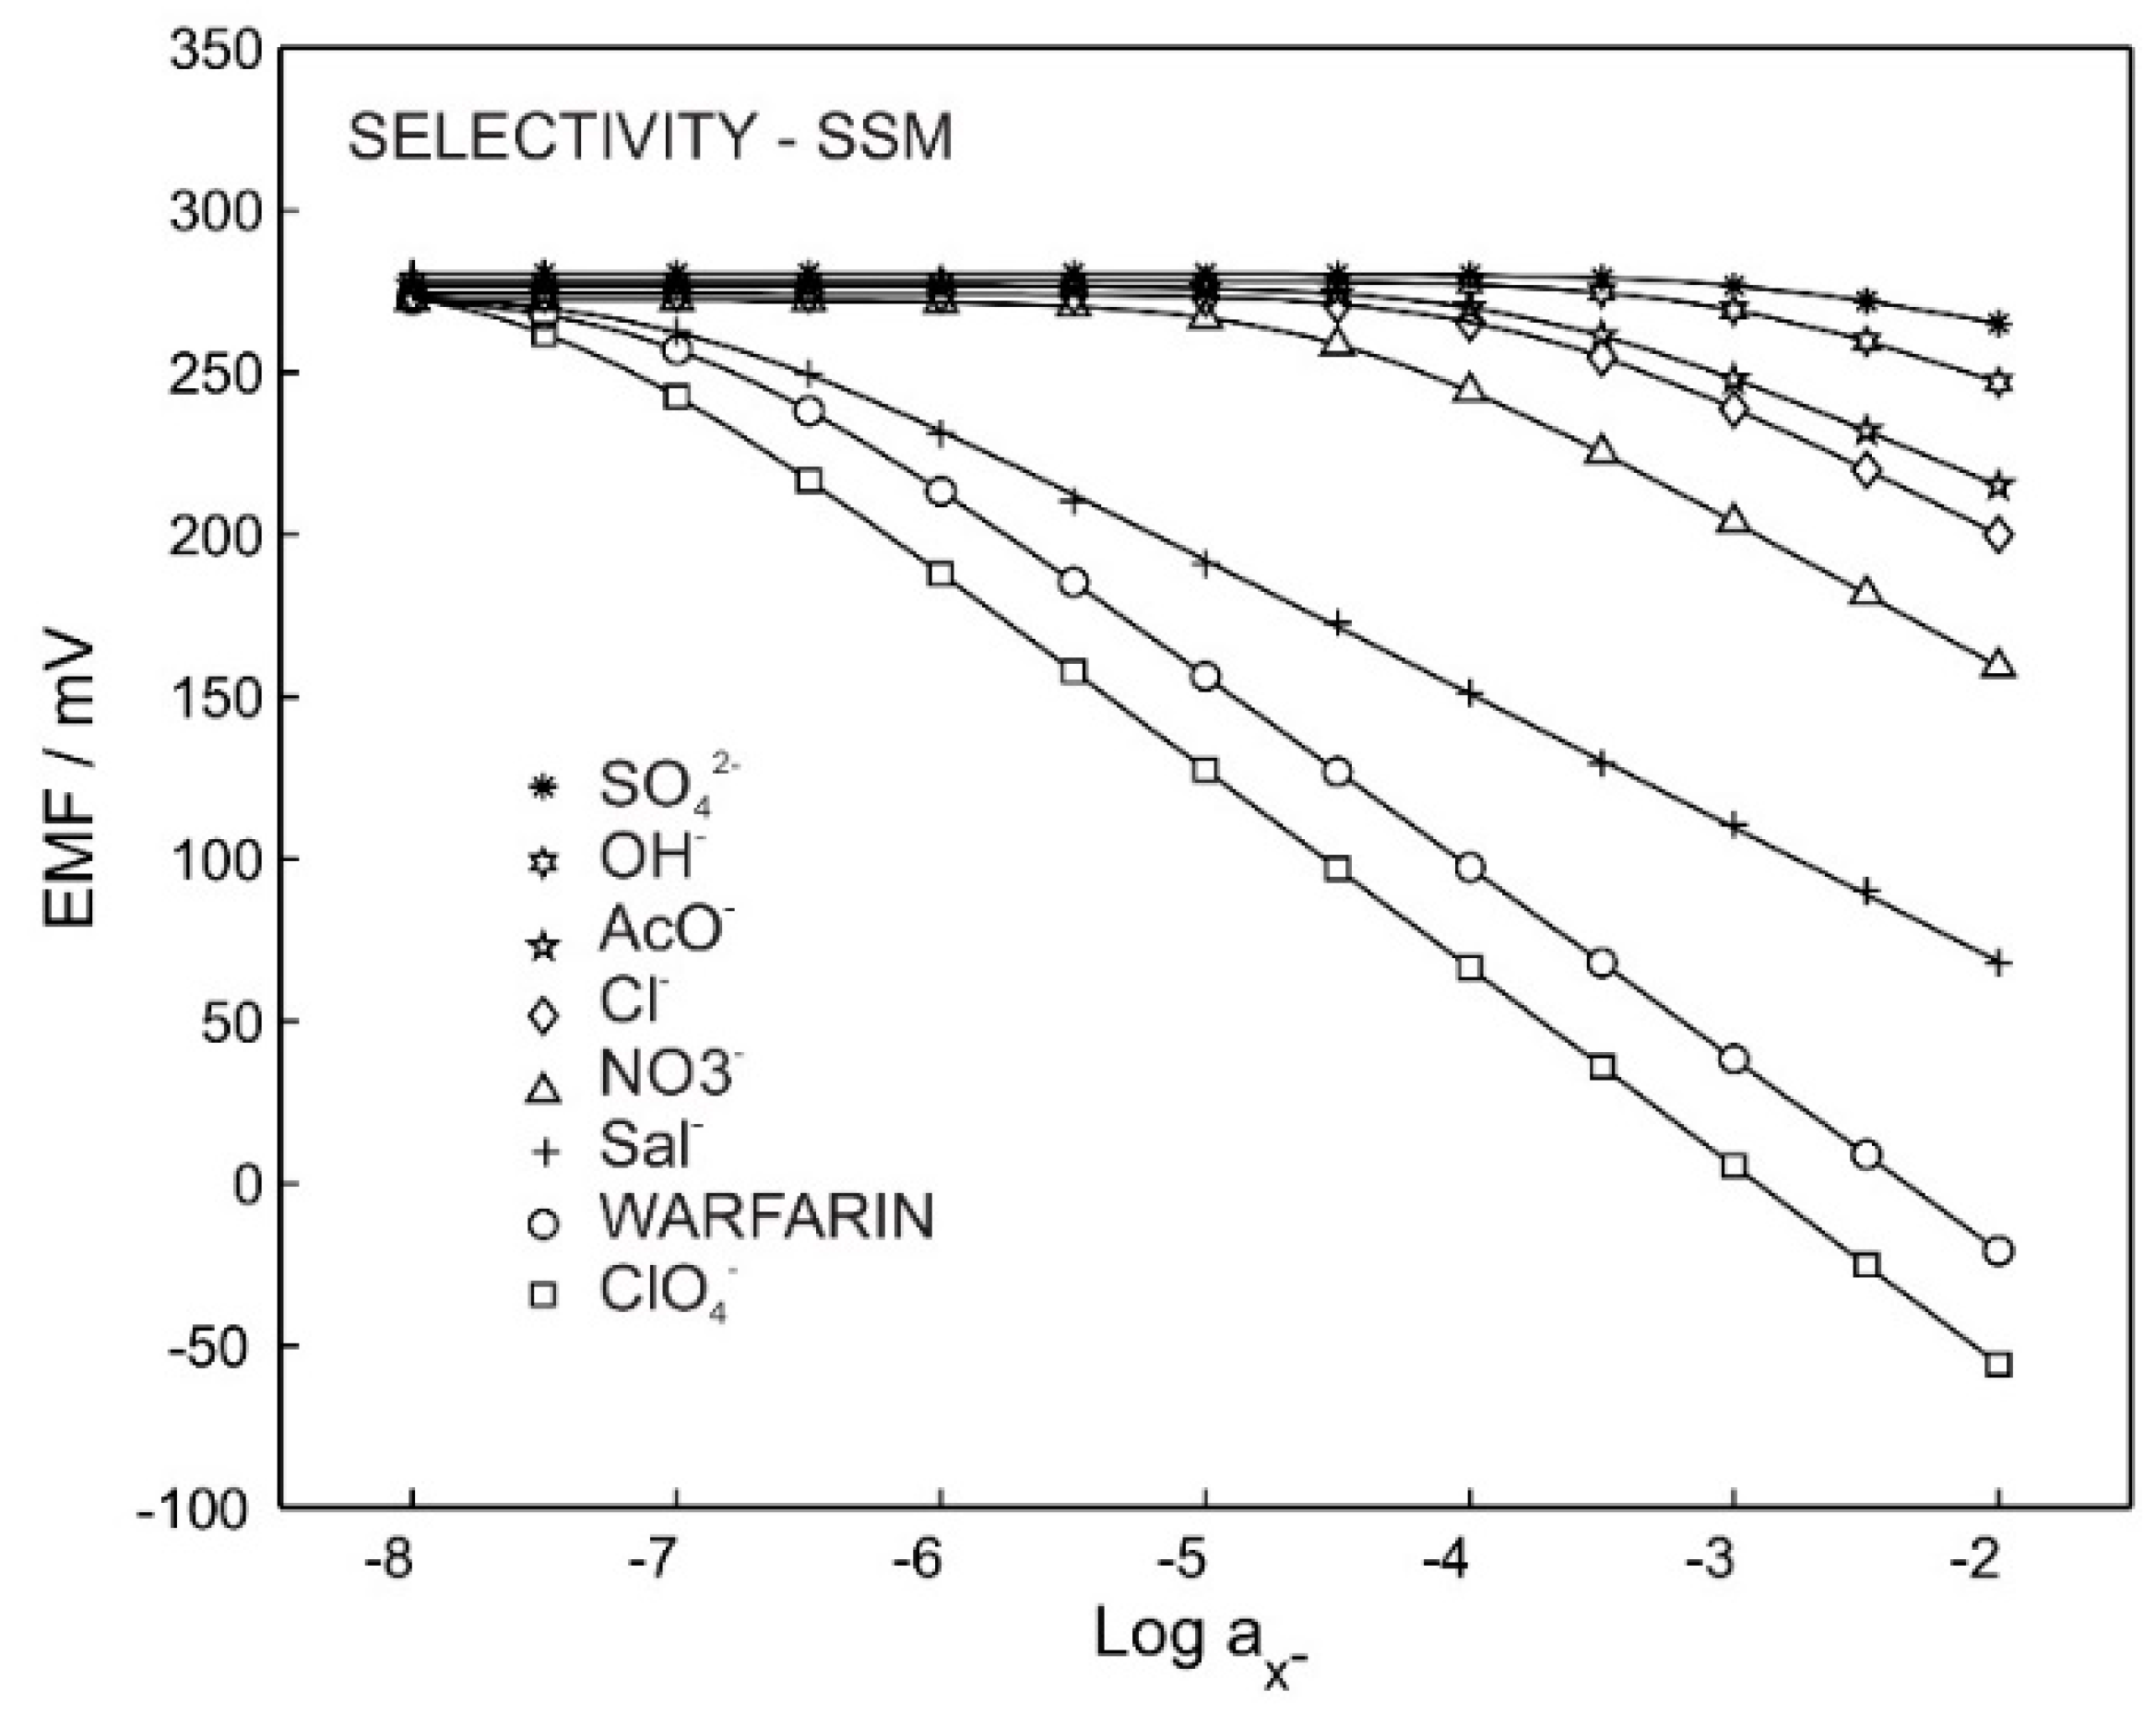
In order to evaluate the performance of the ISE in determining warfarin in blood, the selectivity of the sensor in the presence of various anions was investigated. In particular, we were interested in exploring the interference of chloride and salicylate, the most abundant anions in the blood, on the performance of the sensor. A fixed ion concentration method (FIM) was employed and a separate solution method (SSM) was conducted to investigate the selectivity and calculate the selectivity coefficient for the ISE using the M3 membrane composition.
Figure 2 shows the potentiometric calibration curve for the ISE with membrane M3, which was exposed to primary ions and other interfering anions. The selectivity coefficient and slope are reported in Table 2. The Hofmeister pattern was obtained for M3, which was predictable due to the use of only an ion exchanger in the membrane’s composition. The obtained selectivity coefficient of −4.1 for sodium chloride provides the possibility of using such a membrane for warfarin detection in physiological chloride concentrations (0.1 M).
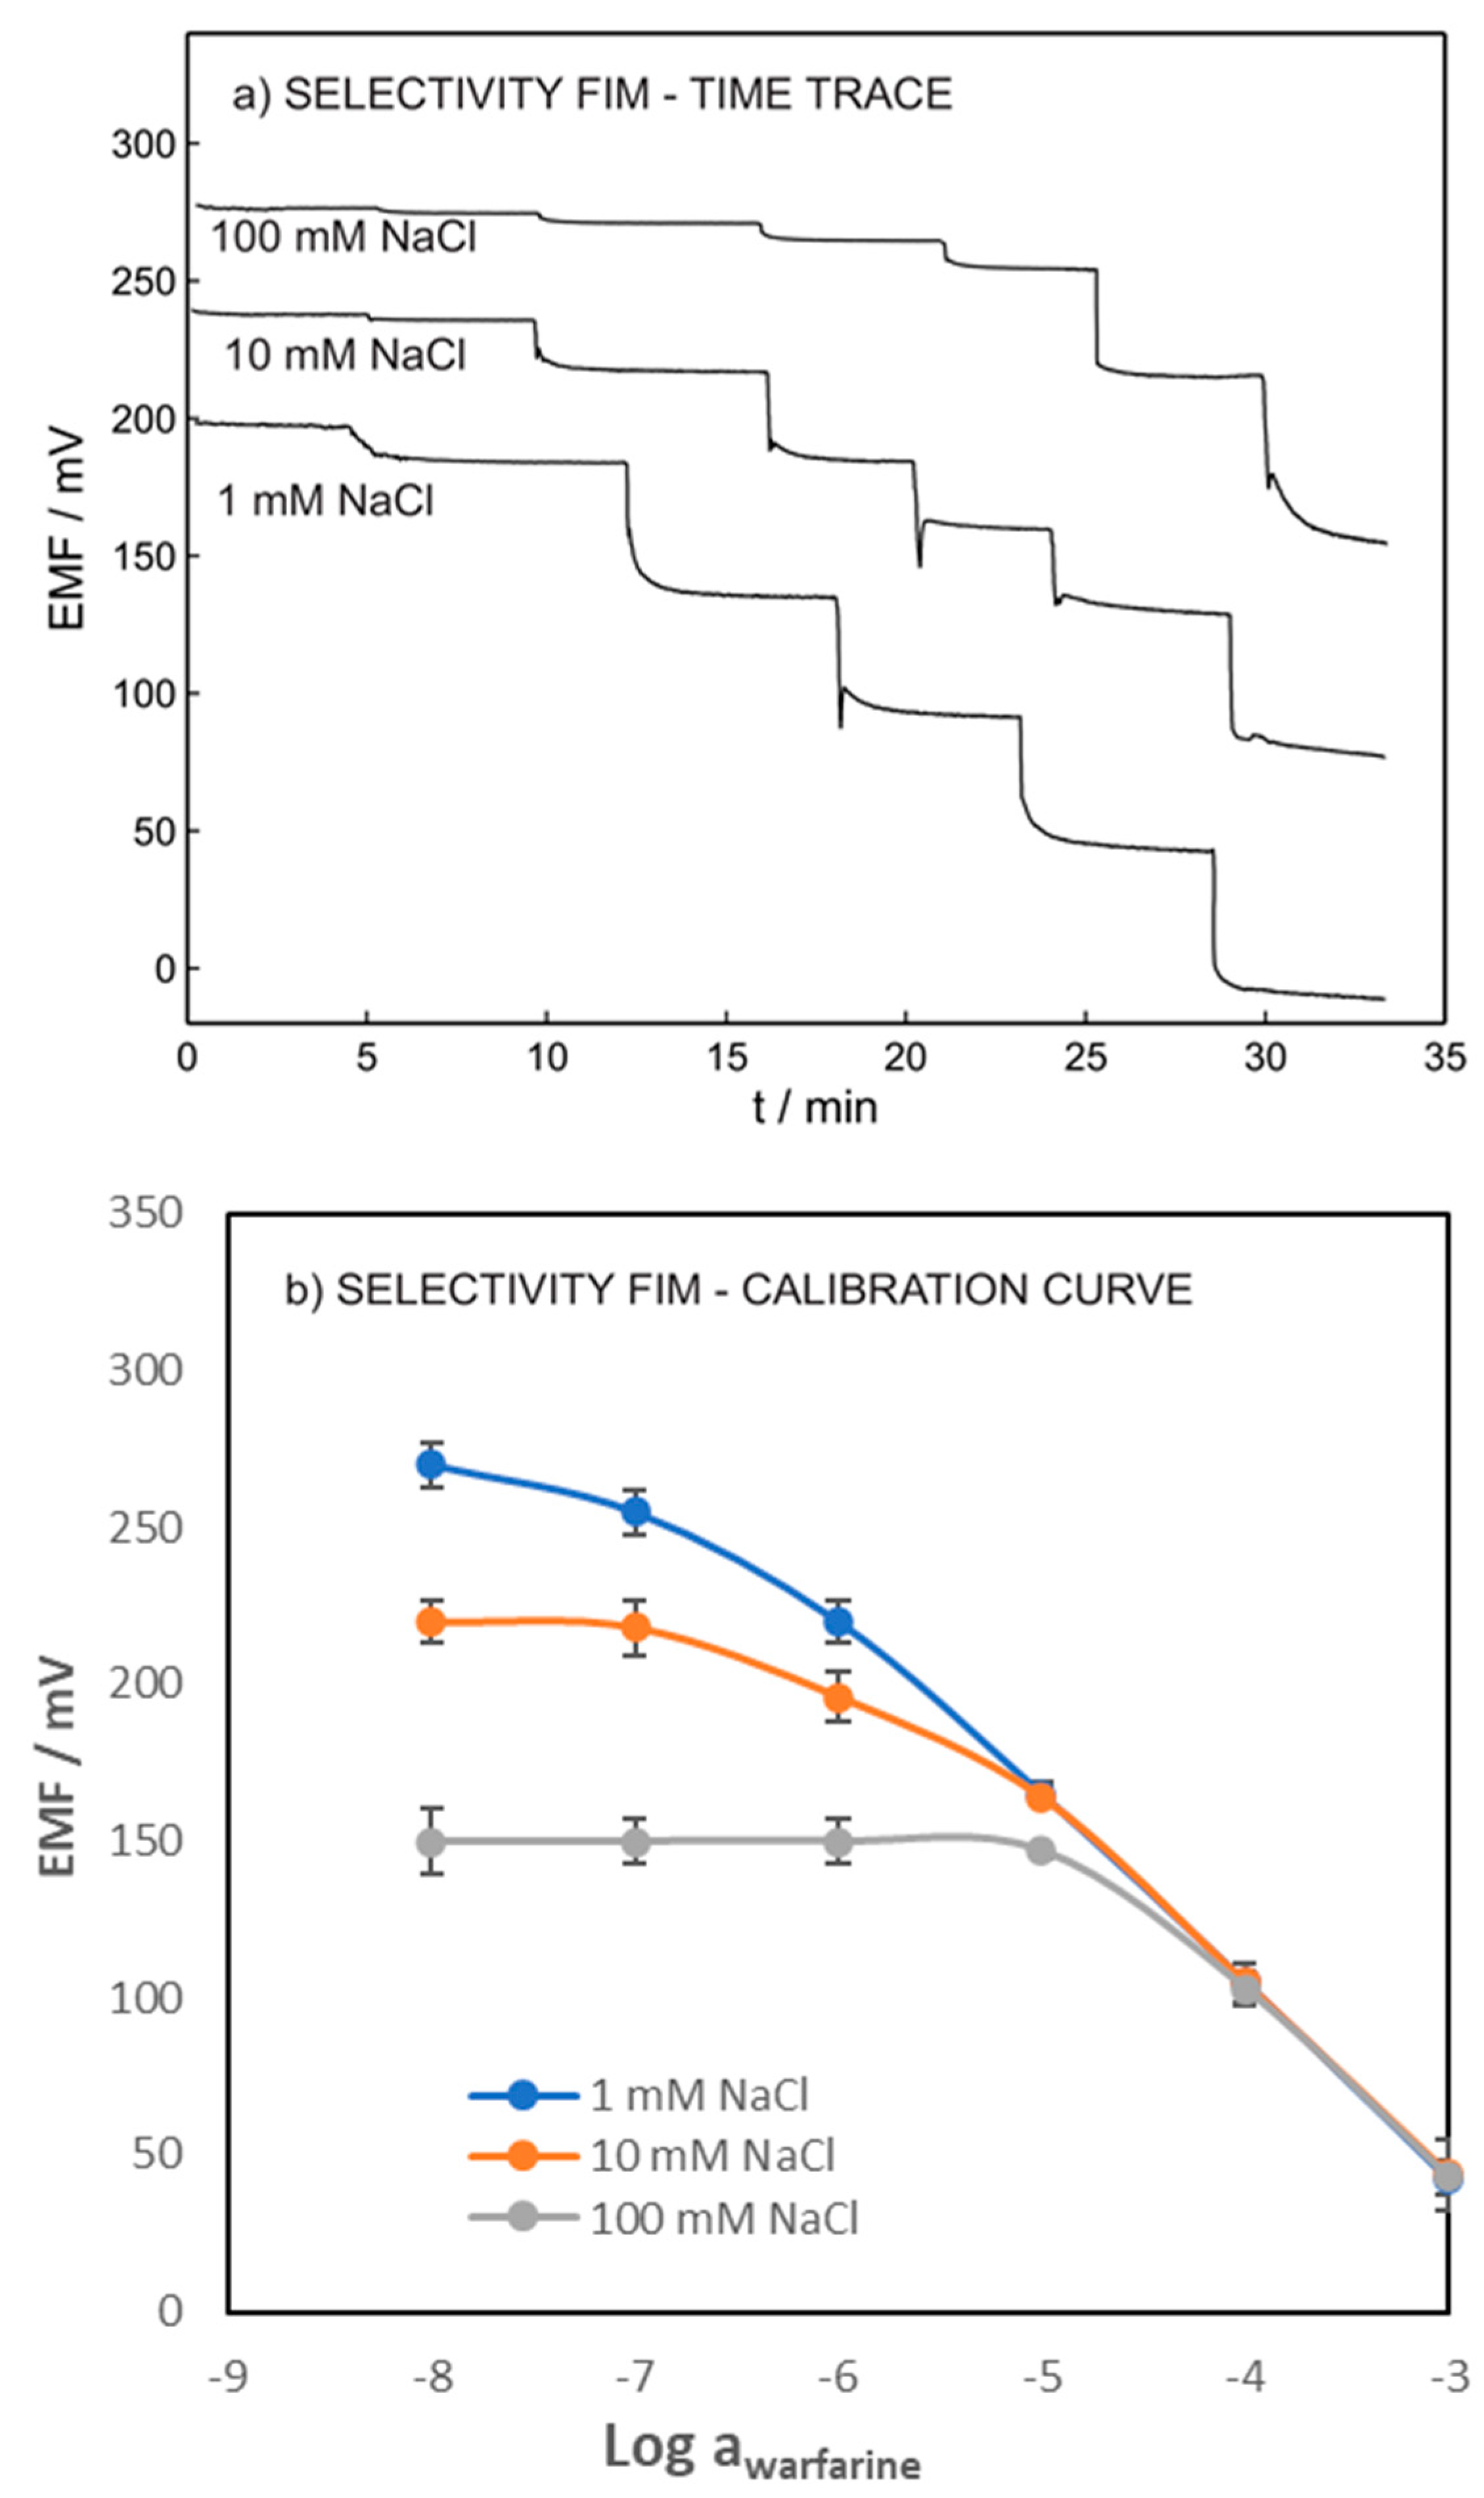
The selectivity coefficient of the ISE toward the chloride ion was accomplished by the fixed interfering method (FIM) to mimic the blood sample. For this purpose, warfarin detection was performed in a synthetic solution containing 0.001, 0.01, and 0.1 M NaCl.
Figure 3 shows the potentiometric time traces and calibration curves of warfarin within the range of 10−8 to 10−3 M in a fixed concentration of chloride. The log (LOD) of 6.9, 5.9, and 4.9 were obtained for warfarin in the presence of 0.001, 0.01, and 0.1 M of chloride ion, respectively. As expected, our results showed that the LOD of the ISE increased with increasing concentration of the interference ions. However, obtaining the LOD of 10−5 allowed for the ISEs to be interrogated in the whole undiluted blood sample.
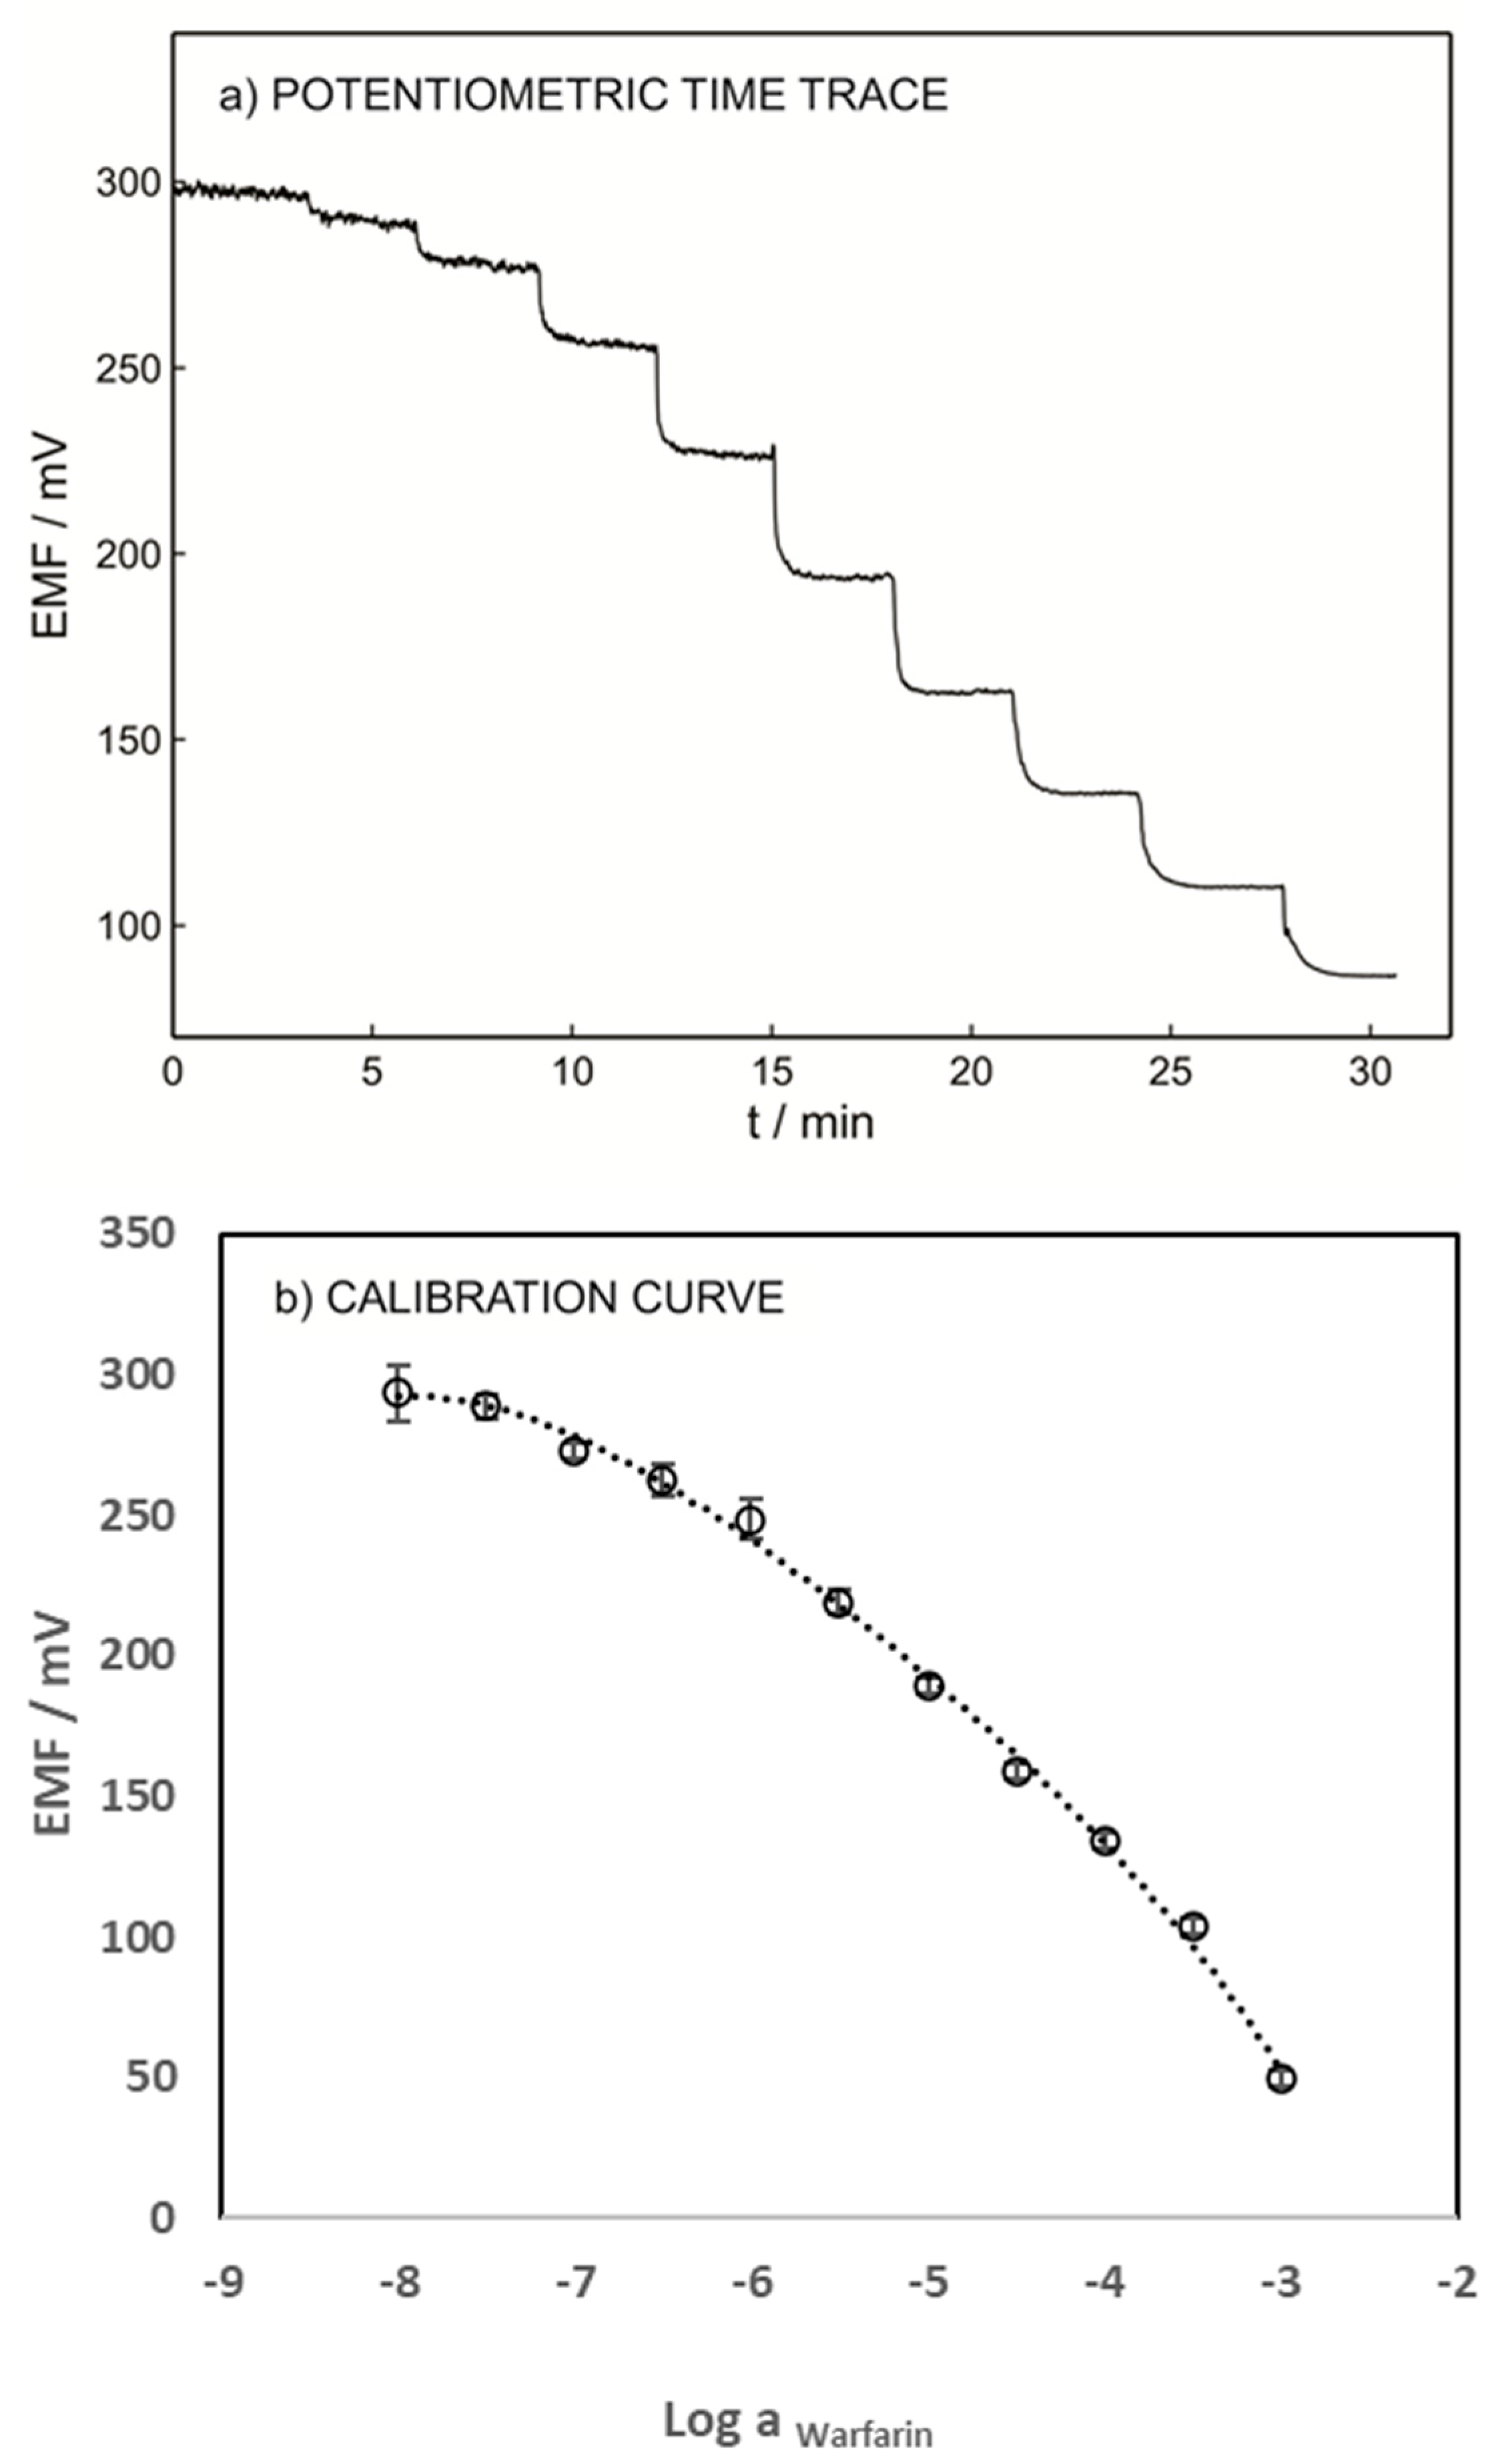
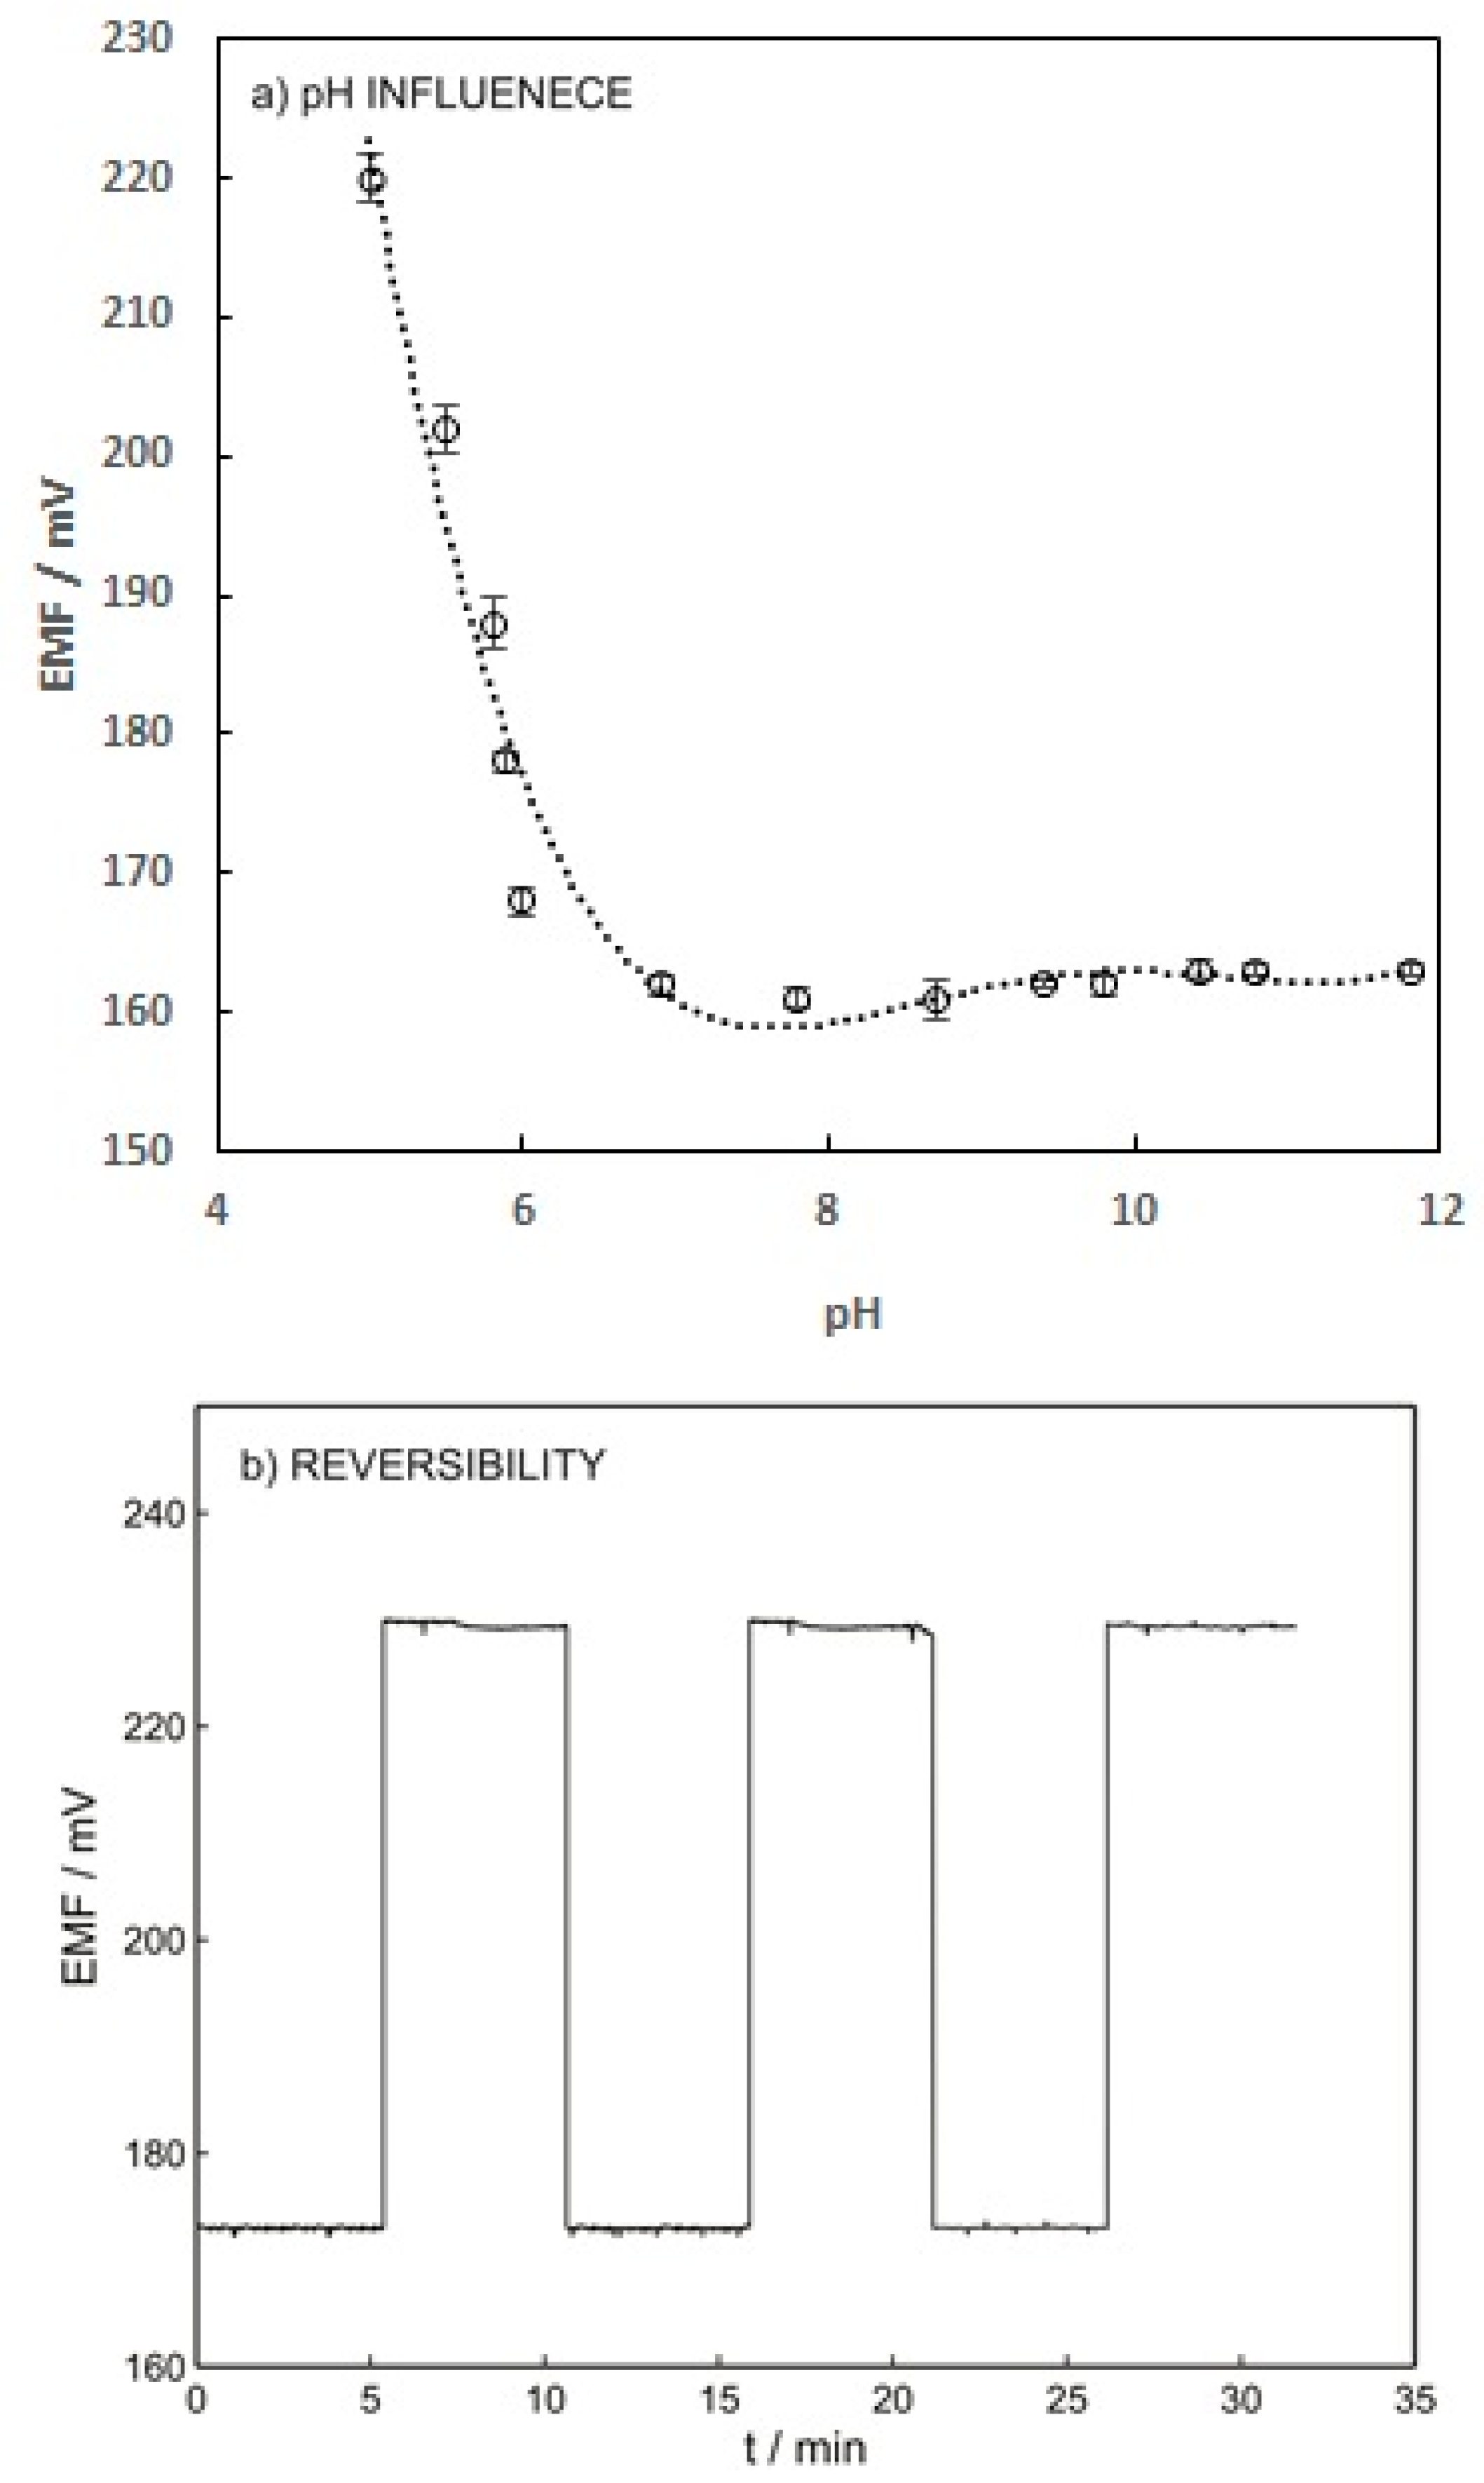
The performance of the warfarin ISE was also evaluated within the concentration range of 10−7–10−3 M of warfarin in 0.05 M phosphate buffer, pH 7.4, solution (Figure 4a). As shown in Figure 4b, a linear dynamic range of 10−6.5–10−3 M and an anionic Nernstian slope of −58.8 mV/dec were obtained. The lower LOD of the warfarin ISE was found to be 1.26 × 10⁻⁷ M according to IUPAC criteria. The pH of the sample solution might affect the sensor response; this includes the interference of hydroxyl groups in pH higher than 7 and warfarin speciation in pH lower than pKa. The abundance of warfarin and warfarin sodium (the ionic form of warfarin, see Figure 1) in various pH was reported using a Bjerrum plot, which indicated that at a pH close to pKa (5.5), both protonated and unprotonated warfarin exist in the solution [31]. Therefore, the pH effects resulting from warfarin speciation can be corrected by using the dissociation constant. To investigate the pH influence, the potentiometric response of the sensor was recorded in the solution containing 10−3 M warfarin in 0.05 M universal buffer with a pH range between 5 to 12; pH below 5 was not tested as the protonated form of warfarin is predominant at pH < pKa [31]. The protonated warfarin cannot pair with TDDA+; therefore, no response will be observed.
Figure 5a indicates that increasing the pH from 5 to 7 results in increasing the potentiometric response of the ISE. This effect can be explained by the pKa value of warfarin (5.5) and its speciation. The warfarin speciation diminished by increasing the pH from pKa to a higher value, which led to an increase in the free ion concentration. The sensor response reached a plateau within the pH range of 7 to 12 since all the warfarin exists in free ion form at pH above 7 [31].
Reversibility, reproducibility, and long-term stability of the ISE were the other parameters that needed to be investigated. The reversibility of the warfarin sensor was investigated by applying solutions containing 10−4 and 10−3 M warfarin. As shown in Figure 5b, the warfarin sensor possesses reasonable reversibility with a relative standard deviation (%RSD) below 1%. To measure the long-term stability, the ion-selective electrode was placed in the solution containing 10−3 M warfarin for 24 h and a drift of 0.2 mV/h was obtained, which is acceptable.
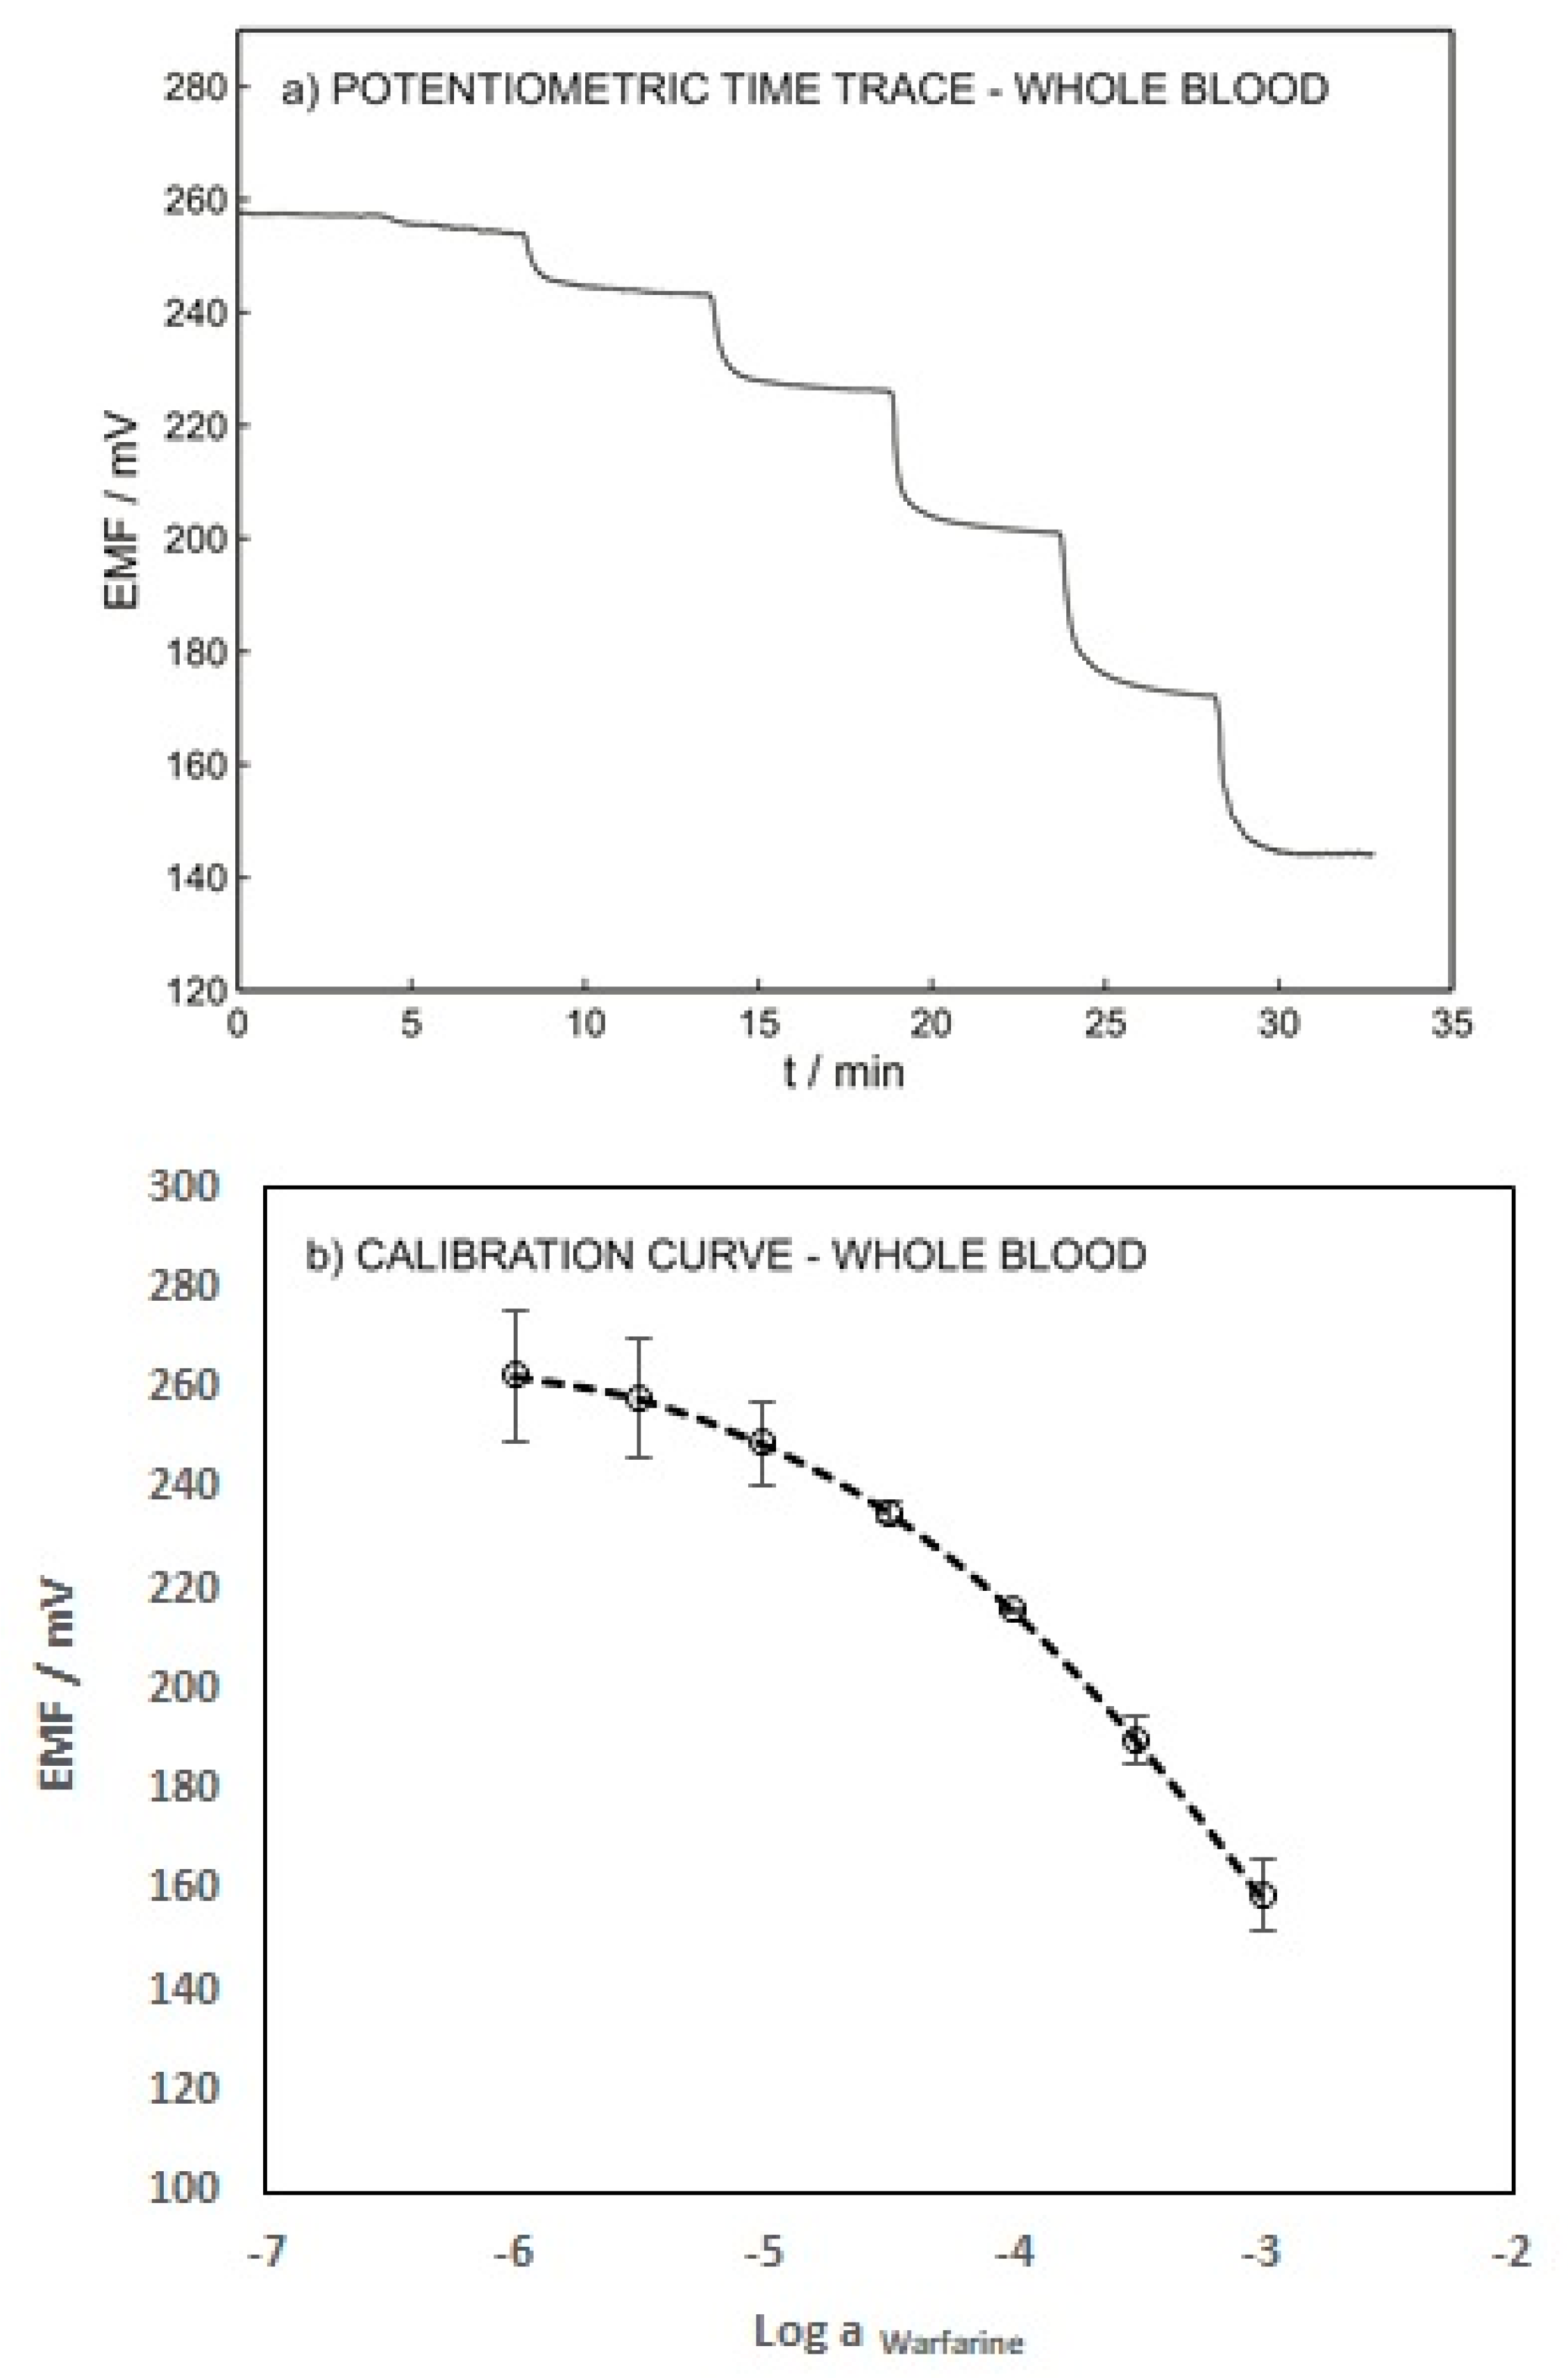
To validate the developed technique, the performance of the warfarin ISE was evaluated using blood samples spiked with various warfarin concentrations without any pretreatment. Figure 6 shows the potentiometric time trace and the calibration curve of the ISE. A LOD of 1.41 × 10⁻⁵ M and a Nernstian slope of −58.87 were obtained. These results emphasize the capability of the presented method for warfarin determination in whole-blood samples. The LOD of the proposed sensor in the blood sample (1.41 × 10⁻⁵ M) is slightly higher than its LOD in 0.1 M sodium chloride (1.26 × 10⁻⁵ M) due to the interference of various anions such as albumin, salicylate, phosphate, etc.
In order to obtain information about blood coagulation, the warfarin concentration needed to be correlated with the INTERNATIONAL NORMALIZED RATIO (INR) value (the test used to monitor the effect of warfarin) [32,33]. The INR value for a normal person is about 1.1, whereas an INR value of 2 to 3 is expected for those undergoing anticoagulant therapy by taking a stable dose of warfarin (1–20 mg/day). Furthermore, there is a risk of bleeding for patients with an INR value greater than 4 [34,35]. As a result, the threshold concentration of warfarin in the whole blood sample could be predicted at about 1.5 × 10⁻⁵ M by assuming a person with 60 kg weight, 4.5 L of blood, and a warfarin dosage of 20 mg a day [36]. Based on this assumption, the threshold concentration of warfarin was higher than the LOD of the ISE. Therefore, this sensor can be effectively applied as a point-of-care sensing device for the dose management of warfarin.

4. Conclusions

This paper presents a proof-of-concept for a sensitive point-of-care device capable of quantitatively detecting warfarin in blood. The ISE potentiometric PVC-based membrane showed promising results for direct detection of warfarin in blood samples without any pretreatment. Monitoring free warfarin in the blood is important because the response to warfarin administration varies between patients and a high blood level of warfarin may lead to life-threatening bleeding. The FIM and SSM methods confirmed the selectivity of the ISE and its capability of detecting warfarin in the complex matrix of the blood sample. A detection limit of 1.41 × 10⁻⁵ M was achieved, which is within the minimum therapeutic concentration of warfarin. A portable point-of-care device can be fabricated by combining the developed ISE sensor with a microfluidic system and a simple potentiometer, for use at patients’ bedsides during treatment, to monitor the level of warfarin in their blood.

Author Contributions

Conceptualization, Z.R. and S.A.; methodology, Z.R. and I.S.; validation, Z.R., I.S. and P.H.; formal analysis, I.S. and P.H.; investigation, I.S. and P.H; resources, Z.R. and M.T.; writing—original draft preparation, I.S. and P.H.; writing—review and editing, Z.R., S.A. and M.T.; visualization, I.S. and P.H.; supervision, Z.R.; project administration, Z.R.; funding acquisition, Z.R. All authors have read and agreed to the published version of the manuscript.

Funding

This research received no external funding.

Institutional Review Board Statement

Not applicable.

Informed Consent Statement

Not applicable.

Data Availability Statement

Not applicable.

Acknowledgments

This work was supported by the research deputy of Ahvaz Jundishapur University of Medical Sciences.

Conflicts of Interest

The authors declare no conflict of interest.

References

  1. Kaur, N.; Pandey, A.; Shafiq, N.; Gupta, A.; Das, R.; Singh, H.; Ahluwalia, J.; Malhotra, S. Genetic and Nongenetic Determinants of Variable Warfarin Dose Requirements: A Report from North India. Public Health Genom. 2022, 25, 52–60. [Google Scholar] [CrossRef] [PubMed]
  2. World Health Organization. International Drug Monitoring: The Role of the Hospital, Report of a WHO Meeting [Held in Geneva from 18 to 23 November 1968]; World Health Organization: Geneva, Switzerland, 1969; Available online: https://apps.who.int/iris/handle/10665/40747 (accessed on 7 December 2021).
  3. Adumitrăchioaie, A.; Tertiș, M.; Cernat, A.; Săndulescu, R.; Cristea, C. Electrochemical methods based on molecularly imprinted polymers for drug detection. Int. J. Electrochem. Sci. 2018, 13, 2556–2576. [Google Scholar] [CrossRef]
  4. Li, W.; Luo, W.; Li, M.; Chen, L.; Chen, L.; Guan, H.; Yu, M. The impact of recent developments in electrochemical POC sensor for blood sugar care: A mini review. Front. Chem. 2021, 9, 723186. [Google Scholar] [CrossRef] [PubMed]
  5. Sugarman, D.T. Patient Page, Blood Thinners. JAMA 2013, 310, 2579. [Google Scholar] [CrossRef] [Green Version]
  6. Chen, A.; Stecker, E.; Warden, B.A. Direct oral anticoagulant use: A practical guide to common clinical challenges. J. Am. Heart Assoc. 2020, 9, e017559. [Google Scholar] [CrossRef]
  7. Vats, A. Estimation of Warfarin Dosage with reinforcement learning. arXiv Prepr. 2021, arXiv:2109.07564. [Google Scholar]
  8. Kamuren, Z.; Kigen, G.; Keter, A.; Maritim, A. Characteristics of patients with thromboembolic disorders on warfarin therapy in resource limited settings. BMC Health Serv. Res. 2018, 18, 723. [Google Scholar] [CrossRef]
  9. Kimura, R.; Miyashita, K.; Kokubo, Y.; Akaiwa, Y.; Otsubo, R.; Nagatsuka, K.; Otsuki, T.; Okayama, A.; Minematsu, K.; Naritomi, H.; et al. Genotypes of vitamin K epoxide reductase, γ-glutamyl carboxylase, and cytochrome P450 2C9 as determinants of daily warfarin dose in Japanese patients. Thromb. Res. 2007, 120, 181. [Google Scholar] [CrossRef]
  10. Huang, Q.; Cao, L.; Luo, N.; Qian, H.; Wei, M.; Xue, L.; Zhou, Q.; Zou, B.; Tan, L.; Chu, Y.; et al. Predicting Range of Initial Warfarin Dose Based on Pharmacometabolomic and Genetic Inputs. Clin. Pharmacol. Ther. 2021, 110, 1585. [Google Scholar] [CrossRef]
  11. Ng, S.S.; Lai, N.M.; Nathisuwan, S.; Jahan, N.K.; Dilokthornsakul, P.; Kongpakwattana, K.; Hollingworth, W.; Chaiyakunapruk, N. Comparative efficacy and safety of warfarin care bundles and novel oral anticoagulants in patients with atrial fibrillation: A systematic review and network meta-analysis. Sci. Rep. 2020, 10, 662. [Google Scholar] [CrossRef] [Green Version]
  12. Connolly, S.J.; Pogue, J.; Eikelboom, J.; Flaker, G.; Commerford, P.; Franzosi, M.G.; Healey, J.S.; Yusuf, S. Benefit of oral anticoagulant over antiplatelet therapy in atrial fibrillation depends on the quality of international normalized ratio control achieved by centers and countries as measured by time in therapeutic range. Circulation 2008, 118, 2029. [Google Scholar] [CrossRef] [PubMed] [Green Version]
  13. White, R.H.; McKittrick, V.; Hutchinson, R.; Twitchell, J. Temporary discontinuation of warfarin therapy: Changes in the international normalized ratio. Ann. Intern. Med. 1995, 122, 40. [Google Scholar] [CrossRef] [PubMed]
  14. Gage, B.; Eby, C.; Johnson, J.; Deych, E.; Rieder, M.; Ridker, P.; Milligan, P.; Grice, G.; Lenzini, P.; Rettie, A. Use of pharmacogenetic and clinical factors to predict the therapeutic dose of warfarin. Clin. Pharmacol. Ther. 2008, 84, 326. [Google Scholar] [CrossRef] [PubMed]
  15. Ghimenti, S.; Lomonaco, T.; Biagini, D.; Bellagambi, F.G.; Onor, M.; Trivella, M.G.; Ruocco, L.; Pellegrini, G.; Di Francesco, F.; Fuoco, R. Determination of warfarin and warfarin alcohols in dried blood spots by ultra-high performance liquid chromatography coupled to electrospray ionization-tandem mass spectrometry (UHPLC-ESI-MS/MS). Microchem. J. 2018, 136, 247. [Google Scholar] [CrossRef]
  16. Nooraee Nia, N.; Hadjmohammadi, M.R. Nanofluid of magnetic-activated charcoal and hydrophobic deep eutectic solvent: Application in dispersive magnetic solid-phase extraction for the determination and preconcentration of warfarin in biological samples by high-performance liquid chromatography. Biomed. Chromatogr. 2021, 35, e5113. [Google Scholar] [CrossRef] [PubMed]
  17. Pan, T.-Y.; Tsai, W.-C.; Tan, C.-H.; Cheng, C.-M.; Chen, W.; Soundappan, T.; Arasu, M.V.; Al-Dhabi, N.A.; Wu, C.-F.; Ponnusamy, V.K. Rapid simultaneous clinical monitoring of five oral anti-coagulant drugs in human urine using green microextraction technique coupled with LC–MS/MS. J. King Saudi Univ. Sci. 2021, 33, 101602. [Google Scholar] [CrossRef]
  18. Nowak, P.; Olechowska, P.; Mitoraj, M.; Woźniakiewicz, M.; Kościelniak, P. Determination of acid dissociation constants of warfarin and hydroxywarfarins by capillary electrophoresis. J. Pharm. Biomed. Anal. 2015, 112, 89–97. [Google Scholar] [CrossRef] [PubMed]
  19. Tzanavaras, P.D.; Themelis, D.G. Review of recent applications of flow injection spectrophotometry to pharmaceutical analysis. Anal. Chim. Acta 2007, 588, 1–9. [Google Scholar] [CrossRef]
  20. Sultan, M.A.; Abou El-Alamin, M.M.; Wark, A.W.; Azab, M.M. Detection and quantification of warfarin in pharmaceutical dosage form and in spiked human plasma using surface enhanced Raman scattering. Spectrochim. Acta Part A Mol. Biomol. Spectrosc. 2020, 228, 117533. [Google Scholar] [CrossRef]
  21. Gouda, A.A.; El-Sayed, M.I.K.; Amin, A.S.; El Sheikh, R. Spectrophotometric and spectrofluorometric methods for the determination of non-steroidal anti-inflammatory drugs: A review. Arab. J. Chem. 2013, 6, 145. [Google Scholar] [CrossRef] [Green Version]
  22. Bertucci, C.; Cimitan, S. Rapid screening of small ligand affinity to human serum albumin by an optical biosensor. J. Pharm. Med. Anal. 2003, 32, 707. [Google Scholar] [CrossRef]
  23. Fitzpatrick, B.; O’Kennedy, R.J. The development and application of a surface plasmon resonance-based inhibition immunoassay for the determination of warfarin in plasma ultrafiltrate. J. Immunol. Methods 2004, 19, 11. [Google Scholar] [CrossRef] [PubMed]
  24. Yawari, I.; Kaykhaii, M. Determination of (S)-warfarin using an activated screen-printed gold electrode modified with gold nanoparticles and an enantioselective molecularly imprinted polymer. Anal. Methods 2017, 9, 6583. [Google Scholar] [CrossRef]
  25. Gholivand, M.B.; Torkashvand, M. Electrooxidation behavior of warfarin in Fe3O4 nanoparticles modified carbon paste electrode and its determination in real samples. Mater. Sci. Eng. C 2015, 48, 235–242. [Google Scholar] [CrossRef]
  26. Hassan, S.S.; Mahmoud, W.H.; Elmosallamy, M.A.; Almarzooqi, M.H. Iron (II)-phthalocyanine as a novel recognition sensor for selective potentiometric determination of diclofenac and warfarin drugs. J. Pharm. Biomed. Anal. 2005, 39, 315. [Google Scholar] [CrossRef]
  27. Edelbroek, P.M.; van der Heijden, J.; Stolk, L.M. Dried blood spot methods in therapeutic drug monitoring: Methods, assays, and pitfalls. Ther. Drug Monit. 2009, 31, 327. [Google Scholar] [CrossRef]
  28. Shayesteh, O.H.; Mahjub, R.; Ranjbar, A.; Derankhshandeh, K.; Jamshidi, M. Nano optical and electrochemical sensors and biosensors for detection narrow therapeutic index drugs. Microchim. Acta 2021, 188, 411. [Google Scholar] [CrossRef]
  29. Hassan, S.S.; Mahmoud, W.H.; Abdel-Samad, M.S. Direct potentiometry and potentiotitrimetry of warfarin and ibuprofen in pharmaceutical preparations using PVC ferroin-based membrane sensors. Microchim. Acta 1998, 129, 251. [Google Scholar] [CrossRef]
  30. Gholivand, M.R.; Mohamadi-Behzad, L. An electrochemical sensor for warfarin based on covalent immobilization of quantum dots onto carboxylated multiwalled carbon nanotubes and chitosan-modified electrodes. Mat. Sci. Eng. 2015, 57, 77. [Google Scholar] [CrossRef]
  31. Dimitrokalli, E.; Fertaki, S.; Lykouras, M.; Kokkinos, P.; Orkoula, M.; Kontoyannis, C. Warfarin Sodium Stability in Oral Formulations. Molecules 2021, 26, 6631. [Google Scholar] [CrossRef]
  32. Hylek, E.M.; Regan, S.; Go, A.S.; Hughes, R.A.; Singer, D.E.; Skates, S.J. Clinical predictors of prolonged delay in return of the international normalized ratio to within the therapeutic range after excessive anticoagulation with warfarin. Ann. Intern. Med. 2001, 135, 393. [Google Scholar] [CrossRef] [PubMed]
  33. D’Andrea, G.; D’Ambrosio, R.L.; Di Perna, P.; Chetta, M.; Santacroce, R.; Brancaccio, V.; Grandone, E.; Margaglione, M. A polymorphism in the VKORC1 gene is associated with an interindividual variability in the dose-anticoagulant effect of warfarin. Blood 2005, 105, 645. [Google Scholar] [CrossRef] [PubMed]
  34. Gage, B.F.; Lesko, L.J. Pharmacogenetics of warfarin: Regulatory, scientific, and clinical issues. J. Thromb. Thrombolysis 2008, 25, 45. [Google Scholar] [CrossRef] [PubMed]
  35. Consortium, I.W.P. Estimation of the warfarin dose with clinical and pharmacogenetic data. N. Engl. J. Med. 2009, 360, 753. [Google Scholar]
  36. Johnson, J.A.; Gong, L.; Whirl-Carrillo, M.; Gage, B.F.; Scott, S.A.; Stein, C.; Anderson, J.; Kimmel, S.E.; Lee, M.T.M.; Pirmohamed, M. Clinical Pharmacogenetics Implementation Consortium Guidelines for CYP2C9 and VKORC1 genotypes and warfarin dosing. Clin. Pharmacol. Ther. 2011, 90, 625. [Google Scholar] [CrossRef]
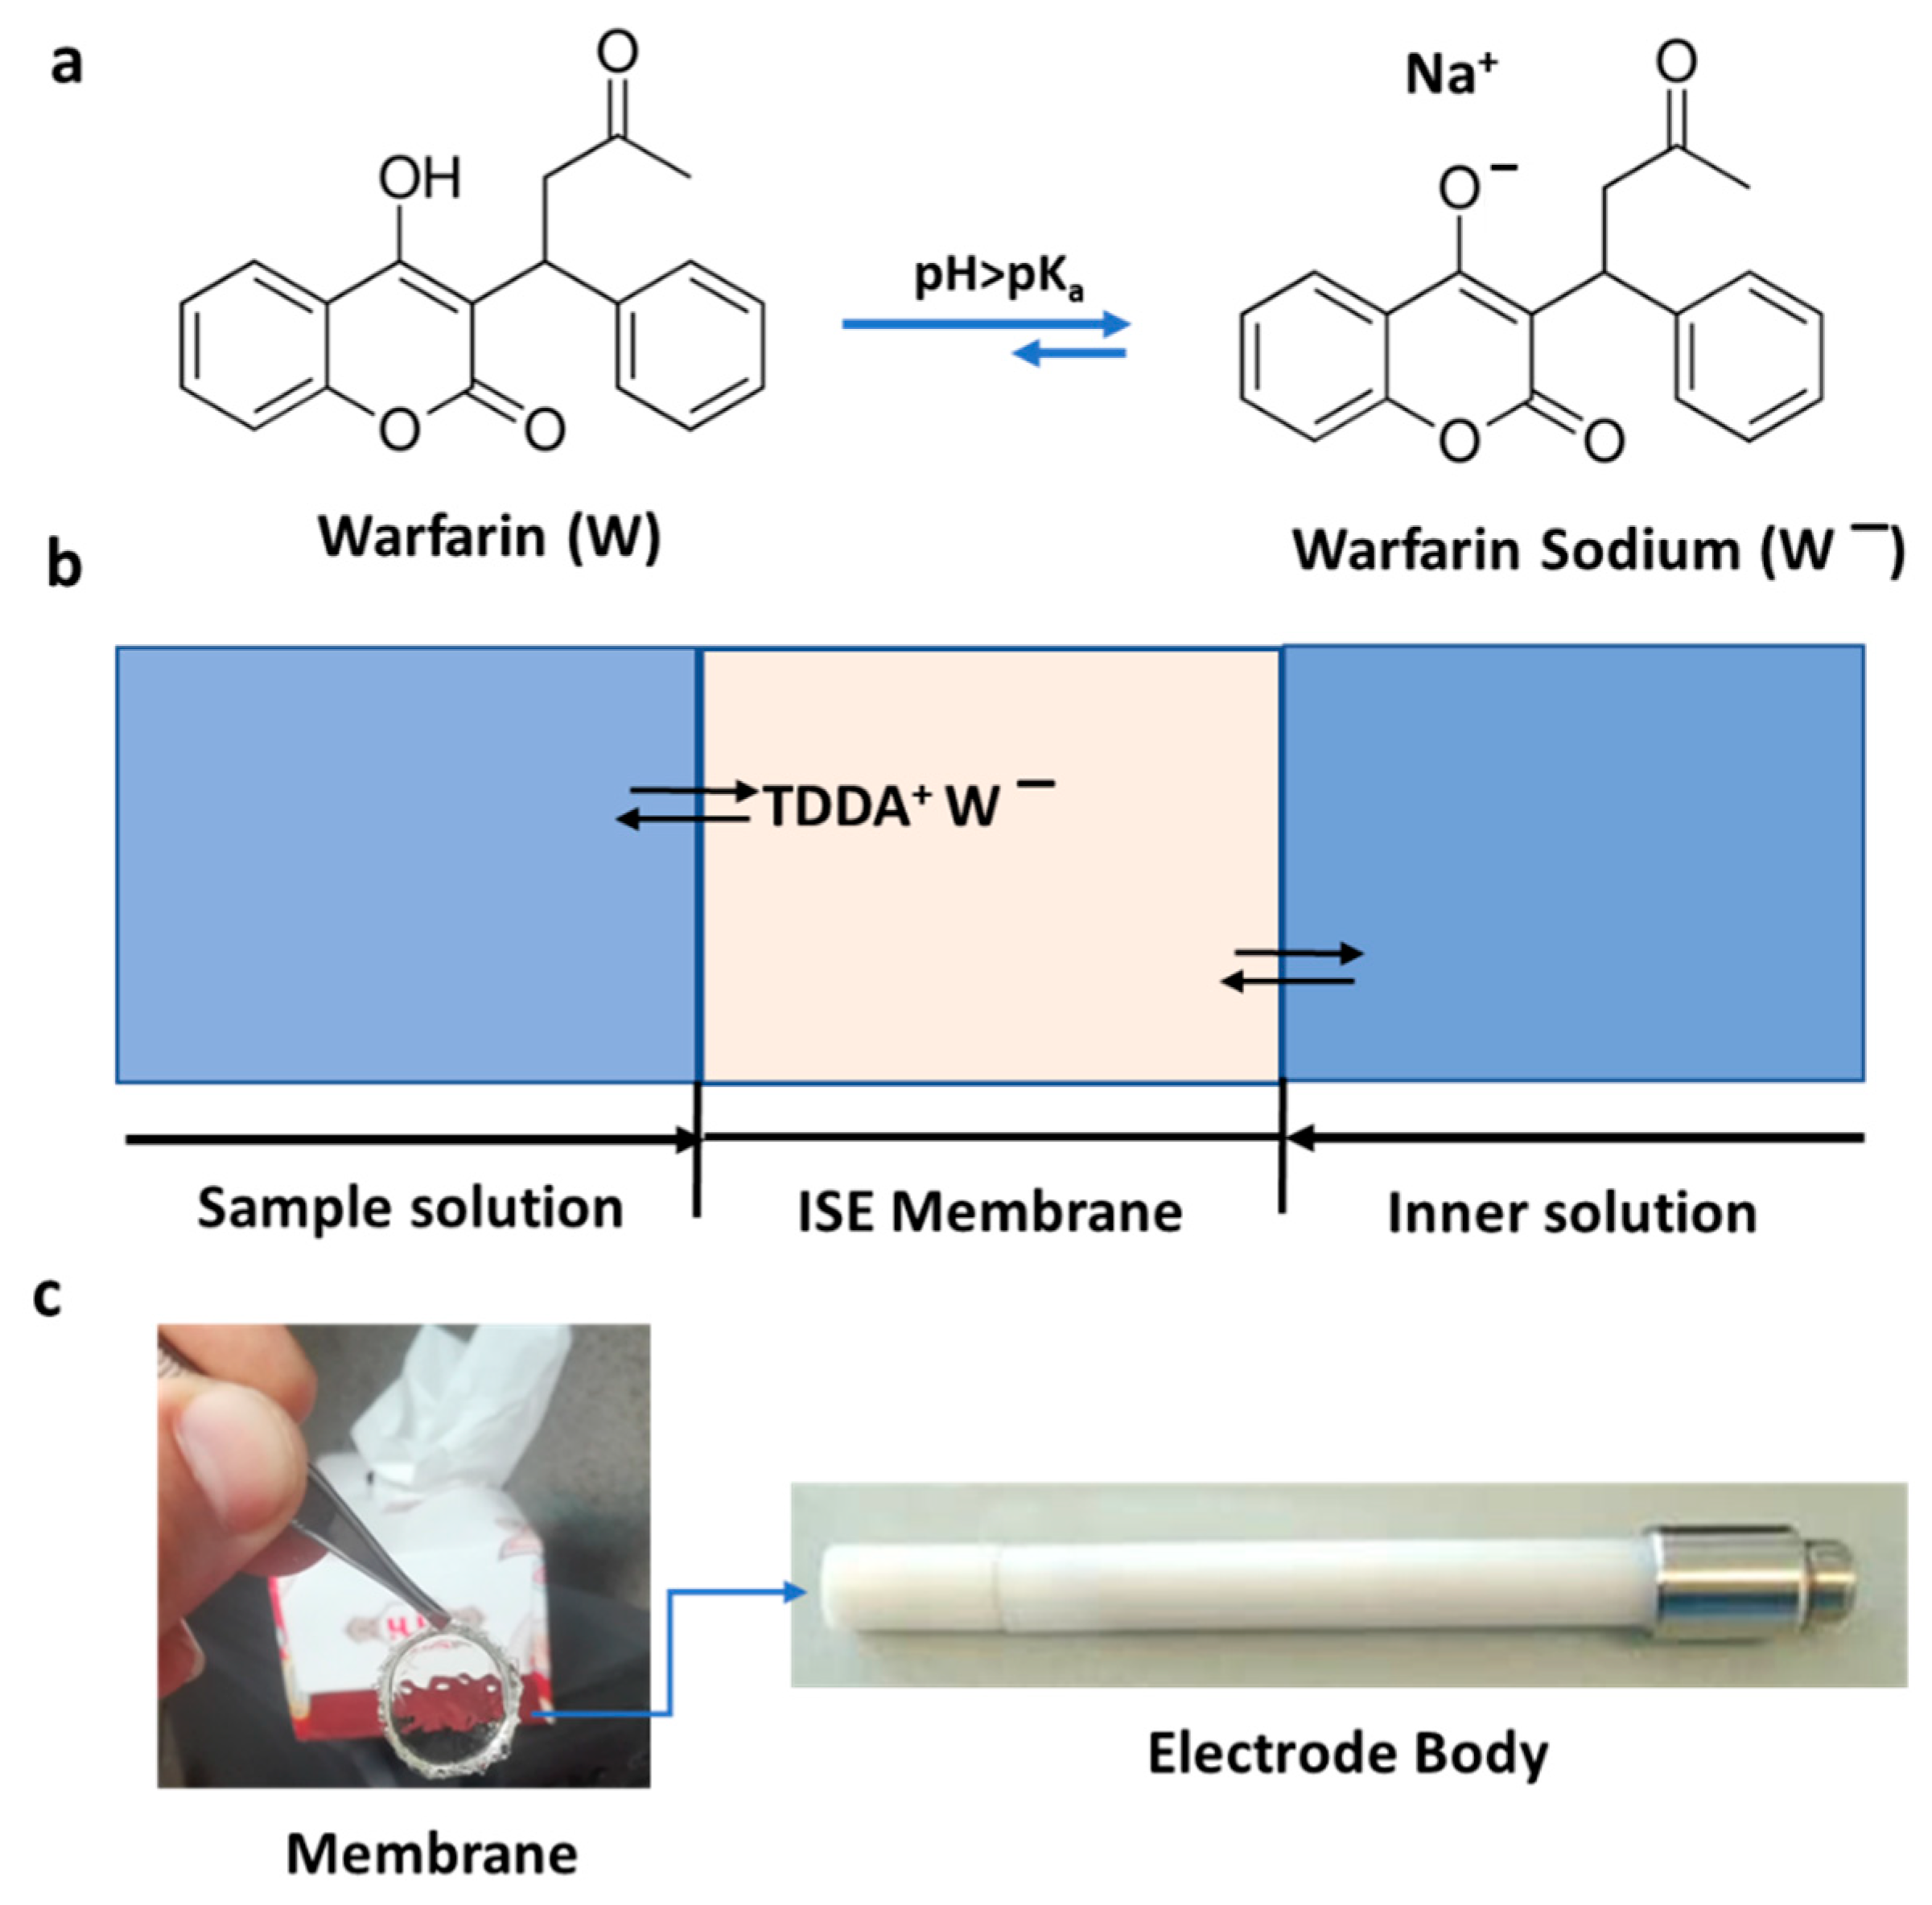
Figure 1. (a) Molecular structure of warfarin and warfarin sodium; at pH > pKa, the predominant species that can be detected by the developed ion-selective electrode (ISE) is warfarin sodium. (b) Schematic presentation of the warfarin-selective PVC-based membrane; the inner solution contains 1 mM warfarin and 1 mM NaCl in 0.05 M phosphate buffer (pH = 7.4). (c) Picture of the developed membrane (8 mm) and the corresponding electrode body.
Chemosensors 10 00044 g001
Figure 2. Potentiometric response for M3 in the presence of different ions.
Chemosensors 10 00044 g002
Figure 3. (a) Potentiometric time traces. (b) Calibration curves of warfarin ISE in various NaCl concentrations in constant activities of chloride (the inner solution contained 1 mM warfarin and 1 mM chloride in 0.05 M phosphate buffer with pH = 7.4).
Chemosensors 10 00044 g003
Figure 4. (a) Potentiometric time trace for varying concentrations of the warfarin ISE with M3 membrane composition. (b) Its respective calibration curve. All measurements were carried out in the 0.05 M phosphate buffer at pH = 7.4. The inner filling solution was 1 mM warfarin and 1 mM chloride in 0.05 M phosphate buffer (pH = 7.4).
Chemosensors 10 00044 g004
Figure 5. (a) Influence of warfarin pH solution on the potential response of the ISE-M3 for 1 mM warfarin in 0.01 M universal buffer. (b) Reversibility of potentiometric response of ISE-M3. This experiment was carried out by changing the warfarin concentration from 10−3 M to 10−4 M in 0.05 M phosphate buffer at pH 7.4.
Chemosensors 10 00044 g005
Figure 6. (a) Potentiometric time trace for ISE-M3 in a blood sample with an inner solution as for Figure 3. (b) Calibration curve as a function of logarithmic warfarin activity.
Chemosensors 10 00044 g006
Table 1. Amount of tetradodecylammonium chloride (TDDA) as anion exchanger in the membrane composition (M1–M8). The total weight of the membrane was 200 mg with a 1:2 mass ratio of PVC to plasticizer.
M1M2M3M4M5M6M7M8
TDDA (mmol/kg)12510255075100
Slope (mV)−54.2−56.3−58.8−57.9−58.2−58.4−58.9−59.1
LOD (logax)−7.2−7−6.9−6.5−6.4−5.8−5.3−4.9
Table 2. Performance parameters of the warfarin ISE in the presence of different ions. Potentiometric selectivity coefficients and log Kijpot. were obtained using a single solution method (SSM). Intercepts were obtained from extrapolation to log a = 0 by setting the slopes of ions to 59 mV/z.
SO42−OHAcOClNO3SalClO4Warfarin
Slope (mV/dec)−18.4−30.1−35.2−41.1−45.4−60.2−61.3−59.1
Intercept230.2188.1145.3118.569.7−35.3−178.2−139.1
LOD−2.8−3.0−3.7−3.8−4.5−6.2−7.4−6.9
Log Kijpot.−6.2−5.5−4.8−4.1−3.5−1.90.6-
Publisher’s Note: MDPI stays neutral with regard to jurisdictional claims in published maps and institutional affiliations.