Abstract
In biomedical diagnosis, the efficient separation and purification of specific targets from clinical samples is the desired first step. Herein, the concept of virtual filter membranes based on optically-induced dielectrophoresis (ODEP) manipulation in a microfluidic channel is proposed as a light screening membrane for the separation of polystyrene (PS) microparticles with three different diameters of 15.8, 10.8 and 5.8 µm. The ODEP manipulation velocity of three types of PS microparticles reacted with the color brightness setting was investigated to determine the light intensity to induce an ODEP force higher than the drag force of fluid speed. The color brightness of the light bar in three areas of the light screening membrane was selected as 60%, 70% and 100% to isolate PS microparticles with diameters of 15.8, 10.8 and 5.8 µm, respectively. With a double light bar and a flow rate of 3 µL/min, the recovery rate and isolation purity was improved by 95.1~100% and 94.4~98.6% from the mixture of three types of PS microparticles within 2 min, respectively. This proposed light screening membrane could be a candidate for the separation of small-volume and rare biomedical samples, including circulating tumor cells (CTCs) and bacteria in the blood.
1. Introduction
In biomedical applications, the separation and purification of specific targets (e.g., cells and bacteria) with high efficiency and speed from clinical samples are beneficial for real-time diagnosis and academic investigation [1,2,3]. To obtain biomarkers with high purity, conventional methods, including filtering membranes [4], density centrifugation [5], immunomagnetic microbeads [6], and metal-electrode-based dielectrophoresis (DEP) [7], have been developed. The basic mechanism of separation involves constructing microstructures as barriers to restrict the movement of specific targets. The purification results can be determined by the dimensions of the targets [8], deformability [9] and affinity of the filtering membrane [10]. Due to their simple structure and high throughput properties, filtering membranes are the most common choice in clinical sample separation [11]. However, the purity of targets after separation by filtering membranes may not be acceptable for direct application in subsequent biomedical analysis and applications, including diagnosis, cytological assessment, cell culture, and gene sequencing [11]. For example, the purity of filtering membrane-based circulating tumor cell (CTC) isolation preparations directly from the blood of cancer patients is only 0.1~10%, making subsequent application difficult (e.g., CTC enumeration or gene analysis) [12]. In the meantime, the recovery rate and throughput of targets decrease with process time due to blocking by accumulated targets in the filter membranes, which is not suggested for biosamples having a limited volume.
To solve the limitations of conventional filtering membrane-based isolation methods, a DEP technique embedded in a microfluidic system has been proposed for the isolation and purification of bioparticles as a new platform for filtering membranes [13]. Particle manipulation using the DEP working mechanism was first proposed by Herbert A. Pohl in 1951 [14]. With an applied electric field provided by defined electrodes, dielectric particles (e.g., biological cells) can be electrically polarized with surface charges. An interaction between the induced surface charges of particles and the applied nonuniform electric field can be generated as the DEP force. Therefore, many designs of metal microelectrode arrays are used to control the electric field to manipulate these particles for specific applications, including particle patterning [15], enrichment [16], and classification [17]. The integration of metal microelectrode arrays as a controllable filtering membrane and DEP force-based manipulation in a microfluidic system is believed to be a potentially effective solution for the isolation and purification of bioparticles, which can have fewer blocks by the release of particles with a properly applied external electric field [13]. Reports in the literature have also demonstrated the use of this technique for a wide variety of biological applications, including the centration of specific cells [18], removal of bacteria in the water [19] and isolation of CTCs from cancer patients’ blood samples [20]. However, the complexity of metal electrode design and process could highly constrain application of the DEP force-based isolation method.
The optically-induced dielectrophoresis (ODEP) platform may be a potential candidate to tackle the technical hurdle and limitation of the DEP force-based isolation method. ODEP, with the feasibility of creating “virtual” electrodes using tunable optical images projecting the semiconductor substrate, was proposed to manipulate microparticles in a microfluidics system in 2005 [21]. This technical feature not only decreases requirements of the process but also increases the flexibility of microparticle manipulation and is more user-friendly due to its use of computer-interfaced control illumination [21,22,23]. Leveraging the technical merits of ODEP-based microparticle manipulation, this technical feature has been successfully demonstrated to manipulate microparticles or bioparticles for various applications (e.g., alignment or patterning of magnetic microbeads [24], isolation of varied types of circulating tumor cells (CTCs) from cancer patients’ blood samples [25], and purification of cells or bacteria with various degrees of drug resistance [26]). ODEP has a similar working principle to the DEP mechanism mentioned previously. Metal microelectrode arrays of DEP chips are replaced with optical electrodes projected to the absorbed semiconductor layer in ODEP chips. In the first input signal, an alternating-current (AC) voltage across the solution layer is given through the top transparent electrodes, indium–tin–oxide (ITO) glass substrates, and bottom photoconductive electrode, photoconductive material on ITO glass. The second input signal, light with a defined power, is projected to the photoconductive electrode in designed patterns, which works as the virtual electrode with the gradient of the electrical field between the illuminated and dark areas. The electron-hole pairs are generated by the projected light and thus significantly decrease the electrical impedance of the illuminated area. This photoinduced phenomenon leads to the exerted electric voltage dropping across the solution layer inside the illuminated area and following a locally nonuniform electric field in the illuminated area. In the ODEP system, the interaction between the nonuniform electric field and electrically polarized microparticles is practically controlled to manipulate these microparticles. Therefore, in short, scientists can simply control the light images projected into an ODEP system to manipulate the microparticles in a controllable manner [21,22,23].
Based on the mechanism of ODEP, a method integrated with different widths of microfluidics and light patterns was proposed in our study as a filter membrane to separate and collect cells with different dimensions [27]. Due to the different flux forces generated in different channel widths, ODEP force has been proven to separate cancer cells and white blood cells with isolation purities of 93.1~100%. However, this proposed microfluidic chip is complicated in design and fabrication. To simplify the microfluidic structure, in this study, we propose a novel “virtual filter membrane” design with a straight microchannel and the modification of illumination patterns with different ODEP forces to separate microparticles with different dimensions. In particular, in a previous report, modification of the intensity of the illumination pattern was demonstrated to modify the ODEP force to microparticles [28]. Therefore, in this study, a light screening membrane constructed using three light intensities is proposed as a “virtual filter membrane” to investigate the screening and separation of microparticles with different diameters for the first time. The natural advantage of simple modification of illumination patterns in the ODEP system can be used to collect and release the separated microparticles, which could solve the block issue in the conventional filtering membrane-based isolation method. To evaluate the feasibility of this concept, three types of polystyrene (PS) microparticles with diameter differences of 5 μm were selected in this study to determine the proper illumination conditions and the separation efficiencies (e.g., recovery rate and isolation purity) of the light screening membrane. The condition for each PS microparticle can be clearly defined using systematic investigation in the ODEP system.
2. Materials and Methods
2.1. ODEP Microfluidic Chip and Experimental Setup
In this study, an ODEP microfluidic chip with its top-view layout and design of light patterns (illustrated in Figure 1A) was used to evaluate isolation performance. A specifically designed “light screening membrane” contains multiple light bar arrays with a width of 100 µm and three various light intensities in each area (e.g., (I), (II), and (III) in Figure 1A). In the structure of this microfluidic chip, briefly, a primary microchannel (e.g., length = 20.0 mm, width = 1.0 mm, height = 50.0 µm) with two holes (e.g., diameter = 1.0 mm, height = 50.0 μm) was designed for loading/removing a microparticle suspension sample as well as for sample transportation/collection. The structure of the ODEP microfluidic chip is schematically illustrated in Figure 1B, encompassing a fabricated polydimethylsiloxane (PDMS) connector (e.g., Layer 1), an indium–tin–oxide (ITO) glass (e.g., Layer 2), a double-sided adhesive tape (thickness: 50 µm) with a fabricated microchannel (e.g., Layer 3), and an ITO glass coating with a photoconductive material containing a 20-nm-thick n-type hydrogenated amorphous silicon layer and a 1-μm-thick hydrogenated amorphous silicon layer (e.g., Layer 4) [28]. The fabrication of the ODEP microfluidic chip can be divided into four separate parts from Layers 1 to 4. Layer 1, the PDMS connector, was fabricated using computer-numerical-controlled (CNC) machining for mold making, PDMS replica molding and drilling a hole. Layer 2, the up-side-down ITO/glass (R01, InnoLux Corporation, Hsinchu, Taiwan), functions as a top electrode in the primary microchannel. Layer 3, the 50 µm-thick microchannel, was fabricated using manual cutting with a custom-made metal mold in double-sided adhesive tape (L298, Sun-yieh, TYN, Taiwan) and a hammer punch as shown in Figure S1. Layer 4, a 1000 nm-thick intrinsic hydrogenated amorphous silicon (a-Si:H) on a 20 nm-thick n+-doped hydrogenated amorphous silicon (n+ a-Si:H) layer, was continuously deposited on ITO/glass using plasma-enhanced chemical vapor deposition (AKT4300, Applied Materials, Santa Clara, U.S.). After each layer was fabricated, the two punched holes located in Layer 2 were aligned to the microchannel in Layer 3 and the supporting substrate in Layer 4 using the double-sided adhesive tape and one punched hole located in Layer 1 by oxygen plasma treatment. To expose the ITO/glass as the bottom electrode, a 20% KOH solution was used to etch the intrinsic a-Si:H and n+ a-Si:H layers.
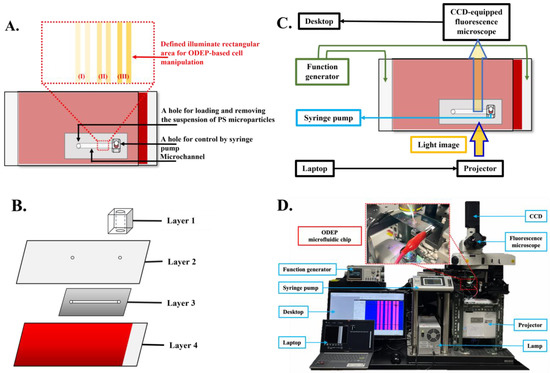
Figure 1.
Schematic presentation of the (A) top-view layout and (B) separated layer of the whole ODEP microfluidic chip (Layer I: PDMS connector; Layer II: ITO glass; Layer III: double-sided adhesive tape with a fabricated microchannel; Layer IV: ITO glass coating with a photoconductive material). (C) Overall experimental setup for ODEP manipulation. (D) Pictures of fabricated ODEP chips and measurement system.
In this design, ODEP-based manipulation for the separation of microparticles was performed in the area with virtual light screening membranes (e.g., length = 0.8 mm and width = 1.0 mm) in the primary microchannel, as shown in Figure 1C. The tested microparticle suspension sample was transported in the primary microchannel using a syringe pump. For ODEP-based microparticle manipulation, a function generator (AFG-2125, Good Will Instrument Co., Ltd., New Taipei City, Taiwan) was used to apply an alternating current (AC) bias voltage between the top and bottom ITO/glasses of the ODEP microfluidic chip. A commercial digital projector (EB-X05, Epson, Nagano, Japan) controlled by a computer was used to project light images to the photoconductive material (e.g., intrinsic a-Si:H layer in Layer 4) to generate ODEP force on the manipulated microparticles. In this study, a charge-coupled device (CCD)-equipped microscope (Zoom 160, OPTEM, Fairport, NY, USA) was utilized to observe and record the performance of ODEP-based microparticle manipulation. The setup of the entire system is schematically illustrated in Figure 1C. The picture of the fabricated ODEP chip and measurement system is shown in Figure 1D. A transmission mode imaging setup is obtained by the back-side illumination provided by a projector through the ODEP chip to record images by CCD on the top side. The optical path including the objective lens (e.g., Nikon Plan Fluor 10X, NA = 0.30) equipped in the microscope and the objective lens (e.g., S511012, Arno Electro-Optics Ltd., New Taipei City, Taiwan) equipped in the project is schematically plotted, as shown in Figure S2.
2.2. The Working Mechanism of the Light Screening Membrane
The operation mechanism of ODEP for microparticle manipulation is described in the introduction section and can be derived from the conventional formula of DEP force as listed in Equation (1) [25,26,29]:
FDEP = 2πr3ε0εmRe[fCM]∇|E|2
In Equation (1), r is the radius of the microparticle, ε0 is the vacuum permittivity, εm is the relative permittivity of the surrounding solution, ∇|E|2 is the squared gradient of the electric field, and Re[fCM] is the real part of the Clausius–Mossotti factor (fCM) [25,26,29]. As mentioned above, the photo intensity of illumination patterns projected on the photoconductive material layer of the chip (e.g., Layer 4 of Figure 1B) can be used to modify the force of ODEP [30]. This can be explained by the electric field modification through extra photoinduced carrier generation by illumination, which is proportional to the absorption of the photoconductive material layer [24,31]. The higher illumination intensity causes the generation of additional photoinduced carriers, which reduces the electrical impedance in the light-illuminated region and follows a high surface potential [24,31]. This increased high surface potential induced a high gradient of electric field and follows a high ODEP force, which can be explained by the high ∇|E|2 of Equation (1). Therefore, various illumination intensities of patterns are designed to enhance the operation and collection efficiency of microparticles.
To achieve continuous screening, separation and collection, the design of a fixed screening membrane constructed using different illuminations is determined based on the flow rate of microparticles with different diameters (e.g., PS microparticles with diameters of 15.8, 10.8, and 5.8 μm) in the microfluidics. Due to the fluid movement driven by the syringe pump, PS microparticles also follow the direction but with different drag forces due to the reaction between the surface layer and its volume. When PS microparticles approach the light screening membrane, the negative ODEP force generated by the uniform electrical field from the illumination intensity makes a stop force to flow force, which slows down the PS microparticles [30]. While the negative ODEP force is higher than the drag force by flow rate, PS microparticles are entirely stopped as a function of capture in front of the light screening membrane [22]. In contrast, the negative ODEP force is smaller than the drag force by flow rate, and PS microparticles can pass through the light screening membrane [22]. Due to the positive correlation between particle dimensions (e.g., r3 in Equation (1)) and ODEP force, the larger PS beads have a higher ODEP force compared to smaller PS microparticles. Therefore, the light screening membrane with a lower intensity (e.g., smaller ∇|E|2 generation in Equation (1)) can be used to capture larger PS microparticles with a proper arrangement. In the lower intensity illumination, the ODEP force generated for smaller PS microparticles requires a higher intensity of light screening membrane to be blocked. This operational concept is schematically illustrated in Figure 2A. Based on this mechanism, a design is proposed in the study with multiple light screening membranes of different intensities to separate PS microparticles with multiple dimensions, as shown in Figure 2A. Three areas of light screening membranes with 3 different intensities marked as (I), (II) and (III) from the left to right side of the microfluidics, as shown in Figure 1A and 2A, are used to block PS microparticles of 3 different diameters (e.g., 15.8 μm, 10.8 μm and 5.8 μm). The lowest intensity can be set as the first screening membrane (e.g., area (I)) for the largest PS microparticles (e.g., diameter = 15.8 μm) on the left side. The other PS microparticles with a smaller diameter will pass through area (I) because the induced ODEP force is too small to overcome the flow force. In area (II), the intensity of the light screening membrane is increased to catch and bypass PS microparticles with diameters of 10.8 and 5.8 μm through a similar mechanism. Then, PS microparticles with the smallest diameter (e.g., 5.8 μm) are blocked in area (III) with the highest intensity of light screen membranes.
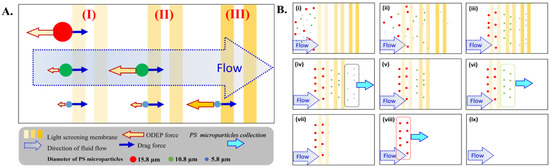
Figure 2.
Schematic plot of the (A) operating mechanism and (B) designed procedures of 3 areas with different light intensities and double light bars in each area. The mixture of 3 types of PS microparticles is shown in B(i). (ii) With light screening membranes, PS microparticles with a small diameter can pass through due to decreased ODEP force generation. (iii) After steady state manipulation, 3 types of PS microparticles are automatically separated into 3 designated areas. (iv) The light bars shown in area (III) are released. (v) Two types of PS microparticles are still isolated in areas (II) and (I). (vi) The light bars shown in area (II) are released. (vii) Only 1 type of PS microparticle is still isolated in area (I). (viii) The light bars shown in area (I) are released. (ix) all PS microparticles are flushed out.
This dynamic operation is schematically shown in Figure 2B(i–iii). After the separation of 3 types of PS microparticles, the light screen membranes in area (III) can be removed to release the smallest PS microparticles without ODEP force blocking, as shown in Figure 2B(iv). After the smallest PS microparticles flow away, as shown in Figure 2B(v), the light screen membranes in area (II) can be removed to release the middle-sized PS microparticles, as shown in Figure 2B(vi). Following the same procedure, the smallest PS microparticles can be released to flow by removing the light screen membranes in area (I), as shown in Figure 2B(vii–ix). Using the differences in release time of 3 types of PS microparticles, the various retention time differences among PS microparticles would be beneficial for subsequent collection of PS microparticles of 3 different diameters. With this designed protocol of light screening membranes, PS microparticles of 3 different diameters can be easily separated and collected in a single microfluidic device. The detailed design and operation of this protocol are presented in Section 2.3.
2.3. Screening, Isolation, and Collection of Various-Sized PS Microparticles
Based on the working mechanism presented in Section 2.2, a protocol for virtual light screening membranes with functions of screening, isolation, and collection is proposed in the study by evaluating PS microparticles of 3 different diameters, including 15.8 μm (No. 100247-10, Microspheres-Nanospheres, Corpuscular Inc., New York, NY, USA), 10.8 μm (No. 100243-10, Microspheres-Nanospheres, Corpuscular Inc., New York, NY, USA), and 5.8 μm (No. 100231-10, Microspheres-Nanospheres, Corpuscular Inc., New York, NY, USA). First, PS microparticles of 3 different diameters were mixed and replaced with prepared low conductivity solution (e.g., distilled water with 0.05% BSA; conductivity: 6.5~8.0 μS min−1) to wash and replace the original storage solution. The mixture of PS microparticles of 3 different diameters was suspended in 100 μL of the prepared low conductivity solution. Then, 2 μL of this mixed sample was loaded into a hole of the ODEP chip, as shown in Figure 1A, using a syringe pump (Fusion 200, Chemyx, Stafford, TX, USA). As shown in Figure 2B(i,ii), the mixed sample can be pushed into the microfluidic device at a stable speed by the control with a syringe pump. The designed light screening membranes were generated by the projector and focus setup in the area of microfluidics for 3 different areas, as shown in Figure 1A. The ODEP force generated by light intensity was investigated for PS microparticles of 3 different diameters separately to determine the optimized conditions for the separation of PS microparticles. The intensity modification of light screening membranes was achieved by the simple and reliable transparency setting in PowerPoint software and following projection adjustment to microfluidics by the projector. To generate the gradient of intensity, light screening membranes are defined as a white color pattern with different levels of transparency in a black slide background. The color brightness of the pattern can be modified by setting the transparency of the white color in the PowerPoint file. To confirm the relationship between illumination intensities and pattern color brightness, the intensity of the light screening membranes was measured using a thermopile laser power detector (XLP12-3S-H2-D0, GENTEC-EO, Quebec City, QC, Canada). With the maximum and minimum brightness of white and black color patterns (i.e., the white and black pattern transparency settings are 0% and 100%, respectively), the illumination intensity in the location of the microfluidics chip is 3.25 and 0.43 mW/cm2, respectively. In addition, the corresponding light intensity and the color brightness ratio are shown in Figure S3. An approximately linear correlation (R2 = 0.98) was observed, representing a good index to evaluate and control light intensity for ODEP manipulation. After confirming the basic correlation between the color brightness ratio and light intensity, various light screening membranes can be generated easily by settings in the PowerPoint file to determine the feasibility of separating and screening for PS microparticles of 3 different diameters. The entire procedure of all experiments was recorded using optical microscopy and CCD as a video. The recovery rate and isolation purity were calculated by the number of PS microparticles of 3 different diameters using various light screening membranes, as described in Section 2.2.
2.4. Evaluation of ODEP-Based Microparticle Manipulation Performance
To have good control and efficiency of light screening membranes, the light intensity-induced ODEP force was investigated using the concept of ODEP manipulation force, which is the net force between the ODEP and friction forces working on the manipulated microparticle. The detailed protocol was experimentally performed according to published literature [22,25,26]. In steady-state microfluidics under a continuous flow, the movement of a microparticle is controlled by the effective force between the viscous drag of the fluid and the generated ODEP manipulation force. The hydrodynamic drag force of a moving microparticle according to Stokes’ law is as follows:
F = 6πrηv
In Equation (2), r is the microparticle radius, η is the fluidic viscosity, and v is the velocity of a moving microparticle. In a given solution, the properties of microparticle and light intensity, the ODEP force is determined. Using a moving light image with the same light intensity, the ODEP force remains constant, but the drag force increases with the velocity of a moving microparticle. With the increasing velocity of the moving light image, the drag force finally becomes larger than the ODEP force, which induces a microparticle out of the control of the light image and its ODEP force. The maximum velocity of a moving light image that can manipulate such a microparticle can be determined as the ODEP manipulation velocity in this study [22,25,26]. In an experimental setting, a rectangular light bar with a width of 100 µm was moved at a control velocity from 400 to 20 µm/s to confirm the ODEP manipulation velocity of each light intensity and the PS microparticles of different diameters, including 15.8, 10.8 and 5.8 μm.
2.5. Statistical Analysis
The data from separate experiments are presented as the mean ± the standard deviation. One-way analysis of variance (ANOVA) was applied to evaluate the significant influence of the conditions tested on the outcomes. Tukey’s honestly significant difference (HSD) post hoc test was then utilized to check differences between the two conditions explored when the null hypothesis of ANOVA was rejected.
3. Results and Discussion
3.1. ODEP Manipulation Performance of PS Microparticles in Response to Different Light Intensities
Before evaluating the light screening membrane, the diameter of these types of PS microparticles was measured using a CCD and the associated software for microparticles numbers greater than 30. The results are shown in Figure 3A. The measured diameters of these three types of PS microparticles were 15.11 ± 0.36, 10.33 ± 0.42, and 5.51 ± 0.36 μm for 15.8, 10.8, and 5.8 μm PS microparticles, respectively. The p value was less than 0.05. No overlapping diameter region was observed, indicating decreased interference in the ODEP manipulation. Based on our previous findings [28], the basic conditions were selected as 10 Vpp and 1.5 MHz for the chip bias condition and rectangular light bar with a maximum light intensity of 3.25 mW cm−2 for ODEP manipulation. As shown in Figure 3B, the ODEP manipulation velocity was 185.1 ± 14.0, 136.8 ± 19.3, and 73.6 ± 12.3 μm/s for PS microparticles of three different diameters, including 15.8, 10.8, and 5.8 μm PS microparticles, respectively. A significant difference among the three groups was found at p < 0.05. This positive correlation between diameter and ODEP manipulation velocity meets the expectation from Equation (1). A larger ODEP force is induced by a larger diameter of PS microparticles and the subsequent higher manipulation velocity.
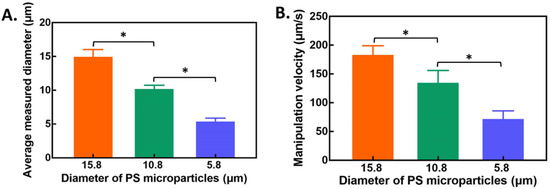
Figure 3.
(A) The diameter of 3 types of PS microparticles measured using CCD software. (B) ODEP manipulation velocity of the types of PS microparticles. All results are presented as the mean ± standard deviation of at least 3 separate experiments. (NS: no significance, and *: significant difference (p < 0.05).
To investigate the correlation between light intensity and the proper manipulation for three types of PS microparticles, various light intensities of rectangular light bars were examined in advance to test the ODEP manipulation velocity for its ODEP force separately. The color brightness of the rectangular light bar was modified as described in Section 2.3. Based on Figure S3, adjustment of the transparency setting in the PowerPoint file can be used to reliably control the color brightness and corresponding light intensity. To facilitate understanding, descriptions of light intensity are all presented by the color brightness in the subsequent sections. As shown in Figure 4A–C, the ODEP manipulation velocity of various color brightness settings of rectangular light bars is presented for PS microparticles with diameters of 15.8, 10.8 and 5.8 μm. A clear trend of the ODEP manipulation velocity decreasing with decreasing color brightness was observed for all three types of PS microparticles, which meets the expectation of the ODEP operation mechanism, as described in Section 2.2. As shown in Figure 4A, the ODEP manipulation velocity of PS microparticles with a diameter of 15.8 μm was 185.1 ± 14.0, 173.8 ± 15.2, 145.3 ± 17.4, 94.9 ± 14.3, 64.6 ± 18.2, and 49.2 ± 17.4 μm/s for color brightnesses of 100%, 90%, 80%, 70%, 60%, and 50%, respectively. With a color brightness of 40%, the ODEP manipulation velocity was less than the minimum setting of 20 µm/s in this experimental design, as described previously in Section 2.4. Similar testing results of PS microparticles with a diameter of 10.8 μm are shown in Figure 4B. Significant differences were found between groups of different color brightnesses. The ODEP manipulation velocity of PS microparticles with a diameter of 10.8 μm was 136.8 ± 19.3, 125.7 ± 21.6, 106.8 ± 17.3, 59.5 ± 8.1, and 38.9 ± 14.4 μm/s for color brightnesses of 100%, 90%, 80%, 70%, and 60%, respectively. At the same color brightness, the ODEP manipulation velocity of PS microparticles with a diameter of 10.8 μm at different color brightness values was smaller than that at 15.8 μm. The lowest color brightness was observed as 60% for PS particles with a diameter of 10.8 μm due to an ODEP manipulation velocity less than 20 µm/s. These behaviors are well explained by the ODEP force decreasing with the diameter of the PS microparticle and light intensity controlled by the setting of color brightness. For PS microparticles with a diameter of 5.8 μm, the ODEP manipulation velocity was 73.6 ± 12.3 and 70.2 ± 13.6 μm/s for 100% and 90% image color brightness with p > 0.05, respectively. With a color brightness less than 80%, the ODEP manipulation velocity was clearly significantly reduced (p < 0.05). The ODEP manipulation velocities were 52.3 ± 11.8, 33.6 ± 11.5, and 21.7 ± 5.6 μm/s for 80%, 70%, and 60% of image color brightness, respectively. Based on these results, the modification of color brightness was confirmed to have a different ODEP force from light intensity and its ODEP manipulation velocity.
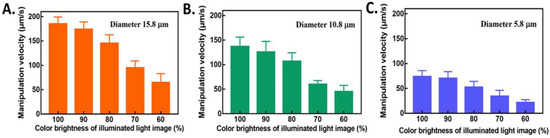
Figure 4.
Evaluation of the ODEP manipulation velocity versus the setting of color brightness in the PowerPoint file for PS microparticles with diameters of (A) 15.8, (B) 10.8 and (C) 5.8 μm. The results are presented as the mean ± standard deviation of at least 3 separate experiments.
3.2. The Combination of Light Screening Membranes
Based on the results of Figure 3 and Figure 4, the proper light intensity defined by the color brightness of the PowerPoint setting demonstrates different ODEP forces for PS microparticles of different diameters. To compare the overall behaviors of the three types of PS microparticles, the ODEP manipulation velocity can be considered a representative factor on a fair baseline. The proper combination of light intensity is investigated and used to construct the light screening membrane for subsequent size-dependent PS microparticle isolation in this section. As mentioned previously, the straight primary microchannel was designed to minimize the cost and complexity of the ODEP chip. Therefore, a single syringe pump was used to control the movement of PS microparticles in the primary microchannel, as shown in the schematic illustration in Figure 2A. As clearly shown in Figure 4, the lowest ODEP manipulation velocity of the same color brightness was observed for PS microparticles with a diameter of 5.8 μm. To catch all of them, the maximum color brightness with the largest ODEP manipulation force was defined to overcome the flux force and follow the highest capture rate in area (III). As shown in Figure 4C, the highest ODEP manipulation velocity of PS microparticles with a diameter of 5.8 μm was 73.6 ± 12.3 μm/s, which was also the maximum color brightness. To obtain the actual flow velocity of all three types of PS microparticles, the fluid rate given by the syringe pump was modified from 0.3, 0.4, and 0.5 μL/min to determine the velocity of different PS microparticles. The correlation between the fluid rate given by the syringe pump versus the actual flow rate of PS microparticles is shown in Figure S4. The velocities of the 5.8 μm PS microparticles were 34.1 ± 3.2, 76.6 ± 5.3, and 80.0 ± 13.9 μm/s for fluid flows of 0.3, 0.4, and 0.5 μL/min, respectively. Therefore, the fluid rate given by the syringe pump was selected as 0.3 μL/min to have a moving velocity of PS microparticles with a diameter of 5.8 μm less than the ODEP manipulation velocity of 73.6 ± 12.3 μm/s under a color brightness of 100% with an acceptable throughput efficiency. At 0.3 μL/min, the moving velocities of PS microparticles with diameters of 15.8 and 10.8 μm were 43.1 ± 1.9 and 46.6 ± 7.4 μm/s, respectively. Therefore, the setting of color brightness to catch and release PS particles of diameters of 10.8 and 5.8 μm should be in the range of ODEP manipulation velocities higher than 46.6 ± 7.4 μm/s and lower than the ODEP manipulation velocity of PS particles with a diameter of 5.8 μm. Therefore, the color brightness was selected as 70%, which has an ODEP manipulation velocity of 59.5 ± 8.1 μm/s to catch PS particles with diameters of 10.8 μm and 33.6 ± 11.5 μm/s to release PS particles with diameters of 5.8 μm. In the meantime, the color brightness was selected as 60%, which has an ODEP manipulation velocity of 64.6 ± 18.2 μm/s to catch PS microparticles with a diameter of 15.8 μm. Under this condition, PS microparticles with diameters of 10.8 and 5.8 μm cannot be caught due to ODEP manipulation velocities of 38.9 ± 14.4 and 21.7 ± 5.6 μm/s, respectively, which are both lower than the moving velocity of PS microparticles at a fluid flow of 0.3 μL/min. Screening membranes of 60%, 70% and 100% were established from the right to left side as areas (I), (II) and (III), as shown in Figure 5A, to capture PS microparticles with diameters of 15.8, 10.8 and 5.8 μm, respectively.
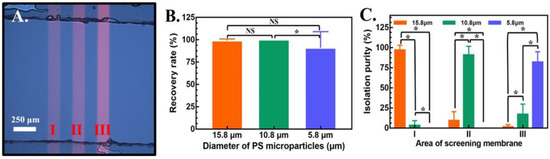
Figure 5.
(A) Image of the single light-bar design in areas (I), (II) and (III). The color brightness of each area is set as 60%, 70% and 100% from the left to right side. (B) Recovery rate of 3 different types of PS microparticles and (C) isolation purity of each area in the compact light screening area. The results are presented as the mean ± standard deviation of at least 3 separate experiments. (NS: no significance, and *: significant difference (p < 0.05).
Based on the design of light screening membranes in areas (I), (II) and (III), the recovery rate and isolation purity of PS microparticles with diameters of 15.8, 10.8, and 5.8 μm and a fixed fluid rate of 0.3 μL/min were investigated. Based on the video recorded by the CCD and microscope, images with PS microparticles were observed and analyzed. The recovery rate of PS microparticles of different diameters was defined as 100% minus the ratio of the total missing number divided by the total number of PS microparticles with the same diameter in a light screening membrane. On the other hand, to determine the ability of the screening membrane in each light area (e.g., (I), (II) and (III)), a parameter named isolation purity was defined as the total number of each kind of captured PS microparticles with a specific diameter to the total number of PS microparticles. As shown in Figure 5B, the recovery rates were 99.0 ± 1.9, 100 ± 0.0, and 90.0 ± 18.2% for 15.8, 10.8, and 5.8 μm PS microparticles, respectively, captured by a light screening membrane. It was clearly observed that the recovery rate approached 100% for 15.8 and 10.8 μm PS microparticles. To study the details of the recovery rate of the entire design with the mixture of three types of PS microparticles and three light screening membranes, the isolation purity in each area was calculated, as shown in Figure 5C. PS microparticles captured in area (I) captured 96.9 ± 6.3%, 3.1 ± 6% and 0% for diameters of 15.8, 10.8 and 5.8 μm, respectively. In area (II), PS microparticles with diameters of 15.8, 10.8 and 5.8 μm captured 9.3 ± 11%, 90.7 ± 11.2% and 0%, respectively. The isolation purity of area (III) was 1.3 ± 3%, 16.8 ± 13% and 81.9 ± 13.4% for diameters of 15.8, 10.8 and 5.8 μm, respectively. The separation of PS microparticles with specific diameters can be efficiently performed in three categories. The isolation purity of these proposed light screening membranes with adjustments of intensity, with the advantages of being fast, simple and with high throughput, achieved greater than 80% for a mixture for three types of PS microparticles.
Some losses in the isolation of PS microparticles with diameters of 10.8 and 5.8 μm indicate a possibility for improvement. Therefore, the number of light screening membranes in each area was increased from one to two in the upgraded design, as shown in Figure 6A. As shown in Figure 6B, the recovery rates were 100 ± 0.0%, 100 ± 0.0% and 95.1 ± 1.6% for PS microparticles with diameters of 15.8, 10.8 and 5.8 μm, respectively. In addition, the isolation purity of this upgraded design captured 98.1 ± 3.2% of PS microparticles with a diameter of 15.8 μm in area (I), 94.4 ± 9.6% for PS microparticles with a diameter of 10.8 μm in area (II), and 98.6±2.5% for PS microparticles with a diameter of 5.8 μm in area (III), as shown in Figure 6C. Isolation purity was dramatically increased with the design of two light bars in each area, especially for PS microparticles with a diameter of 5.8 μm. The increment was approximately 16% and achieved a final isolation purity greater than 98%. With this optimized design, the recovery rate and isolation purity of all three types of PS microparticles were all close to 100%, which can be considered a candidate for real applications. After the isolation of three types of PS microparticles, the release of each type of PS microparticle was easily performed by removing light bars in each area separately in the PowerPoint file. A video of the compact light screening membrane operation is shown in the supplemental material. In summary, the proper intensity of light screening membranes was easily obtained by modifying the color brightness in the PowerPoint file in three areas (e.g., 60%, 70%, and 100%) for the separation and collection of three types of PS microparticles (e.g., diameters of 15.8, 10.8 and 5.8 μm), respectively. To achieve high isolation purity, the light bar number of each area can be increased to two. With this optimized design, a mixture of PS microparticles with diameters of 15.8, 10.8, and 5.8 μm were separated within 2 min with a high recovery rate and isolation purity of 95.1~100% and 94.4~98.6%, respectively, in this study. The limitations of conventional physical filter membranes, including blocking, low efficiency, low through put and poor reusability, can be improved using this proposed light screening membrane. Further studies based on light screening membranes, such as small-volume biomedical samples, including CTCs, bacteria in blood and various cells with drug resistance, represent future applications of this method.
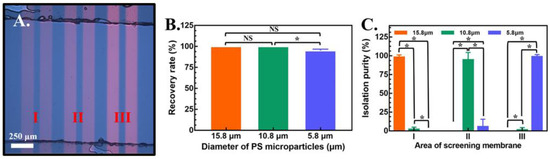
Figure 6.
(A) Image of the double light-bar design in areas (I), (II) and (III). The color brightness of each area is set as 60%, 70% and 100% from the left to right side. (B) Recovery rate of 3 different kinds of PS microparticles and (C) isolation purity of each area in the compact light screening area. The results are presented as the mean ± standard deviation of at least 3 separate experiments. (NS: no significance, and *: significant difference (p < 0.05).
4. Conclusions
In this study, the concept of virtual filter membranes based on ODEP manipulation and specific design was proposed as a light screening membrane. With the natural behavior of dimension-determined and light-regulated ODEP force generated on PS microparticles, the light screening membrane constructed using sequential light bars of suitable color brightness setting was confirmed to separate three types of PS microparticles (e.g., diameter of 15.8, 10.8 and 5.8 μm) with very high efficiency of isolation purity in a single straight microfluidic channel. Using systematic experiments and analysis, the color brightness of three specific areas was adjusted to 60%, 70% and 100% for the isolation of PS microparticles with diameters of 15.8, 10.8 and 5.8 μm, respectively. The separation procedure from the mixture of 3 types of PS microparticles was finished within 2 min, and a high recovery rate and isolation purity of 95.1~100% and 94.4~98.6%, respectively, was achieved. This proposed light screening membrane can be further applied in the separation of small-volume biomedical samples, including CTCs, bacteria in blood and various cells, in the future.
Supplementary Materials
The following supporting information can be downloaded at: https://www.mdpi.com/article/10.3390/chemosensors10120540/s1, Figure S1 The picture of microchannel fabricated using manual cutting with a custom-made metal mold in double-sided adhesive tape. Figure S2 The schematic plot of optical setup including the optical path and objective lens fixed in the projector. Figure S3: Light intensity versus the setting of color brightness in the PowerPoint file. Figure S4: The actual velocity of 3 types of PS microparticles versus the fluid rate supplied by the syringe pump. Video S1: Real-time video of the procedures of the proposed light screening membranes with 3 areas of different light intensities and double light bars in each area.
Author Contributions
Conceptualization, C.-M.Y., C.-H.H. and M.-H.W.; methodology, C.-M.Y., P.-Y.C., C.-H.H. and M.-H.W.; formal analysis, investigation, data curation, and validation, C.-M.Y., A.-Y.W., J.-C.Y., P.-Y.C. and M.-H.W.; visualization, C.-M.Y., A.-Y.W., J.-C.Y. and P.-Y.C., writing—original draft preparation original manuscript writing, C.-M.Y., C.-H.H. and M.-H.W.; writing—review and editing, C.-M.Y., C.-H.H. and M.-H.W.; supervision, C.-M.Y. and M.-H.W. All authors have read and agreed to the published version of the manuscript.
Funding
This work was funded by Chang Gung Memorial Hospital, Taiwan under contract numbers CMRPD2L0171, CMRPD2I0012, CMRPD2L0051, and CMRPD2J0031-33 and the Ministry of Science of Technology of Taiwan under contract numbers MOST: 108-2221-E-182-060-MY3, 108-2628-E-182-002-MY3, 111-2923-E-182-001-MY3, 111-2221-E-182-023-MY3, 110-2221-E-182-030-MY2, and 110-2221- E-182-004-MY3.
Institutional Review Board Statement
Not applicable.
Informed Consent Statement
Not applicable.
Data Availability Statement
Not applicable.
Conflicts of Interest
The authors declare no conflict of interest.
References
- Yu, L.-L.; Zhu, J.; Liu, J.-X.; Jiang, F.; Ni, W.-K.; Qu, L.-S.; Ni, R.-Z.; Lu, C.-H.; Xiao, M.-B. A Comparison of Traditional and Novel Methods for the Separation of Exosomes from Human Samples. Biomed. Res. Int. 2018, 2018, 3634563. [Google Scholar] [CrossRef] [PubMed]
- Hyun, K.-A.; Kim, J.; Gwak, H.; Jung, H.-I. Isolation and enrichment of circulating biomarkers for cancer screening, detection, and diagnostics. Analyst 2016, 141, 382–392. [Google Scholar] [CrossRef] [PubMed]
- Liangsupree, T.; Multia, E.; Riekkola, M.-L. Modern isolation and separation techniques for extracellular vesicles. J. Chromatogr. A 2021, 1636, 461773. [Google Scholar] [CrossRef]
- Sidhom, K.; Obi, P.O.; Saleem, A. A Review of Exosomal Isolation Methods: Is Size Exclusion Chromatography the Best Option? J. Mol. Sci. 2020, 21, 6466. [Google Scholar] [CrossRef] [PubMed]
- Matsuyoshi, Y.; Akahoshi, M.; Nakamura, M.; Tatsumi, R.; Mizunoya, W. Isolation and purification of satellite cells from young rats by percoll density gradient centrifugation. Myogenesis 2018, 1889, 81–93. [Google Scholar] [CrossRef]
- Romano, E.; Rosa, I.; Fioretto, B.S.; Lucattelli, E.; Innocenti, M.; Ibba-Manneschi, L.; Matucci-Cerinic, M.; Manetti, M. A Two-Step Immunomagnetic Microbead-Based Method for the Isolation of Human Primary Skin Telocytes/CD34+ Stromal Cells. J. Mol. Sci. 2020, 21, 5877. [Google Scholar] [CrossRef]
- Zhang, J.; Song, Z.; Liu, Q.; Song, Y. Recent advances in dielectrophoresis-based cell viability assessment. Electrophoresis 2020, 41, 917–932. [Google Scholar] [CrossRef]
- Moon, H.-S.; Kwon, K.; Kim, S.-I.; Han, H.; Sohn, J.; Lee, S.; Jung, H.-I. Continuous separation of breast cancer cells from blood samples using multi-orifice flow fractionation (MOFF) and dielectrophoresis (DEP). Lab Chip 2011, 11, 1118–1125. [Google Scholar] [CrossRef]
- Gascoyne, P.R.C. Dielectrophoretic-Field Flow Fractionation Analysis of Dielectric, Density, and Deformability Characteristics of Cells and Particles. Anal. Chem. 2009, 81, 8878–8885. [Google Scholar] [CrossRef]
- Stranska, R.; Gysbrechts, L.; Wouters, J.; Vermeersch, P.; Bloch, K.; Dierickx, D.; Andrei, G.; Snoeck, R. Comparison of membrane affinity-based method with size-exclusion chromatography for isolation of exosome-like vesicles from human plasma. J. Transl. Med. 2018, 16, 1–19. [Google Scholar] [CrossRef]
- Liu, Y.; Xu, H.; Li, T.; Wang, W. Microtechnology-enabled filtration-based liquid biopsy: Challenges and practical considerations. Lab Chip 2021, 21, 994–1015. [Google Scholar] [CrossRef] [PubMed]
- Hao, S.-J.; Wan, Y.; Xia, Y.-Q.; Zou, X.; Zheng, S.-Y. Size-based separation methods of circulating tumor cells. Adv. Drug Deliv. Rev. 2018, 125, 3–20. [Google Scholar] [CrossRef] [PubMed]
- Wang, Y.; Zhao, K.; Tong, N.; Wang, J. Separation of microalgae cells in a microfluidic chip based on AC Dielectrophoresis. J. Chem. Technol. Biotechnol. 2022, 98, 140–150. [Google Scholar] [CrossRef]
- Pohl, H.A. The Motion and Precipitation of Suspensoids in Divergent Electric Fields. J. Appl. Phys. 1951, 22, 869–871. [Google Scholar] [CrossRef]
- Brimmo, A.T.; Menachery, A.; Qasaimeh, M.A. Microelectrofluidic probe for sequential cell separation and patterning. Lab Chip 2019, 19, 4052–4063. [Google Scholar] [CrossRef] [PubMed]
- Nguyen, N.-V.; Jen, C.-P. Impedance detection integrated with dielectrophoresis enrichment platform for lung circulating tumor cells in a microfluidic channel. Biosens. Bioelectron. 2018, 121, 10–18. [Google Scholar] [CrossRef] [PubMed]
- Zhang, Z.; Zheng, T.; Zhu, R. Characterization of single-cell biophysical properties and cell type classification using dielectrophoresis model reduction method. Sens. Actuators B Chem. 2020, 304, 127326. [Google Scholar] [CrossRef]
- Reale, R.; De Ninno, A.; Businaro, L.; Bisegna, P.; Caselli, F. A simple electrical approach to monitor dielectrophoretic focusing of particles flowing in a microchannel. Electrophoresis 2019, 40, 1400–1407. [Google Scholar] [CrossRef]
- Jun, S.; Chun, C.; Ho, K.; Li, Y. Design and Evaluation of a Millifluidic Insulator-Based Dielectrophoresis (DEP) Retention Device to Separate Bacteria from Tap Water. Water 2021, 13, 1678. [Google Scholar] [CrossRef]
- Russo, G.I.; Musso, N.; Romano, A.; Caruso, G.; Petralia, S.; Lanzanò, L.; Broggi, G.; Camarda, M. The Role of Dielectrophoresis for Cancer Diagnosis and Prognosis. Cancers 2022, 14, 198. [Google Scholar] [CrossRef]
- Chiou, P.Y.; Ohta, A.T.; Wu, M.C. Massively parallel manipulation of single cells and microparticles using optical images. Nature 2005, 436, 370–372. [Google Scholar] [CrossRef] [PubMed]
- Chu, P.-Y.; Hsieh, C.-H.; Wu, M.-H. The Combination of immunomagnetic bead-based cell isolation and optically induced dielectrophoresis (ODEP)-based microfluidic device for the negative selection-based isolation of circulating tumor cells (CTCs). Front. Bioeng. Biotechnol. 2020, 8, 921. [Google Scholar] [CrossRef] [PubMed]
- Wu, M.C. Optoelectronic tweezers. Nat. Photon. 2011, 5, 322–324. [Google Scholar] [CrossRef]
- Hong, J.-L.; Yang, C.-M.; Chu, P.-Y.; Chou, W.-P.; Liao, C.-J.; Hsieh, C.-H.; Wu, M.-H.; Chen, P.-H. The effect of operating conditions on the optically induced electrokinetic (OEK)-based manipulation of magnetic microbeads in a microfluidic system. Sens. Actuators B Chem. 2019, 296, 126610. [Google Scholar] [CrossRef]
- Chiu, T.-K.; Chao, A.C.; Chou, W.-P.; Liao, C.-J.; Wang, H.-M.; Chang, J.-H.; Chen, P.-H.; Wu, M.-H. Optically-induced-dielectrophoresis (ODEP)-based cell manipulation in a microfluidic system for high-purity isolation of integral circulating tumor cell (CTC) clusters based on their size characteristics. Sens. Actuators B Chem. 2018, 258, 1161–1173. [Google Scholar] [CrossRef]
- Chu, P.-Y.; Liao, C.-J.; Hsieh, C.-H.; Wang, H.-M.; Chou, W.-P.; Chen, P.-H.; Wu, M.-H. Utilization of optically induced dielectrophoresis in a microfluidic system for sorting and isolation of cells with varied degree of viability: Demonstration of the sorting and isolation of drug-treated cancer cells with various degrees of anti-cancer drug resistance gene expression. Sens. Actuators B Chem. 2019, 283, 621–631. [Google Scholar] [CrossRef]
- Chou, W.-P.; Wang, H.-M.; Chang, J.-H.; Chiu, T.-K.; Hsieh, C.-H.; Liao, C.-J.; Wu, M.-H. The utilization of optically-induced-dielectrophoresis (ODEP)-based virtual cell filters in a microfluidic system for continuous isolation and purification of circulating tumour cells (CTCs) based on their size characteristics. Sens. Actuators B Chem. 2017, 241, 245–254. [Google Scholar] [CrossRef]
- Yang, C.-M.; Yu, J.-C.; Chu, P.-Y.; Hsieh, C.-H.; Wu, M.-H. The Utilization of Tunable Transducer Elements Formed by the Manipulation of Magnetic Beads with Different Sizes via Optically Induced Dielectrophoresis (ODEP) for High Signal-to-Noise Ratios (SNRs) and Multiplex Fluorescence-Based Biosensing Applications. Biosensors 2022, 12, 755. [Google Scholar] [CrossRef]
- Valley, J.K.; Jamshidi, A.; Ohta, A.T.; Hsu, H.-Y.; Wu, M.C. Operational regimes and physics present in optoelectronic tweezers. J. Microelectromech. Syst. 2008, 17, 342–350. [Google Scholar] [CrossRef]
- Lin, W.Y.; Lin, Y.H.; Lee, G.B. Contiunous Micro-Particle Separation using Optically-Induced Dielectrophoretic Forces. In Proceedings of the 2009 IEEE 22nd International Conference on Micro Electro Mechanical Systems, Sorrento, Italy, 25–29 January 2009; pp. 47–50. [Google Scholar] [CrossRef]
- Zaman, M.A.; Padhy, P.; Cheng, Y.-T.; Galambos, L.; Hesselink, L. Optoelectronic tweezers with a non-uniform background field. Appl. Phys. Lett. 2020, 117, 171102. [Google Scholar] [CrossRef]
Publisher’s Note: MDPI stays neutral with regard to jurisdictional claims in published maps and institutional affiliations. |
© 2022 by the authors. Licensee MDPI, Basel, Switzerland. This article is an open access article distributed under the terms and conditions of the Creative Commons Attribution (CC BY) license (https://creativecommons.org/licenses/by/4.0/).