
Square-Wave and Cyclic Voltammetry of Native Proanthocyanidins Extracted from Grapevine (Vitis vinifera) on the Glassy Carbon Electrode


Abstract
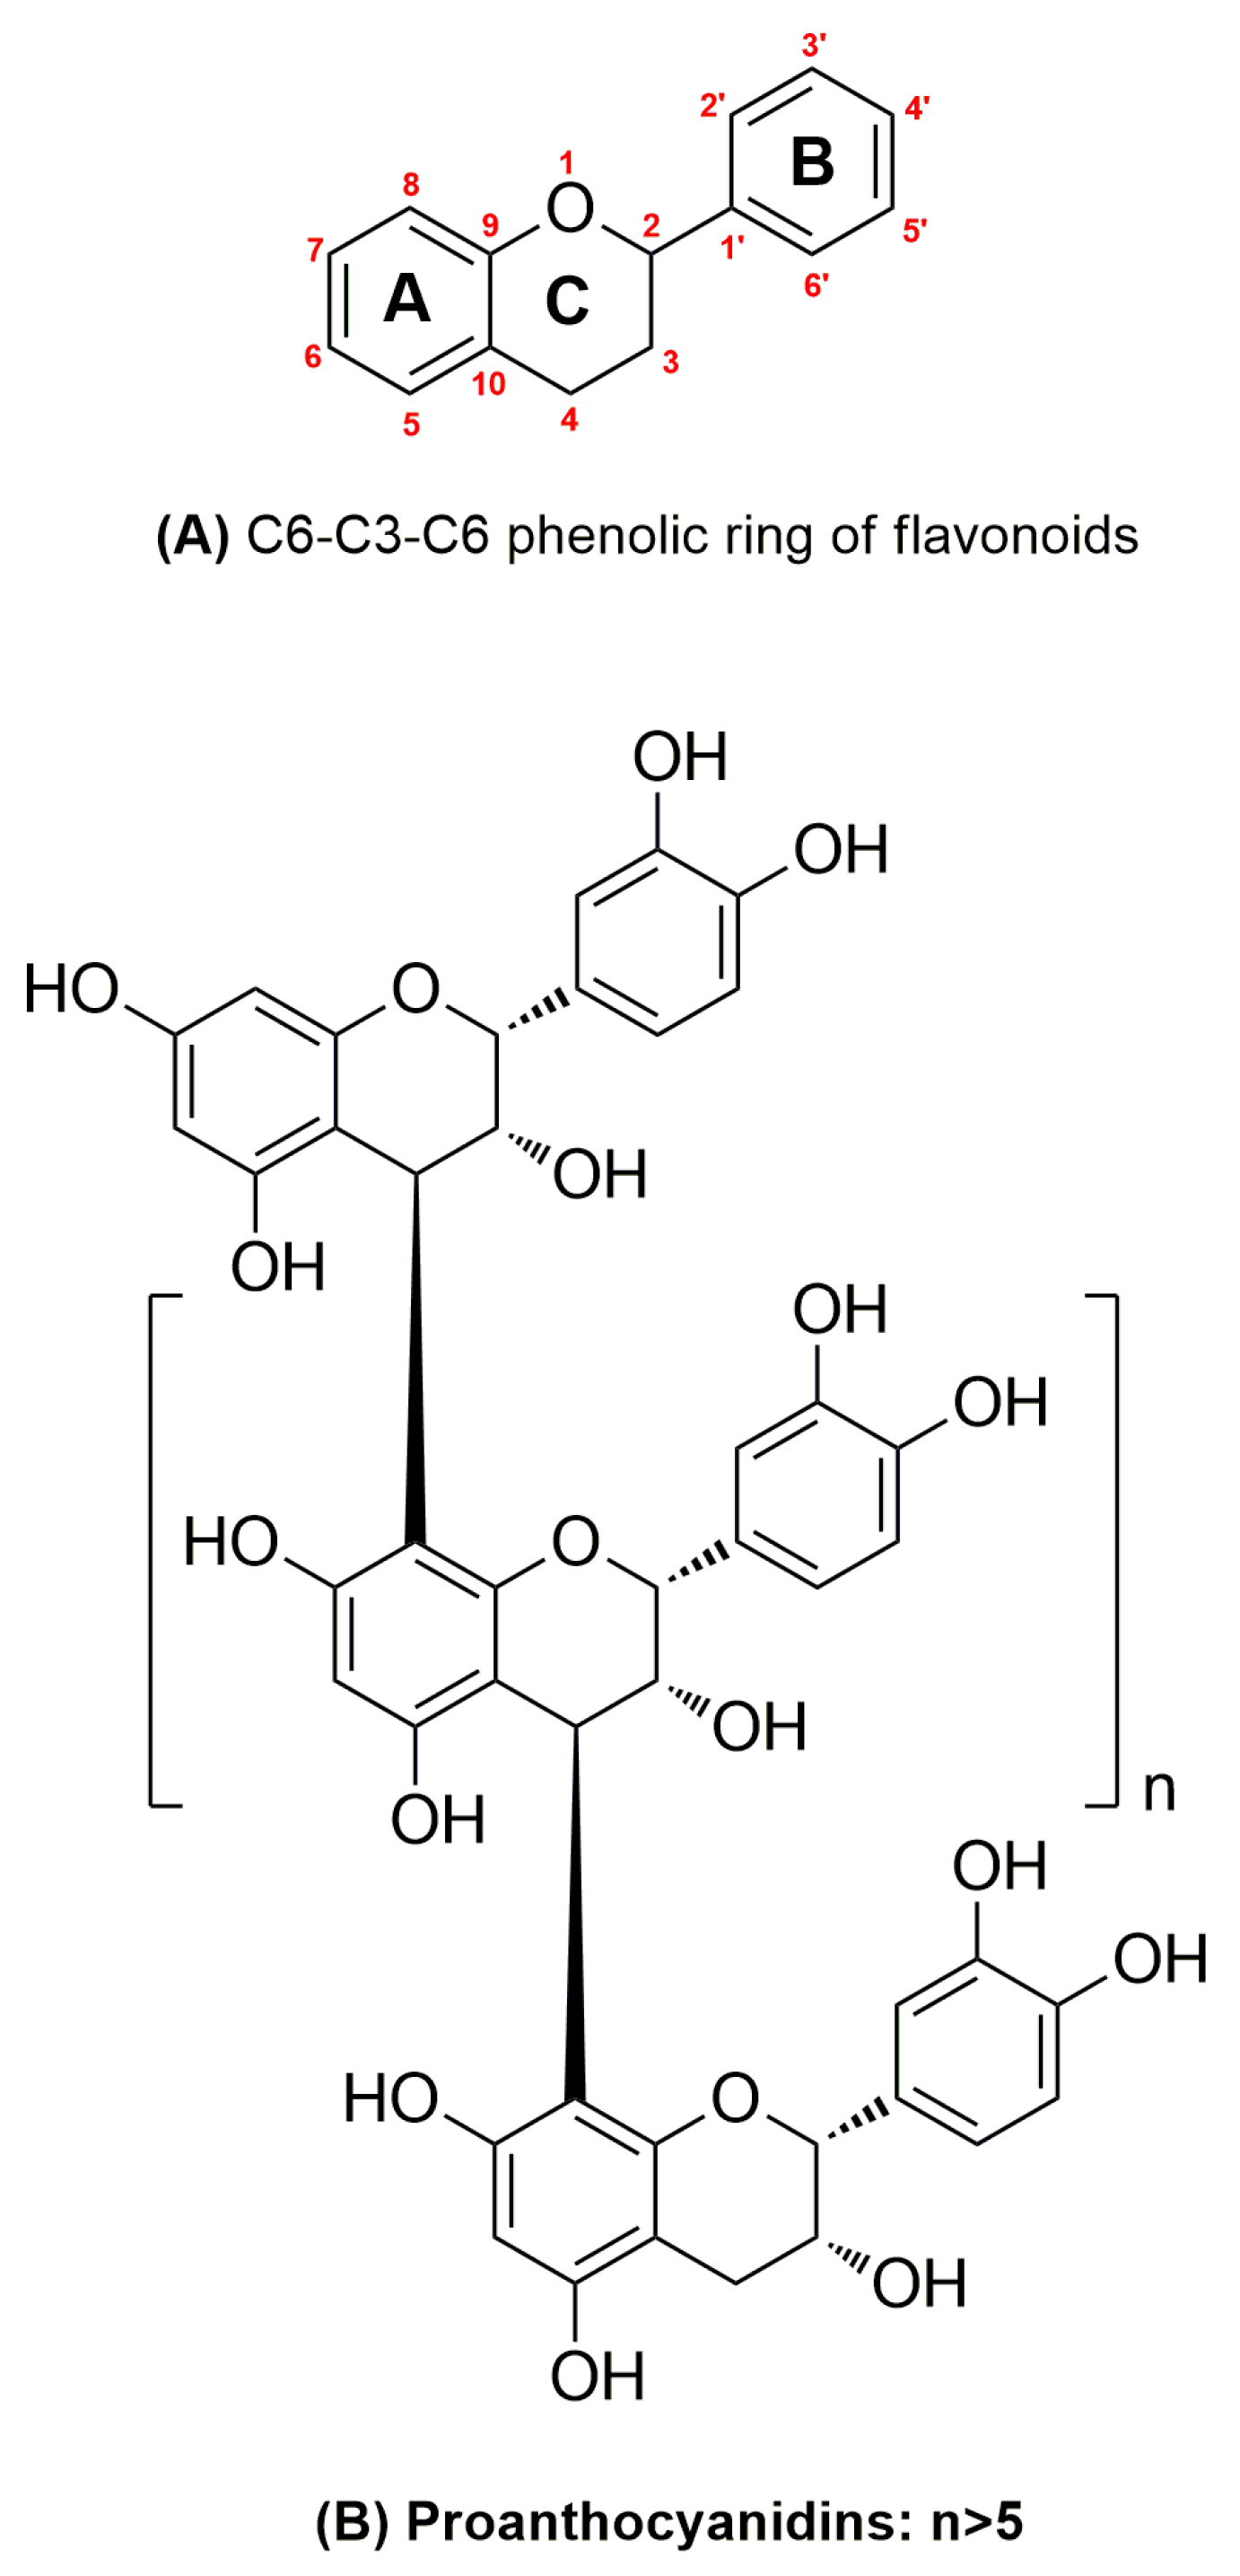
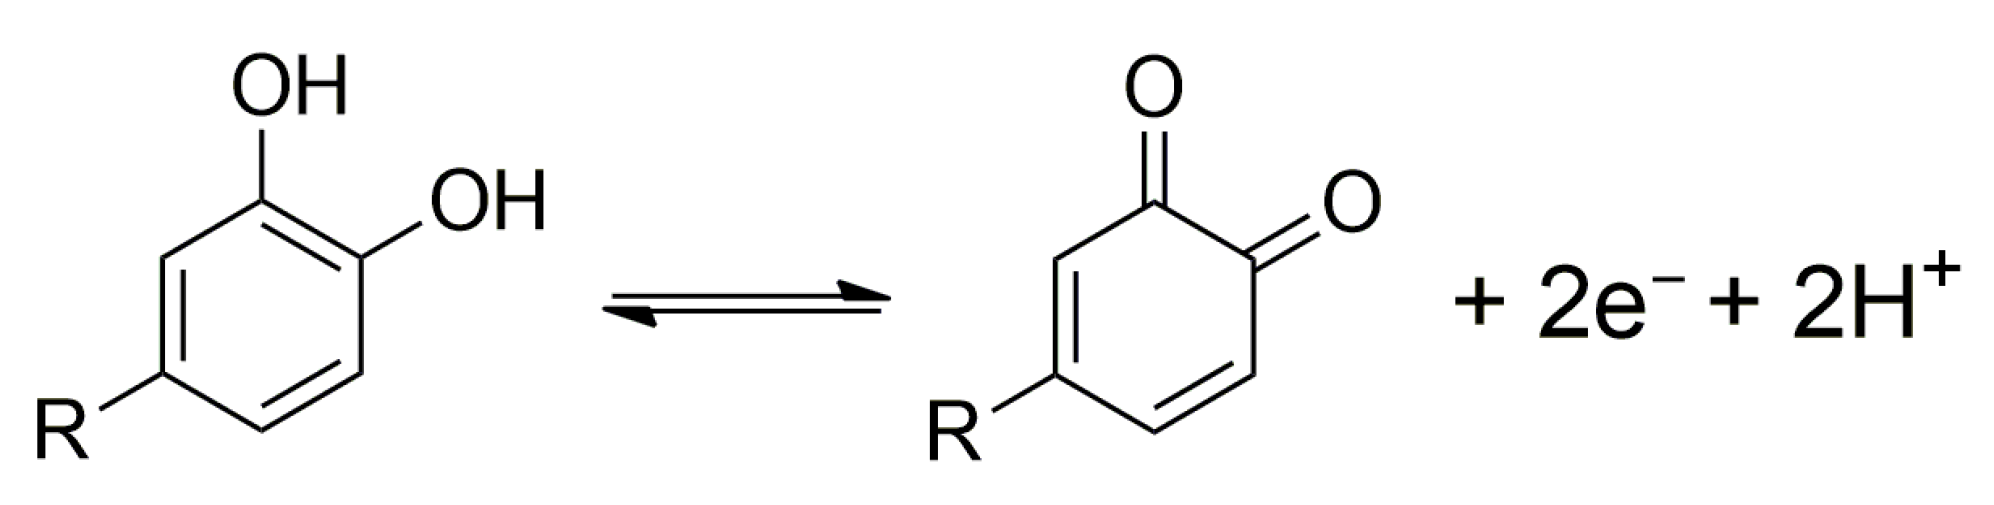
:1. Introduction
2. Materials and Methods
2.1. Chemicals and Solutions
2.2. Instruments
2.3. Plant Material
2.4. Extraction and Purification of Proanthocyanidins (PAs)
3. Results and Discussions
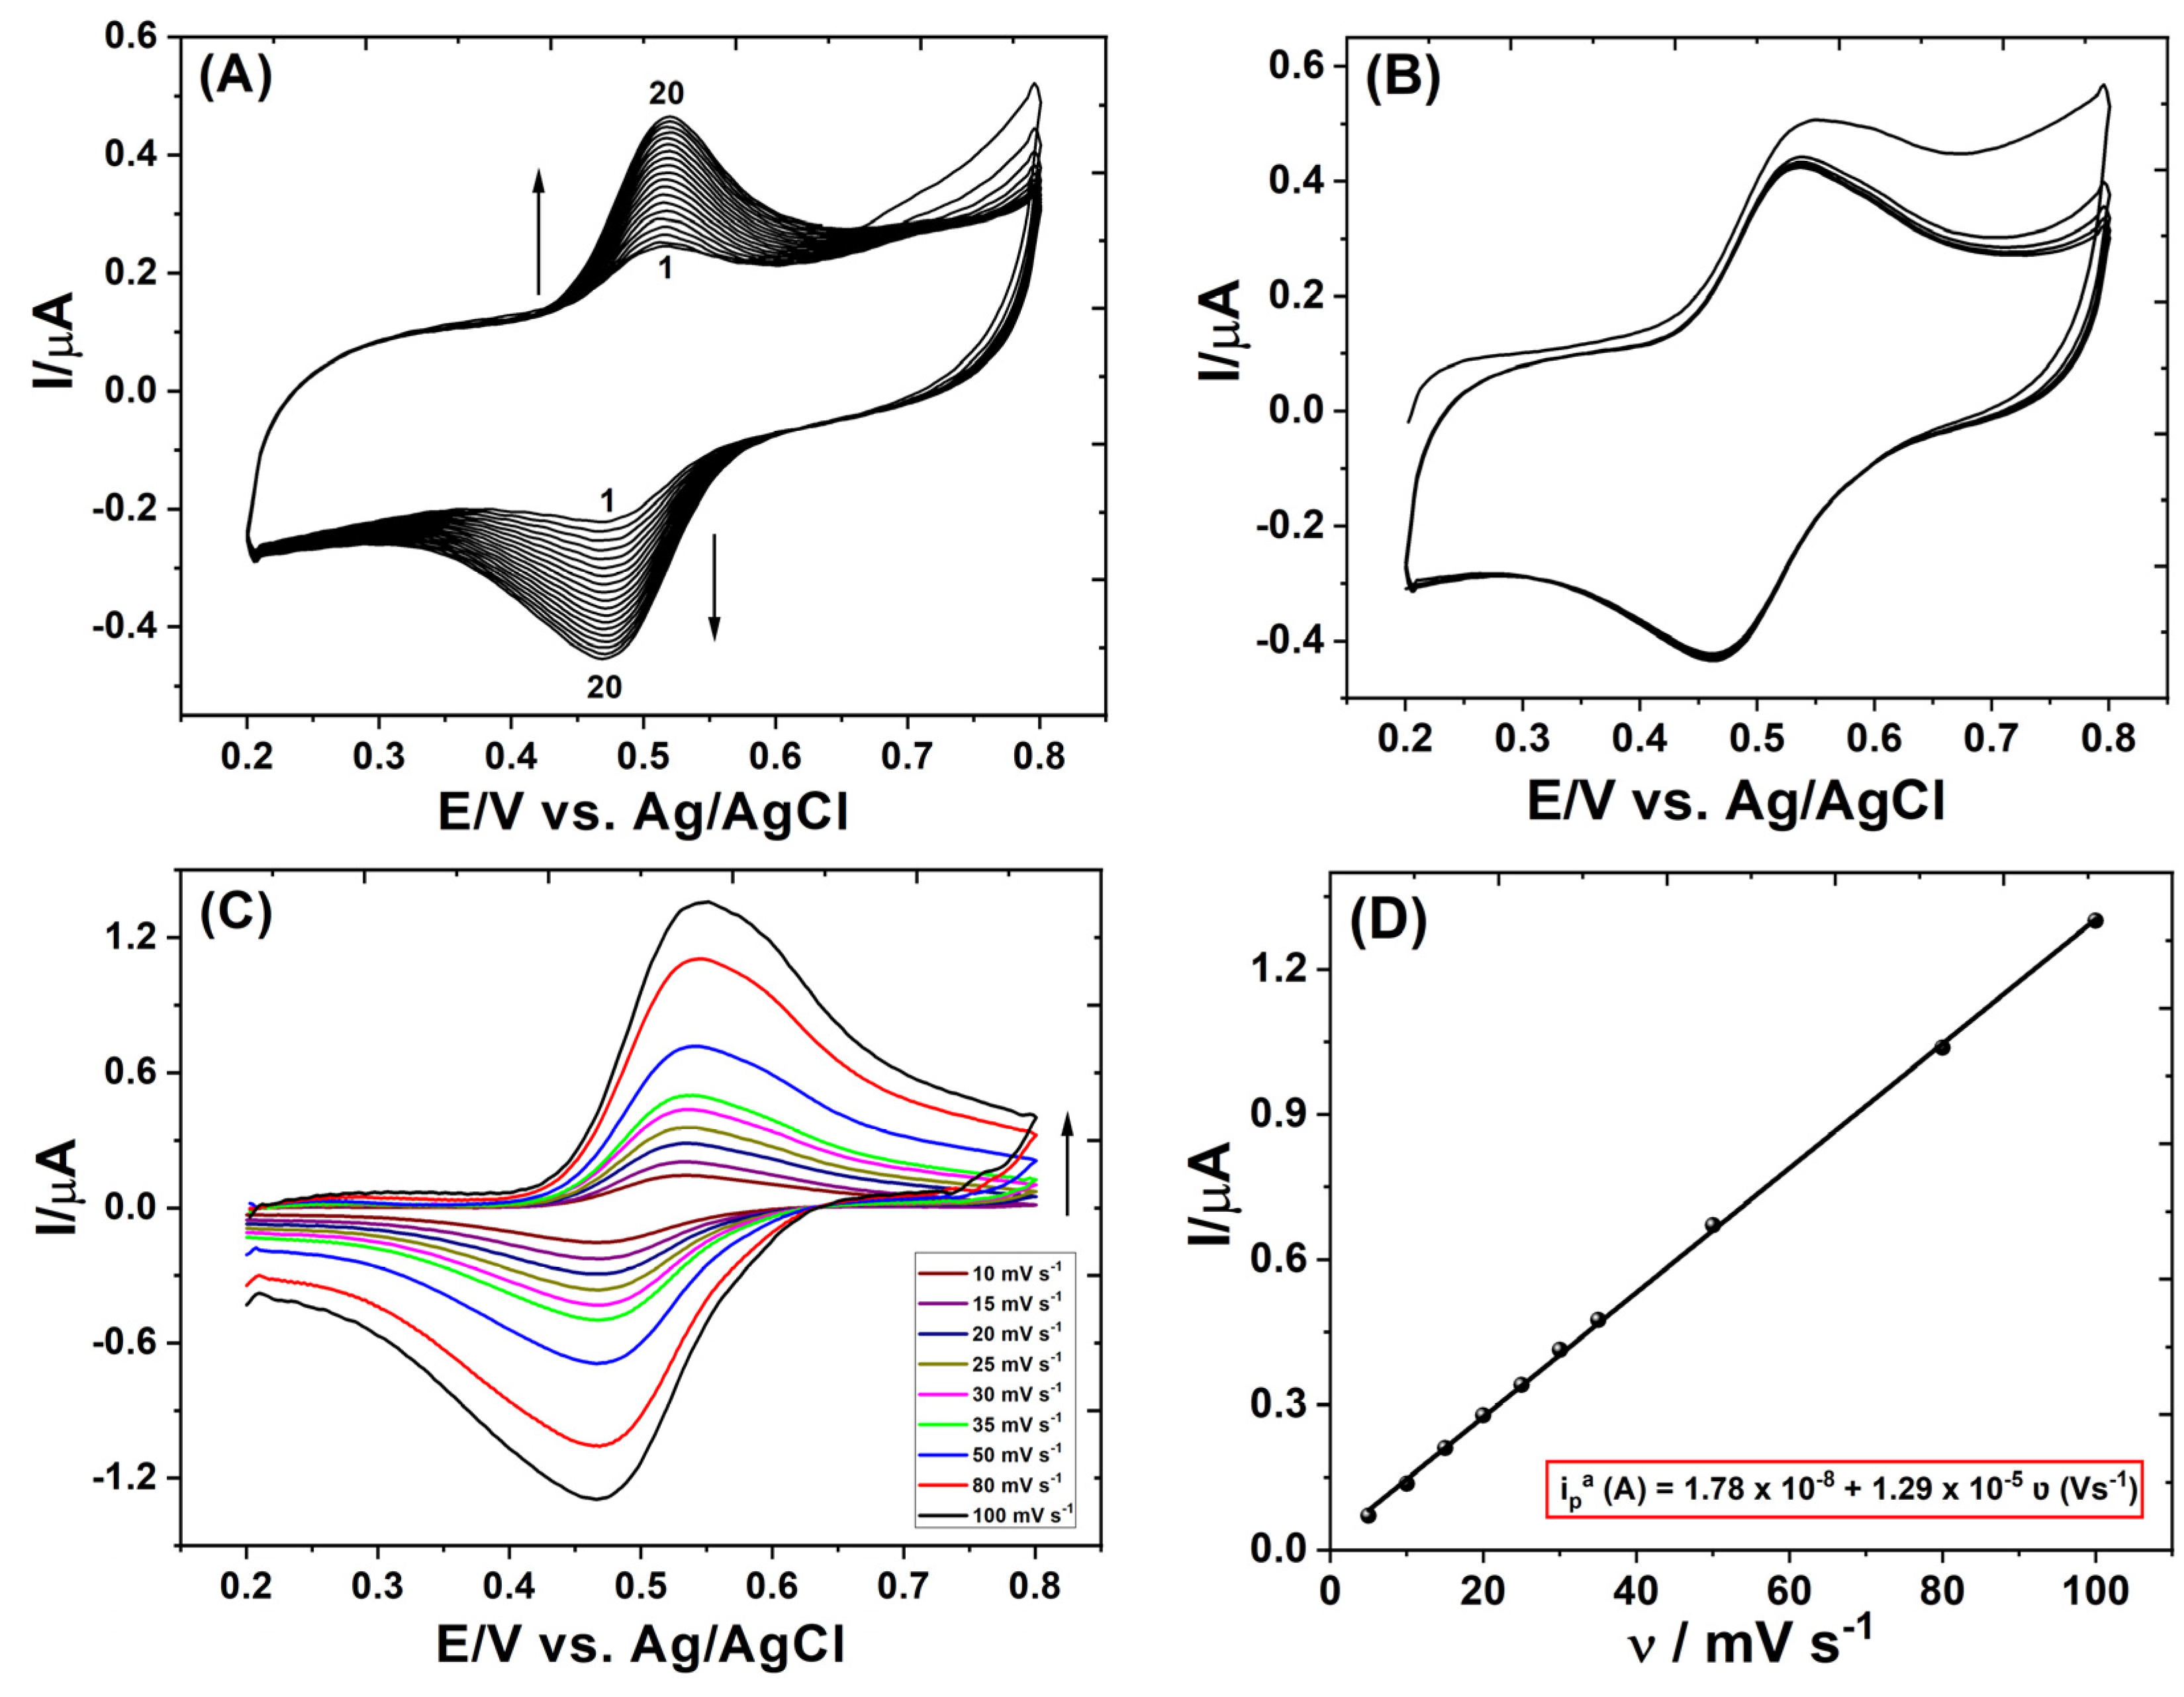
3.1. Voltammetric Behavior of Native Proanthocyanidins
3.2. Repetitive Cyclic Voltammograms of Proanthocyanidins
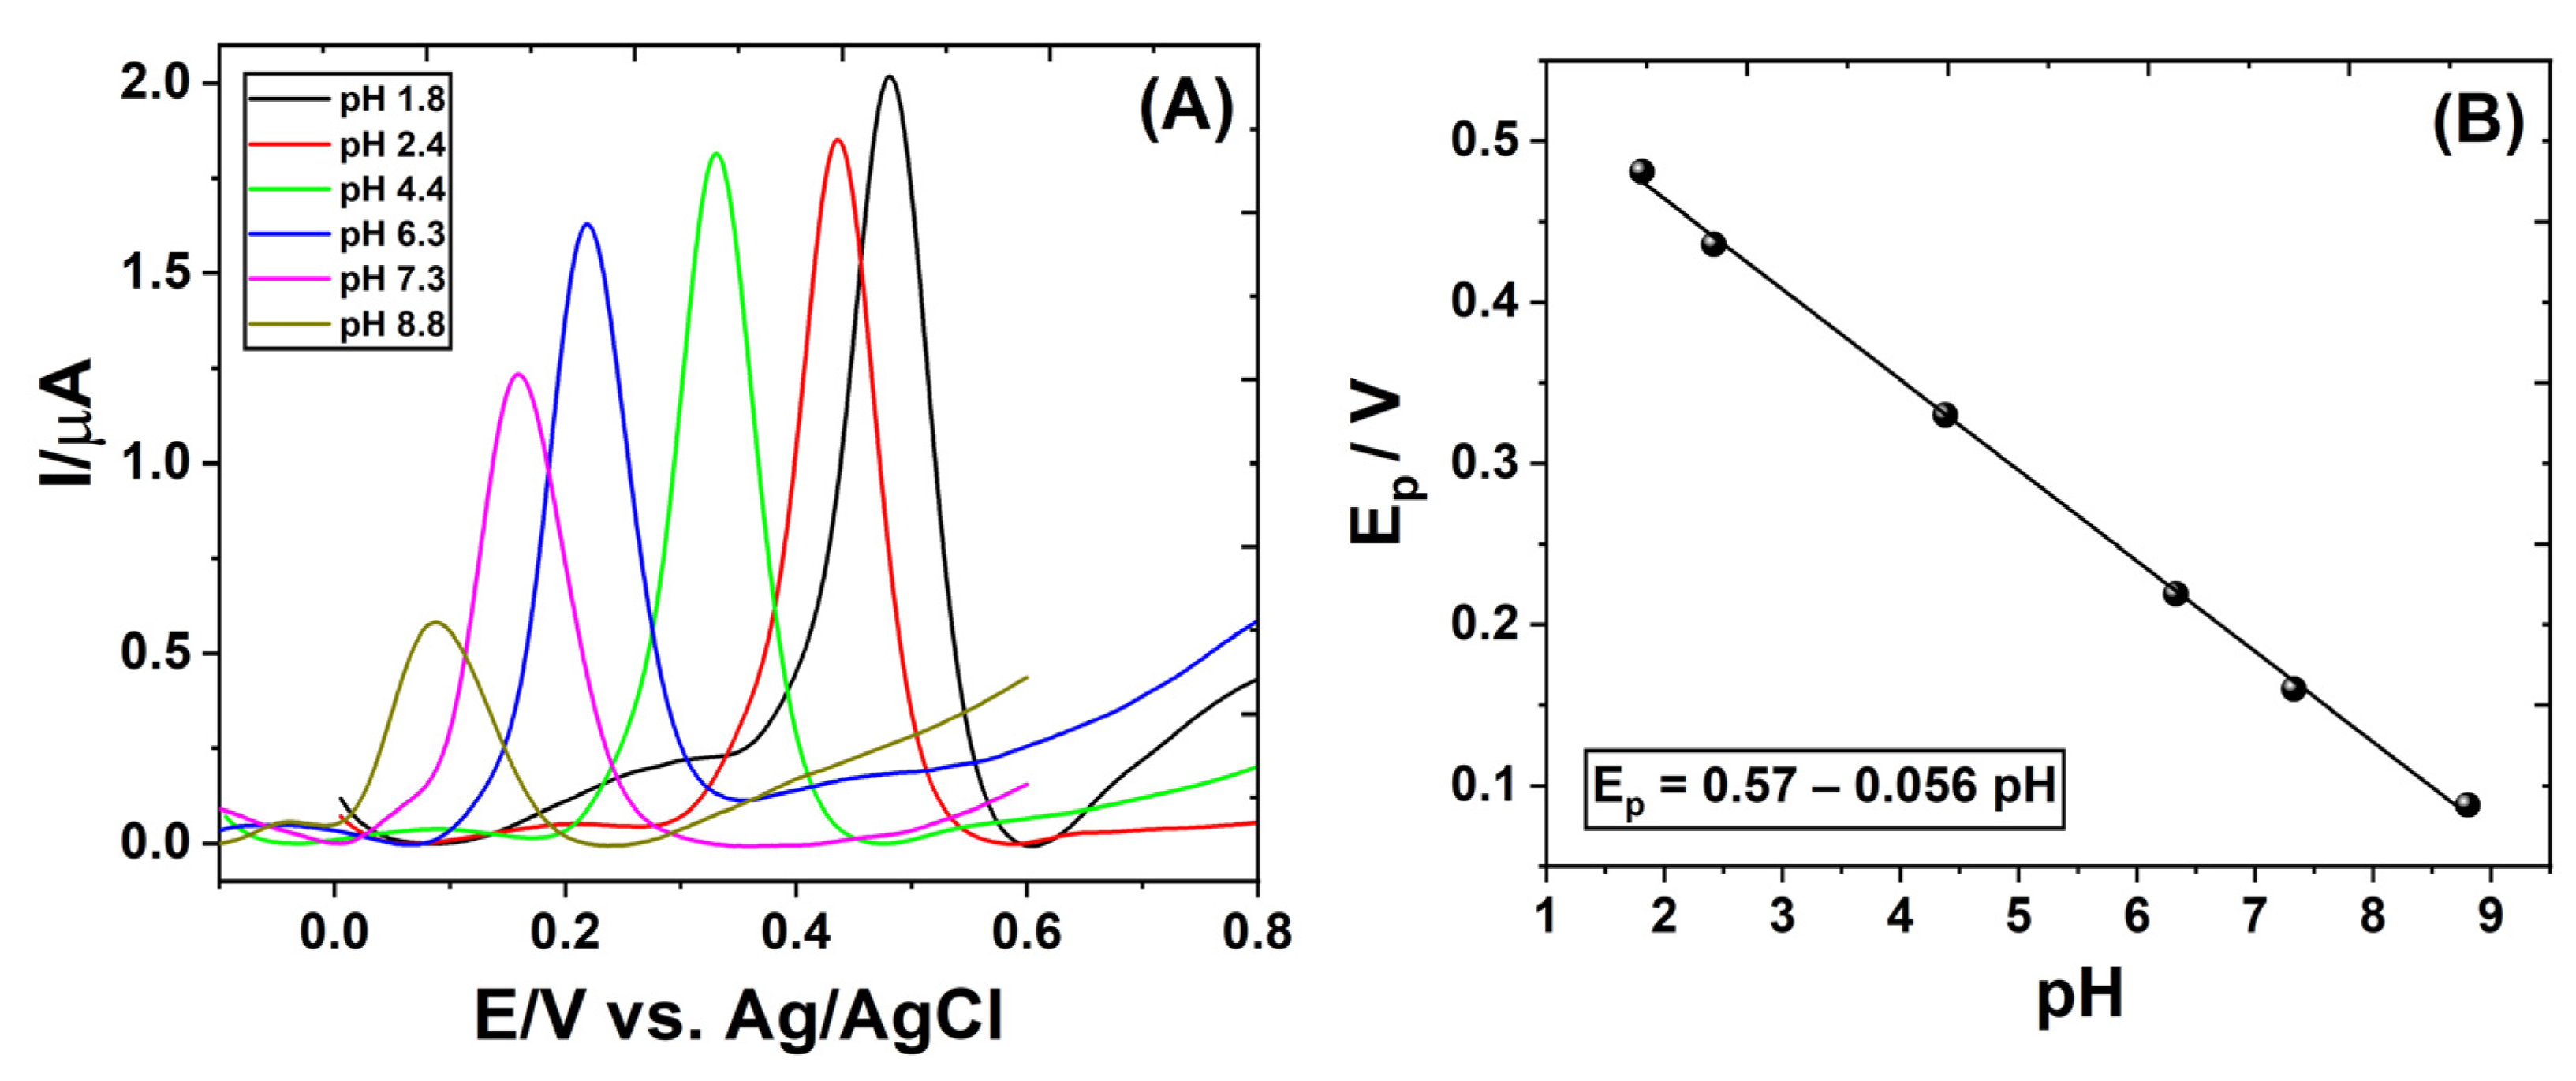
3.3. Effect of pH on the Cyclic Voltammetric Behavior of Proanthocyanidins
3.4. Effect of Proanthocyanidins Concentration and Limit of Detection
4. Conclusions
Author Contributions
Funding
Institutional Review Board Statement
Informed Consent Statement
Data Availability Statement
Acknowledgments
Conflicts of Interest
References
- Crozier, A.; Jaganath, I.B.; Clifford, M.N. Dietary phenolics: Chemistry, bioavailability and effects on health. Nat. Prod. Rep. 2009, 26, 1001–1043. [Google Scholar] [CrossRef] [PubMed]
- Bruyne, T.D.; Pieters, L.; Deelstra, H.; Vlietinck, A. Condensed vegetable tannins: Biodiversity in structure and biological activities. Biochem. Syst. Ecol. 1999, 27, 445–459. [Google Scholar] [CrossRef]
- Quideau, S.; Deffieux, D.; Douat-Casassus, C.; Pouysegu, L. Plant polyphenols: Chemical properties, biological activities, and synthesis. Angew. Chem. Int. Ed. 2011, 50, 586–621. [Google Scholar] [CrossRef]
- Cho, D.; Mattice, W.L.; Porter, L.J.; Hemingway, R.W. Use of the fluorescence quantum yield for the determination of the number average molecular weight of polymers of epicatechin with 4β→8 interflavan bonds. Polymer 1989, 30, 1955–1958. [Google Scholar] [CrossRef]
- Garbacki, N.; Kinet, M.; Nusgens, B.; Desmecht, D.; Damas, J. Proanthocyanidins, from Ribes nigrum leaves, reduce endothelial adhesion molecules ICAM-1 and VCAM-1. J. Inflamm. 2005, 2, 9. [Google Scholar] [CrossRef] [PubMed] [Green Version]
- Yang, F.; Villiers, W.J.S.; McClain, C.J.; Varilek, G.W. Green tea polyphenols block endotoxin-induced tumor necrosis factor-production and lethality in a murine model. J. Nutr. 1998, 128, 2334–2340. [Google Scholar] [CrossRef] [Green Version]
- Nowack, R. Cranberry juice: A well-characterized folk-remedy against bacterial urinary tract infection. Wien. Med. Wochenschr. 2007, 157, 325–330. [Google Scholar] [CrossRef] [PubMed]
- Chatelain, K.; Phippen, S.; McCabe, J.; Teeters, C.A.; Malley, S.O.; Kingsley, K. Cranberry and grape seeds extracts inhibit the proliferative phenotype of oral squamous cell carcinomas. Evid.-Based Complement. Altern. Med. 2011, 467691, 1–12. [Google Scholar] [CrossRef] [Green Version]
- Nandakumar, V.; Singha, T.; Katiyar, S.K. Multi-targeted prevention and therapy of cancer by proanthocyanidins. Cancer Lett. 2008, 269, 378–387. [Google Scholar] [CrossRef] [Green Version]
- Taubert, D.; Berkels, R.; Klaus, W.; Roesen, R.J. Nitric oxide formation and corresponding relaxation of porcine coronary arteries induced by plant phenols: Essential structural features. J. Cardiovasc. Pharmacol. 2002, 40, 701–713. [Google Scholar] [CrossRef]
- Holt, R.R.; Schramm, D.D.; Keen, C.L.; Lazarus, S.A.; Schmitz, H.H. Chocolate consumption and platelet function. JAMA 2002, 287, 2212–2213. [Google Scholar] [CrossRef] [PubMed]
- Bagchi, D.; Bagchi, M.; Stohs, S.J.; Das, D.K.; Ray, S.D.; Kuszynski, C.A.; Joshi, S.S.; Pruess, H.G. Free radicals and grape seed proanthocyanidin extract: Importance in human health and disease prevention. Toxicology 2000, 148, 187–197. [Google Scholar] [CrossRef]
- Shahat, A.A.; Cos, P.; Bruyne, T.D.; Apers, S.; Hammouda, F.M.; Ismail, S.I.; Azzam, S.; Claeys, M.; Goovaerts, E.; Pieters, L.; et al. Antiviral and antioxidant activity of flavonoids and proanthocyanidins from Crataegus sinaica. Planta Med. 2002, 68, 539–541. [Google Scholar] [CrossRef] [PubMed]
- Hatano, T.; Miyatakea, H.; Natsumeb, M.; Osakabeb, N.; Takizawab, T.; Itoa, H.; Yoshida, T. Proanthocyanidin glycosides and related polyphenols from cacao liquor and their antioxidant effects. Phytochemistry 2002, 59, 749–758. [Google Scholar] [CrossRef]
- Plumb, G.W.; Pascual-Teresa, S.D.; Santos-Buelga, C.; Cheynier, V.; Williamson, G. Antioxidant properties of catechins and proanthocyanidins: Effect of polymerisation, galloylation and glycosylation. Free Radic. Res. 1998, 29, 351–358. [Google Scholar] [CrossRef] [PubMed]
- Brat, P.; George, S.P.; Bellamy, A.; Chaffaut, L.D.; Scalbert, A.; Mennen, L.; Arnault, N.; Amiot, M.J. Daily polyphenol intake in France from fruit and vegetables. J. Nutr. 2006, 136, 2368–2373. [Google Scholar] [CrossRef] [PubMed] [Green Version]
- Floegel, A.; Kim, D.-O.; Chung, S.-J.; Song, W.O.; Fernandez, M.L.; Bruno, R.S.; Koo, S.I.; Chun, O.K. Development and validation of an algorithm to establish a total antioxidant capacity database of U.S. diet. Int. J. Food Sci. Nutr. 2010, 61, 600–623. [Google Scholar] [CrossRef]
- Santos-Buelga, C.; Scalbert, A. Proanthocyanidins and tannin-like compounds-nature, occurrence, dietary intake and effects on nutrition and health. J. Sci. Food. Agric. 2000, 80, 1094–1117. [Google Scholar] [CrossRef]
- Bruneton, J. Farmacognosia—Fitoquímica Plantas Medicinales, 2nd ed.; 2001; Available online: https://www.fitoterapia.net/publicaciones/documentacion/flavonol-glycosides-from-ithevetia-peruvianai-284.html (accessed on 16 September 2022).
- Santos, S.; de Mello, J.C.P. Taninos. In Farmacognosia: Da Planta ao Medicamento; Simões, C.M.O., Schenkel, E.P., Gosmann, G., de Mello, J.C.P., Mentz, L.A., Petrovick, P.R., Eds.; UFRGS: Porto Alegre, Brazil, 2003; pp. 615–656. [Google Scholar]
- Monteiro, J.M.; Albuquerque, U.P.; Araújo, E.L.; Amorin, E.L.C. Taninos: Uma abordagem da química à ecologia. Quím. Nova 2005, 28, 892–896. [Google Scholar] [CrossRef] [Green Version]
- Yoshida, T.; Chou, T.; Nitta, A.; Okuda, T. Tannins and related polyphenols of theaceous plants. IV. Monomeric and dimeric hydrolyzable tannins having a dilactonized valoneoyl group from Schima wallichii KORTH. Chem. Pharm. Bull. 1991, 39, 2247–2251. [Google Scholar] [CrossRef]
- Okuda, T.; Hatano, T.; Yazaki, K. Praecoxin B, C, D and E, novel ellagitannins from Stachyurus praecox. Chem. Pharm. Bull. 1983, 31, 333–336. [Google Scholar] [CrossRef] [Green Version]
- Hatano, T.; Yazaki, K.; Okonogi, A.; Okuda, T. Tannins of Stachyurus species Praecoxins A, B, C and D, four new hydrolyzable tannins from Stachyurus praecox leaves. Chem. Pharm. Bull. 1991, 39, 1689–1693. [Google Scholar] [CrossRef] [Green Version]
- Saijo, R.; Nonaka, G.; Nishioka, I. Tannins and related compounds. LXXXIV. Isolation and characterization of five new hydrolyzable tannins from the bark of Mallotus japonicas. Chem. Pharm. Bull. 1989, 37, 2063–2070. [Google Scholar] [CrossRef] [PubMed] [Green Version]
- Haslam, E. Plant Polyphenols—Vegetable Tannins Revisited—Chemistry and Pharmacology of Natural Products; Cambridge University Press: Cambridge, UK, 1989. [Google Scholar]
- Khanbabaee, K.; van Ree, T. Tannins: Classification and definition. Nat. Prod. Rep. 2001, 18, 641–649. [Google Scholar] [PubMed]
- Newair, E.F.; Garcia, F. Identification of adducts between oxidized rosmarinic acid and glutathione compounds by electrochemistry, liquid chromatography and mass spectrometry. Anal. Methods. 2022, 14, 286–297. [Google Scholar] [CrossRef]
- Abdel-Hamid, R.; Newair, E.F. Electrochemical behavior of antioxidants: I. Mechanistic study on electrochemical oxidation of gallic acid in aqueous solutions at glassy-carbon electrode. J. Electroanal. Chem. 2011, 657, 107–112. [Google Scholar] [CrossRef]
- Bate-Smith, E.C. The phenolic constituents of plants and their taxonomic significance. I. Dicotyledons. J. Linn. Soc. Lond. Bot. 1962, 58, 95–173. [Google Scholar] [CrossRef]
- Pizzi, A.; Cameron, F.A. Flavonoid tannins—Structural wood components for drought-resistance mechanisms of plants. Wood Sci. Technol. 1986, 20, 119–124. [Google Scholar] [CrossRef]
- Mellway, R.D.; Tran, L.T.; Prouse, M.B.; Campbell, M.M.; Constabel, C.P. The wound-, pathogen-, and ultraviolet B-responsive MYB134 gene encodes an R2R3MYB transcription factor that regulates proanthocyanidin synthesis in poplar. Plant Physiol. 2009, 150, 924–941. [Google Scholar] [CrossRef] [Green Version]
- Schoonees, A.; Visser, J.; Musekiwa, A.; Volmink, J. Pycnogenol® (extract of French maritime pine bark) for the treatment of chronic disorders. Cochrane Database Syst. Rev. 2012, 4, CD008294. [Google Scholar] [CrossRef]
- Cretu, E.; Karonen, M.; Salminen, J.P.; Mircea, C.; Trifan, A.; Charalambous, C.; Constantinou, A.I.; Miron, A. In vitro study on the antioxidant activity of a polyphenol-rich extract from Pinus brutia bark and its fractions. J. Med. Food 2013, 16, 984–991. [Google Scholar] [CrossRef] [PubMed] [Green Version]
- Espley, R.V.; Butts, C.A.; Laing, W.A.; Martell, S.; Smith, H.; McGhie, T.K.; Zhang, J.; Paturi, G.; Hedderley, D.; Bovy, A.; et al. Dietary flavonoids from modified apple reduce inflammation markers and modulate gut microbiota in mice. J. Nutr. 2014, 144, 146–154. [Google Scholar] [CrossRef] [PubMed] [Green Version]
- Brosse, N.; Pizzi, A. Tannins for wood adhesives, foams and composites. In Bio-Based Wood Adhesives: Preparation, Characterization, and Testing; Zhonqi, H., Ed.; CRC Press: Boca Raton, FL, USA, 2017; pp. 197–220. [Google Scholar]
- Roumeas, L.; Fulcrand, H.; Aouf, C.; Dubreucq, E. Biosourced’ Compound Having Epoxide Functions, Method for the Synthesis of Such a Compound, and Use Thereof for Producing Epoxy Resin. International Patent WO2016/174334 A1, 3 November 2016. [Google Scholar]
- Fulcrand, H.; Roumeas, L.; Billerach, G.; Aouf, C.; Dubreucq, E. Advances in bio-based thermosetting polymers. In Recent Advances in Polyphenol Research 6; Halbirth, H., Stich, K., Cheynier, V., Quideau, S., Eds.; John Wiley & Sons, Ltd.: Hoboken, NJ, USA, 2019; pp. 285–334. [Google Scholar]
- Fontana, A.R.; Antoniolli, A.; Bottini, R.J. Grape pomace as a sustainable source of bioactive compounds: Extraction, characterization, and biotechnological applications of phenolics. J. Agric. Food Chem. 2013, 61, 8987–9003. [Google Scholar] [CrossRef] [PubMed]
- Floegel, A.; Kim, D.O.; Chung, S.J.; Koo, S.I.; Chun, O.K. Comparison of ABTS/DPPH assays to measure antioxidant capacity in popular antioxidant-rich US foods. J. Food Compos. Anal. 2011, 24, 1043–1104. [Google Scholar] [CrossRef]
- Chevion, S.; Chevion, M.; Chock, P.B.; Beecher, G.R. The antioxidant capacity of edible plants: Extraction protocol and direct evaluation by cyclic voltammetry. J. Med. Food 1999, 2, 1–11. [Google Scholar] [CrossRef]
- Kilmartin, P.A.; Zou, H.; Waterhouse, A.L. A cyclic voltammetry method suitable for characterizing antioxidant properties of wine and wine phenolics. J. Agric. Food Chem. 2001, 49, 1957–1965. [Google Scholar] [CrossRef]
- Kilmartin, P.A.; Zou, H.; Waterhouse, A.L. Correlation of wine phenolic composition versus cyclic voltammetry response. American. J. Enol. Viticul. 2002, 53, 294–302. [Google Scholar]
- Makhotkina, O.; Kilmartin, P.A. The phenolic composition of Sauvignon blanc juice profiled by cyclic voltammetry. Electrochim. Acta 2012, 83, 188–195. [Google Scholar] [CrossRef]
- Sousa, W.R.; da Rocha, C.; Cardoso, C.L.; Silva, D.H.S.; Zanoni, M.V.B. Determination of the relative contribution of phenolic antioxidants in orange juice by voltammetric methods. J. Food Compos. Anal. 2004, 17, 619–633. [Google Scholar] [CrossRef]
- Sánchez Arribas, A.; Martínez-Fernández, M.; Chicharro, M. The role of electroanalytical techniques in analysis of polyphenols in wine. Trends Anal. Chem. 2012, 34, 78–96. [Google Scholar] [CrossRef]
- Tufan, A.N.; Baki, S.; Güçlü, K.; Ozyürek, M.; Apak, R.A. Novel differential pulse voltammetric (DPV) method for measuring the antioxidant capacity of polyphenolsreducing cupric neocuproine complex. J. Agric. Food Chem. 2014, 62, 7111–7117. [Google Scholar] [CrossRef] [PubMed]
- Hotta, H.; Nagano, S.; Ueda, M.; Tsujino, Y.; Koyama, J.; Osakai, T. Higher radical scavenging activities of polyphenolic antioxidants can be ascribed to chemical reactions following their oxidation. Biochim. Biophys. Acta Gen. Subj. 2002, 1572, 123–132. [Google Scholar] [CrossRef]
- Rozoy, E.; Araya-Farias, M.; Simard, S.; Kitts, D.; Lessard, J.; Bazinet, L. Redox properties of catechins and enriched green tea extracts effectively preserve l-5-methyltetrahydrofolate: Assessment using cyclic voltammetry analysis. Food Chem. 2013, 138, 1982–1991. [Google Scholar] [CrossRef] [PubMed]
- Jara-Palacios, M.J.; Hernanz, D.; Escudero-Gilete, M.L.; Heredia, F.J. Antioxidant potential of white grape pomaces: Phenolic composition and antioxidant capacity measured by spectrophotometric and cyclic voltammetry methods. Food Res. Int. 2014, 66, 150–157. [Google Scholar] [CrossRef]
- Zhang, D.; Chu, L.; Liu, Y.; Wang, A.; Ji, B.; Wu, W.; Zhou, F.; Wei, Y.; Cheng, Q.; Cai, S.; et al. Analysis of the antioxidant capacities of flavonoids under different spectrophotometric assays using cyclic voltammetry and density functional theory. J. Agric. Food Chem. 2011, 59, 10277–10285. [Google Scholar] [CrossRef]
- Brillouet, J.-M.; Fulcrand, H.; Carrillo, S.; Rouméas, L.; Romieu, C. Isolation of Native Proanthocyanidins from Grapevine (Vitis vinifera), and Other Fruits in Aqueous Buffer. J. Agric. Food Chem. 2017, 65, 2895–2901. [Google Scholar] [CrossRef]
- Brett, C.M.A.; Oliveira-Brett, A.M. Electrochemistry: Principles, Methods, and Applications; Oxford Science Publications: Oxford, UK, 1993. [Google Scholar]
- Bard, A.J.; Faulkner, L.R. Electrochemical Methods: Fundamentals and Applications, 2nd ed.; Wiley & Sons: New York, NY, USA, 2001. [Google Scholar]
- Abdel-Hamid, R.; Newair, E.F.; Garcia, F. Electroanalytical determination of Luteolin in peanut hulls using carbon black modified glassy carbon electrode. Braz. J. Anal. Chem. 2016, 4, 38–47. [Google Scholar]
- Sharp, M.; Petersson, M.; Edstrom, K.J. Preliminary determinations of electron transfer kinetics involving ferrocene covalently attached to a platinum surface. Electroanal. Chem. 1979, 95, 123–130. [Google Scholar] [CrossRef]
- Newair, E.F.; Nafady, A.; Abdel-Hamid, R.; Al-Enizi, A.M.; Garcia, F. Mechanistic pathways and identification of the electrochemically generated oxidation products of flavonoid eriodyctiol in the presence of glutathione. Electroanalysis 2018, 30, 1714–1722. [Google Scholar] [CrossRef]
- Schofield, P.; Mbugua, D.M.; Pell, A.N. Analysis of condensed tannins: A review. Anim. Feed Sci. Technol. 2001, 91, 21–40. [Google Scholar] [CrossRef]
- Piovesan, J.V.; de Lima, C.A.; Santana, E.R.; Spinelli, A. Voltammetric determination of condensed tannins with a glassy carbon electrode chemically modified with gold nanoparticles stabilized in carboxymethylcellulose. Sens. Actuators B Chem. 2017, 240, 838–847. [Google Scholar] [CrossRef]


| Electrode | Model Compound | Linear Range (ppm) | Limit of Detection (ppm) | Reference |
|---|---|---|---|---|
| Glassy carbon electrode modified with gold nanoparticles stabilized in carboxymethylcellulose | Catechin | 0.09–2.9 | 0.08 | [59] |
| Glassy carbon electrode | None | 4.0–50.0 | 3.07 | This work |
Publisher’s Note: MDPI stays neutral with regard to jurisdictional claims in published maps and institutional affiliations. |
© 2022 by the authors. Licensee MDPI, Basel, Switzerland. This article is an open access article distributed under the terms and conditions of the Creative Commons Attribution (CC BY) license (https://creativecommons.org/licenses/by/4.0/).
Share and Cite
Adam, M.S.S.; Newair, E.F. Square-Wave and Cyclic Voltammetry of Native Proanthocyanidins Extracted from Grapevine (Vitis vinifera) on the Glassy Carbon Electrode. Chemosensors 2022, 10, 429. https://doi.org/10.3390/chemosensors10100429
Adam MSS, Newair EF. Square-Wave and Cyclic Voltammetry of Native Proanthocyanidins Extracted from Grapevine (Vitis vinifera) on the Glassy Carbon Electrode. Chemosensors. 2022; 10(10):429. https://doi.org/10.3390/chemosensors10100429
Chicago/Turabian StyleAdam, Mohamed Shaker S., and Emad F. Newair. 2022. "Square-Wave and Cyclic Voltammetry of Native Proanthocyanidins Extracted from Grapevine (Vitis vinifera) on the Glassy Carbon Electrode" Chemosensors 10, no. 10: 429. https://doi.org/10.3390/chemosensors10100429
APA StyleAdam, M. S. S., & Newair, E. F. (2022). Square-Wave and Cyclic Voltammetry of Native Proanthocyanidins Extracted from Grapevine (Vitis vinifera) on the Glassy Carbon Electrode. Chemosensors, 10(10), 429. https://doi.org/10.3390/chemosensors10100429