Article

Flexible and Transparent SERS Substrates Composed of Au@Ag Nanorod Arrays for In Situ Detection of Pesticide Residues on Fruit and Vegetables

1
Anhui Key Laboratory of Environmental Toxicology and Pollution Control Technology, Institute of Intelligent Machines & Hefei Institute of Intelligent Agriculture, Hefei Institutes of Physical Science, Chinese Academy of Sciences, Hefei 230031, China
2
Science Island Branch of Graduate School, University of Science & Technology of China, Hefei 230026, China
*
Author to whom correspondence should be addressed.
Chemosensors 2022, 10(10), 423; https://doi.org/10.3390/chemosensors10100423
Submission received: 29 August 2022 / Revised: 28 September 2022 / Accepted: 9 October 2022 / Published: 17 October 2022
(This article belongs to the Special Issue Nanocomposites for SERS Sensing)

Abstract

:
Due to the increasing importance of food quality/safety control, there is an imminent need to develop efficient methods for the rapid detection of pesticide residues in agricultural products. Herein, we proposed a simple and rapid detection approach to the in situ detection of residual pesticides on fruit/vegetable using surface-enhanced Raman spectroscopy (SERS). Flexible and transparent SERS substrates were fabricated by transferring Au@Ag core-shell nanorods (Au@Ag NRs) arrays to silicone membranes, with the single-layer Au@Ag NRs arrays prepared by the liquid–liquid interface self-assembly method. The as-prepared SERS sensor showed excellent SERS activity and repeatability, and it could be readily pasted onto the surface of fruit and vegetables for residual pesticide detection. For the inspection of thiram in contaminated strawberries, apples, and mushrooms, the limit of detection (LOD) could reach 2 ng/cm2 with high measurement recovery and reproducibility. In general, this work provides an effective way for the preparation and application of flexible and transparent SERS substrates in food-safety control.

Graphical Abstract

1. Introduction

In the current development of agriculture, vast pesticides have been widely applied, as they can protect agronomic crops and products from pests and diseases [1]. However, the potential threat to human health caused by pesticide overdose utilization and environmental pollution has gained increasing attention, such that people have to improve the implementation of the appropriate control measures to ensure food security [2]. One of the important measures is to detect pesticide residues in agricultural products sensitively and instantly. Presently, the typical detection approaches to pesticide residues include, but are not limited to, high-performance liquid chromatography (HPLC) [3], gas chromatography–mass spectrometry (GC–MS) [4], and enzyme inhibition methods [5]. However, these methods generally require complex operation, large volume of samples, and a long time for measurement, so they cannot be applied to on-site food inspection [6]. Moreover, the prolonged and complicated prerequisites for the traditional analytical methods could result in the loss of pesticide residues during the sample pretreatment process, which may, thus, lead to inaccurate assessment [7]. Therefore, it is imminent to develop a rapid, non-invasive, inexpensive, and user-friendly technique that may serve for fast, convenient, and accurate field measurements.
In general, Raman spectroscopy is a powerful tool for chemical analysis due to its advantage of fingerprint identification, but it is limited by its rather low sensitivity [8]. Fortunately, nowadays, surface-enhanced Raman spectroscopy (SERS) has been developed and utilized as an advanced analytical tool in many areas [9], because it can provide ultra-high sensitivity, less sampling detection, and the ability to provide rich and intrinsic spectral information [10,11]. In principle, SERS can be realized by the enhancement of Raman signals via the electromagnetic field enhancement mechanism (EM) and/or the chemical enhancement mechanism (CM) on the surface of the SERS’ active substrates [12]. In most cases, gold/silver nanoparticles (Au/Ag NPs) has been widely employed to generate an EM-based SERS effect, due to their relatively uncomplicated synthesis and excellent plasmonic properties [13]. Making use of the varied types of Au/Ag NPs, researchers have been striving to develop more innovative substrates with efficient and reliable SERS performance. For this purpose, our group have also endeavored to create a variety of effective SERS substrates for different applications, including the detection of pesticides/drugs in food. For example, we have fabricated ultra-sensitive SERS substrates consisting of highly-stable SiO2@Au core-shells for residual fipronil in eggs [14] and anodic alumina template (AAO)-based SERS substrates consisting of Ag NPs for the sensitive recognition of residual ractodopamine in meat [15]. However, a common problem frequently encountered in the SERS application of Au/Ag nanoparticle colloids is their manifold distributions in size and interparticle gaps, which normally give rise to inhomogeneous aggregation of Ag/Au NPs and inconsistent SERS signals [16]. In addition, most SERS substrates are rigid, so it is difficult to apply the SERS detection of pesticide residues onto the peels of raw fruit/vegetables directly. To overcome these problems, researchers put forward the approach of the self-assembly of nanoparticles on the oil–water interface [17], which could, thus, lead to the regular arrangement of interparticle gaps or “hotspots”, so the spectral uniformity and consistency in the SERS measurement could be ensured. Moreover, flexible and transparent polymer films, for example, PDMS, were also proposed for preparing SERS substrates, which could be closely attached to any arbitrarily curved surface of irregular shaped objects, for directional SERS measurement [18].
In this context, we designed a facile, flexible, and transparent substrate, which consisted of regularly arranged, uniform, noble metal nanoparticles for SERS detection of pesticide residue in fruit and vegetables. As shown in Scheme 1, firstly, we fabricated Au@Ag core-shell nanorods (Au@Ag NRs) and obtained a stable two-dimensional film, consisting of the Au@Ag NRs arrays, by the liquid–liquid interface self-assembly method. Then, we prepared silica gel to take over the single-layer self-assembly of the Ag/Ag NRs arrays. Compared to some previous reported work [19,20], the as-prepared SERS sensors in our study were non-toxic, odorless, chemically stable, flexible, elastic, and resistant to kink and deformation and showed minimal background-signal interference. The flexible and transparent SERS sensors were employed for the in situ detection of pesticide residues on the surface of fresh fruit and vegetables, exhibiting excellent SERS activity and satisfactory measurement stability and repeatability, for the test of the detection of thiram residue on the peels of apples/strawberries and the surface of mushrooms, reaching the limit of detection (LOD) far below the maximum residue limit (MRL).

2. Materials and Methods

2.1. Chemicals

AgNO3, HAuCl4·3H2O, NaBH4, HCl, CH3OH, CH3CH2OH, and hexane (C6H14) were purchased from Sinopharm Chemical Reagent Limited Co., China. CTAB, CTAC, and L-ascorbic acid were obtained from Aladdin Industrial Co., China. The 4-Aminothiophenol (4-ATP) was purchased from Aldrich, and Thiram was purchased from Tanmo technology company. All the reagents were of analytical grade and were used without any further purification.

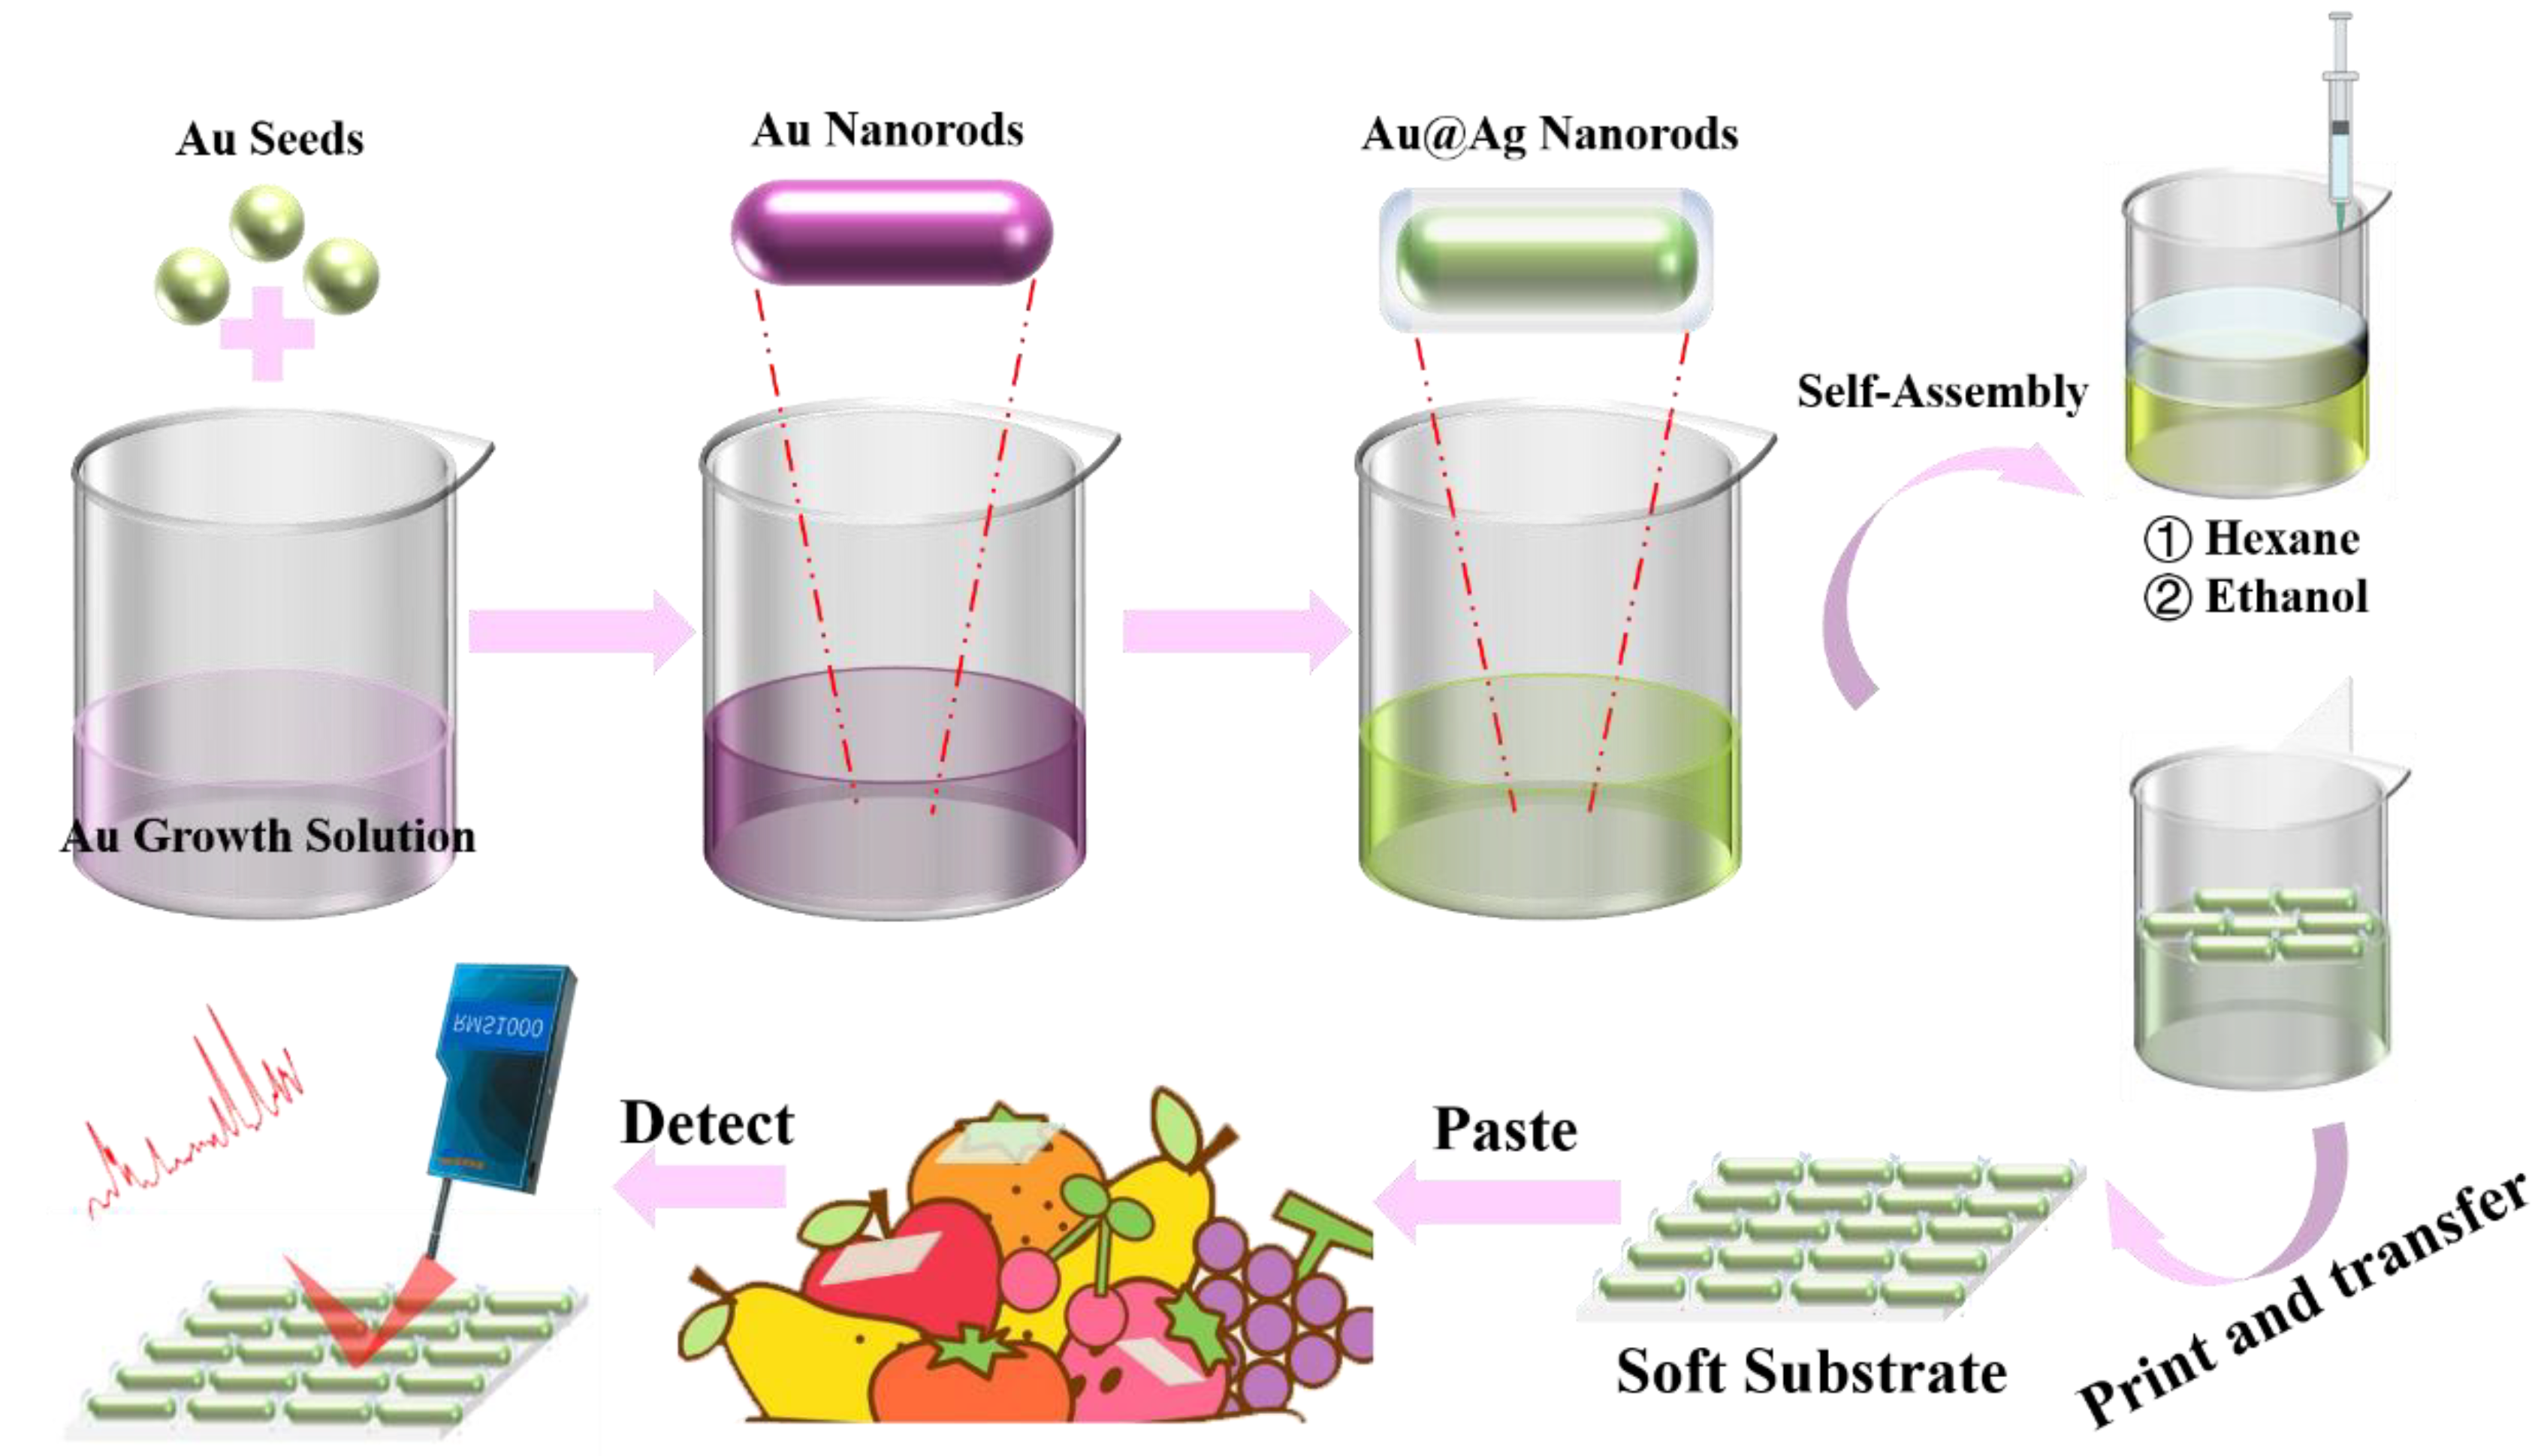
2.2. Fabrication of Flexible SERS Substrates

First, the Au@Ag NRs were achieved by wrapping the Au NRs with a thin silver layer, where the Au NRs were prepared according to the method reported previously [21] (details given in the Supporting Information). Then, silicone was applied to prepare the flexible transparent substrate. In brief, the two components, A and B, of the silicone preparation kit were mixed with 1:1 (w/w) ratio and dispersed on a flat plate. The plate was placed in an oven, and the reaction was allowed to continue for 10 min at 80 °C. Next, the preparation of the Au@Ag NRs array was achieved by the following liquid–liquid interface self-assembly method [22]. In the first step, n-hexane (1 mL) was slowly added to the Au@Ag NRs (0.5 mL) to form an oil–water interface. Immediately after the first step, anhydrous ethanol (2 mL) was added by rapid vertical injection, so that a greenish-gray film at the interface was formed. After the complete vaporization of the organic substances in the upper layer, the assembled Au@Ag NRs were, thus, adhered to the surface of the substrate, so that the flexible and semitransparant SERS substrate of appropriate size was achieved.

2.3. Characterization

The UV–Vis absorption characterization was performed with a spectral range of 200–800 nm (Shimadzu UV-2500 spectrophotometer). The electron microscopic images were obtained on a Zeiss Gemini300 scanning electron microscope (SEM) and Talos F200X G2 transmission electron microscope (TEM). All Raman spectra were obtained using Oceanhood RMS 1000 portable Raman spectrometer equipped with 785 nm excitation source (50 mW), with the recording spectral range of 400–2000 cm−1.

2.4. SERS Measurements

To verify the SERS activity of the assembled SERS substrate, 4-ATP stock solution of standard concentrations was prepared. An equal volume of 4-ATP (5 μL) was dispersed onto the substrate with uniform sizes. The samples were allowed to dry in air before acquisition of the Raman spectra. For the detection of pesticide residues, thiram ethanol solutions of different concentrations were prepared. In the case of real food samples, similar to the work [23], the pesticide was in situ detected directly. Then, 1 μL thiram of different concentrations was dropped on the surface of fruit/vegetables, and the flexible substrate was tightly applied to the surface of the raw fruit/vegetables, so that the anchor side with Au@Ag NRs could be in contact with the pesticide of the raw food. Next, the 785 nm laser was applied on the back side of the substrate, and Raman spectra were collected with 20 s acquisition time.

2.5. Statistical Analysis

The data analysis was obtained using the software Origin 2021 (Origin Lab Corporation, Northampton, MA, USA). Raman spectra were collected from random spots on the substrate, and peak intensities were evaluated and represented as mean ± standard deviation (SD). The limit of detection was calculated using the following equation: LOD = 3Sb/Yb, where Sb represents the standard deviation of Raman intensity of blank samples, and Yb is the slope of the calibration curve [24].

3. Results and Discussion

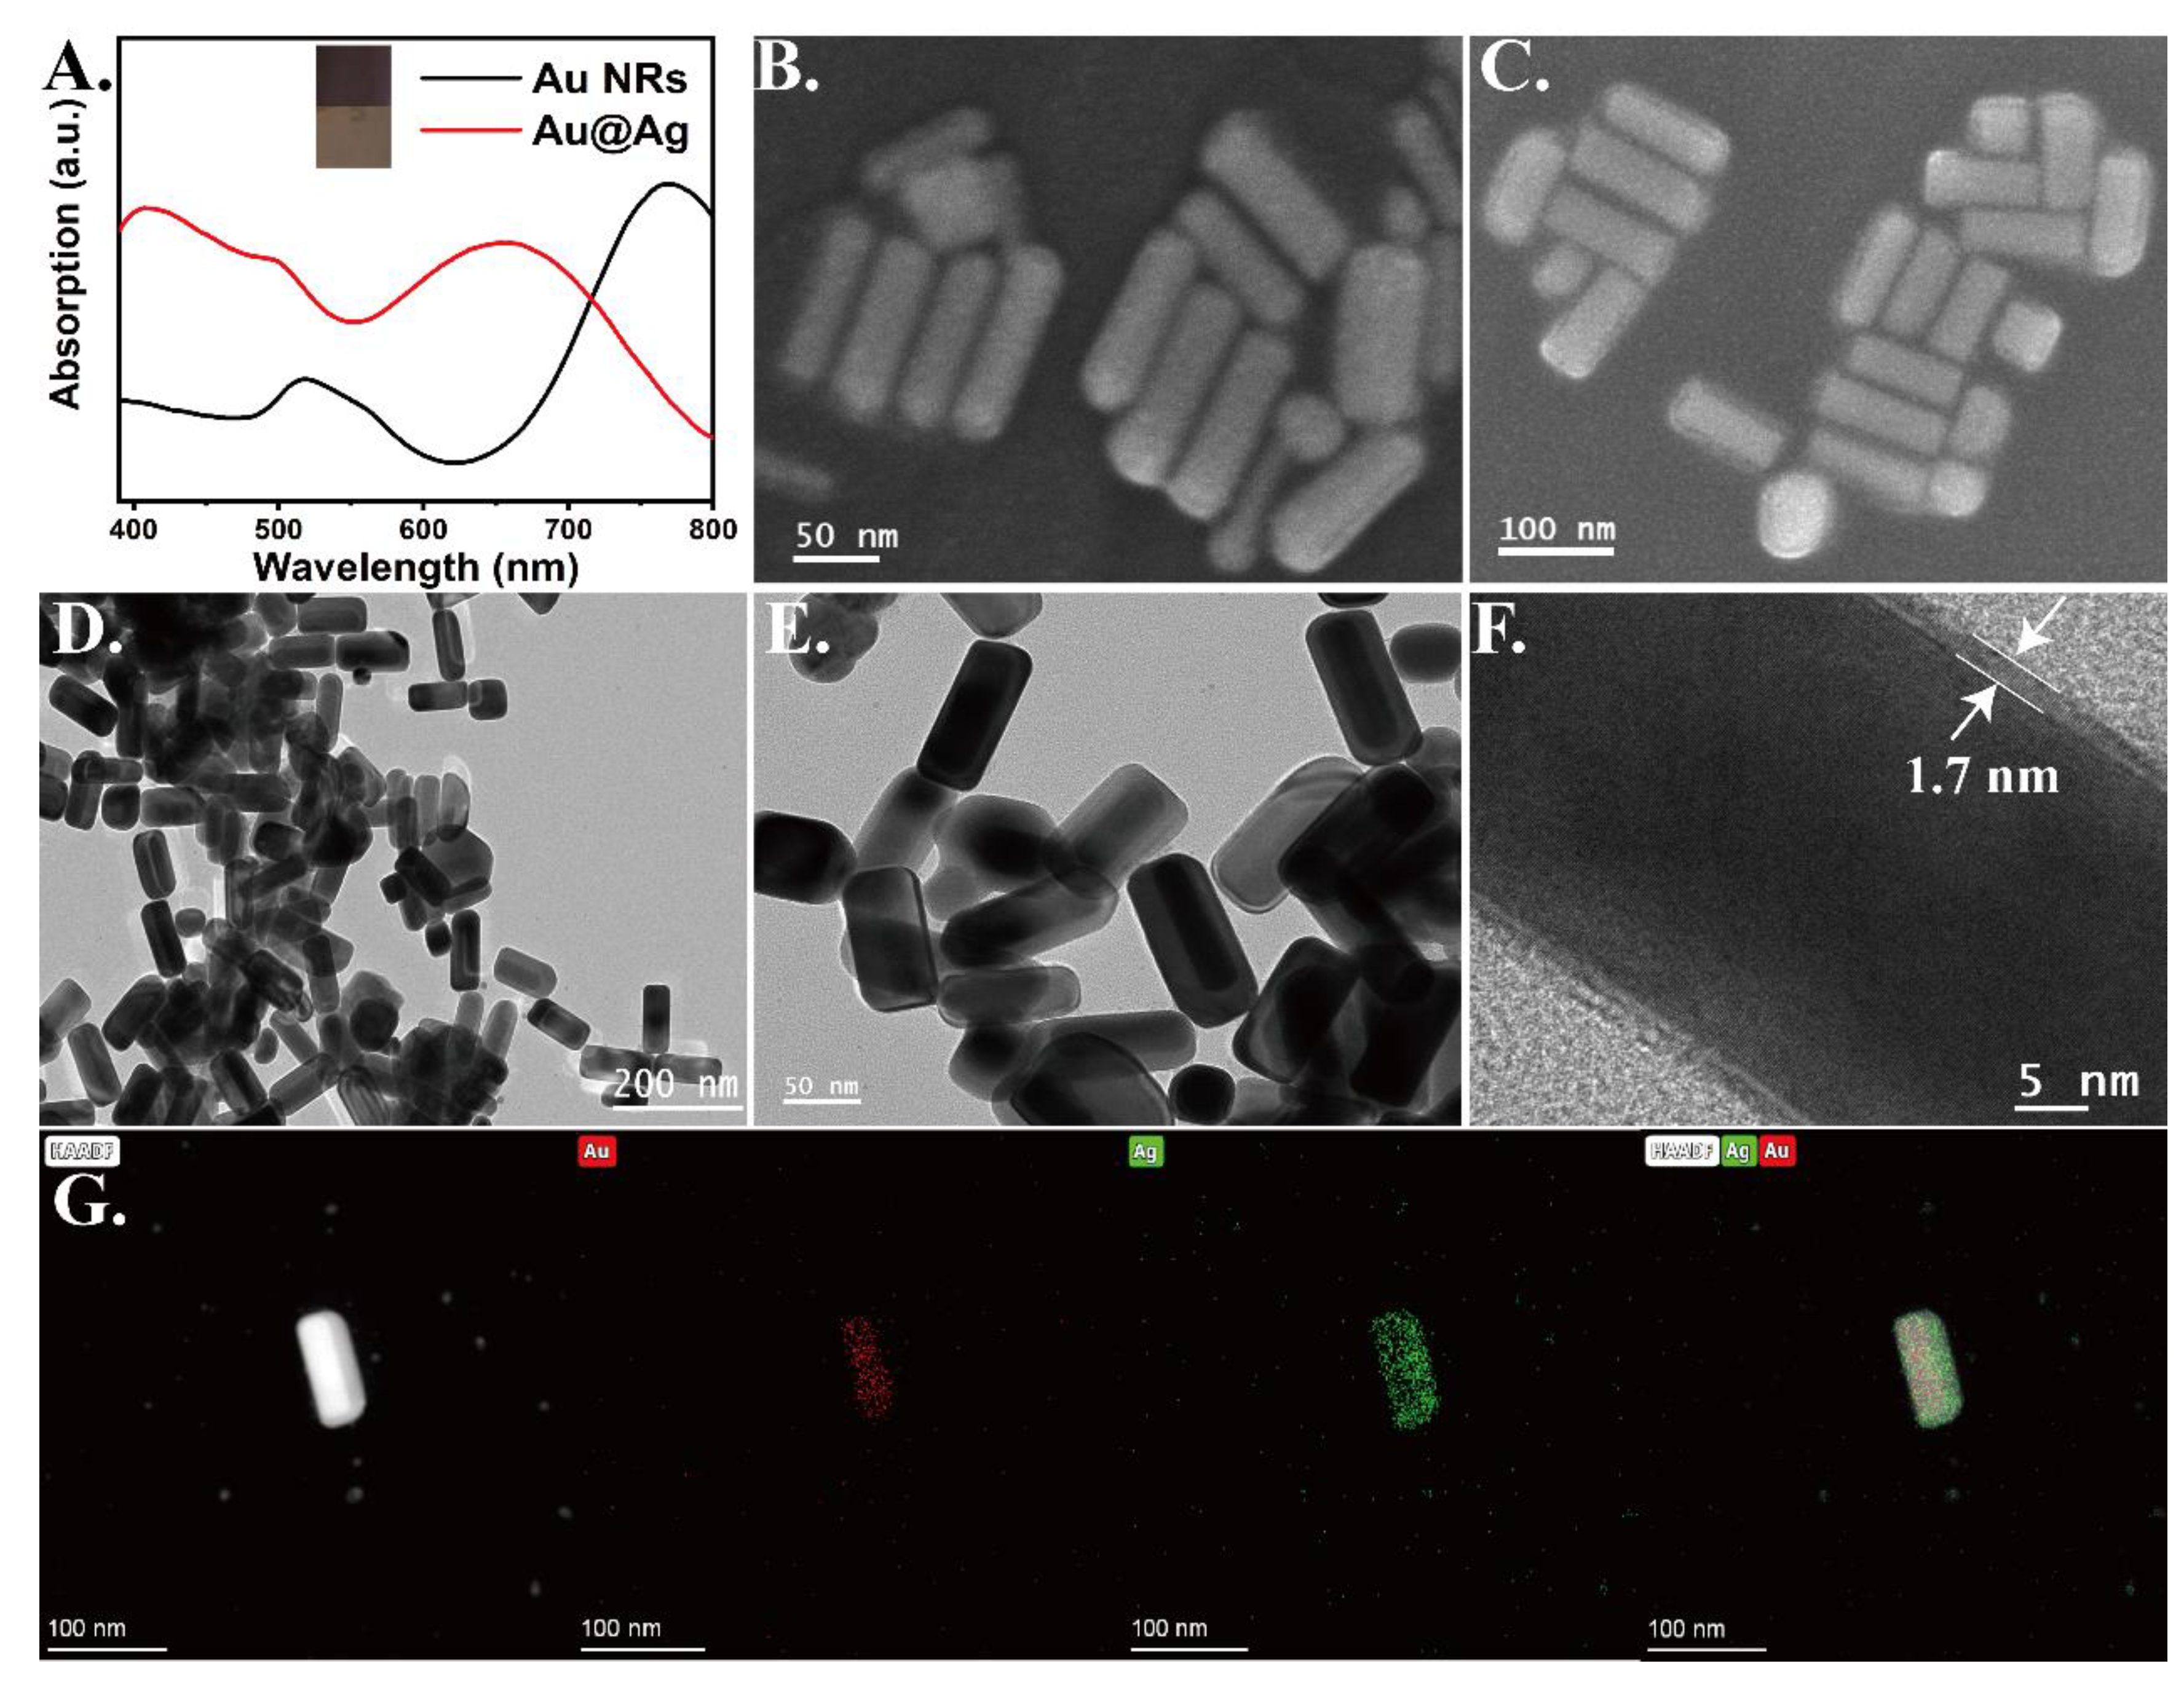
3.1. Morphological Characterization of Au@Ag NRs Arrays

Figure 1 shows the characterization of the AuNRs and Au@Ag NRs, the synthesized Au-seed solution appeared brownish yellow. With the addition of Au-seeds, the Au NPs grew into rod-shaped nanoparticles with the assistance of bi-surfactant and sliver ions. As shown in Figure 1A, the UV–Vis spectrum of the AuNRs colloid (red-brown) showed two peaks at 510 and 780 nm, corresponding to the plasmonic resonance of the transverse and longitudinal modes [25]. The SERS activity was obtained by formation of a Ag shell on the surface of the AuNRs. After the successful formation of the Ag shell, the color of the solution first turned light yellowish-green, with the main peak of the AuNRs showing a large blue shift, due to the smaller aspect ratio of the NRs and the increase in the thickness of the Ag shell. To further evaluate the morphology of the AuNRs and Au@Ag core-shell NRs, the SEM images were recorded (Figure 1B). The AuNRs rod-like structures were uniform in size, with dimensions and aspect ratio of 93 ± 1.2 nm and 28 ± 2.4 nm, respectively. Figure 1C–E shows that the Ag-shell wrapped the core AuNRs with a shell thickness of about 1.7 nm uniformly (Figure 1F). The EDS mapping results are shown in Figure 1G, confirming the uniform distribution of Ag on the AuNRs. Taken together, the above results demonstrate the successful synthesis of the Au@Ag NRs.
The flexible SERS substrates were fabricated by transferring the Au@Ag core-shell nanorods (Au@Ag NRs) arrays to transparent silicone film. The Au@Ag NRs arrays were prepared by the liquid–liquid interface self-assembly method. The procedure or result of the liquid–liquid interface self-assembly process is shown in Figure S1. After adding n-hexane, the oil–water interface was created, which provided a platform for the self-assembly of the Au@Ag NRs (Figure S1B). This distribution of the nanoparticles at the interface effectively avoided the irregular aggregation and precipitation of the Au@Ag NRs. After ethanol infusion, the surface charge together with the electrostatic interaction among the nanoparticles declined, whereas the hydrophobicity of the NRs was induced. As a result, a monolayer of the large-scale Au@Ag NRs arrays was formed at the oil–water interface (Figure S1C). The Au@Ag NRs arrays were then transferred to the silicone membrane. It can be seen from the Figure 2A inset that, after mixing the precursors A and B of food-grade silicone in a certain proportion, a colorless and flexible substrate of food-grade silicone with sufficient elasticity was formed. The SEM images further confirmed that the surface of the food-grade silicone was flexible and smooth. While few of the Au@Ag NRs tended to aggregate due to self-assembly, the surface of the cured food-grade silicone retained a certain adhesiveness, through which the self-assembly of the Au@Ag NRs arrays could be directly printed on the surface of the food-grade silicone, as shown in Figure 2B.

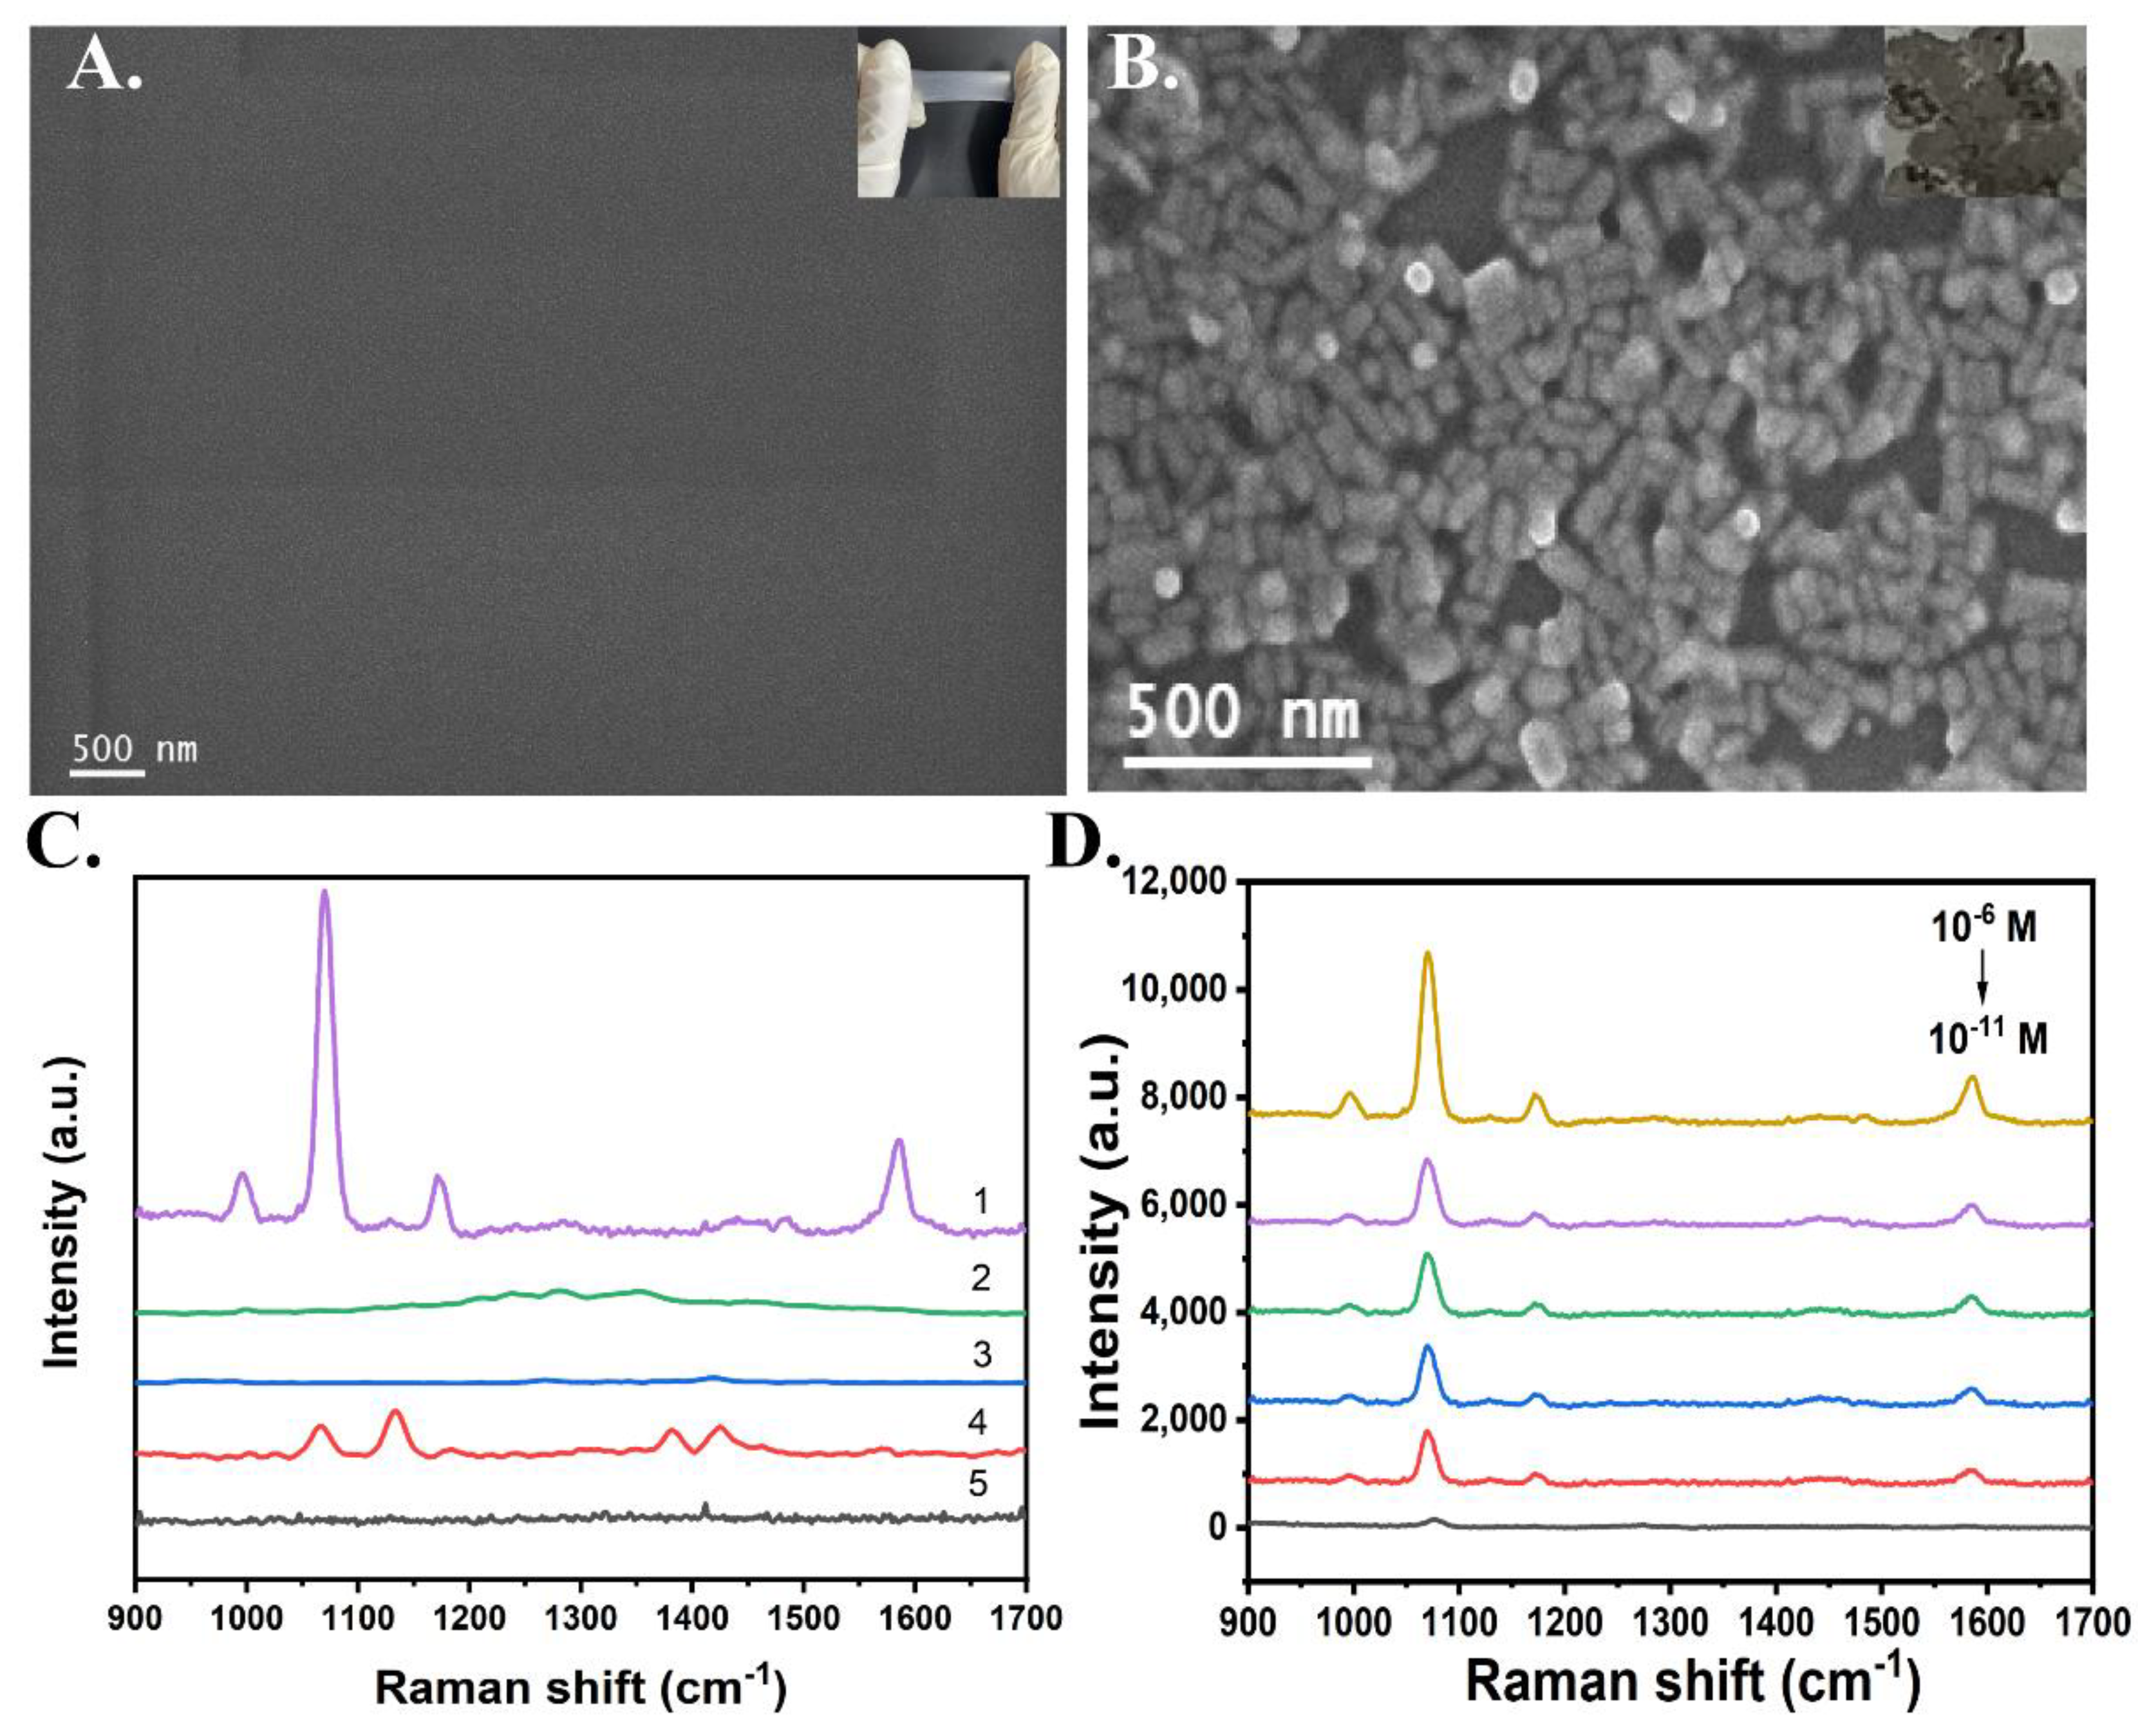
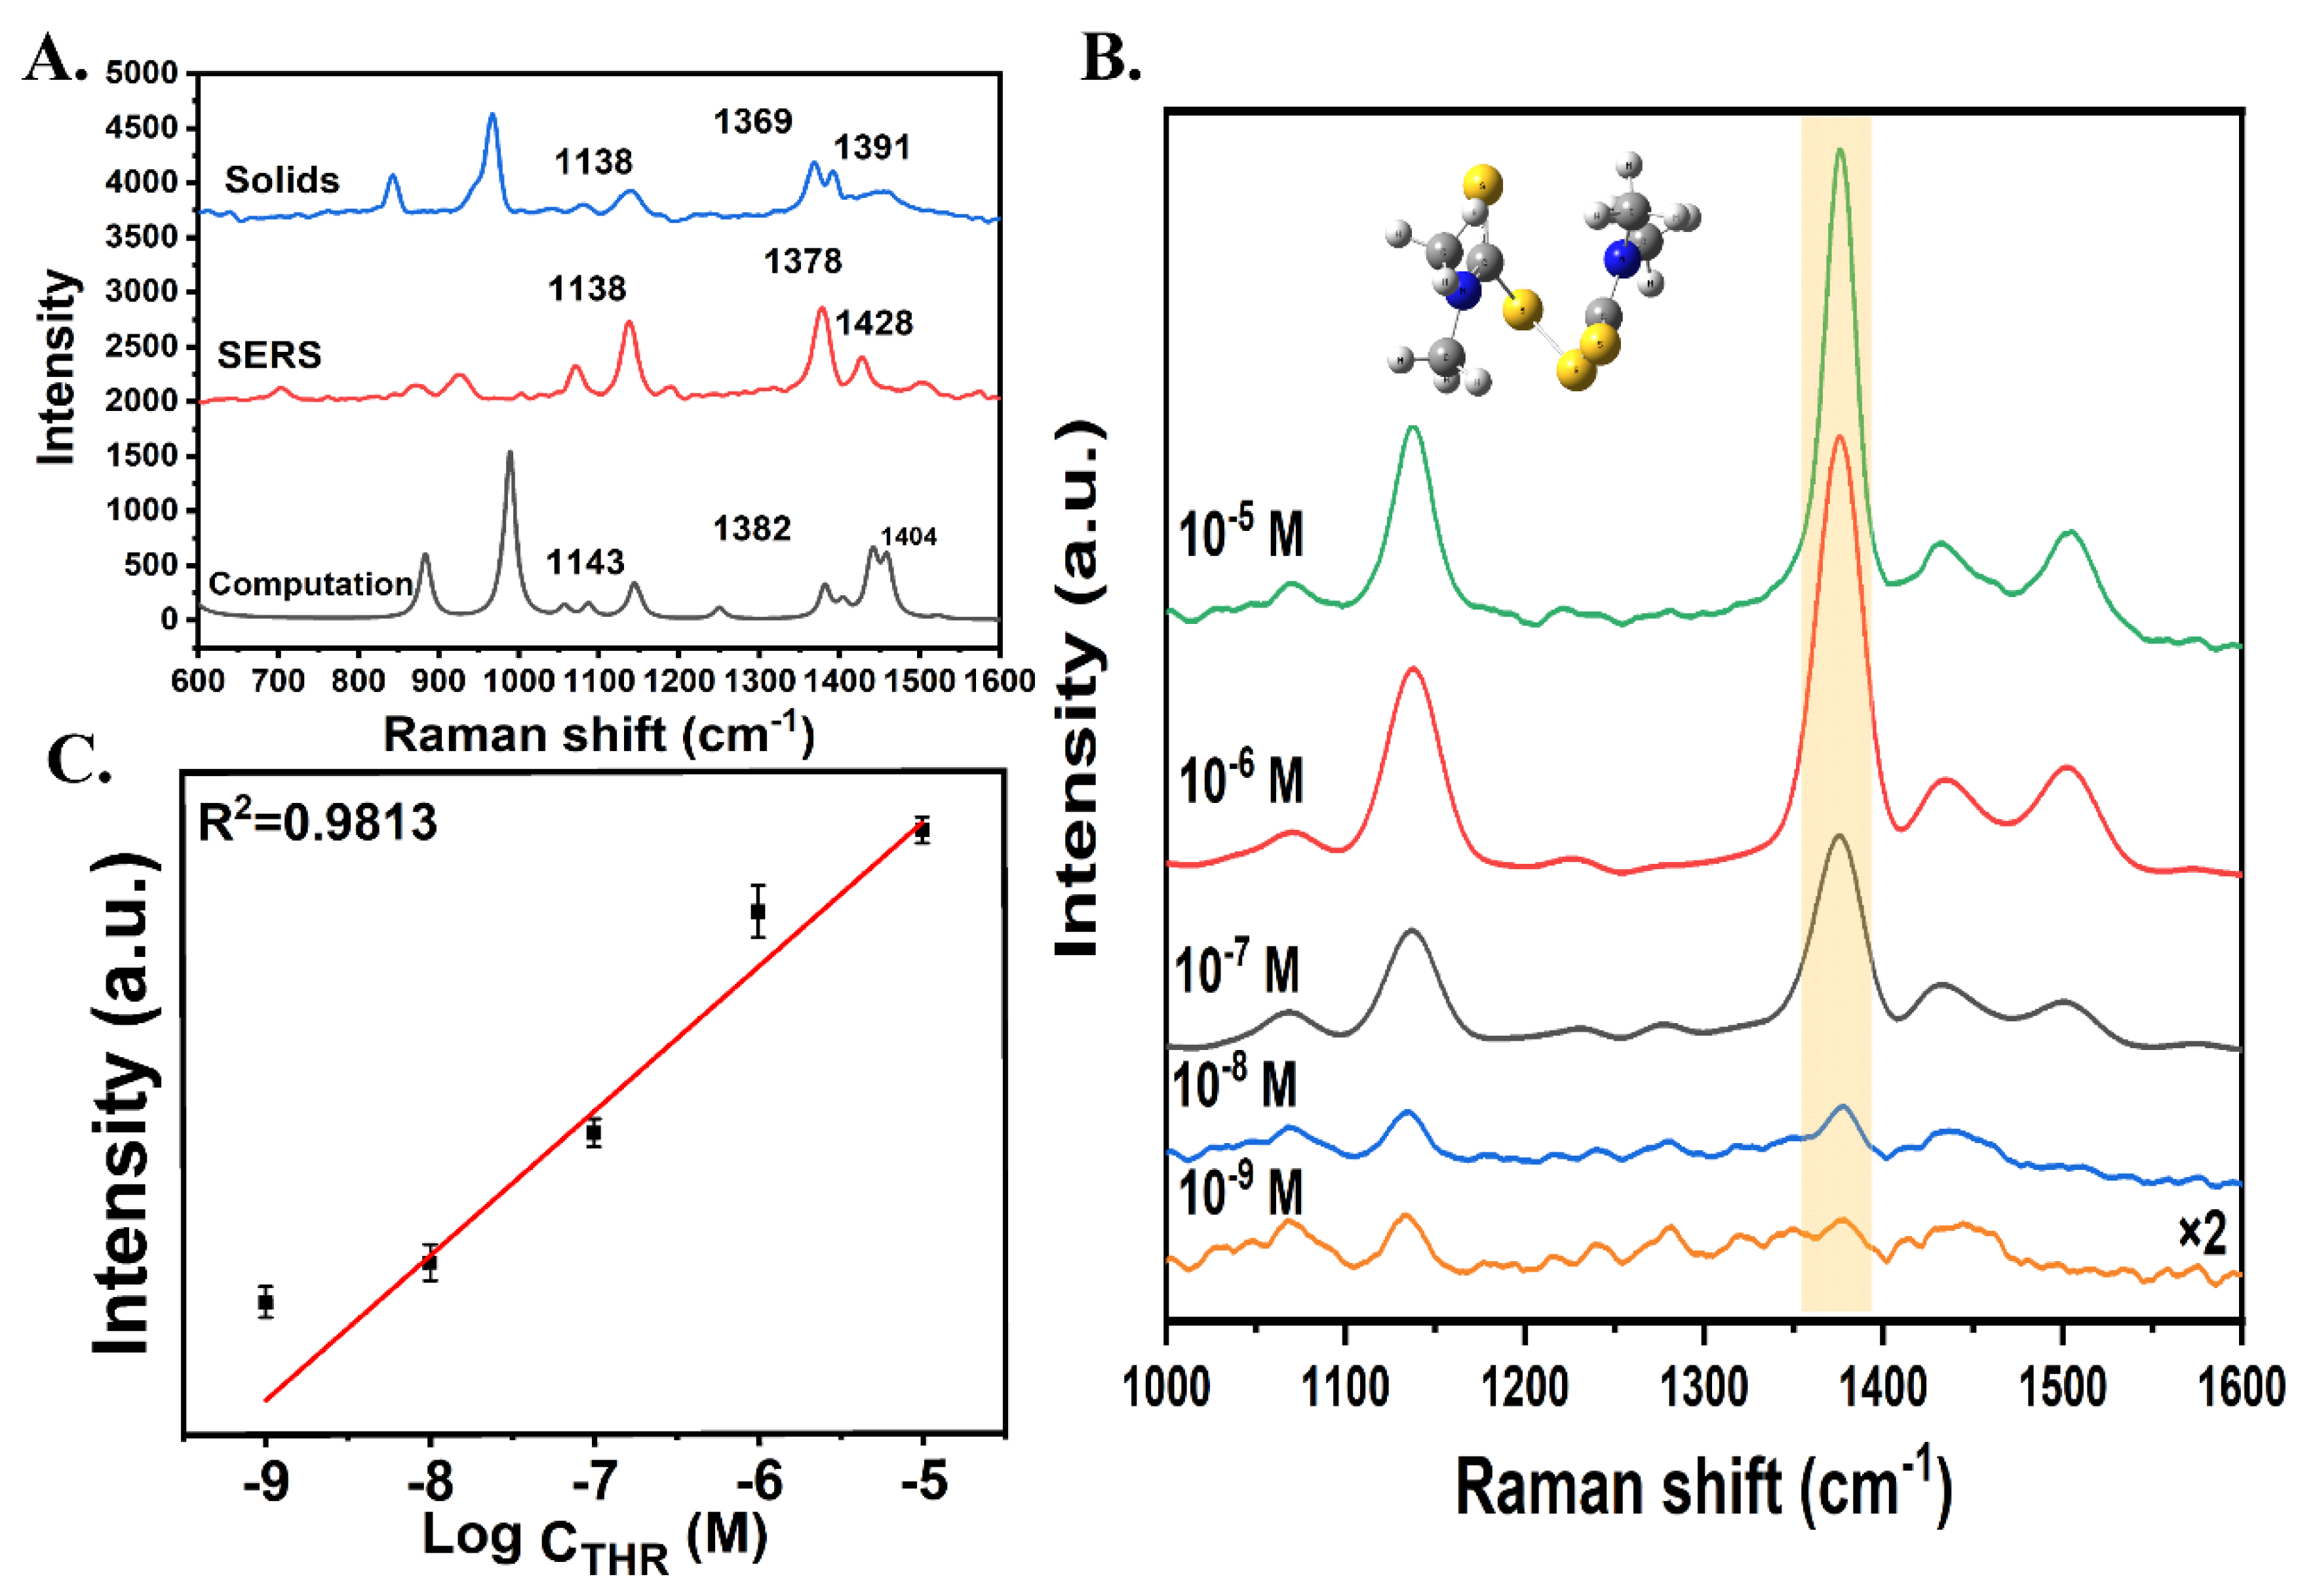
3.2. SERS Activity of Au@Ag NRs Substrates

To verify the SERS effect from the as-prepared Au@Ag NRs, 4-ATP was used as the standard probe. As shown in Figure 2C, the flexible substrate showed a low and neglected background. Figure 2D shows that the signal peaks at 1080 and 1580 cm−1 were significantly enhanced due to the adsorption of 4-ATP on the substrate. It was found that the flexible substrate could detect the probe molecule as low as 10−11 M. All the above results confirmed the excellent SERS activity of the Au@Ag NRs flexible substrate [26,27].

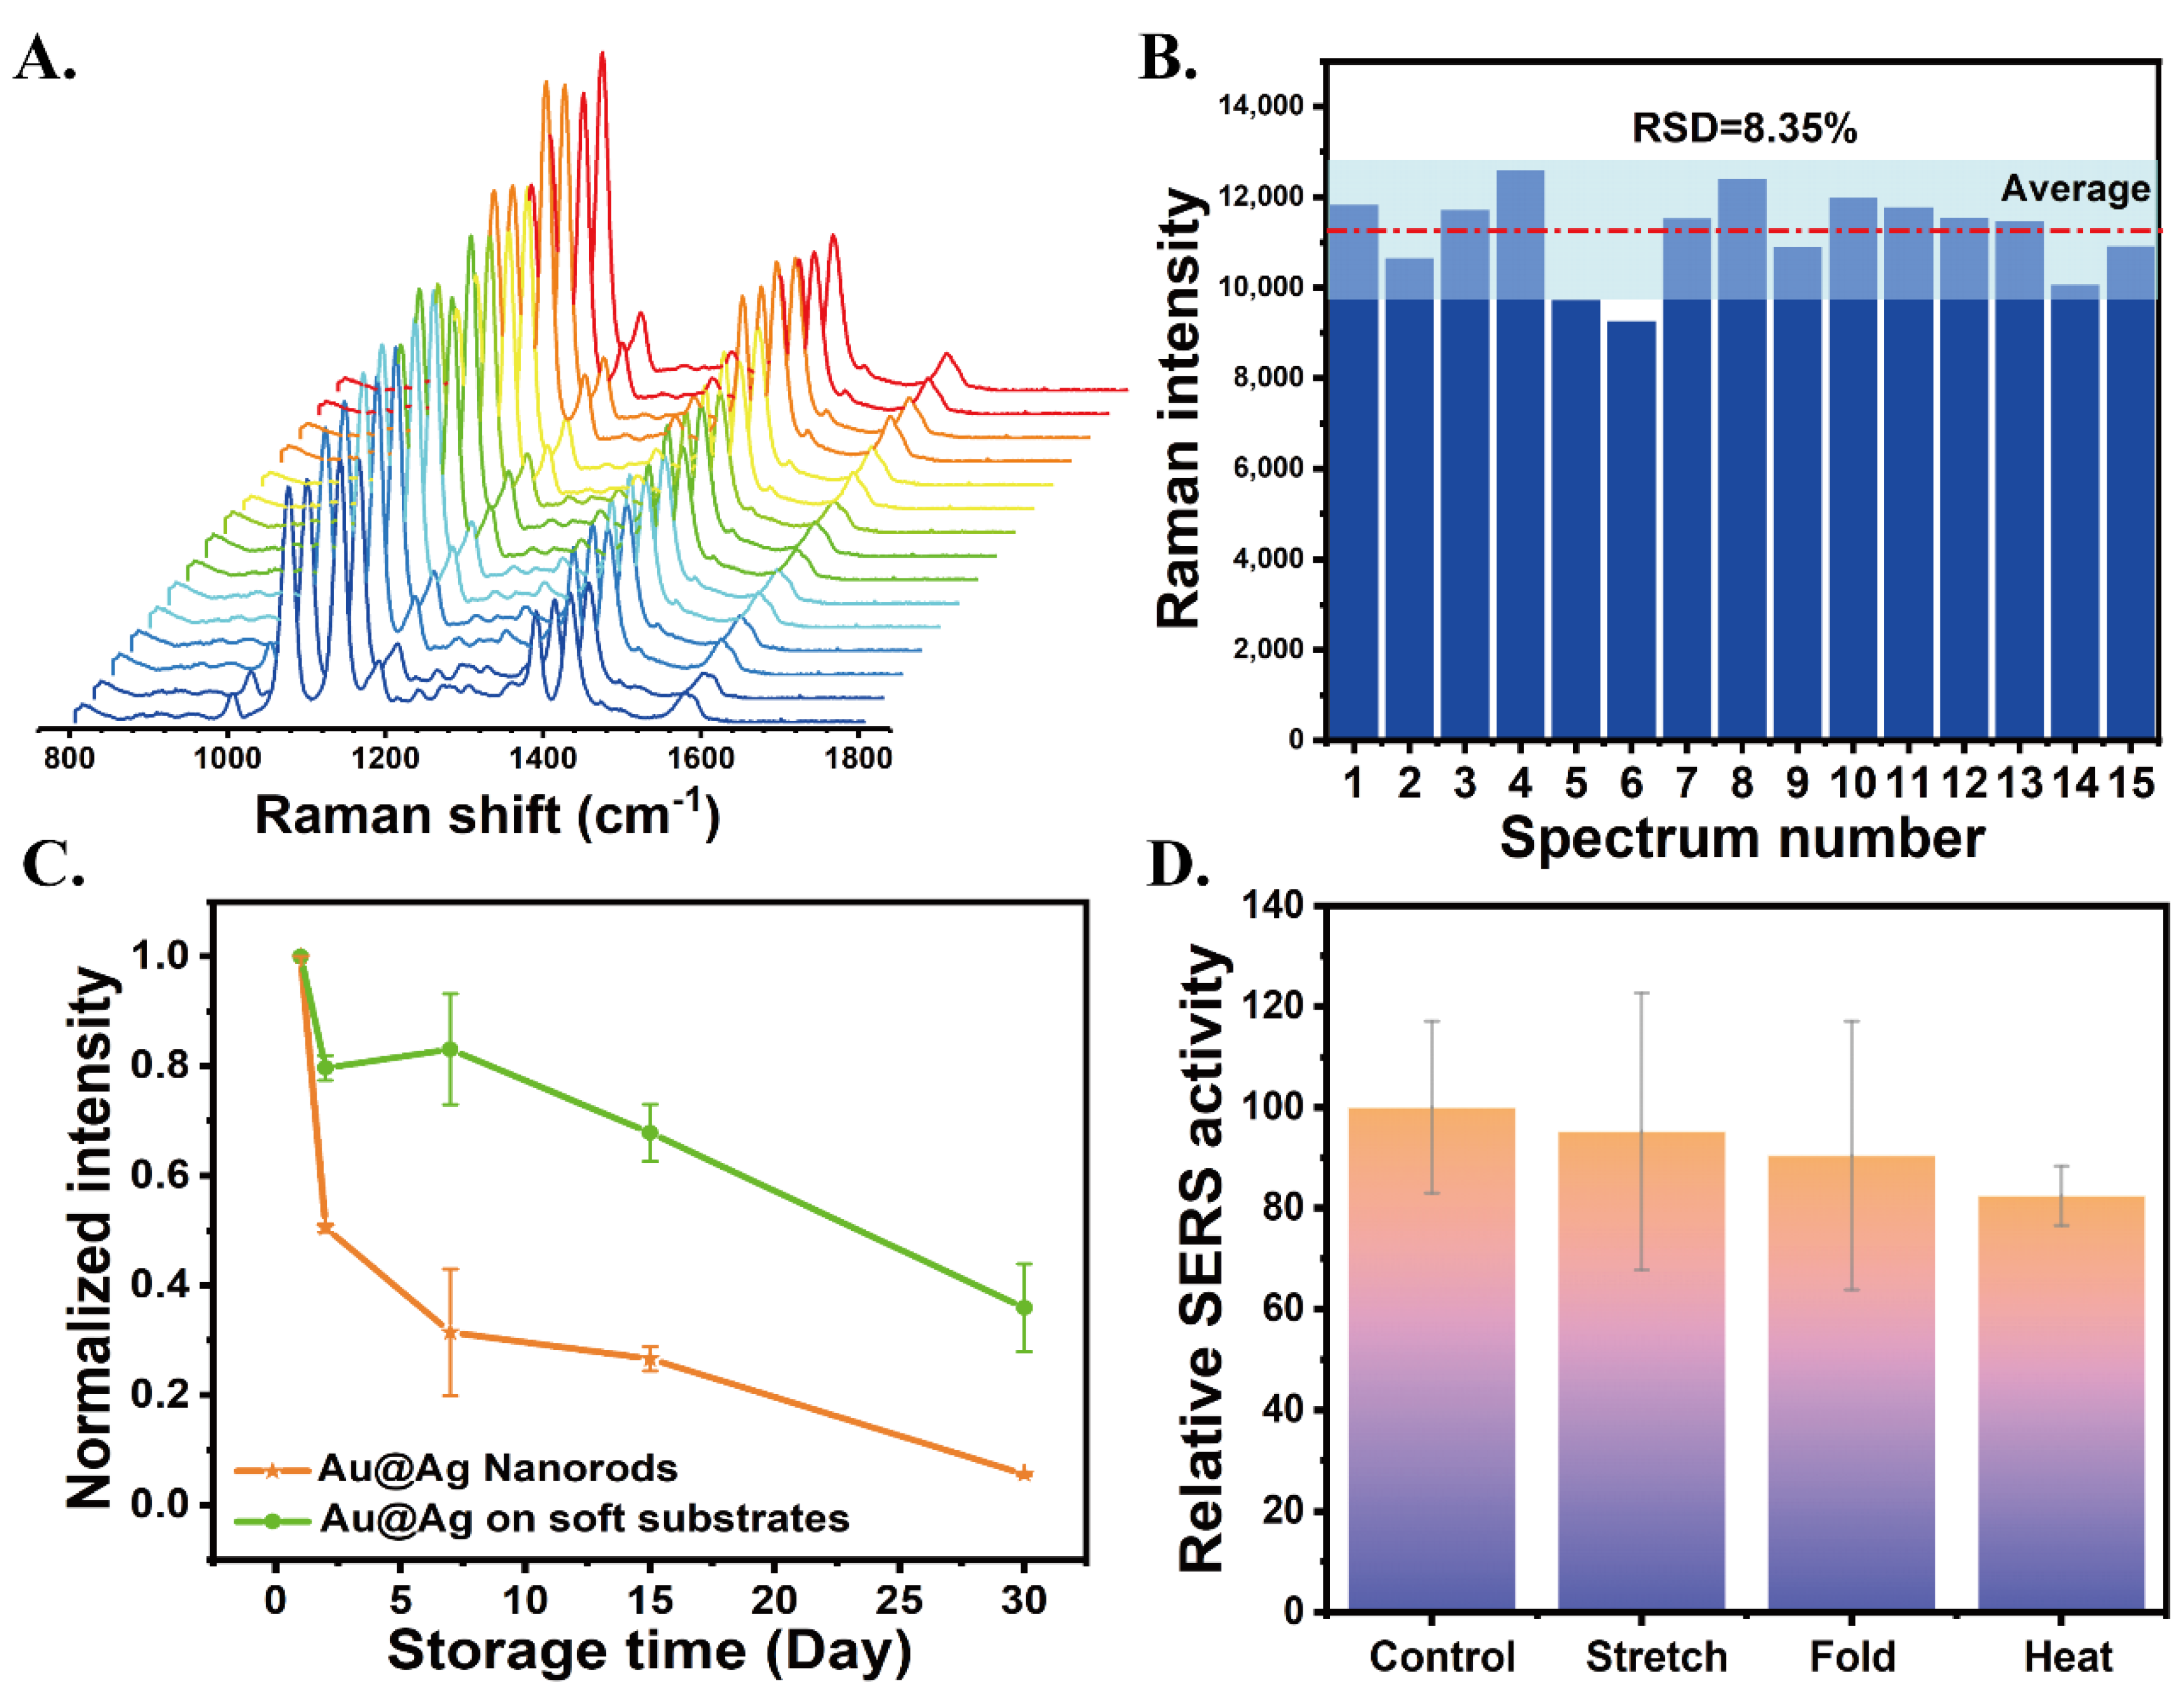
3.3. Uniformity and Stability of Au@Ag NRs Substrates

The SEM analysis revealed several voids and the stacking of the self-assembled arrays, which could have randomly affected the SERS operation. The homogeneity of the flexible substrate was examined by measuring the Raman signals of 4-ATP from 15 random points. According to the result in Figure 3A, two strong characteristic peaks of 4-ATP were observed near 1080 cm−1 and 1580 cm−1, which correspond to the stretching vibration of C−S and C=C, respectively [28]. Then, we chose 1580 cm−1 as the characteristic peak for quantitative evaluation, and it was observed that the SERS spectra of the randomly measured spots shared a similar spectral intensity without any remarkable difference. In addition, the SERS signals showed a relative standard deviation of 8.35% (the pale-blue-colored part), indicating that the substrate could be applied in quantitative measurements (Figure 3B). So, the defects in the self-assembled Au@Ag NRs arrays on the flexible SERS substrate had limited influence on the overall uniformity of the substrate.
The stability of SERS substrates is also very important for practical application, so it is necessary to examine if the Ag shell would be gradually oxidized during long-term storage and result in poor substrate performance. To check this, the Raman spectra of absorbed 4-ATP (10−6 M) was analyzed at different time intervals. All the SERS substrates were stored at ambient temperature. Figure 3C shows the SERS intensity variation in the detection of 4-ATP on the Au@Ag NRs flexible substrate with different storage periods. The comparison revealed that the stability of the Au@Ag NRs flexible substrate was significantly improved, whereas the Au@Ag NRs colloids almost lost their ability to enhance 4-ATP after 30 days, which could be due to the altered morphology of the Au@Ag NRs colloids (Figure S2A,B). In contrast, the Au@Ag NRs flexible substrate retained approximately 50 of the initial intensity, with the Raman signal fluctuating within an acceptable range. The SERS performance could be kept well, given storage under air-free conditions (as shown in Figure S3), also proving the stability of the SERS substrate. Besides, to check the application of the flexible substrate in practical detection, the SERS effect of the flexible substrate after stretching, folding, and heating was also tested, confirming that the flexible substrate maintained a high enhancement activity. Therefore, the above results demonstrated that the Au@Ag NRs flexible substrate exhibited good stability, even at ambient temperature and after a long period of storage.
Thiram is one illegal pesticide used to prolong the freshness of fruit and vegetables, albeit with high toxicity [29]. Figure 4A show the DFT optimized geometry and comparison of Raman spectra in different situations. The good agreement between the experimental and computational spectra guaranteed the excellent identification of the peaks [30]. Compared to the results obtained from DFT, the SERS characteristic peaks of the thiram solid powder and thiram in solution show slight shifts. The Raman characteristic peak around 1138 cm−1 is attributed to the stretching vibrations of C-N as well as the in-plane rocking vibrations of CH3. The characteristic peak at 1378 cm−1 in the SERS spectrum, showing the highest intensity, was chosen for thiram detection and analysis [31]. This band at 1378 cm−1 is attributed to the stretching vibration of C-N and the symmetrical deformation vibration of CH3. With the disappearance of the solvent, the Raman signal of the Au@Ag NRs array surface was enhanced by plasmonic resonance enhancement. The characteristic peaks and the corresponding vibration-mode assignments of the thiram are given in Table S1, while the vibration modes of the thiram molecule are shown in Figure S4.
The SERS spectra of thiram of different concentrations are shown in Figure 4B. The quantitative analysis showed the increase in spectral intensity with the rise in the concentration of thiram. Notably, the as-prepared Au@Ag NRs arrays substrate could detect thiram as low as 10−9 mol/L, with a LOD of 0.018 mg/L. A near-linear relationship could be found between the Raman intensity of 1378 cm−1 and the logarithm of the concentration of thiram in the range of 10−5–10−9 mol/L (Figure 4C). The fitted regression equation is y = 554.94x + 4826.68, with a coefficient of determination (R2) of 0.9813. Compared to the results from recently published papers [32], the above results indicate that the Au@Ag NRs SERS substrates prepared based on the interfacial self-assembly strategy had very high sensitivity and potential in quantitative analysis. Worth noting, the SERS spectra presented in the figure are just representative ones, because, for each concentration, several SERS spectra were recorded from different samples, which may show some difference in terms of intensity pattern. This may be due to a certain amount of inhomogeneity of the Au@Ag NRs distribution on the SERS substrate, as well as possibly different molecular adsorption states onto the nanoparticles, which is a common feature for the general SERS effect [33,34].

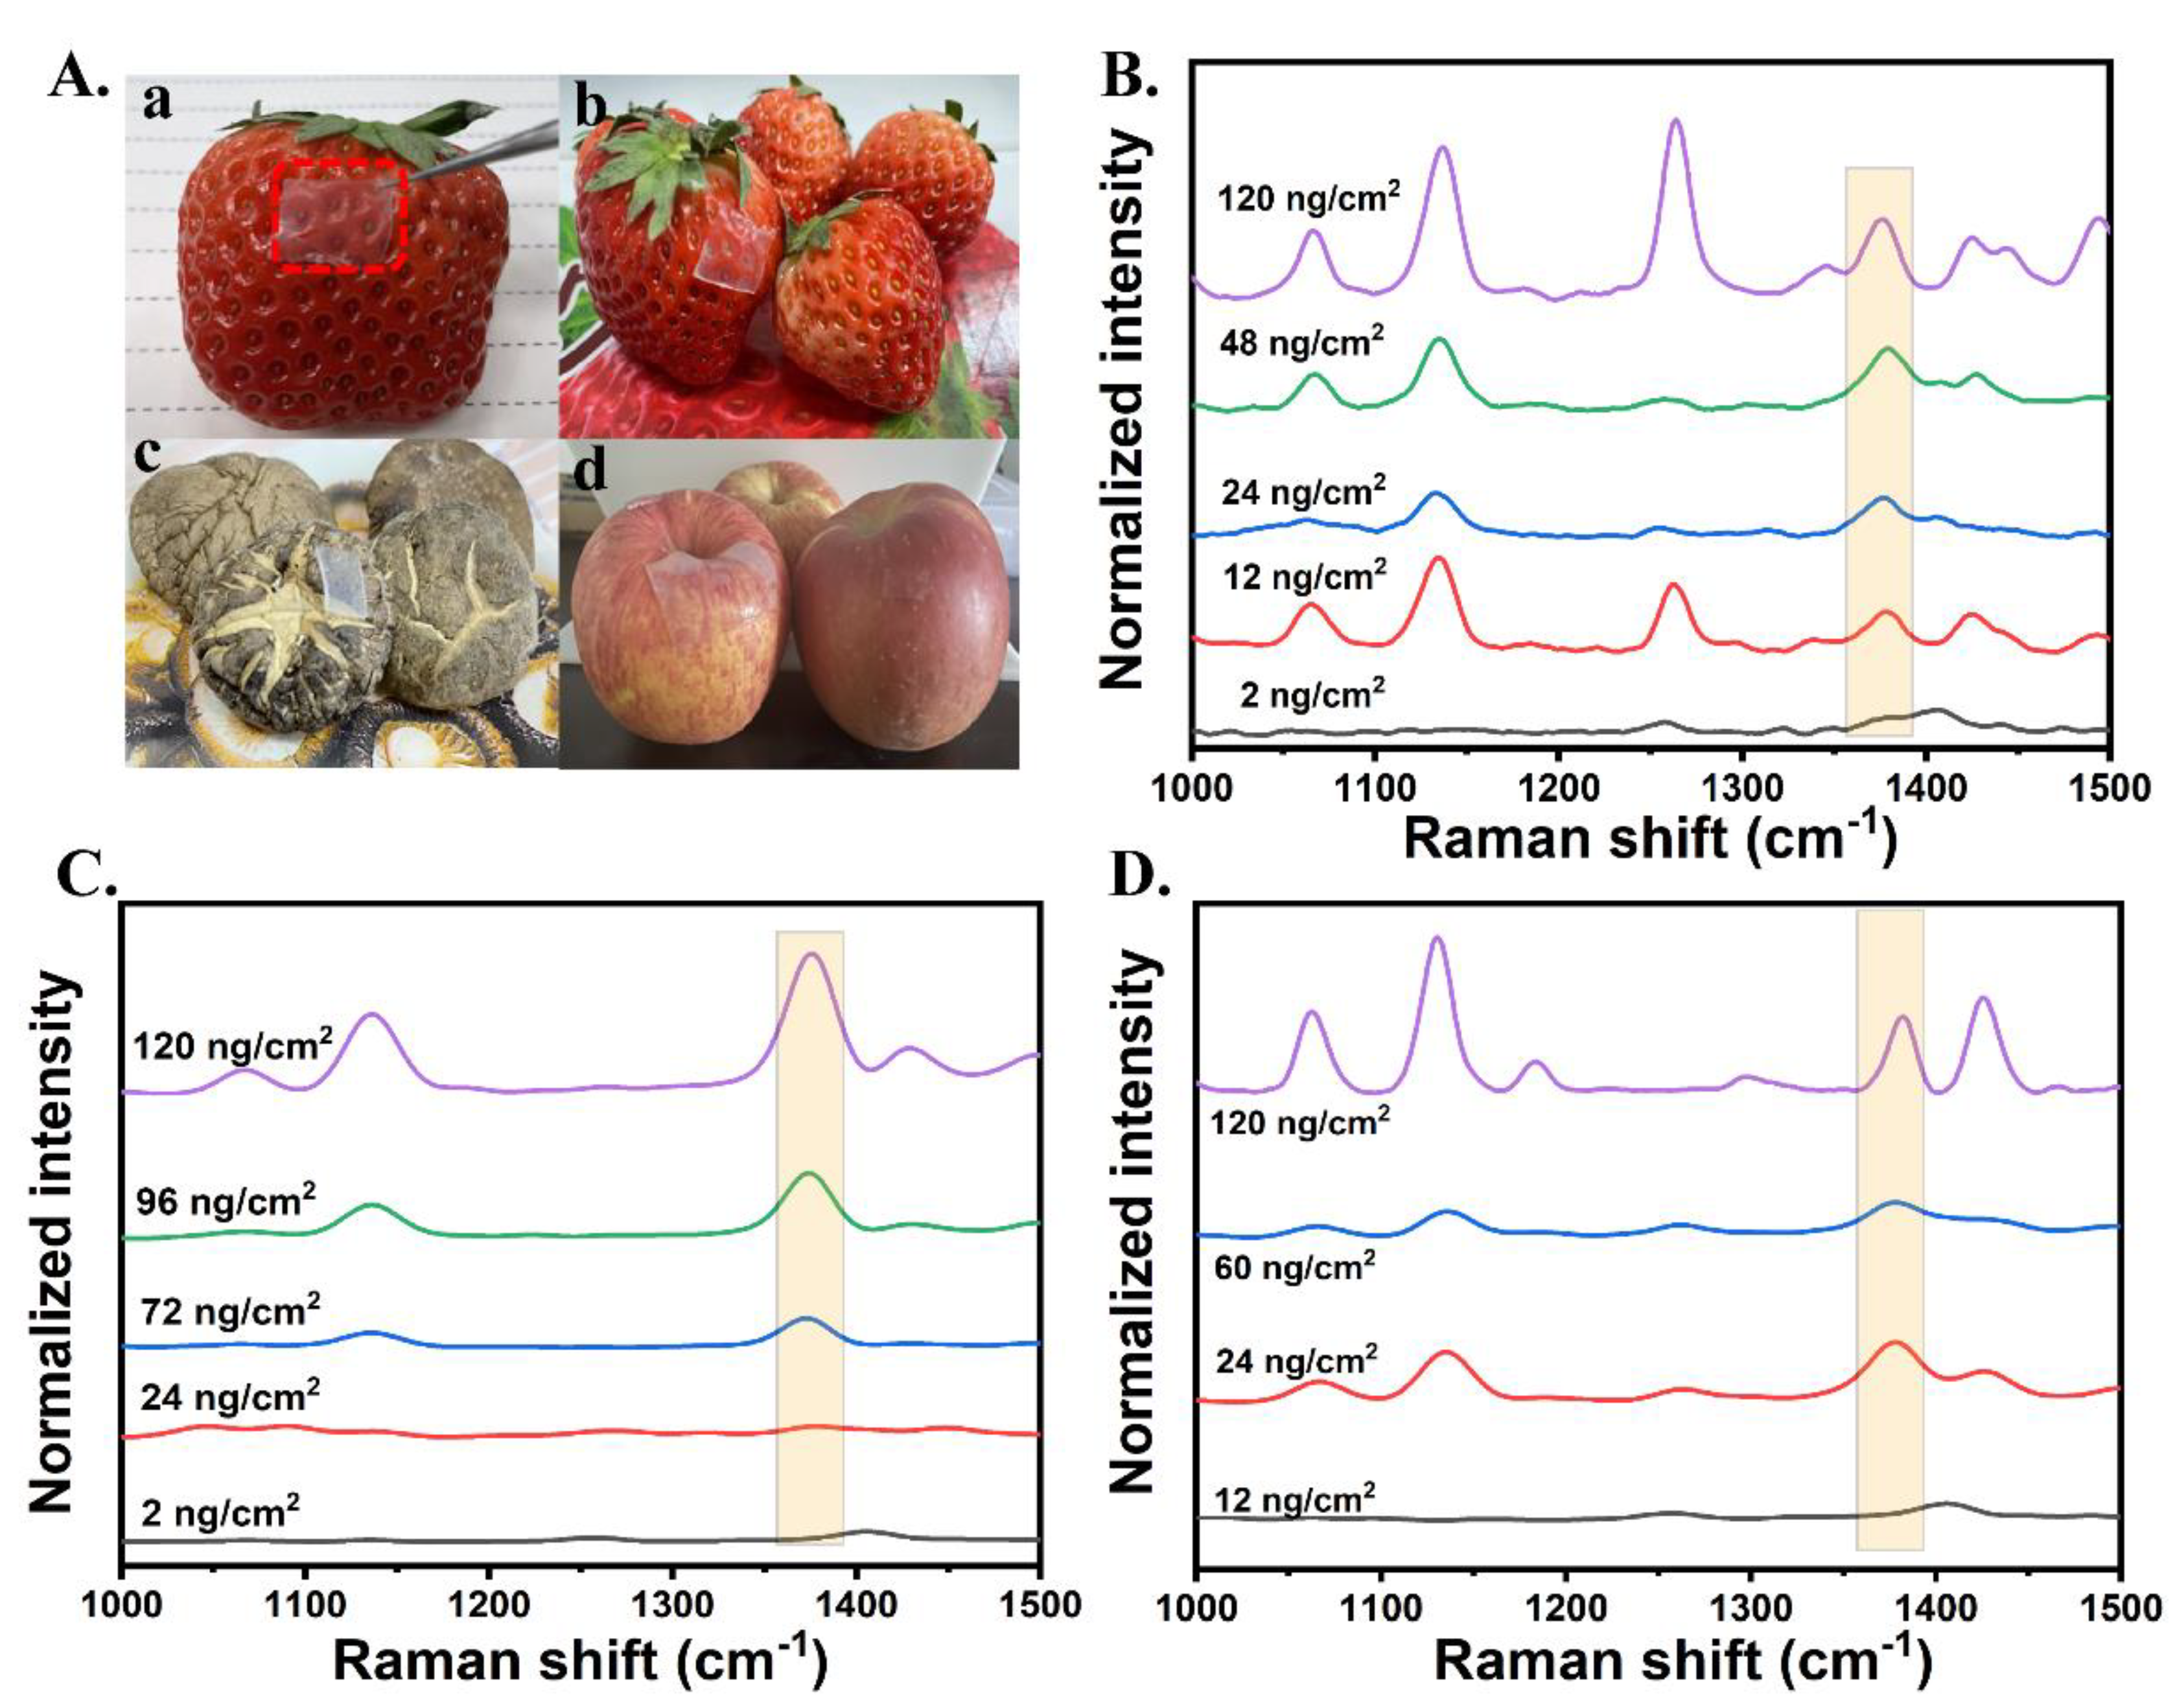
3.4. Application in Real Samples of Fruit and Vegetables

After testing the application of the flexible SERS substrate in detection of thiram in solutions, measurements of the contaminant residue on real samples were performed, to ensure the feasibility of the method [35]. As shown in Figure 5A, the flexible substrate could be pasted on a strawberry’s surface, and the SERS signals could be recorded directly. In this way, the direct detection could not only reduce the complex pre-treatment of the samples but also significantly save the measurement time. As shown in Figure 5B, based on the SERS spectra collected from the pesticide-contaminated peels, a LOD as low as 2 ng/cm2 could be reached, which is much lower than the allowable maximum residue levels (MRLs) of thiram in foods, as stipulated by the government [36]. To further illustrate the applicability of the flexible substrate to non-planar objects, different volumes of 10−4 M thiram were sprayed onto the surfaces of mushrooms and apples, and the flexible substrates were pasted onto the contaminated objects directly. As a result, the distinctive characteristic peaks of thiram were detected (Figure 5C,D).
Meanwhile, the HPLC and the enzyme inhibition methods (kit assay) were also utilized for testing (Figures S5 and S6), indicating that the HPLC was not able to detect the 0.1 mg/L thiram, while the pretreatment of the sample consumed a lot of time and chemical reagents. Using the thiram detection kit assay, the measurement could produce a false-positive result. Therefore, compared with other methods, our proposed SERS method indeed showed an advantage and may be used as one reliable method and tool for the on-line rapid nondestructive testing of pesticides in fruit and vegetables.

4. Conclusions

In summary, we have fabricated a novel flexible SERS substrate that is very useful and convenient for the rapid and nondestructive detection of pesticide residues in fruit and vegetables. The substrate consists of Au@Ag NRs arrays, formed by the self-assembly process, which exhibit excellent SERS activity and measurement repeatability. Moreover, due to the adhesive and semitransparent characteristics of the flexible SERS substrate, it can be readily attached to the surface of the inspected fruit/vegetable, resulting in the facile and sensitive detection of thiram pesticide residue of the ng/cm2 level on the peels or surfaces of strawberries, apples, and mushrooms, reaching the limit of detection (LOD) far below the maximum residue limit (MRL). Despite the fact that the SERS technique has some limits, such as that SERS enhancement also depends on the laser wavelength applied, this work has certainly demonstrated an alternative way for the rapid and nondestructive detection of pesticide residues in agricultural products, showing the promising potential for applications such as on-site food safety control and the screening of agricultural products in the field or at a farmers’ market.

Supplementary Materials

The following supporting information can be downloaded at: https://www.mdpi.com/article/10.3390/chemosensors10100423/s1, Figure S1: The procedure of Au@Ag Nanorods self-assembly: (A) Au@Ag NRs; (B) oil-water interface af-ter adding hexane; (C) Au@Ag NRs arrays; Figure S2: SEM images of Au@Ag Nanorods on (A) silicon wafer and (B) sol-gel after 30 days; Figure S3: SERS intensity of 4-ATP at 1580 cm−1 after storage of the SERS substrate under air and air-free conditions, respectively; Figure S4: The vibration modes of thiram molecule: stretching, In-plane bending, out-of-plane bending and deformation vibration; Figure S5: HPLC results of Thiram in strawberry; Figure S6: Results of assay-kit (A) Control, (B) sample and (C) positive group. Table S1: The corresponding vibration mode assignments of the thiram. The references [37,38,39,40,41] are cited in the supplementary material.

Author Contributions

Data curation, C.L., S.W. and X.D.; formal analysis, C.L.; investigation, C.L., Q.H.; methodology, C.L., S.W. and X.D.; resources, Q.H.; supervision, Q.H.; writing—original draft, C.L.; writing—review and editing, Q.H. All authors have read and agreed to the published version of the manuscript.

Funding

This research was supported by the National Natural Science Foundation of China (grant No. 11635013) and the Research Inte-gration Program of Hefei Institutes of Physical Science, Chinese Academy of Sciences.

Conflicts of Interest

The authors declare no conflict of interest.

References

  1. Savary, S.; Ficke, A.; Aubertot, J.-N.; Hollier, C. Crop losses due to diseases and their implications for global food production losses and food security. Food Secur. 2012, 4, 519–537. [Google Scholar] [CrossRef]
  2. Fenik, J.; Tankiewicz, M.; Biziuk, M. Properties and determination of pesticides in fruits and vegetables. TrAC Trends Anal. Chem. 2011, 30, 814–826. [Google Scholar] [CrossRef]
  3. Filipe, O.M.; Vidal, M.M.; Duarte, A.C.; Santos, E.B. A solid-phase extraction procedure for the clean-up of thiram from aqueous solutions containing high concentrations of humic substances. Talanta 2007, 72, 1235–1238. [Google Scholar] [CrossRef] [PubMed]
  4. Ishaq, Z.; Nawaz, M.A. Analysis of contaminated milk with organochlorine pesticide residues using gas chromatography. Int. J. Food Prop. 2018, 21, 879–891. [Google Scholar] [CrossRef]
  5. He, T.; Cui, P.L.; Liu, J.; Feng, C.; Wang, J.P. Production of a Natural Dihydropteroate Synthase and Development of a Signal-Amplified Pseudo-Immunoassay for the Determination of Sulfonamides in Pork. J. Agric. Food Chem. 2022, 70, 3023–3032. [Google Scholar] [CrossRef]
  6. Umapathi, R.; Ghoreishian, S.M.; Sonwal, S.; Rani, G.M.; Huh, Y.S. Portable electrochemical sensing methodologies for on-site detection of pesticide residues in fruits and vegetables. Coord. Chem. Rev. 2022, 453, 214305. [Google Scholar] [CrossRef]
  7. Alsammarraie, F.K.; Lin, M. Using Standing Gold Nanorod Arrays as Surface-Enhanced Raman Spectroscopy (SERS) Substrates for Detection of Carbaryl Residues in Fruit Juice and Milk. J. Agric. Food Chem. 2017, 65, 666–674. [Google Scholar] [CrossRef]
  8. Muhammad, M.; Yao, G.; Zhong, J.; Chao, K.; Aziz, M.H.; Huang, Q. A facile and label-free SERS approach for inspection of fipronil in chicken eggs using SiO2@Au core/shell nanoparticles. Talanta 2020, 207, 120324. [Google Scholar] [CrossRef] [PubMed]
  9. Orlando, A.; Franceschini, F.; Muscas, C.; Pidkova, S.; Bartoli, M.; Rovere, M.; Tagliaferro, A. A Comprehensive Review on Raman Spectroscopy Applications. Chemosensors 2021, 9, 262. [Google Scholar] [CrossRef]
  10. Perumal, J.; Wang, Y.; Attia, A.B.E.; Dinish, U.S.; Olivo, M. Towards a point-of-care SERS sensor for biomedical and agri-food analysis applications: A review of recent advancements. Nanoscale 2021, 13, 553–580. [Google Scholar] [CrossRef] [PubMed]
  11. Liu, C.; Xu, D.; Dong, X.; Huang, Q. A review: Research progress of SERS-based sensors for agricultural applications. Trends Food Sci. Technol. 2022, 128, 90–101. [Google Scholar] [CrossRef]
  12. Song, G.; Cong, S.; Zhao, Z. Defect engineering in semiconductor-based SERS. Chem Sci. 2022, 13, 1210–1224. [Google Scholar] [CrossRef]
  13. Zhang, J.Z.; Noguez, C. Plasmonic Optical Properties and Applications of Metal Nanostructures. Plasmonics 2008, 3, 127–150. [Google Scholar] [CrossRef]
  14. Lu, Y.; Zhong, J.; Yao, G.; Huang, Q. A label-free SERS approach to quantitative and selective detection of mercury (II) based on DNA aptamer-modified SiO2@Au core/shell nanoparticles. Sens. Actuators B Chem. 2018, 258, 365–372. [Google Scholar] [CrossRef]
  15. Yan, B.; Sun, K.; Chao, K.; Alharbi, N.S.; Li, J.; Huang, Q. Fabrication of a Novel Transparent SERS Substrate Comprised of Ag-nanoparticle Arrays and its Application in Rapid Detection of Ractopamine on Meat. Food Anal. Methods 2018, 11, 2329–2335. [Google Scholar] [CrossRef]
  16. Lin, X.-D.; Li, J.-F.; Huang, Y.-F.; Tian, X.-D.; Uzayisenga, V.; Li, S.-B.; Ren, B.; Tian, Z.-Q. Shell-isolated nanoparticle-enhanced Raman spectroscopy: Nanoparticle synthesis, characterization and applications in electrochemistry. J. Electroanal. Chem. 2013, 688, 5–11. [Google Scholar] [CrossRef]
  17. Wang, K.; Sun, D.W.; Pu, H.; Wei, Q. Two-dimensional Au@Ag nanodot array for sensing dual-fungicides in fruit juices with surface-enhanced Raman spectroscopy technique. Food Chem. 2020, 310, 125923. [Google Scholar] [CrossRef]
  18. Ma, Y.; Du, Y.; Chen, Y.; Gu, C.; Jiang, T.; Wei, G.; Zhou, J. Intrinsic Raman signal of polymer matrix induced quantitative multiphase SERS analysis based on stretched PDMS film with anchored Ag nanoparticles/Au nanowires. Chem. Eng. J. 2020, 381, 122710. [Google Scholar] [CrossRef]
  19. Qiu, H.; Wang, M.; Jiang, S.; Zhang, L.; Yang, Z.; Li, L.; Li, J.; Cao, M.; Huang, J. Reliable molecular trace-detection based on flexible SERS substrate of graphene/Ag-nanoflowers/PMMA. Sens. Actuators B Chem. 2017, 249, 439–450. [Google Scholar] [CrossRef]
  20. Cheng, D.; Bai, X.; He, M.; Wu, J.; Yang, H.; Ran, J.; Cai, G.; Wang, X. Polydopamine-assisted immobilization of Ag@AuNPs on cotton fabrics for sensitive and responsive SERS detection. Cellulose 2019, 26, 4191–4204. [Google Scholar] [CrossRef]
  21. Hu, B.; Sun, D.W.; Pu, H.; Wei, Q. Rapid nondestructive detection of mixed pesticides residues on fruit surface using SERS combined with self-modeling mixture analysis method. Talanta 2020, 217, 120998. [Google Scholar] [CrossRef]
  22. Lu, Z.; Dong, J.; Han, Q.; Gao, W.; Wang, Y.; Liu, J.; Wang, Z.; Sun, Z.; Wang, B.; Qi, J. Au@Ag nanorod horizontal arrays: Self-assembly preparation and in situ monitoring SERS of plasmonic catalytic reaction. J. Alloys Compd. 2020, 834, 155139. [Google Scholar] [CrossRef]
  23. Chen, M.; Luo, W.; Liu, Q.; Hao, N.; Zhu, Y.; Liu, M.; Wang, L.; Yang, H.; Chen, X. Simultaneous In Situ Extraction and Fabrication of Surface-Enhanced Raman Scattering Substrate for Reliable Detection of Thiram Residue. Anal Chem. 2018, 90, 13647–13654. [Google Scholar] [CrossRef]
  24. Xing, T.; Qian, Q.; Ye, H.; Wang, Z.; Jin, Y.; Zhang, N.; Wang, M.; Zhou, Y.; Gao, X.; Wu, L. Gold nanoparticles with helical surface structure transformed from chiral molecules for SERS-active substrates preparation. Biosens. Bioelectron. 2022, 212, 114430. [Google Scholar] [CrossRef] [PubMed]
  25. Hormozi-Nezhad, M.R.; Robatjazi, H.; Jalali-Heravi, M. Thorough tuning of the aspect ratio of gold nanorods using response surface methodology. Anal. Chim. Acta. 2013, 779, 14–21. [Google Scholar] [CrossRef]
  26. Khlebtsov, B.; Khanadeev, V.; Khlebtsov, N. Surface-enhanced Raman scattering inside Au@Ag core/shell nanorods. Nano Res. 2016, 9, 2303–2318. [Google Scholar] [CrossRef]
  27. Zhang, T.; Sun, Y.; Hang, L.; Li, H.; Liu, G.; Zhang, X.; Lyu, X.; Cai, W.; Li, Y. Periodic Porous Alloyed Au-Ag Nanosphere Arrays and Their Highly Sensitive SERS Performance with Good Reproducibility and High Density of Hotspots. ACS Appl. Mater. Interfaces 2018, 10, 9792–9801. [Google Scholar] [CrossRef]
  28. Xu, D.; Muhammad, M.; Chu, L.; Sun, Q.; Shen, C.; Huang, Q. SERS Approach to Probe the Adsorption Process of Trace Volatile Benzaldehyde on Layered Double Hydroxide Material. Anal. Chem. 2021, 93, 8228–8237. [Google Scholar] [CrossRef] [PubMed]
  29. Ibáñez, D.; Izquierdo-Bote, D.; González-García, M.B.; Hernández-Santos, D.; Fanjul-Bolado, P. Development of a New Screen-Printed Transducer for the Electrochemical Detection of Thiram. Chemosensors 2021, 9, 303. [Google Scholar] [CrossRef]
  30. Verma, A.K.; Soni, R.K. Ultrasensitive surface-enhanced Raman spectroscopy detection of explosive molecules with multibranched silver nanostructures. J. Raman Spectrosc. 2022, 53, 694–708. [Google Scholar] [CrossRef]
  31. Chen, J.; Huang, Y.; Kannan, P.; Zhang, L.; Lin, Z.; Zhang, J.; Chen, T.; Guo, L. Flexible and Adhesive Surface Enhance Raman Scattering Active Tape for Rapid Detection of Pesticide Residues in Fruits and Vegetables. Anal. Chem. 2016, 88, 2149–2155. [Google Scholar] [CrossRef]
  32. Xiong, Z.; Lin, M.; Lin, H.; Huang, M. Facile synthesis of cellulose nanofiber nanocomposite as a SERS substrate for detection of thiram in juice. Carbohydr. Polym. 2018, 189, 79–86. [Google Scholar] [CrossRef] [PubMed]
  33. Yao, G.; Zhai, Z.; Zhong, J.; Huang, Q. DFT and SERS Study of 15N Full-Labeled Adenine Adsorption on Silver and Gold Surfaces. J. Phys. Chem. C 2017, 121, 9869–9878. [Google Scholar] [CrossRef]
  34. Yao, G.; Huang, Q. DFT and SERS Study of l-Cysteine Adsorption on the Surface of Gold Nanoparticles. J. Phys. Chem. C 2018, 122, 15241–15251. [Google Scholar] [CrossRef]
  35. Kumar, S.; Goel, P.; Singh, J.P. Flexible and robust SERS active substrates for conformal rapid detection of pesticide residues from fruits. Sens. Actuators B Chem. 2017, 241, 577–583. [Google Scholar] [CrossRef]
  36. Jiao, A.; Dong, X.; Zhang, H.; Xu, L.; Tian, Y.; Liu, X.; Chen, M. Construction of pure worm-like AuAg nanochains for ultrasensitive SERS detection of pesticide residues on apple surfaces. Spectrochim. Acta A Mol. Biomol. Spectrosc. 2019, 209, 241–247. [Google Scholar] [CrossRef] [PubMed]
  37. Fu, G.; Sun, D.; Pu, H.; Wei, Q. Fabrication of gold nanorods for SERS detection of thiabendazole in apple. Talanta 2019, 195, 847–849. [Google Scholar] [CrossRef]
  38. Zhao, Y.; Truhlar, D.G. Density Functionals for Noncovalent Interaction Energies of Biological Importance. J. Chem. Theory Comput. 2007, 3, 289–300. [Google Scholar] [CrossRef] [PubMed]
  39. Laury, M.L.; Carlson, M.J.; Wilson, A.K. Vibrational frequency scale factors for density functional theory and the polarization consistent basis sets. J. Comput. Chem. 2021, 33, 2380–2387. [Google Scholar] [CrossRef]
  40. Lu, T.; Chen, F. Multiwfn: A multifunctional wavefunction analyzer. J. Comput. Chem. 2012, 33, 580–592. [Google Scholar] [CrossRef] [PubMed]
  41. Krishnakumar, V.; Keresztury, G.; Sundius, T.; Seshadri, S. Density functional theory study of vibrational spectra and assignment of fundamental vibrational modes of 1-methyl-4-piperidone. Spectrochim. Acta Part A Mol. Biomol. Spectrosc. 2007, 68, 845–850. [Google Scholar] [CrossRef] [PubMed]
Scheme 1. Schematic illustration of synthesis of the SERS substrate, consisting of Au@Ag NRs arrays, and its application in the detection of pesticide residue on the surface of fruit/vegetables.
Chemosensors 10 00423 sch001
Figure 1. (A) The light absorption spectra of AuNRs and Au@Ag NRs. The inset is the photo image of the nanoparticle colloids. “(B,C) are SEM images of Au NRs (B), Au@Ag NRs (C). (D,E) are TEM images of Au@Ag NRs. (F) HRTEM of Au@Ag NRs. (G) HAADF-STEM-EDS mapping images of Au@Ag NRs with different elemental colors.
Chemosensors 10 00423 g001
Figure 2. (A) SEM image of the silicone substrate (inset: normal photo of silicone band). (B) SEM image of the SERS substrate consisting of self-assembled Au@Ag NRs arrays (inset: photo of Au@Ag NRs on the silicone substrate). Raman measurements: (C) Raman spectra of different control samples (1. 106 M p-ATP in the SERS substrate (composite of Au@Ag NRs and the silicone); 2. 10−4 M p-ATP; 3. the SERS substrate; 4. the blank Au@Ag NRs; 5. the blank silicone substrate). (D) SERS spectra of 4-ATP probe with different concentrations, collected on the Au@Ag NRs arrays.
Chemosensors 10 00423 g002
Figure 3. (A) Raman spectra of 4-ATP obtained from 15 random points on Au@Ag NRs substrate. (B) SERS intensity of 4-ATP at 1580 cm−1 from 15 random detection points (the pale-blue-colored part refers to the standard deviation, RSD = 8.35%). (C) SERS intensity of 4-ATP at 1580 cm−1 after storage of Au@Ag NRs and Au@Ag NRs substrates for 30 days. (D) SERS intensity comparison for measuring 4-ATP at 1580 cm−1 in different situations. (N = 3).
Chemosensors 10 00423 g003
Figure 4. (A) Raman spectrum of thiram of solid sample, the SERS measurement of thiram (at 10−6 M), and the DFT calculation of the Raman spectrum, respectively. (B) SERS spectra of thiram with different concentrations in solution (spectrum of 10−9 M multiplied by a factor of 2) (inset: molecular structure of thiram). (C) Linear regression curve representing the quantitative relationship between logarithmic thiram concentrations and their corresponding SERS intensities.
Chemosensors 10 00423 g004
Figure 5. (A) Schematic diagram for the on-site SERS detection: a. and b. strawberries; c. mushrooms, and d. apples; (BD) are Raman spectra of thiram residues on (B) strawberries, (C) mushrooms, and (D) apples, respectively.
Chemosensors 10 00423 g005
Publisher’s Note: MDPI stays neutral with regard to jurisdictional claims in published maps and institutional affiliations.

