Article

A New Chemosensor Based on a Luminescent Complex for the Investigation of Some Organophosphorus Pesticides in Environmental Samples

by
Mohsen A. M. Alhamami
1,
Jari S. Algethami
1,2,*,
Moustafa A. Rizk
3,4,*,
Abbas M. Abbas
4 and
Gasser M. Khairy
4,*
1
Department of Chemistry, College of Science and Arts, Najran University, Najran 11001, Saudi Arabia
2
Promising Centre for Sensors and Electronic Devices (PCSED), Najran University, Najran 11001, Saudi Arabia
3
Department of Chemistry, Faculty of Science and Arts, Sharurah, Najran University, Najran 11001, Saudi Arabia
4
Department of Chemistry, Faculty of Science, Suez Canal University, Ismailia 41522, Egypt
*
Authors to whom correspondence should be addressed.
Chemosensors 2022, 10(10), 391; https://doi.org/10.3390/chemosensors10100391
Submission received: 26 August 2022 / Revised: 17 September 2022 / Accepted: 20 September 2022 / Published: 24 September 2022
(This article belongs to the Section Optical Chemical Sensors)

Abstract

:
Organophosphorus pesticides (OPPs) play a vital role in agriculture. However, their release into the environment can have serious repercussions. Therefore, the development of rapid and reliable methods for determining OPPs has received considerable attention in recent decades. Here, a new chemosensor based on a complex of vitamin B1 (vitB1) as a ligand with europium(III) ion, with a 1:2 stoichiometric ratio, was developed in solution to detect chlorfenvinphos and malathion in water samples using the luminescence method. The detection method is based on the luminescence quenching of a Eu(III)–vitamin B1 probe in solution upon increasing the concentration of chlorfenvinphos or malathion. The optimum solvent for the detection was methanol. The detection limits were 0.31 and 0.12 µM for chlorfenvinphos and malathion, respectively. According to the ratiometric method, malathion has a 13-fold higher binding affinity for the Eu(III)–(vitB1)2 complex than chlorfenvinphos. The reaction between the probe and OPPs under study was spontaneous and had a negative ΔG0. The method was successfully applied to determine chlorfenvinphos and malathion in three different water samples. Based on these studies, future work will be carried out to establish the optic fiber sensor.

Graphical Abstract

1. Introduction

Organophosphorus pesticides (OPPs) are widely used in agriculture because they effectively protect plants from various hazardous organisms such as fungi, insects, weeds, and other pesticides [1]. They have been shown to increase agricultural quality and yield [2]. The increased use of pesticides in agriculture has had many positive benefits, such as improved crop yields and farmland. Consequently, pesticides are cost-effective and efficient chemical compounds for agricultural productivity [3]. Despite their ubiquitous use, pesticides are highly hazardous to humans, resulting in significant health issues [4,5] due to pesticide residues in food and water [6]. However, the 3.0 million tons of pesticides used every year worldwide have also led to problems of drinking water contamination, residue on agricultural products, and pollution of wildlife and marine habitats. These issues are relevant in agricultural countries which have significant and long-standing agricultural industries. Therefore, this study aims to develop a luminescent chemosensor that can identify and measure the concentrations of organophosphate pesticides, which is sufficiently versatile to be readily adapted to include the ever-growing list of new pesticides. In this context, considerable effort is being made to develop a method for detecting the traces of OPPs. Numerous techniques for determining OPPs have been published, including chromatographic methods [7,8,9,10], electromethods [11,12,13], fluorescence, luminescence, colorimetric, and chemiluminescence methods [14,15,16,17]. Chromatographic techniques are characterized by high sensitivity and selectivity. Although chromatographic methods are standard, they frequently require a concentration step to increase the detection sensitivity, rendering the samples useless.
Furthermore, the processes are sophisticated and require a pricey apparatus and highly experienced technicians. A simple, quick, and sensitive analytical approach is required to test the OPPs regularly. The design of luminescent chemosensors has made promising advances. There are several benefits to using chemosensors over other approaches. A spectrofluorometric approach is an up-and-coming method for assessing diverse OPPs because it combines high sensitivity and simplicity. Fluorescent probes seem to be the best option among the numerous detection methods because of their high sensitivities, selectivities, direct detection capability, and rapid reaction time [18,19].
Lehn [20] discovered that the complexes of lanthanide ions with an organic molecule structure possess remarkable photophysical features that qualify them for usage as light conversion molecular devices (LCMDs). The europium complexes have received increased interest owing to their intense emission, due to their strong luminescence caused by an f–f sensitivity transition with a significant Stokes shift as well as their long lifetime [21,22,23,24]. These unique characteristics have permitted the construction of luminescent probes with high sensitivity. The emission or absorption spectra of europium(III) ions exhibit low intensities. However, the attachment of organic ligands to the europium(III) ions that function as sensitizers could enhance the excitation state population. Lehn referred to those ligands as “antennas” [25]. In the europium (III)–complex, the intramolecular energy transfer process takes place after the absorption of the excitation energy by the ligand. Then, the excitation energy is transferred to the europium (III) ion, leading to a rise in the fluorescence intensity of the europium (III) ions.
In this study, a new chemosensor based on the complex of vitamin B1 (vitB1) as a ligand with europium (III) was developed in solution to investigate different organophosphorus pesticides (OPPs) in water samples using the luminescence method. The sensing procedure was based on forming a ternary complex between europium (III)–(vitB1)2 and OPPs in solution. The new probe demonstrated an accurate and precise luminescence method for sensing malathion and chlorfenvinphos via a static quenching mechanism. The selectivity of the probe for malathion and chlorfenvinphos was examined using ratiometric analysis. The probe was more selective toward malathion than toward chlorfenvinphos. The proposed method successfully determined the malathion and chlorfenvinphos in three water samples. Based on these studies, future work will be carried out to establish the accuracy and selectivity of molecularly imprinted polymer (MIP) fiber-optic sensors. These will be tested using a bundle of MIP fiber-optic cables in an array-like format to directly monitor the aqueous organophosphate samples.

2. Materials and Methods

2.1. Materials

The OPPs were purchased from Sigma-Aldrich (www.sigmaaldrich.com (accessed on 1 January 2021); St. Louis, MO, USA). The OPPs used were azinphos-ethyl (P1), chlorfenvinphos (P2), chlorpyrifos (P3), crotoxyphos (P4), diazinon (P5), dichlorvos (P6), isofenphos (P7), malathion (P8), paraoxon-ethyl (P9), phosdrin (P10), endosulfan (P11), and heptachlor (P12). Eu(III)Cl3.6H2O was purchased from Sigma-Aldrich (www.sigmaaldrich.com (accessed on 1 January 2021); St. Louis, MO, USA). Vitamin B1 (vitB1) was obtained from EGPI (www.egyptiangroup.net (accessed on 24 January 2020); Obour City, Egypt). The chemical structures of the ligand and the OPPs are shown in Scheme 1. All of the solvents used were of analytical grade.

2.2. Instruments

The UV-VIS spectra were recorded on a Shimadzu UV-1800 UV/Visible Spectrophotometer (https://www.shimadzu.com (accessed on 5 May 2017); Shimadzu, Kyoto, Japan) in quartz cells with 1.0 cm of path length. The luminescence spectra were recorded with a Jasco FP-6300 Spectrofluorometer (Jasco, Tokyo, Japan) (https://jascoinc.com (accessed on 8 September 2010)), in quartz cells with 1.0 cm of path length and a 150-W xenon lamp for excitation. The excitation/emission bandwidths were 5 nm.

2.3. Solution Preparation

Stock solutions of 10−3 M of Eu(III) ion and vitB1 were prepared by dissolving a certain weight of the metal ion and ligand in methanol. Stock solutions of the OPPs (10−3 M) were prepared in methanol. The stock solutions were stable for two weeks. The working solutions were prepared daily. All solutions were kept in a refrigerator and insulated from light with aluminum foil. The luminescence spectra and intensities were monitored at the fixed analytical emission wavelength (λem = 615 nm) of the complex. Luminescence titrations were performed in a 1-cm quartz cuvette by the successive addition of pesticides (0, 0.4, 0.6, 1, 2, 4, 8, 10, and 20 µM) to solutions of 2.5 × 10⁻⁵M Eu (III) chloride and 5 × 10⁻⁵M vitB1. The titration data were analyzed according to the modified Stern–Volmer equation to investigate the types of interaction between the Eu (III)–complex, and the chlorfenvinphos and malathion pesticides. A 1:2 stoichiometry of Eu (III):vitB1 was used in all experiments. The analysis was performed by using the decrease of luminescence intensity due to the quenching results from the interaction between the Eu (III)–vitB1 probe and pesticides. The measurements were repeated thrice, and the average luminescence intensity was calculated.

2.4. Binding Affinity Calculation

The selectivity of the europium (III)–(vitB1)2 probe for malathion and chlorfenvinphos was evaluated by calculating the binding affinity constants using ratiometric analysis. The ratiometric analysis was performed by recording the fluorescence intensity at λem = 616 nm of the emission spectra of the europium (III)–(vitB1)2 probe with different concentrations of OPPs (malathion and chlorfenvinphos) in methanol.
Equation (1) calculated the binding affinity constant (K) using Microsoft Excel 365 with the solver add-in.
[ P ] = f K + [ Eu ( III ) c o m p l e x ]   x   f [ Eu ( III ) c o m p l e x ]   x   f 2 1 f
f = F 0 F F 0 F 1
where [P] is the pesticide concentration, (F0) is the luminescence intensity at 616 nm of the probe just before the titration begins, (F) is the luminescence intensity of the probe at 616 nm, (F1) is the final luminescence intensity at 616 nm, and [Eu (III)-complex] is the complex concentration.

2.5. Preparation of Water Samples

Three different water samples (waste, river, and tap water) were collected and used to check the accuracy of the chemosensor. These samples were collected in 1000-mL plastic bottles. Various concentrations of malathion or chlorfenvinphos were added to these samples. The prepared samples were left for 24 h after their addition and were then ready for analysis.

3. Results and Discussions

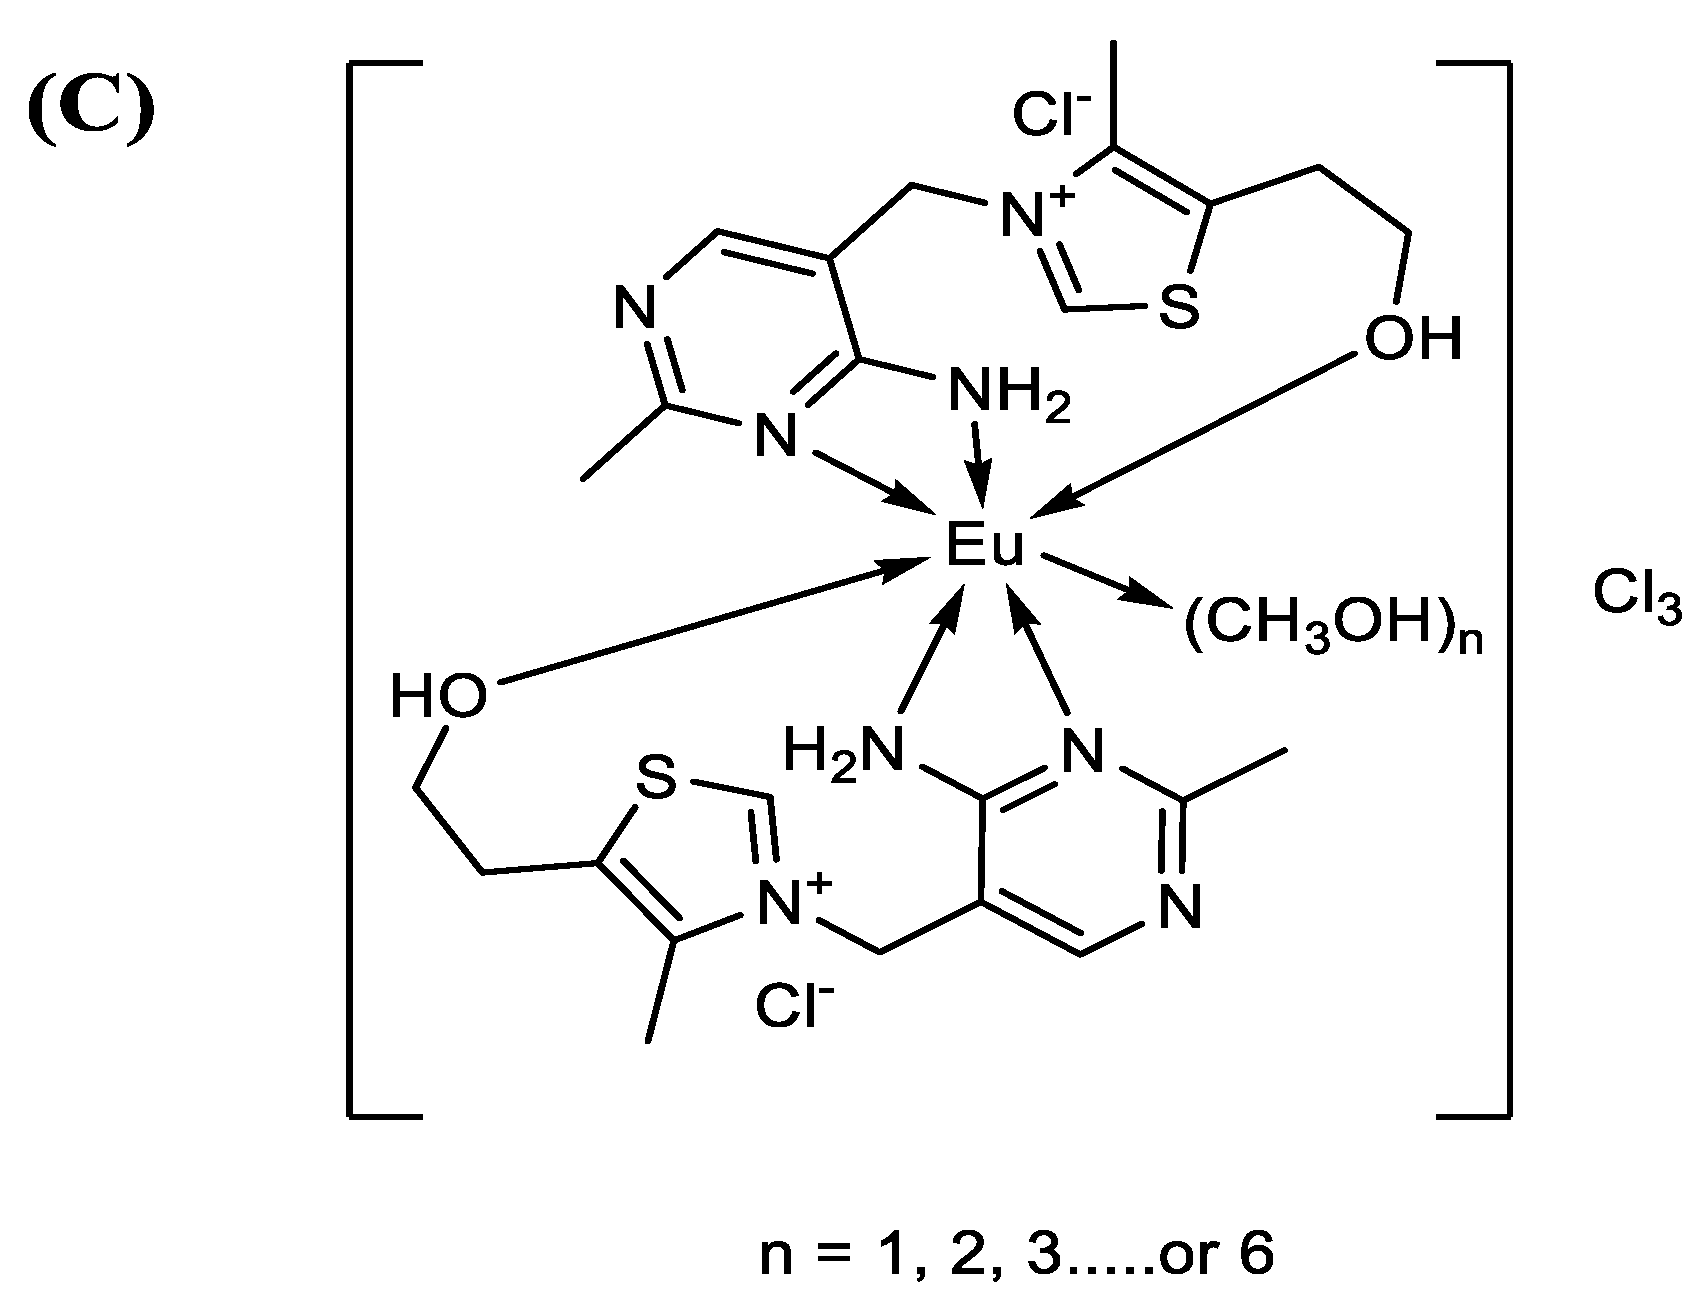
3.1. The Spectroscopy of Europium (III)–(vitB1)2 Complex

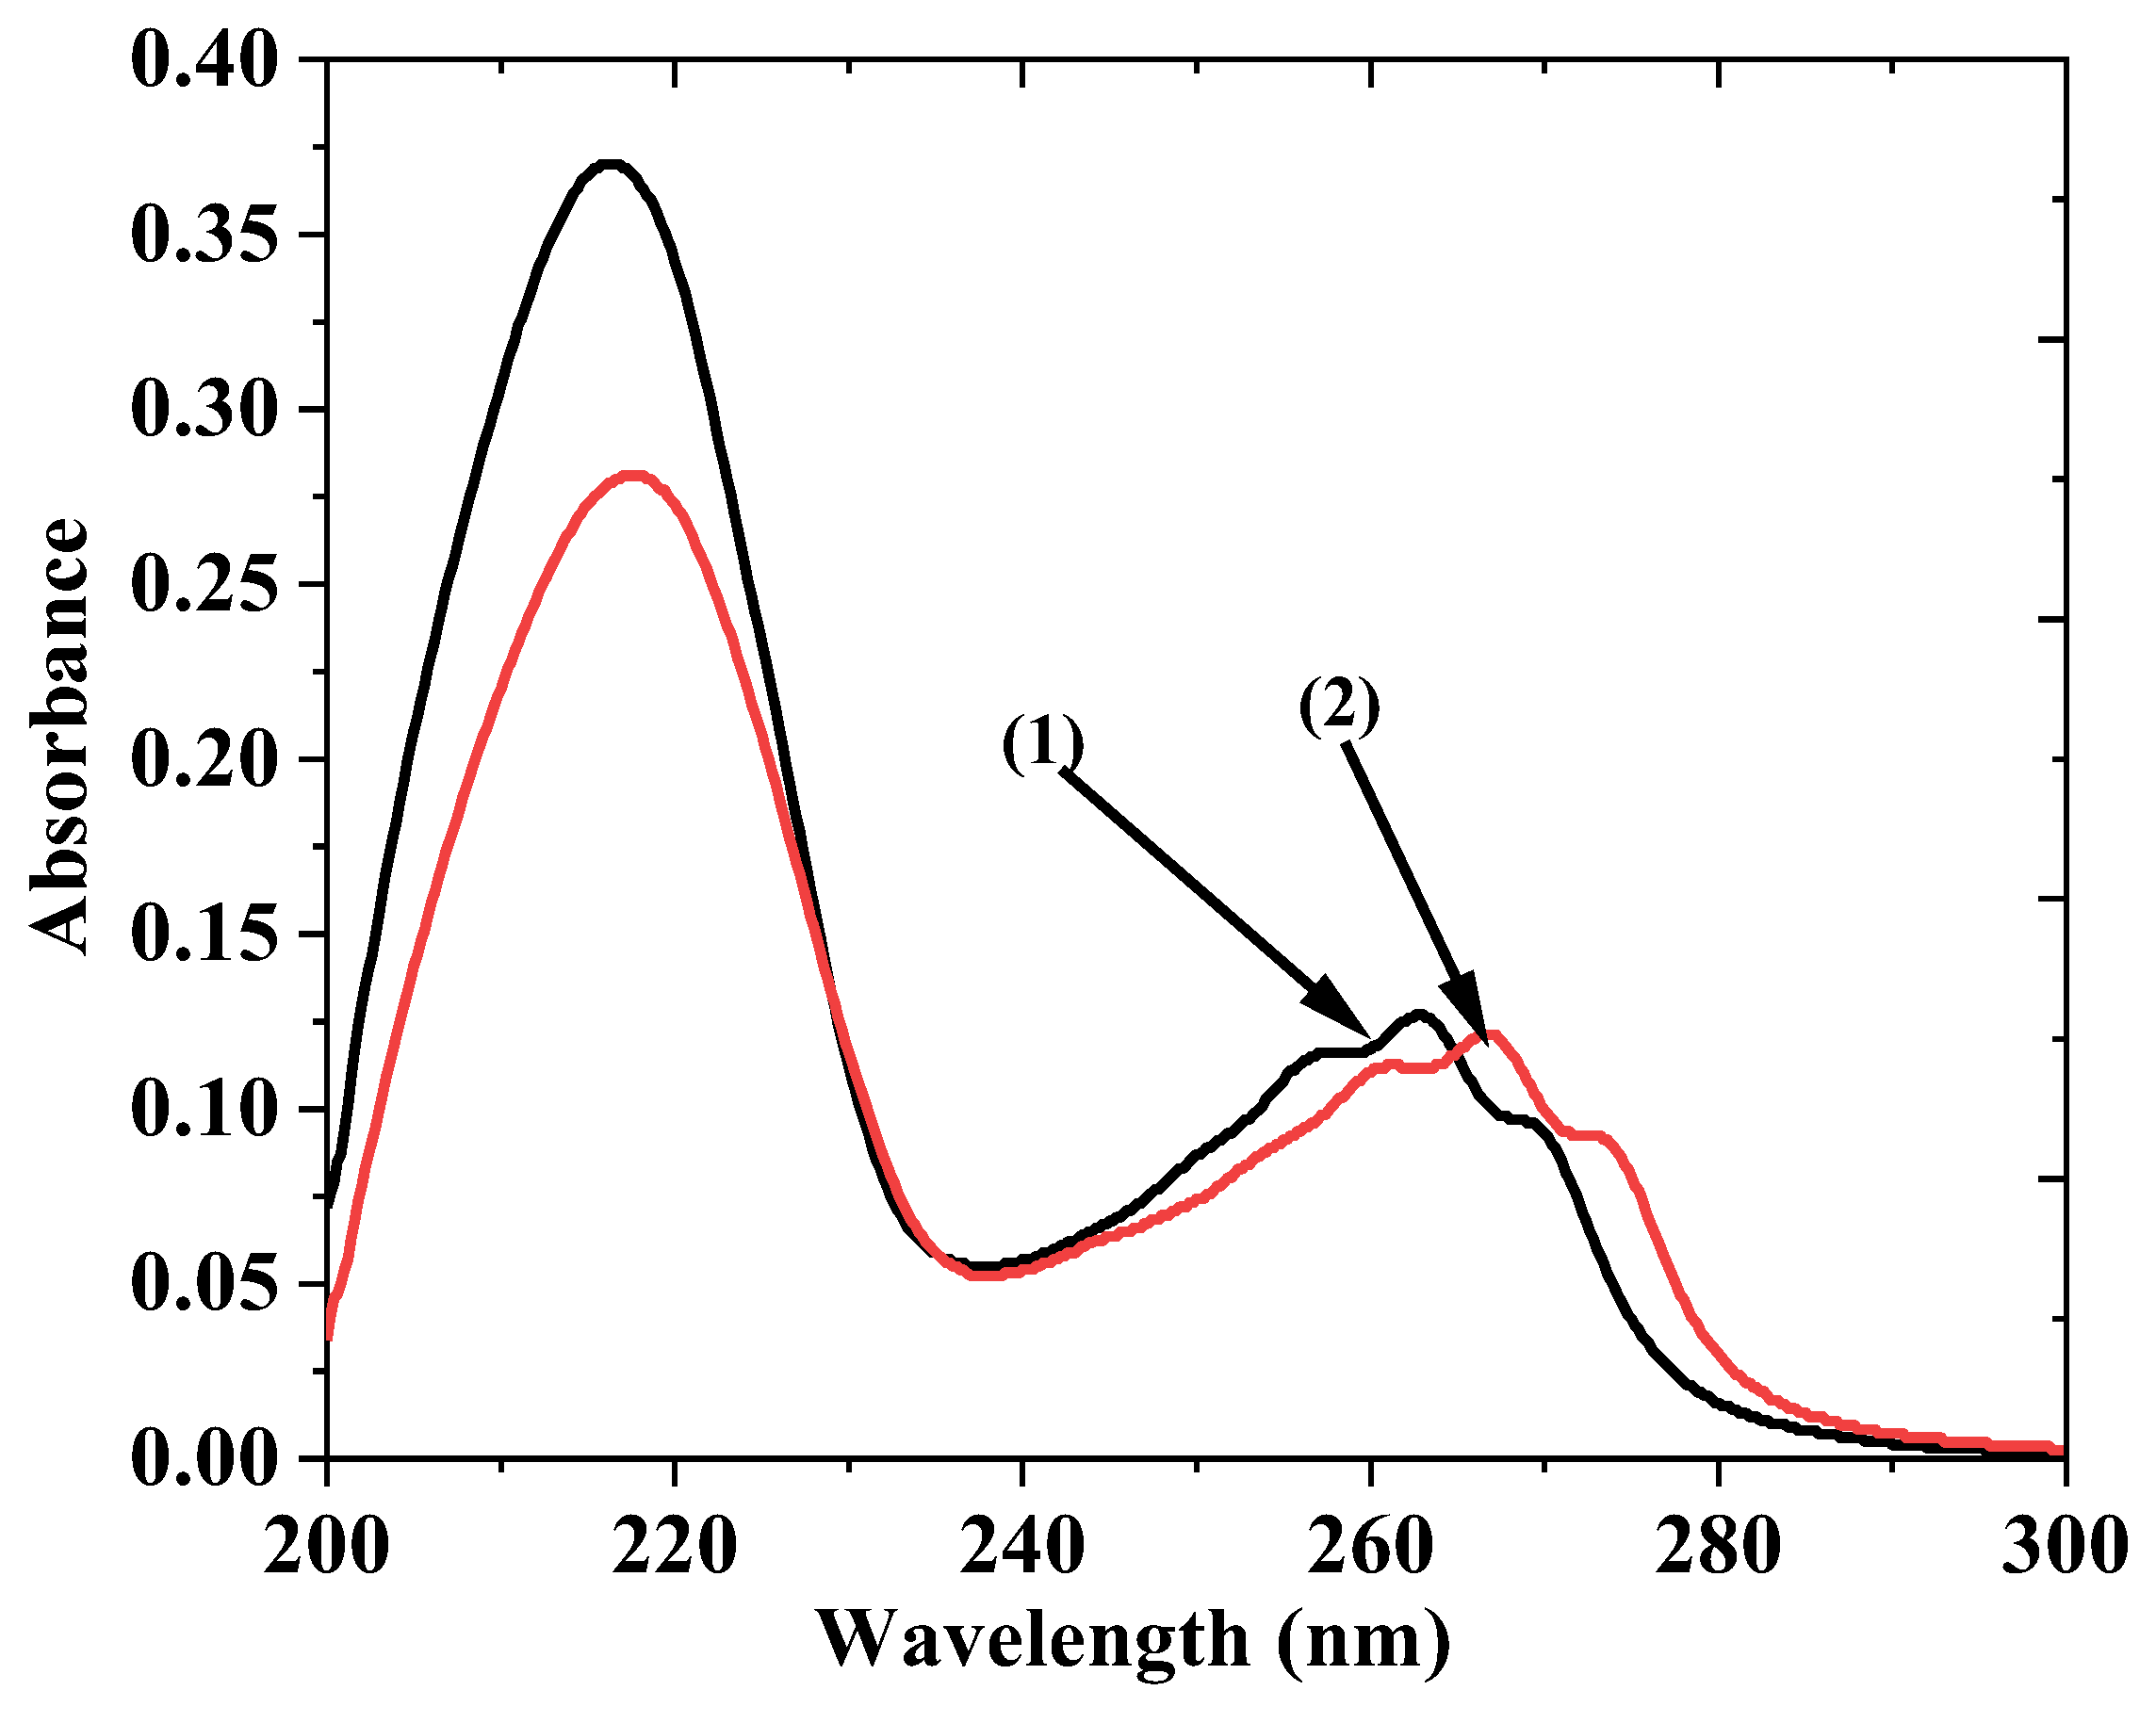
3.1.1. UV-Vis Absorption Spectroscopy

The interaction of vitamin B1 in methanol with the europium(III) ion was studied using the absorption spectrum, as illustrated in Figure 1. Two absorption bands are visible in the absorption spectra of vitamin B1 in methanol: one at 217 nm due to π–π* and the other at 263 nm due to n–π* transitions, with two shoulders at 257 and 269 nm. The extinction coefficient of vitB1 at the λ 263 nm was calculated (ε263 nm = 2.54 × 10³ L mol−1 cm−1). Substantially less absorbance was observed when europium (III) ions were added to the vitB1 solution, shifting the wavelength to 268 nm, leading to a complex formation between the europium (III) ion and the ligand with an extinction coefficient (ε268 nm = 4.88 × 10³ L mol−1 cm−1) [23]. Figures S1 and S2 show the UV-vis spectra of the 5 × 10⁻⁵ mol·L−1 ligand (vitB1) and 2.5 × 10⁻⁵ mol·L−1 Eu (III)–(vitB1)2 complex in various solvents at room temperature.
According to the results of this study, the n–π* and π–π* bands for the ligand and complex decreased in wavelength with increasing polarity of the solvents, in the order: water > methanol > ethanol > acetonitrile, where the n → π* and π → π* electronic transitions for both the ligand and europium (III)–complex exhibited different responses to the solvents’ polarity. Polar solvents stabilize all three molecular orbitals (n, π, and π*) to varying degrees. The n orbitals are the most stabilized, and then the π* orbital. As a result, the π → π* and n → π* absorption bands showed a hypsochromic shift [26]. UV-vis spectroscopy was used to monitor the europium (III)–complex in methanol for 24 h. Under these settings, no ligand liberation was detected, and the complex was stable.

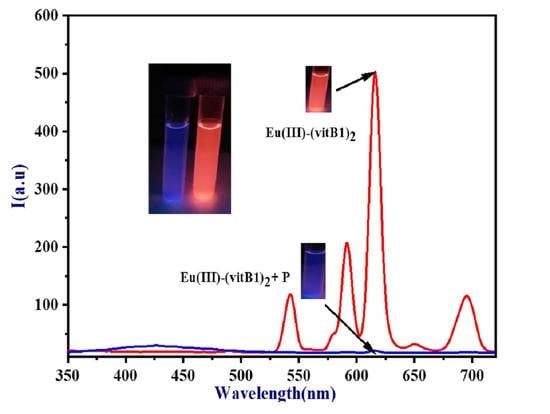
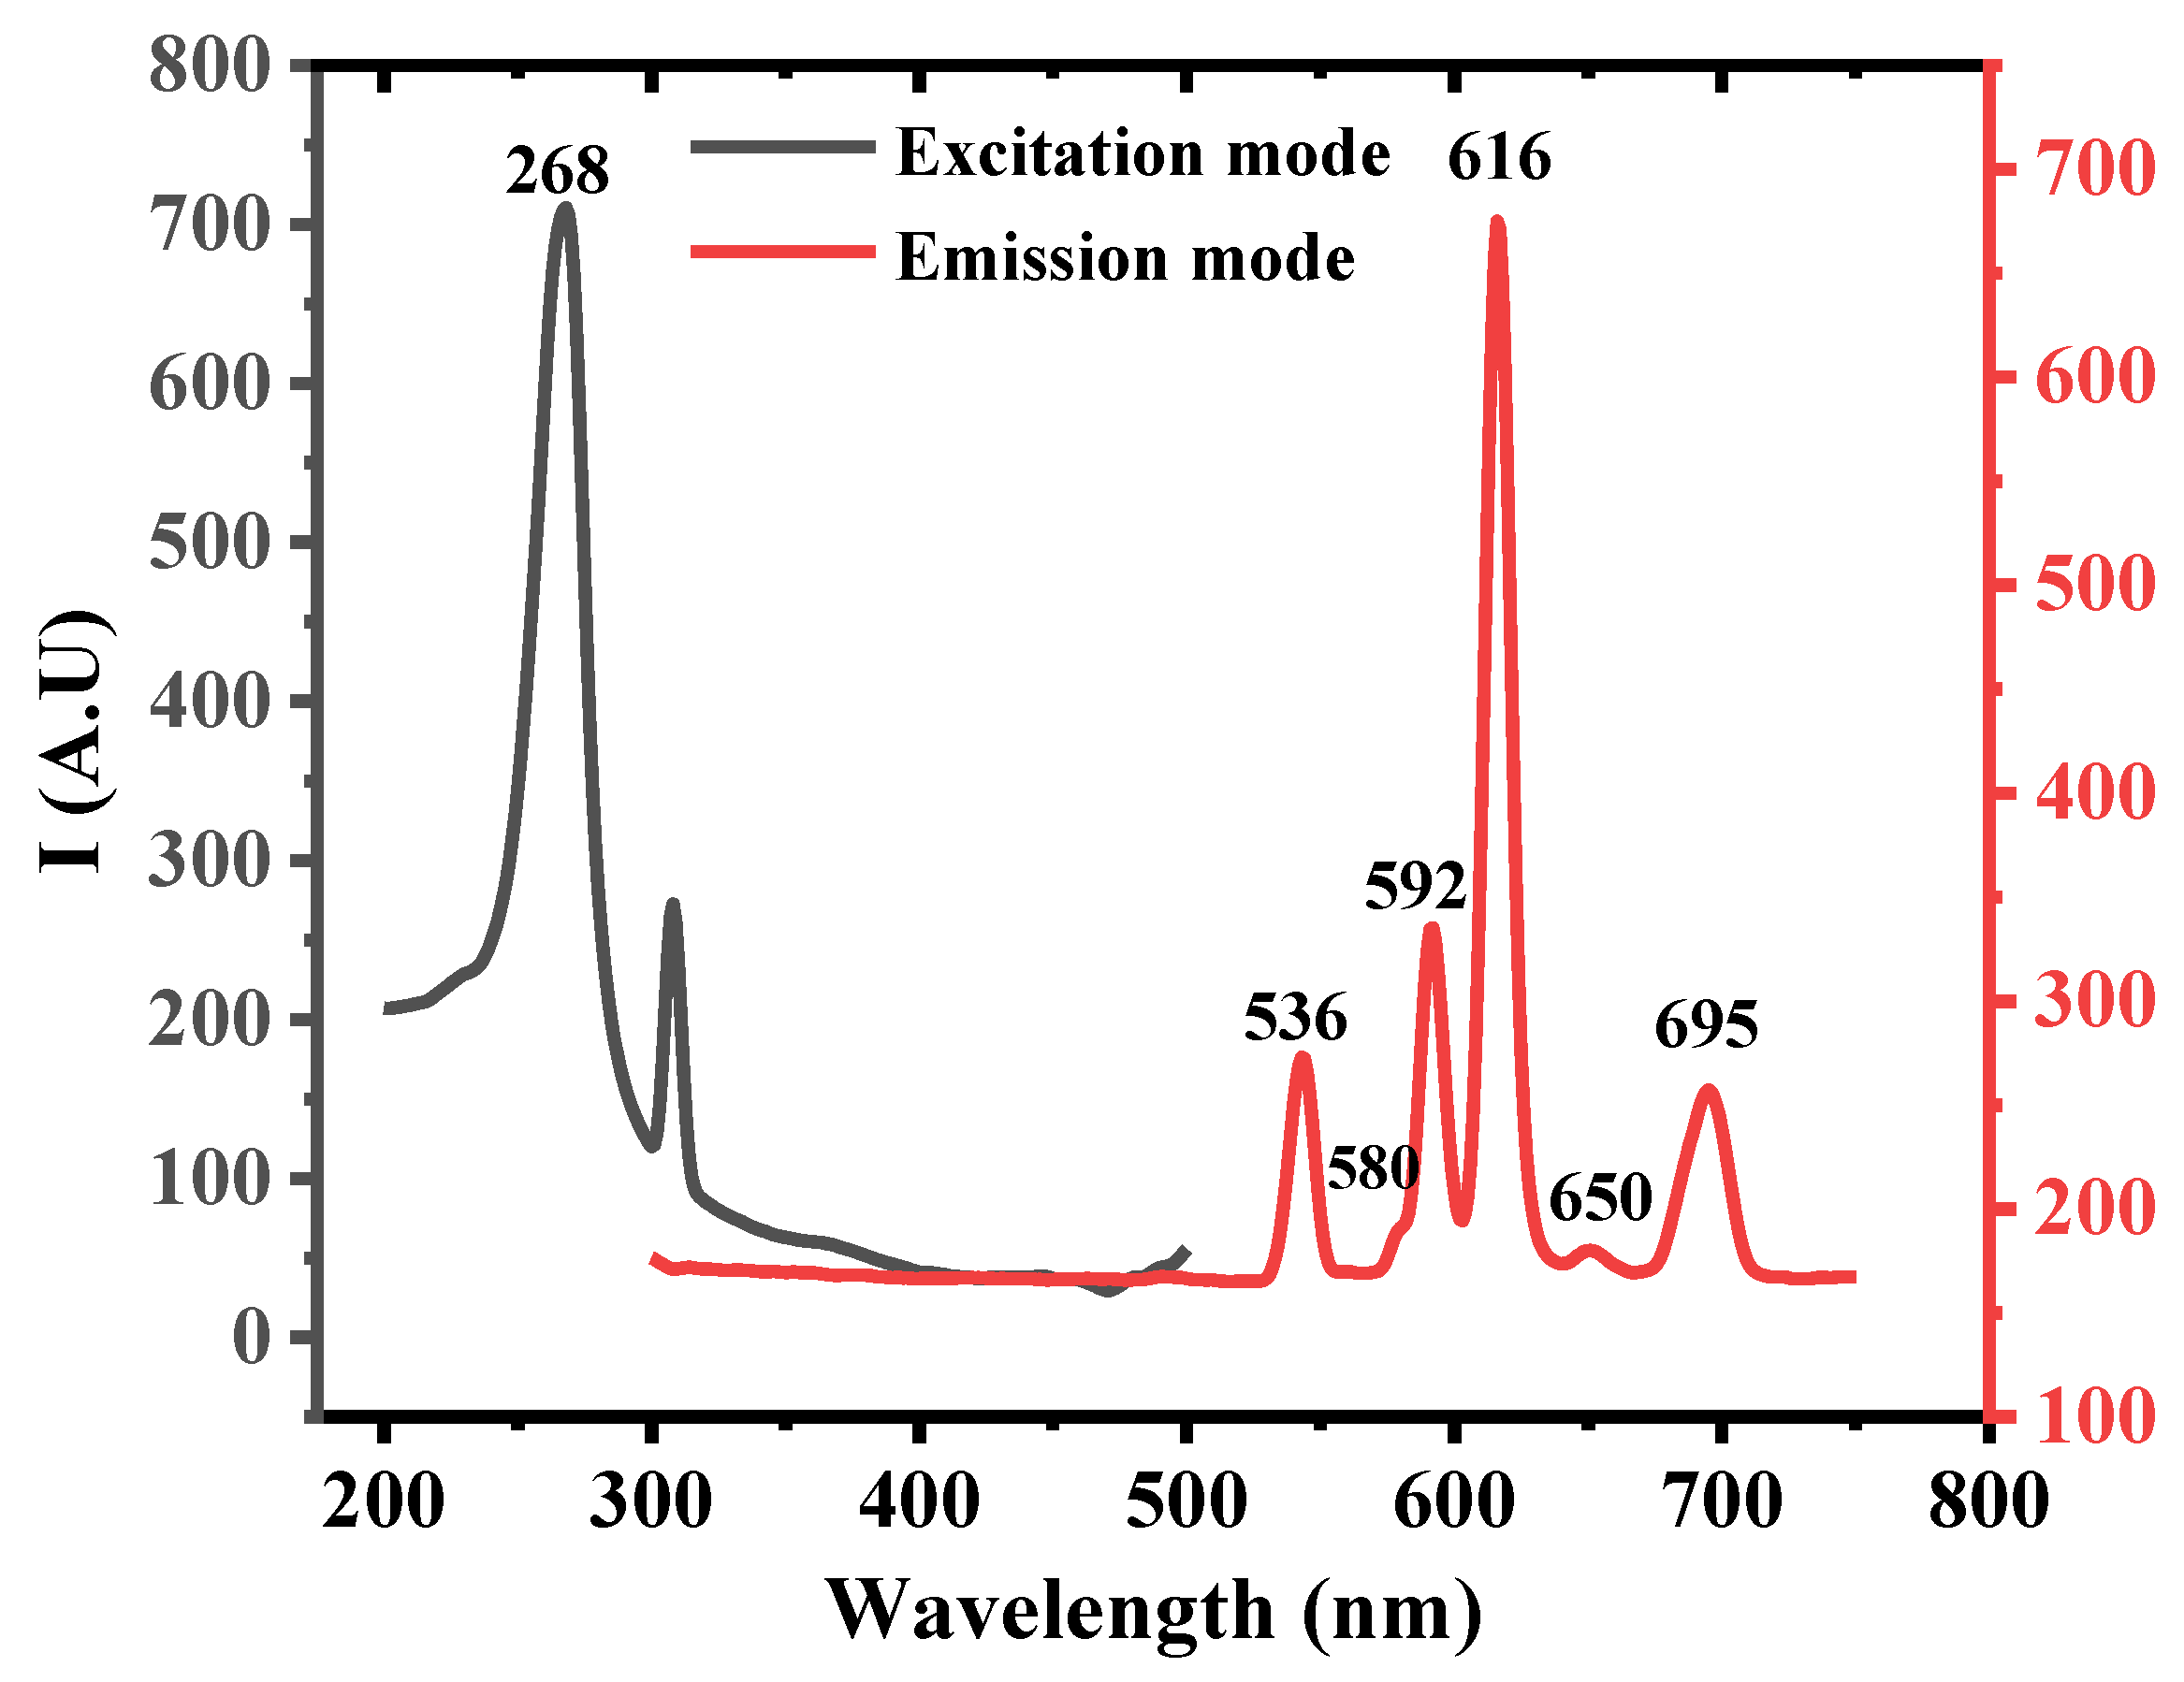
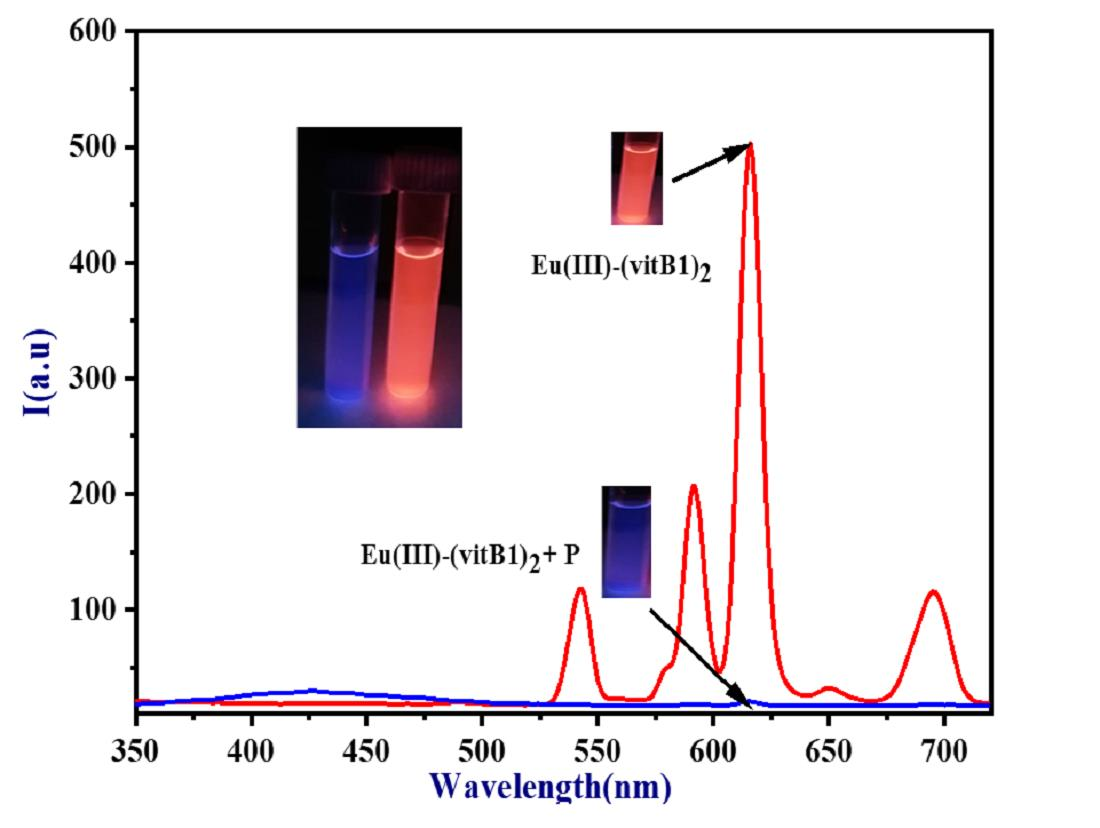
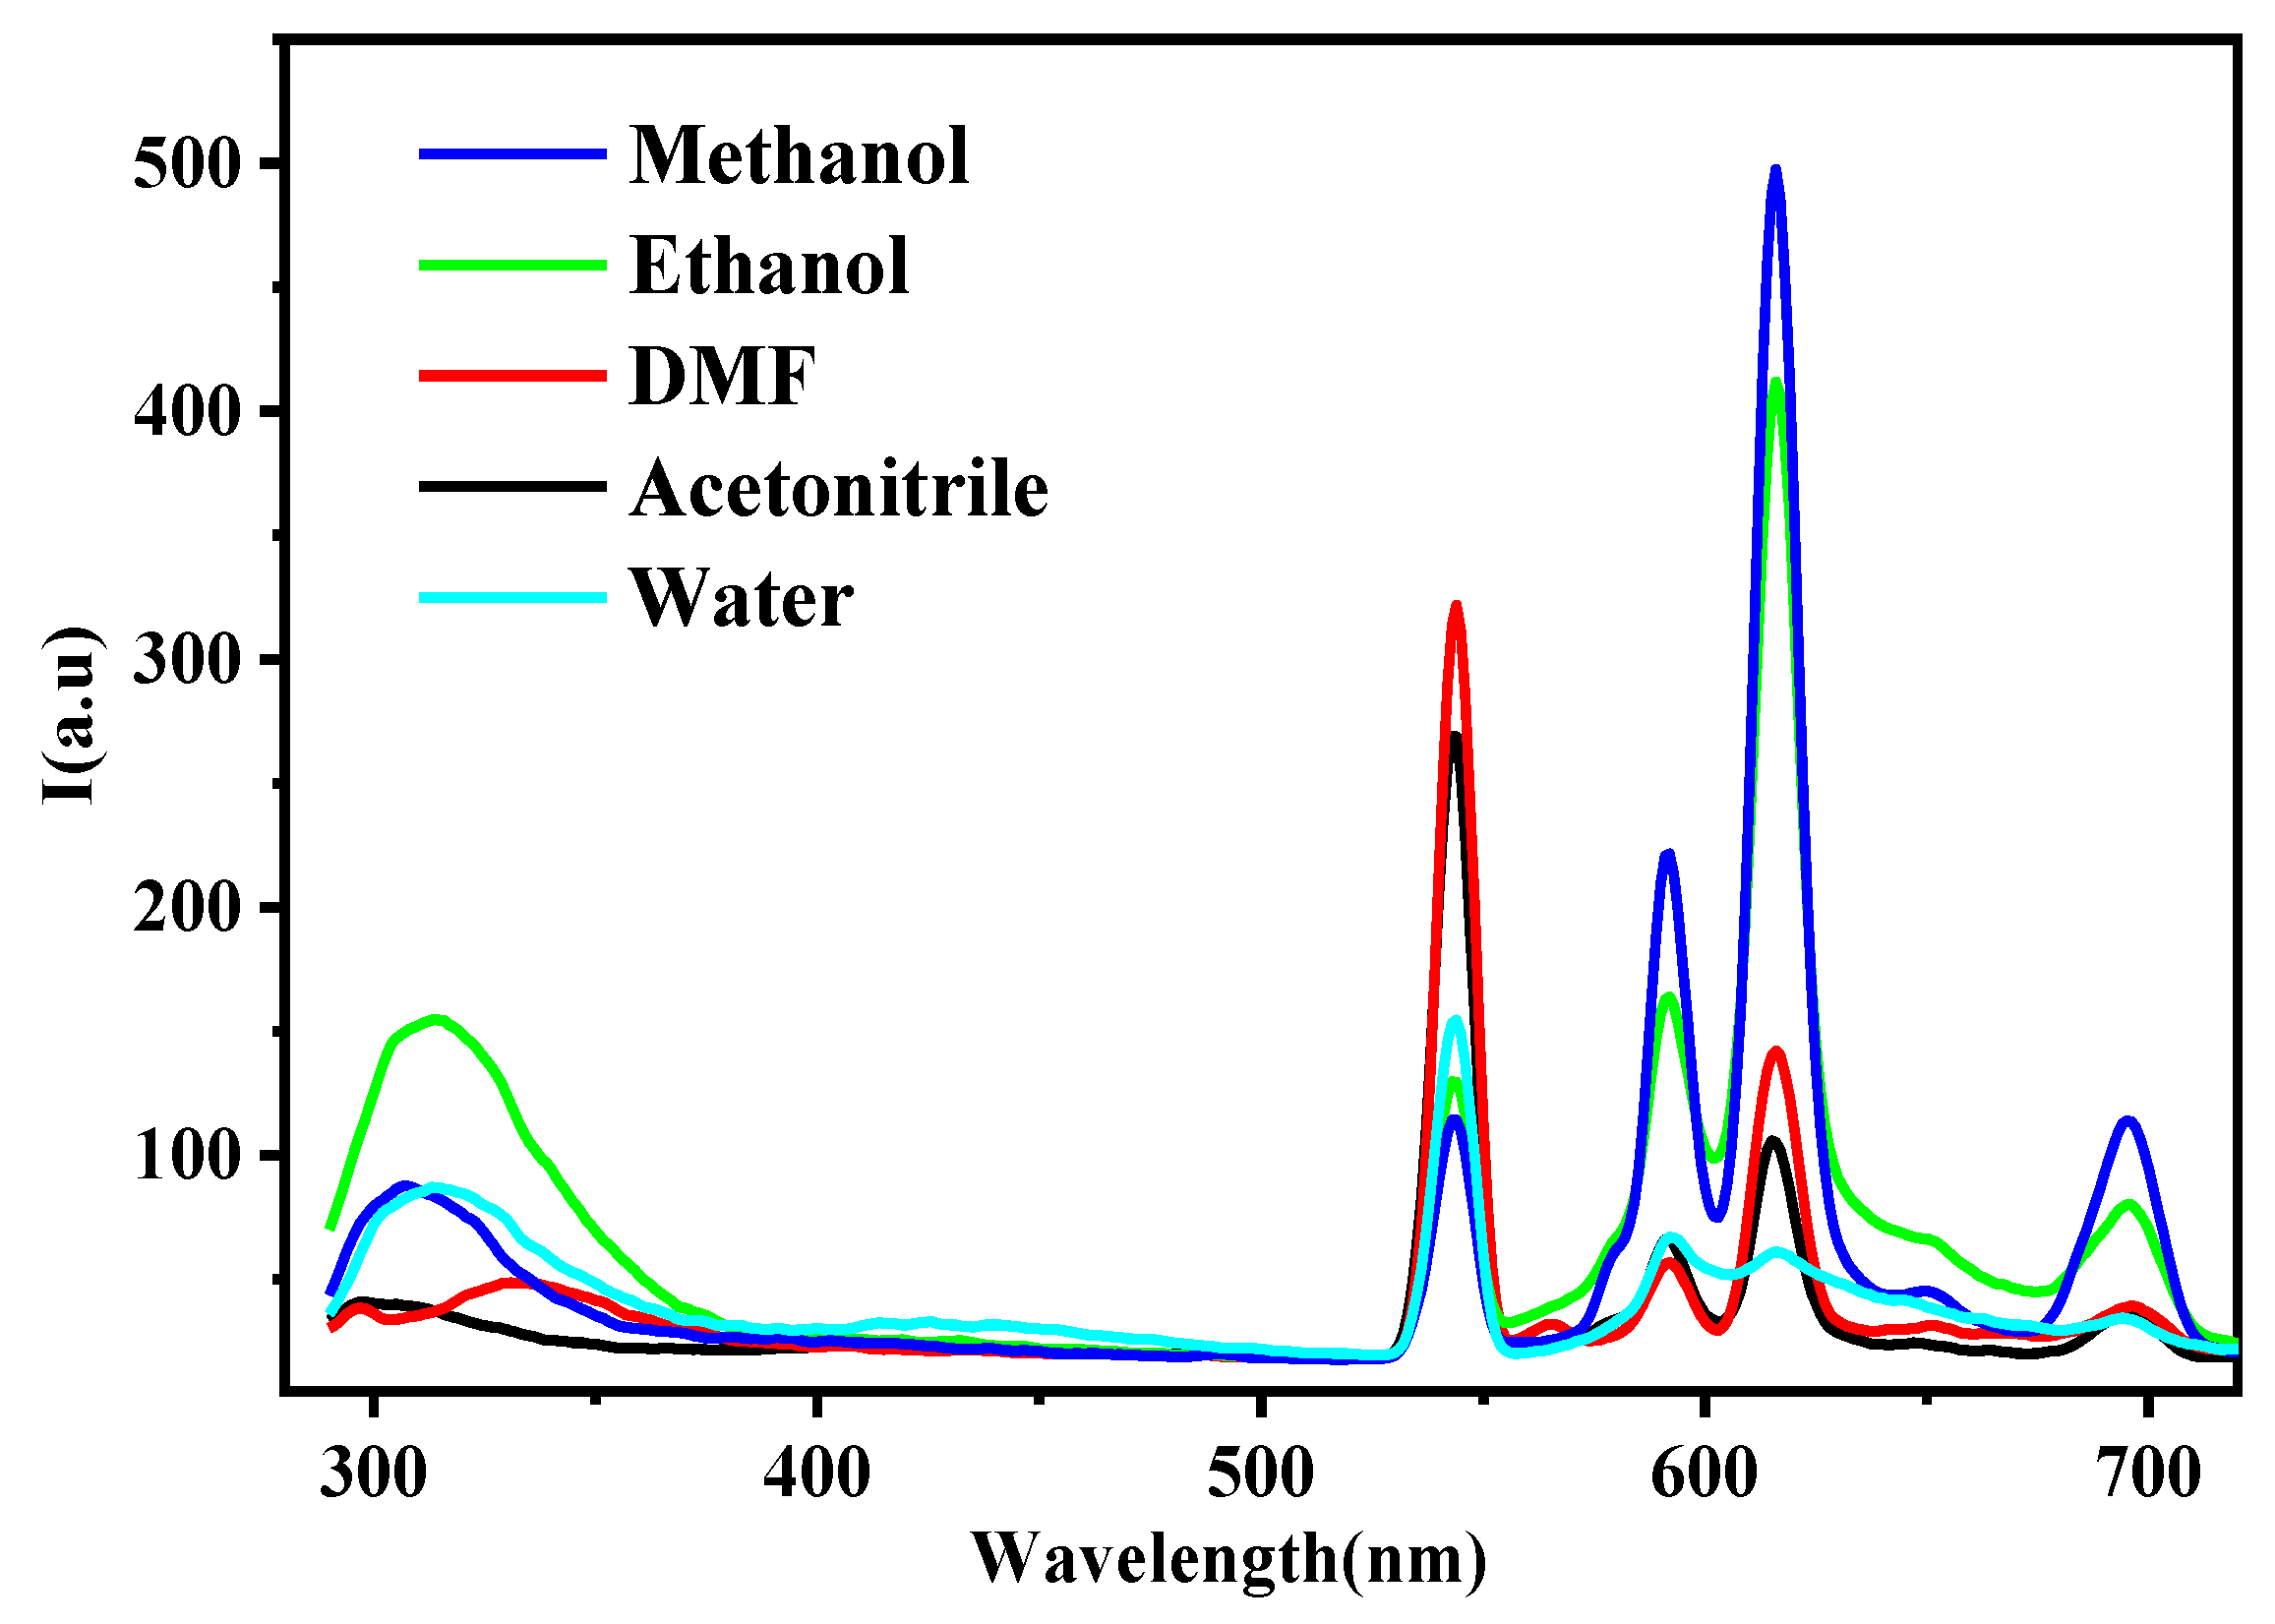
3.1.2. Luminescence Spectroscopy

Figure 2 shows the emission and excitation spectra of the europium (III)–(vitB1)2 complex. The excitation spectra were measured at 200–400-nm wavelengths using λem = 616 nm. The results indicated that the optimum excitation wavelength was λex = 268 nm. The emission spectra were measured at 400–750 nm wavelengths using λex = 268 nm. In the emission spectra, there were distinct luminescence peaks of the europium (III) ion due to f–f transitions at the following wavelengths: 5D07F0 transition (580 nm), 5D07F1 transition (592 nm), 5D07F2 transition (616 nm) with high intensity, 5D07F3 transition (650 nm), and 5D07F4 transition (695 nm). The presence of a band at 536 nm in the emission spectra was attributed to second-order stray light [27]. The sensitized luminescence of the Eu (III)–complex was due to the excitation of the ligand to the singlet excited state (S1), followed by the intersystem crossing transition from the S1 state to the excited triplet state of the ligand (T1). Then, finally, there was an energy transfer from the T1 state of the ligand to the excited state of the Eu (III) ion, followed by its radiative deactivation.
According to Förster’s resonance energy transfer theory, the rate of energy transfer depends upon the extent of overlap of the emission spectra of the donor with the excitation spectra of the acceptor, and the distance between them [28]. So, a coordination complex of Eu (III) ion with vitB1, upon excitation of the vitB1 moiety, would show a sensitized luminescence through Förster’s resonance energy transfer, where vitB1 would act as the energy donor and the Eu (III) ion would act as the energy acceptor.
As shown in Figure 3, the solvent effect on the emission of the europium (III) complex was investigated. The emission band at 616 nm (5D0/7F2) was noticeably higher than the europium (III) ion emission bands. Water quenched the luminescence of the europium (III)–(vitB1)2 complex. Quenching occurred because of the interchange between the electronic excitation energy of europium (III) and the high-frequency vibrational overtones of the O–H bond [29]. The luminescence of lanthanide complexes is mainly affected by organic ligands and their environment. The physical interactions of solvents with ligands may alter the amount of energy absorbed by the ligands, thereby altering the emission intensity of the complex [30]. Therefore, solvents have an effect on the excited state of the ligand, changing the energy gap between T1 and the emissive level in Eu (III), which affects the efficiency of energy transfer. This is considered the reason for the change in the emission of vitB1 around 320 nm upon using different solvents.
The emission intensities of methanol, ethanol, DMF, acetonitrile, and water at λ = 616 nm are 492.20, 414.00, 140.00, 102.70, and 59, respectively. The following is the sequence for the dielectric constants of the solvents studied: water > acetonitrile > DMF > methanol > ethanol. It was observed that solvents with high dielectric constants reduced the luminescence intensity of the complex more than solvents with low dielectric constants did. Due to this, solvents with high dielectric constants restricted the 5D07F2 transition, resulting in reduced luminescence intensities for the complex [23].

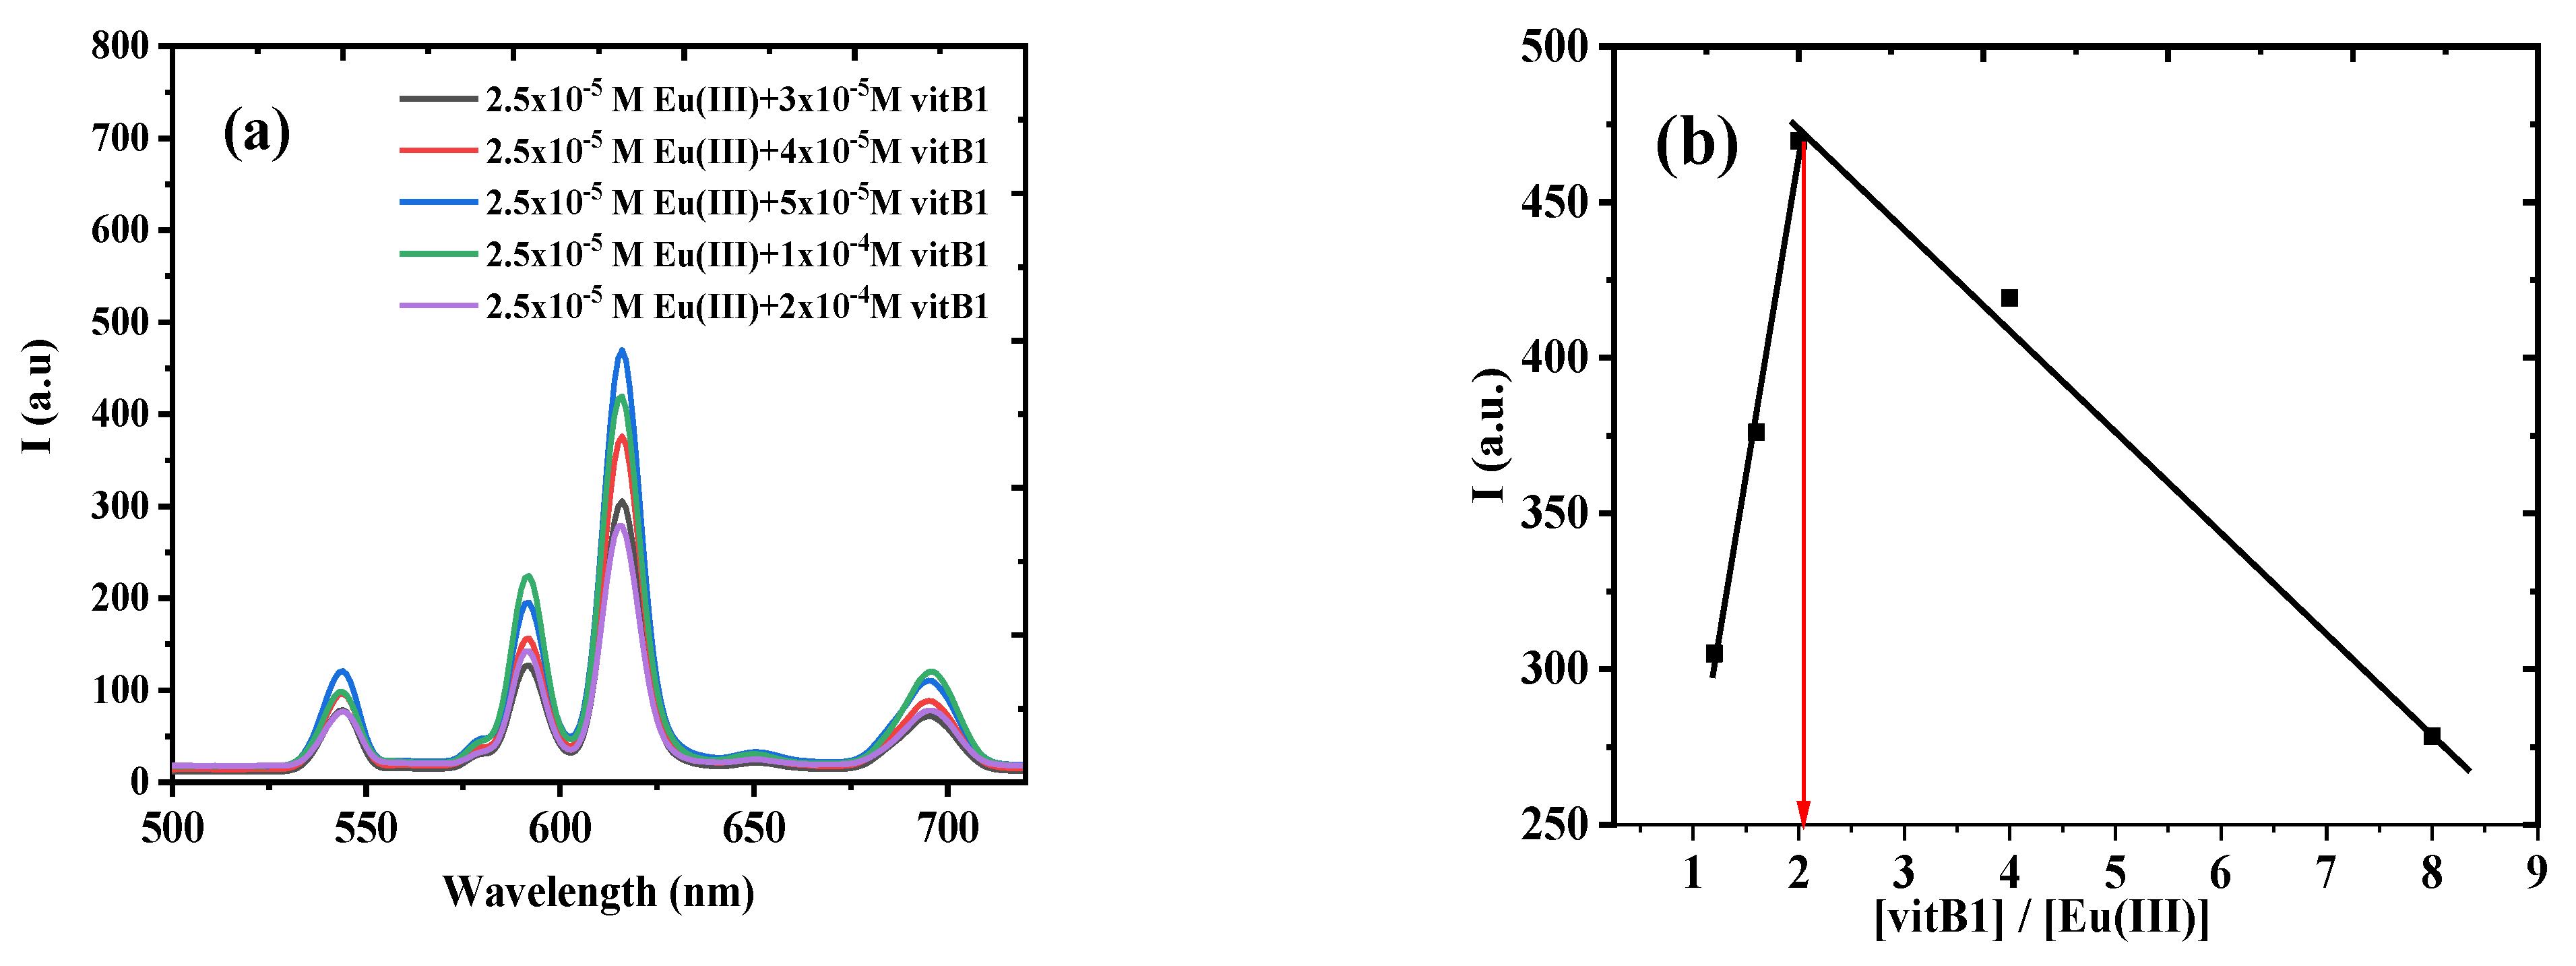
3.1.3. Molar Ratio Method

The molar ratio method was used to determine the probe stoichiometry. It was based on the luminescence intensity of 25 µM europium (III) ions (Fl.) with increasing concentrations of vitB1 in methanol at λex/em = 268/616 nm, as shown in Figure 4a (to obtain different molar ratios between the ligand and europium (III) ion). Then, Fl. (y-axis) vs. [[vitB1]/europium (III)] molar ratio (x-axis) was plotted, as shown in Figure 4b. High-emission intensity was observed for the 2:1 molar ratio, which was selected for our study. The proposed structure of the Eu (III)–(vitB1)2 complex is shown in Figure 4c. Therefore, the reaction is expressed as follows:
Eu (III) + 2 (vitB1) ↔ Eu (III)–(vitB1)2
VitB1 is a tridentate ligand which coordinates with the europium (III) ion through two nitrogen atoms, one from the pyrimidine ring and the second from the amino group attached to the pyrimidine ring. The third atom is located within the OH group. The appearance of the characteristic emission peaks of the europium (III) ion upon ligand binding confirms that the binding between the europium (III) ion and ligand occurs through the two nitrogen atoms attached to the aromatic ring plus the OH group, due to the oxyphilic nature of europium ions [31].
In addition, the formation of the complex with the chemical formula, europium (III)–(vitB1)2, can be explained as follows: the intensity emission of europium (III) ions is weak because the 4f–4f transitions of europium (III) ions are Laporte forbidden. The coordination of europium (III) ions to vitB1, which function as sensitizers and “antennas”, can enhance the population of excited states. The organic ligand (vitB1) effectively absorbed and transferred energy to the europium (III) ion via intramolecular energy transfer (IMET) and subsequently enhanced its emission. The emission intensity of the europium (III) ion enhanced with the increasing concentration of vitB1 until the molar ratio of [vitB1]/[Eu (III)] = 2:1, which led to the formation of the complex with the chemical formula, Eu (III)–(vitB1)2. By increasing the concentrations of vitB1, the luminescence intensity of the complex was reduced, owing to self-quenching from the excess ligand, which absorbed the luminescence of the complex.

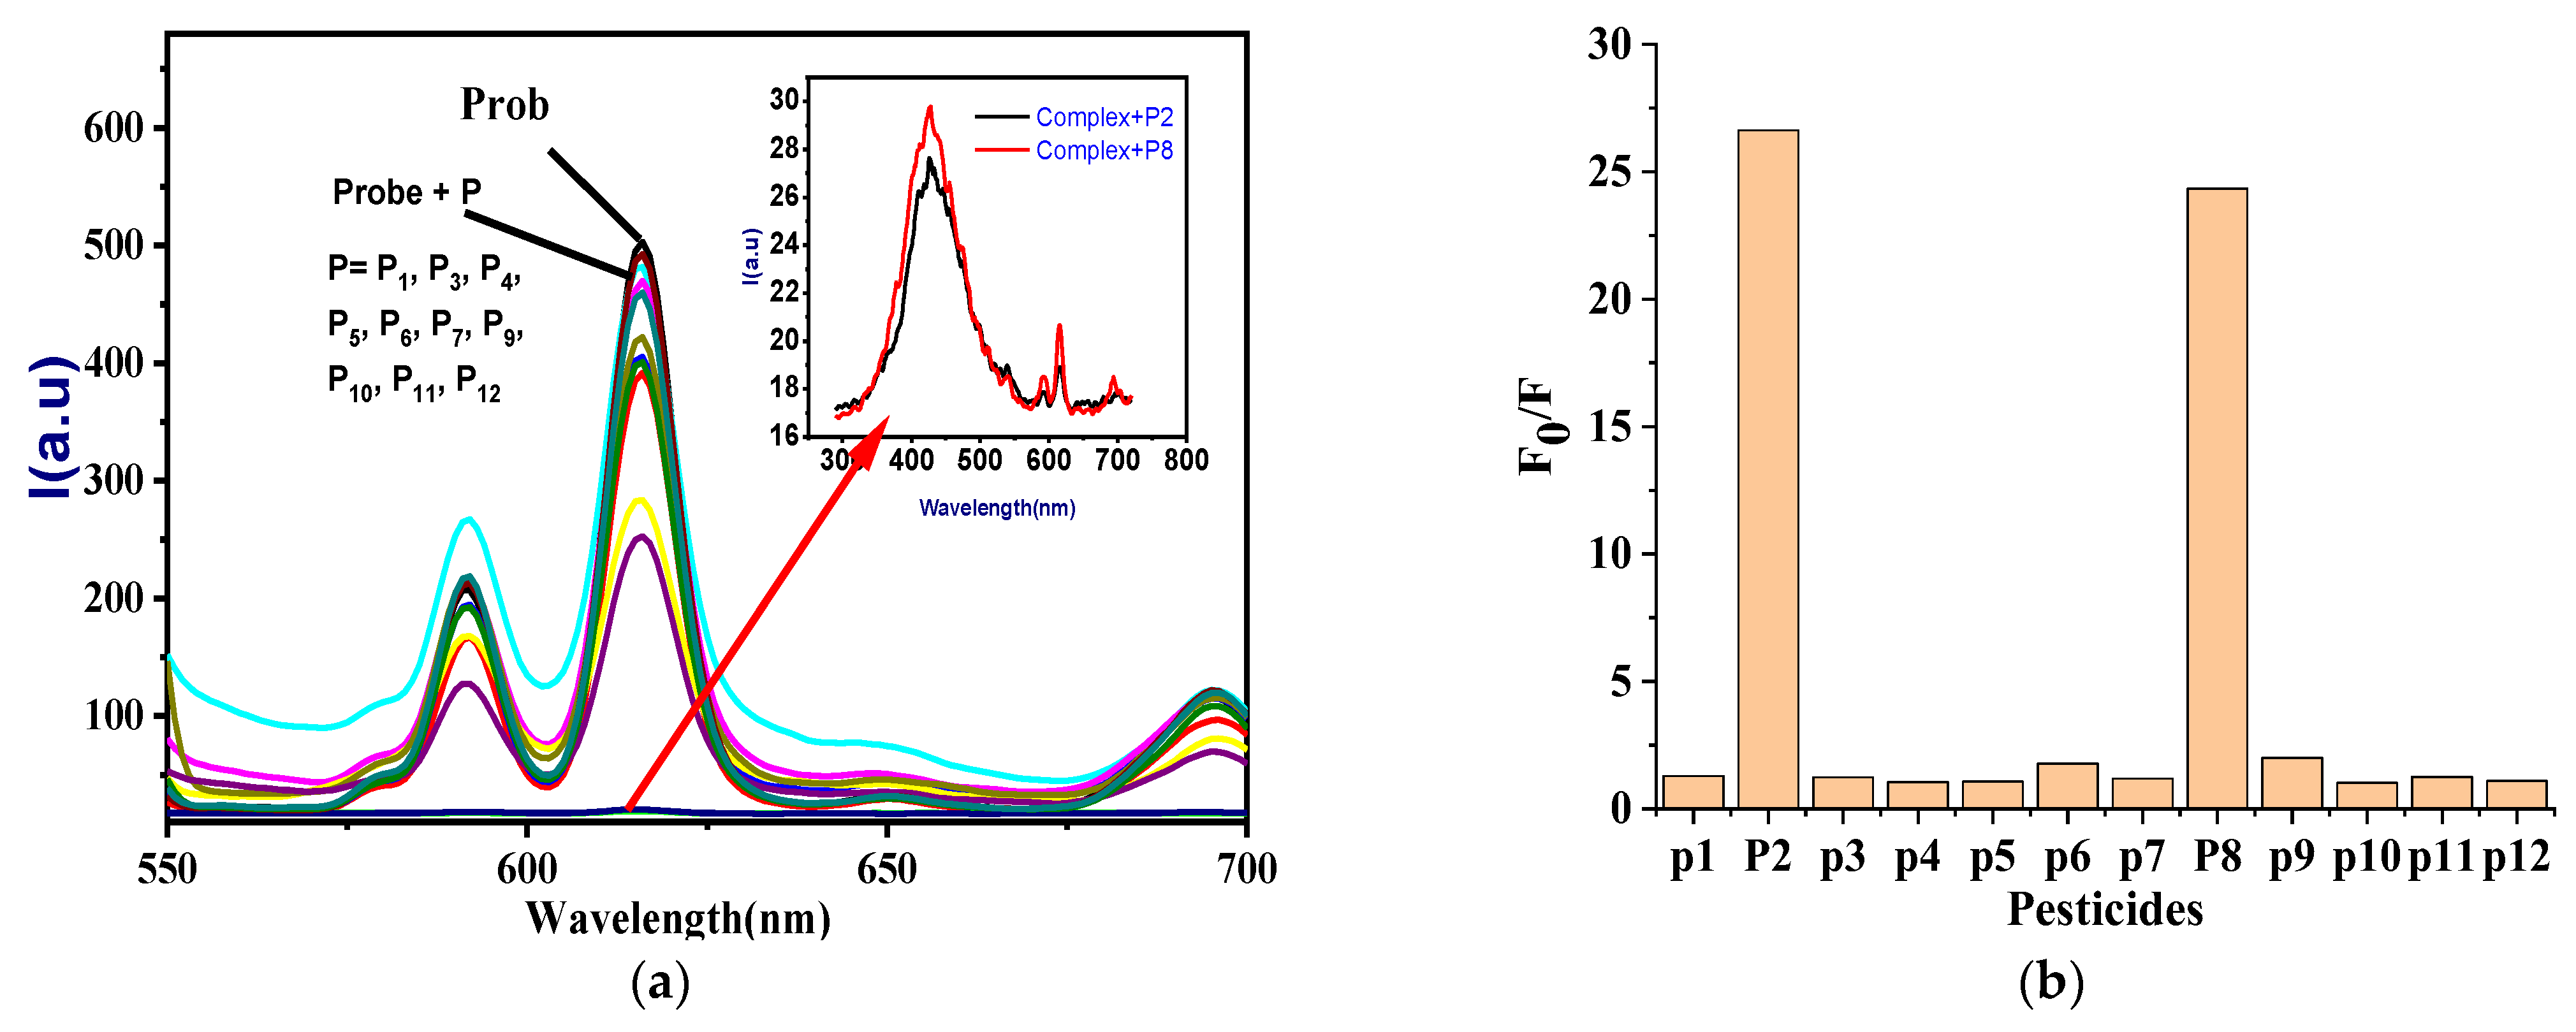
3.2. Emission Spectra of Europiumn(III)–(vitB1)2 Complex with Various OPPs

The response of the europium (III)–(vitB1)2 complex to 25 µM pesticides (azinphos-ethyl, chlorfenvinphos, chlorpyrifos, diazinon, crotoxyphos, dichlorvos, isofenphos, paraoxon-ethyl, malathion, phosdrin, heptachlor, and endosulfan) in methanol is displayed in Figure 5.
It was observed that the probe luminescence intensity was quenched via chlorfenvinphos and malathion by 24- and 26-fold, respectively, at 616 nm. At the same time, no noticeable responses were observed when other OPPs were added to the europium (III)–(vitB1)2 complex. These findings show that the europium (III)–(vitB1)2 probe is more sensitive and selective for malathion and chlorfenvinphos in methanol.

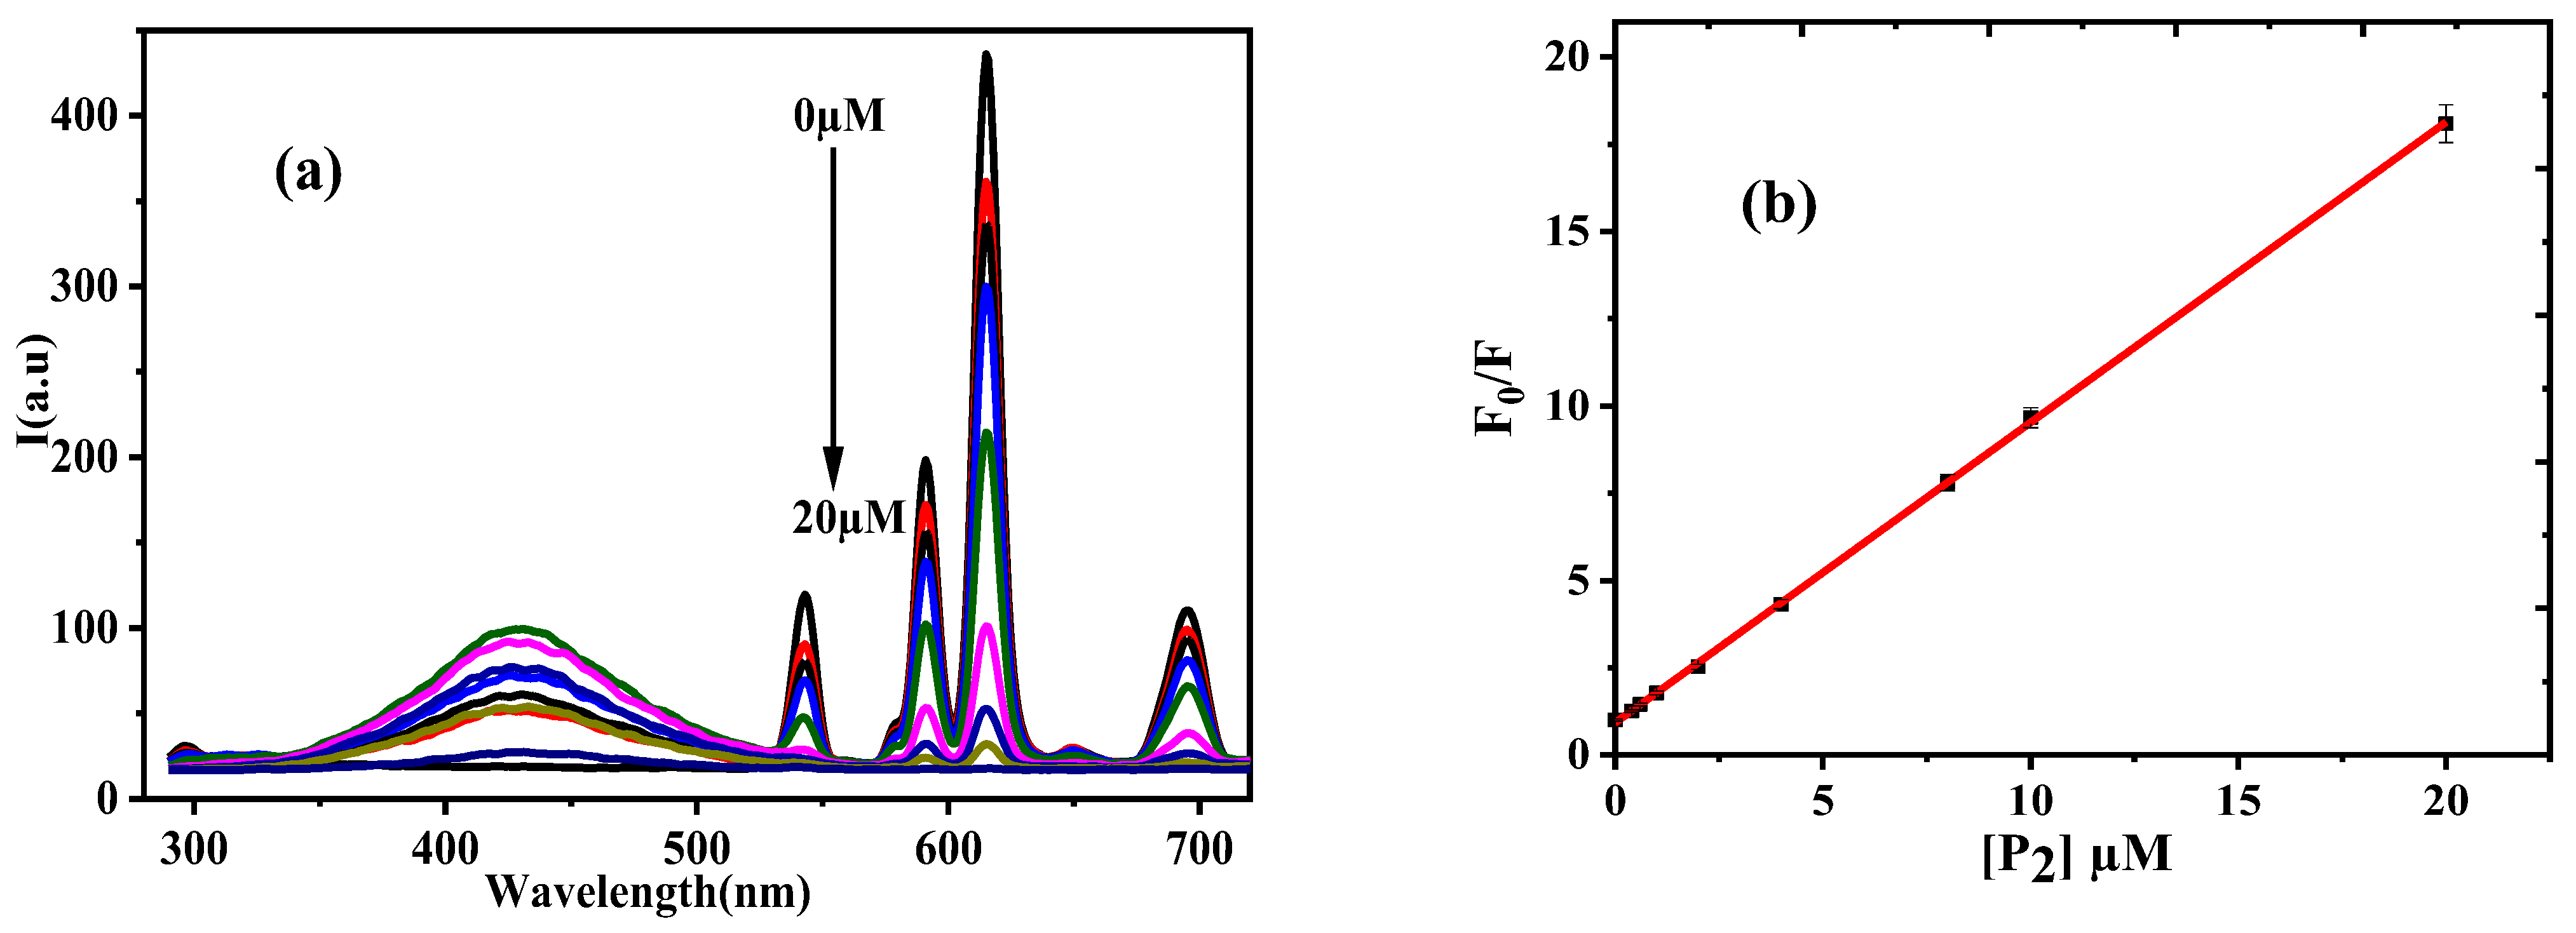
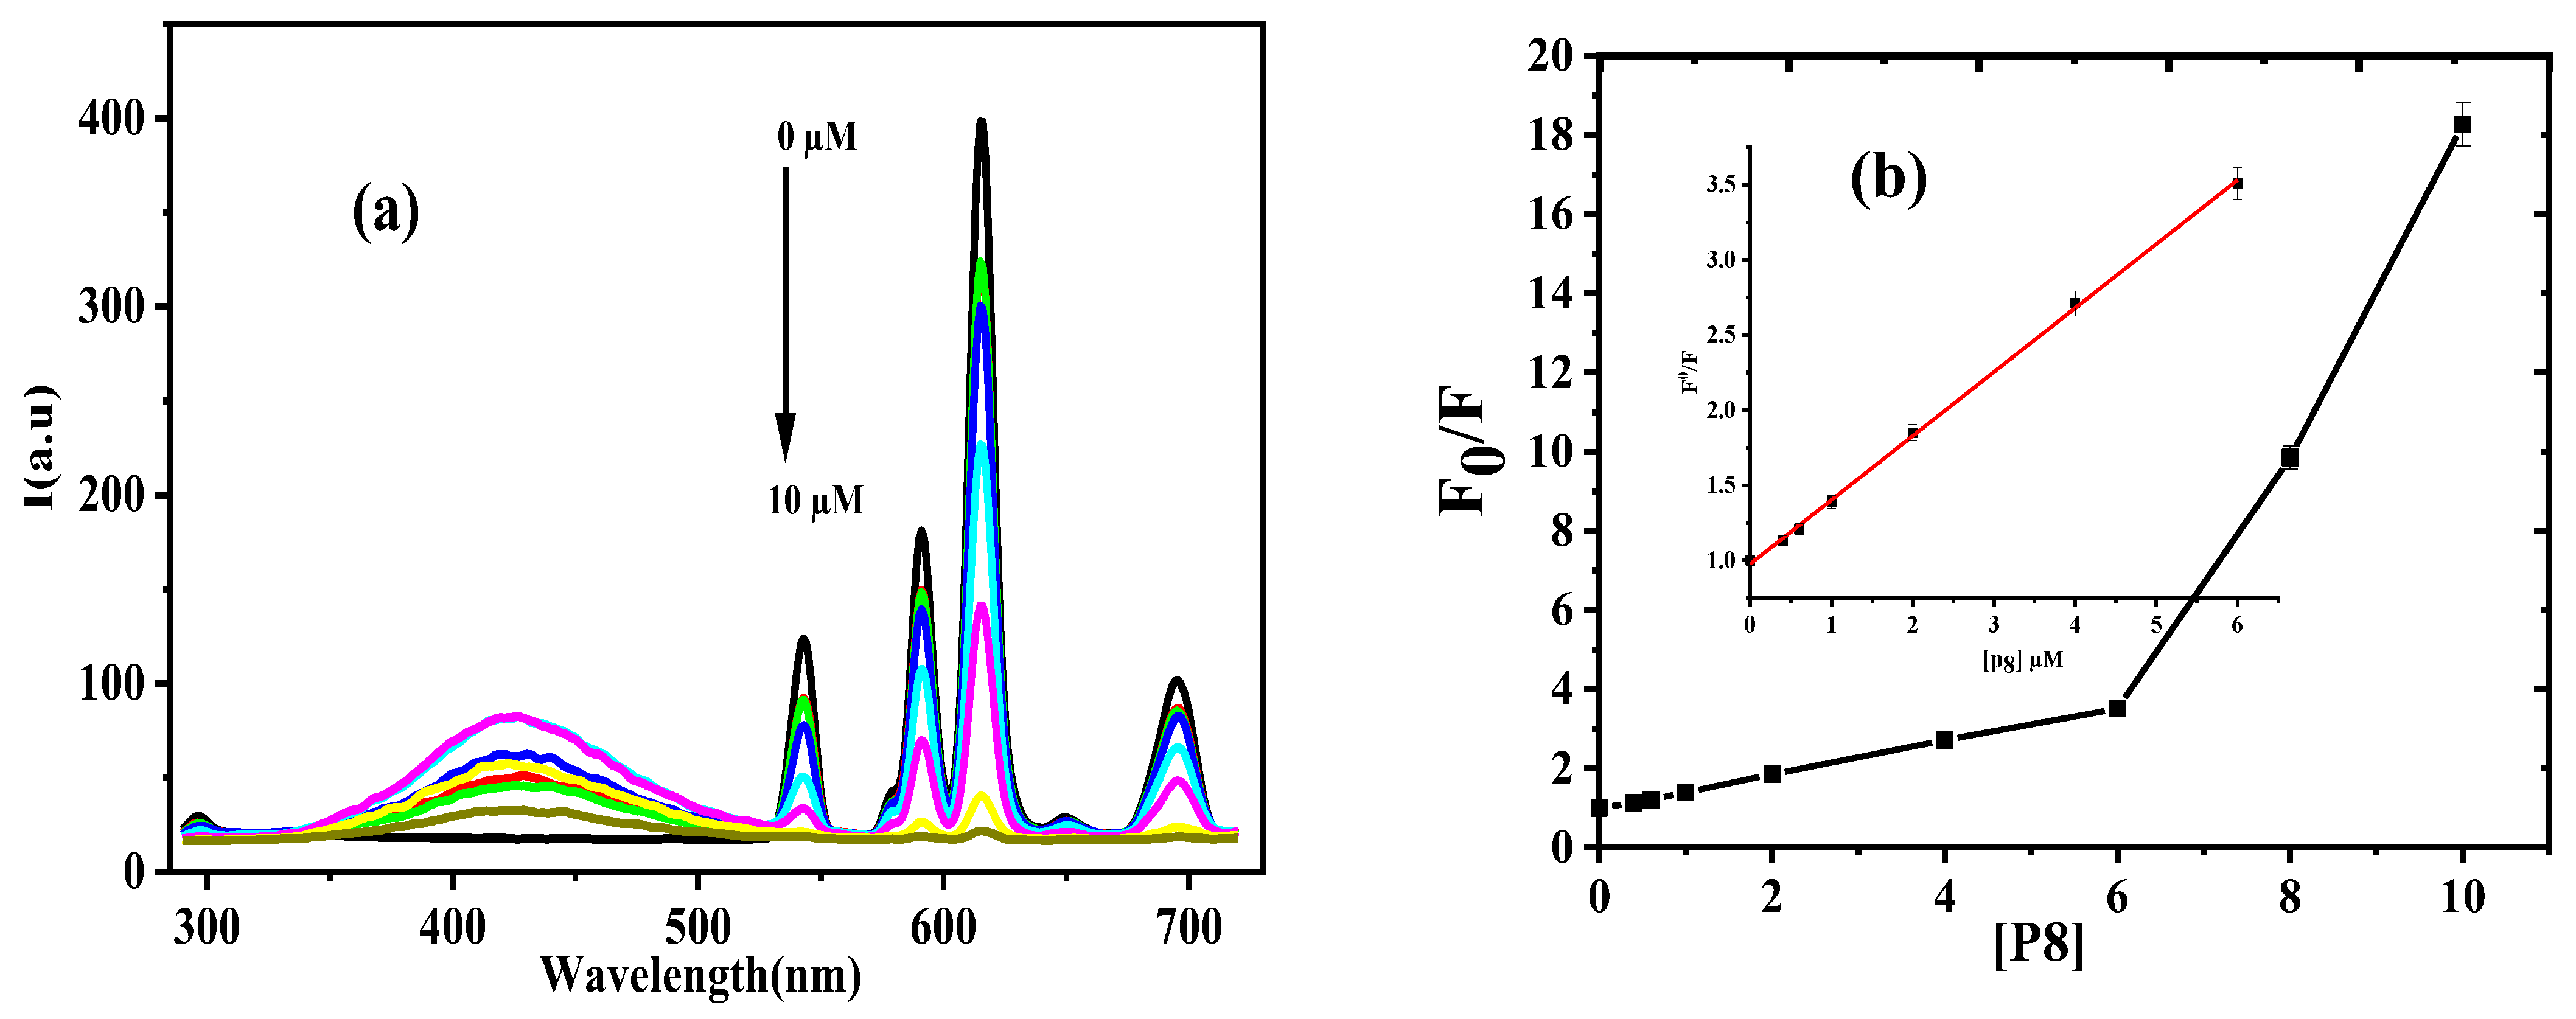
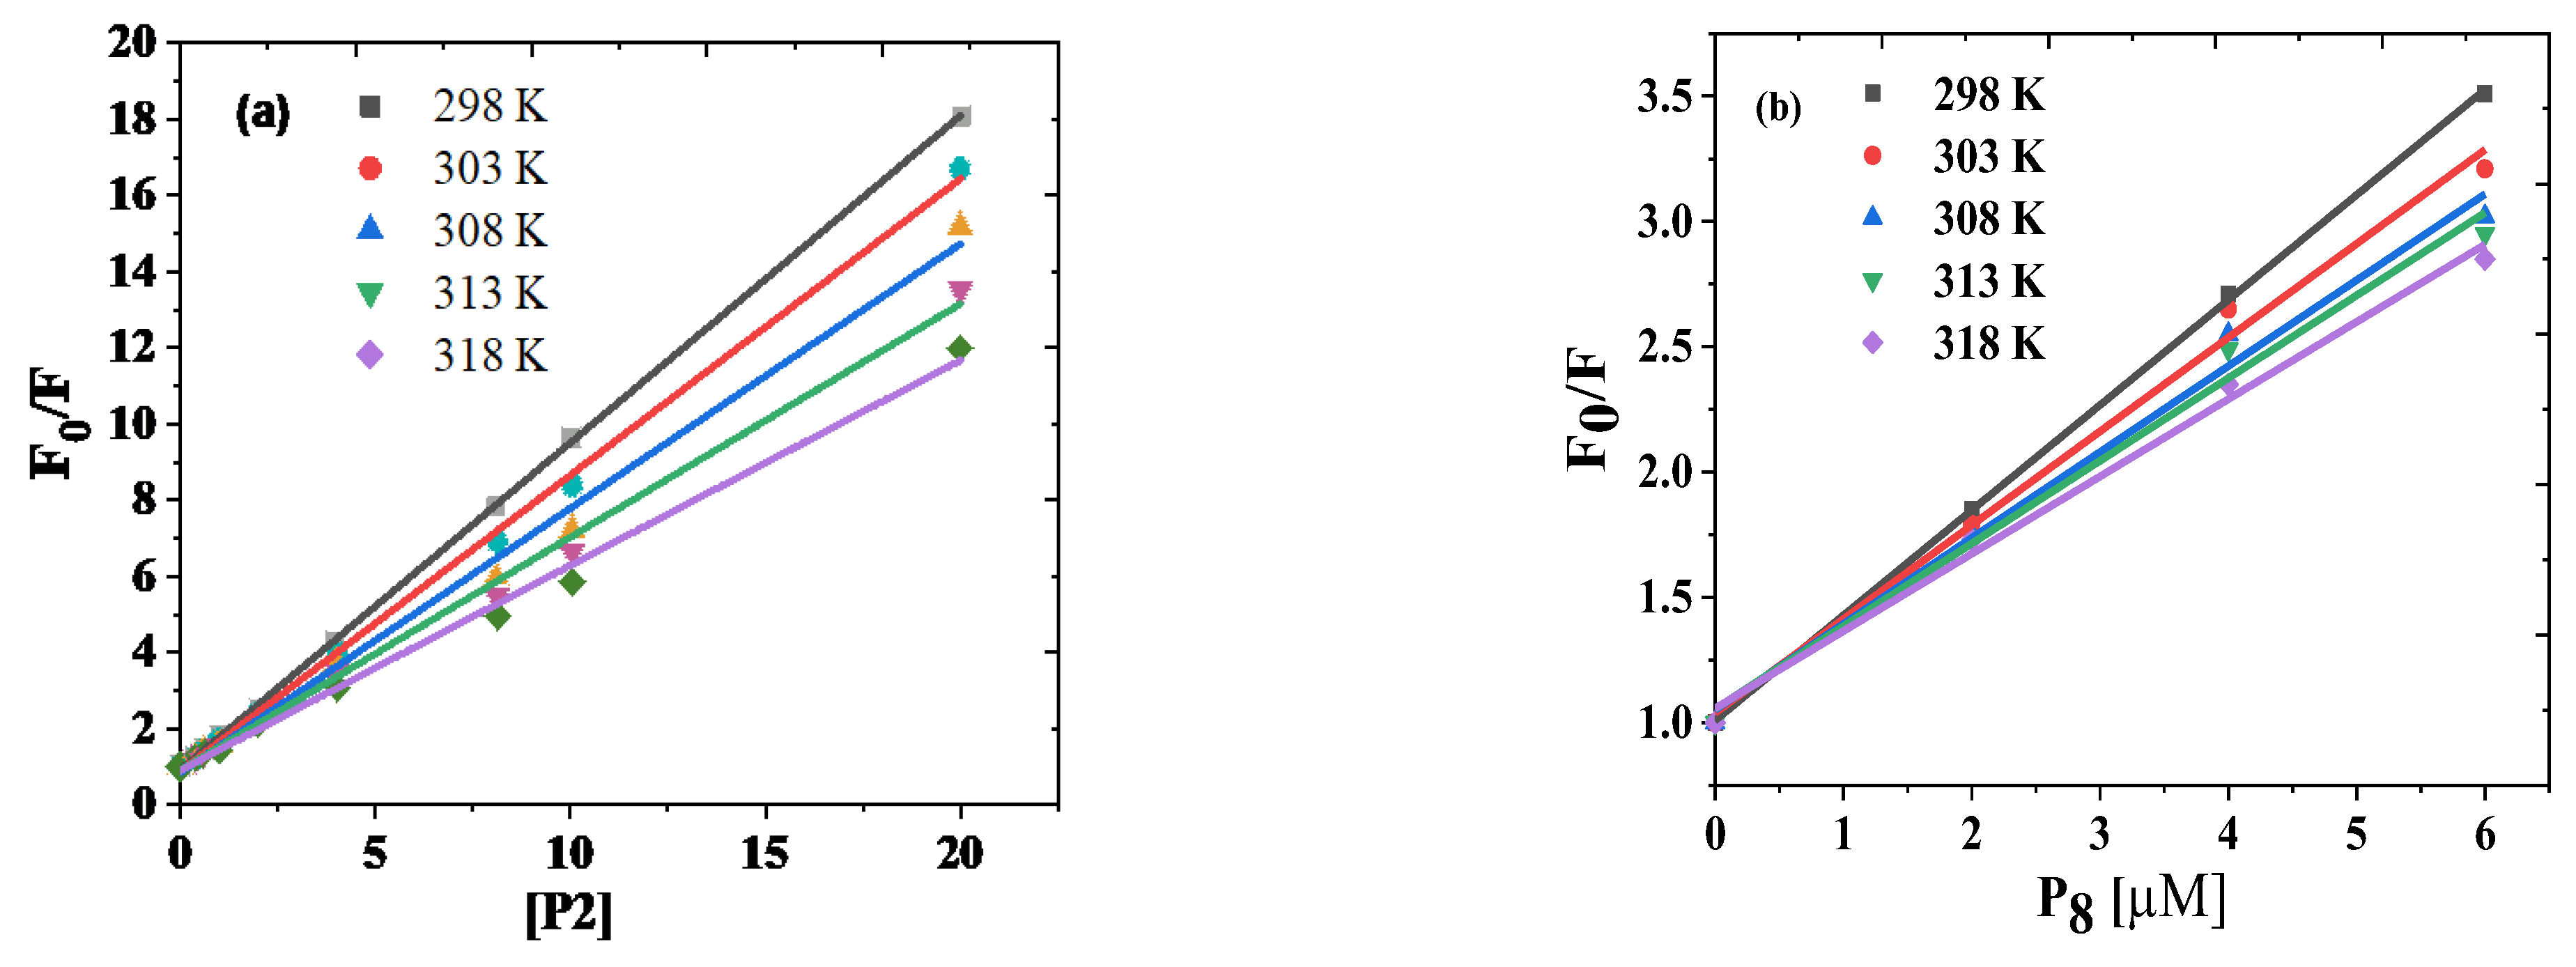
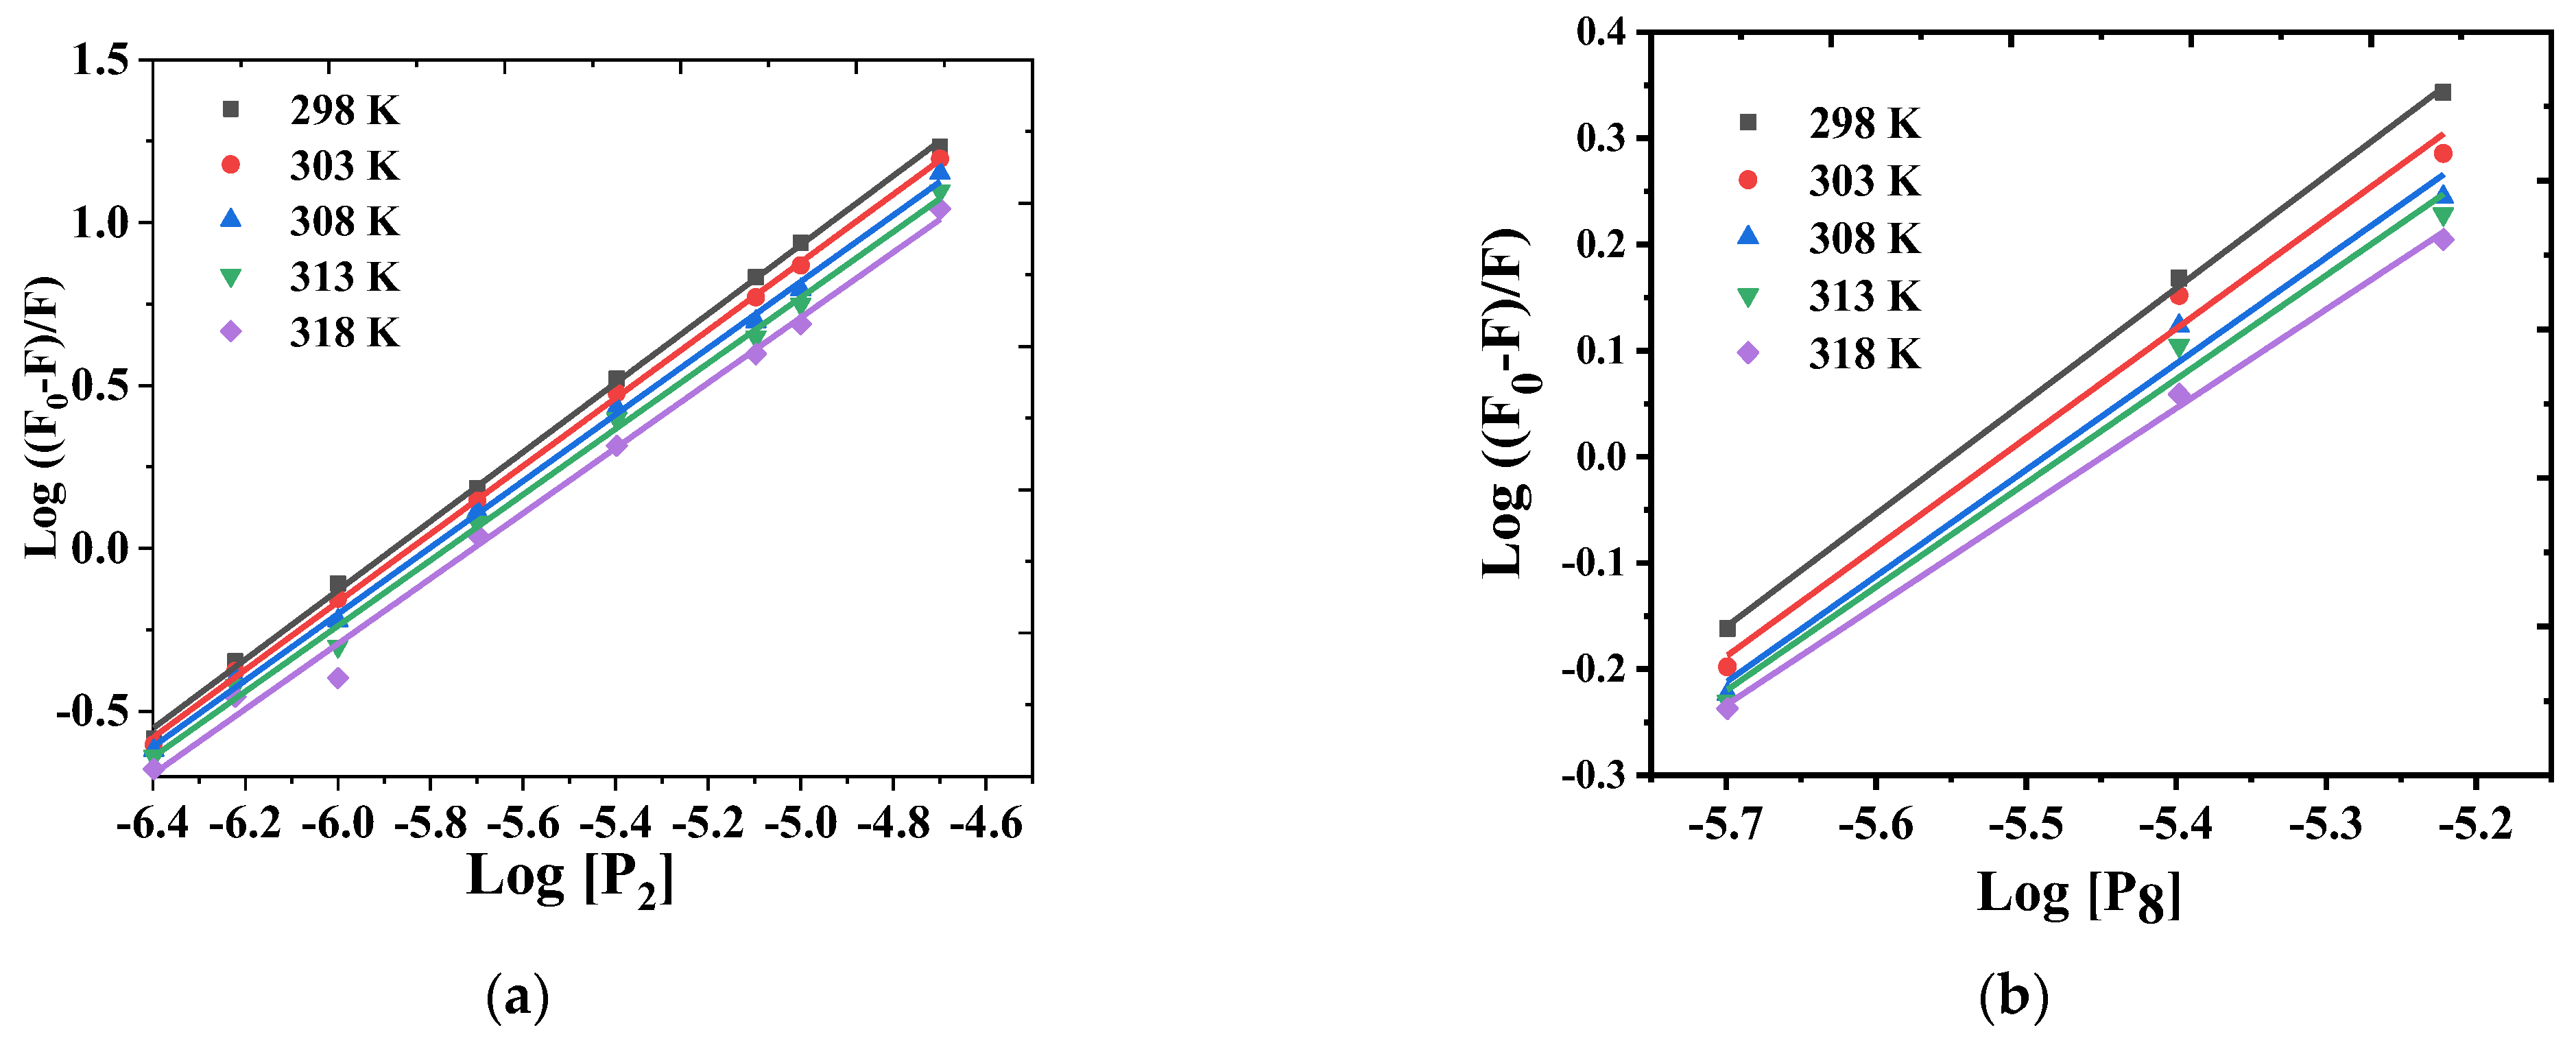
3.2.1. Calibration Data and Investigation of Quenching Mechanism

The luminescence spectra and calibration plot of 25 µM of the europium (III)–(vitB1)2 probe with various concentrations of chlorfenvinphos or malathion (0, 0.4, 0.6, 1, 2, 4, 8, 10, and 20 µM) in methanol, λex = 268 nm, at room temperature are shown in Figure 6a and Figure 7a. The emission intensity measurements of the europium (III)–(vitB1)2 complex with pesticides (chlorfenvinphos or malathion) displayed a quenching emission peak of the europium (III) ion (λem = 616 nm) with the increasing concentration of pesticides under our investigation. Examination of the F0/F against [P] plots revealed a straight line for chlorfenvinphos until a concentration 20 µM (Figure 6b). This suggests that the quenching is static until a concentration of the chlorfenvinphos of 20 µM. For malathion, the graph gives a straight line until a concentration of malathion of 6 µg mL−1. At higher concentrations, the data indicate an upward curvature (Figure 7b). This suggests that the quenching is static until a concentration of the malathion of 6 µM, and then collisional quenching contributes [32].
To further investigate the quenching mechanism, we studied the effects of temperatures on the KSV of the europium(III)–complex with malathion and chlorfenvinphos in methanol. Figure 8 shows the Stern–Volmer plots of the europium(III)–(vitB1)2-P system at five different temperatures. The Ksv values determined were inversely proportional to the temperature (Table 1). These data suggest that static quenching is the most likely mechanism. Therefore, staFtic and dynamic quenching can be distinguished by their differing dependence on temperature. If Ksv decreases with increasing temperature, it may be concluded that the quenching process is static rather than dynamic. A higher temperature will typically result in the dissociation of weakly bound complexes, and hence smaller amounts of static quenching. Therefore, luminescence quenching of the Eu(III)–(vitB1)2 complex can be explained in terms of chelation-enhanced luminescence quenching (CHEQ) [23]. Therefore, the coordination of the probe with organophosphorus pesticides may have taken place through a thiophosphoryl (P = S) functional group (malathion) or phosphoryl group (P = O) in chlorfenvinphos, forming a non-luminescent complex, where the emission of the probe at 616 nm was reduced due to this chelation with the pesticides and therefore, the net luminescence was quenched (Figure 6 and Figure 7).
Linear Stern–Volmer plots were created by graphing the F0/F values vs. [P], as seen in Figure 6b and Figure 7b. Under optimum conditions, using the first eight data points, the linear range of the plot is described by the Stern–Volmer relation: F0/F = 1+Ksv [P]. Ksv is the Stern–Volmer quenching constant calculated from the slope of the graph to be 8600 M−1 for chlorfenvinphos and 4300 M−1 for malathion. The linear ranges for chlorfenvinphos and malathion were between 0.95–20 and 0.36–6 µM, respectively. The LODs were 0.31 and 0.12 µM for chlorfenvinphos and malathion, respectively.
Table 2 summarizes the calibration data for all pesticides. The slopes implied that these pesticides have two differences in their sensitivities. The accuracy was 100.61% and 101.88% for chlorfenvinphos and malathion, respectively. The calibration curves for the pesticides under investigation had concentrations measured with near-recovery percentages, supporting the precision of the analytical process. The detection limits of malathion and chlorfenvinphos using the Eu (III)–(vitB1)2 complex are comparable to those of other luminescent lanthanide complexes as chemosensors (Table 3). Our chemosensor reported here showed a detection of 2- to 16-fold lower LODs for chlorfenvinphos, while for malathion, it detected 2- to 46-fold lower LODs. This is advantageous for sensing trace amounts of analytes.

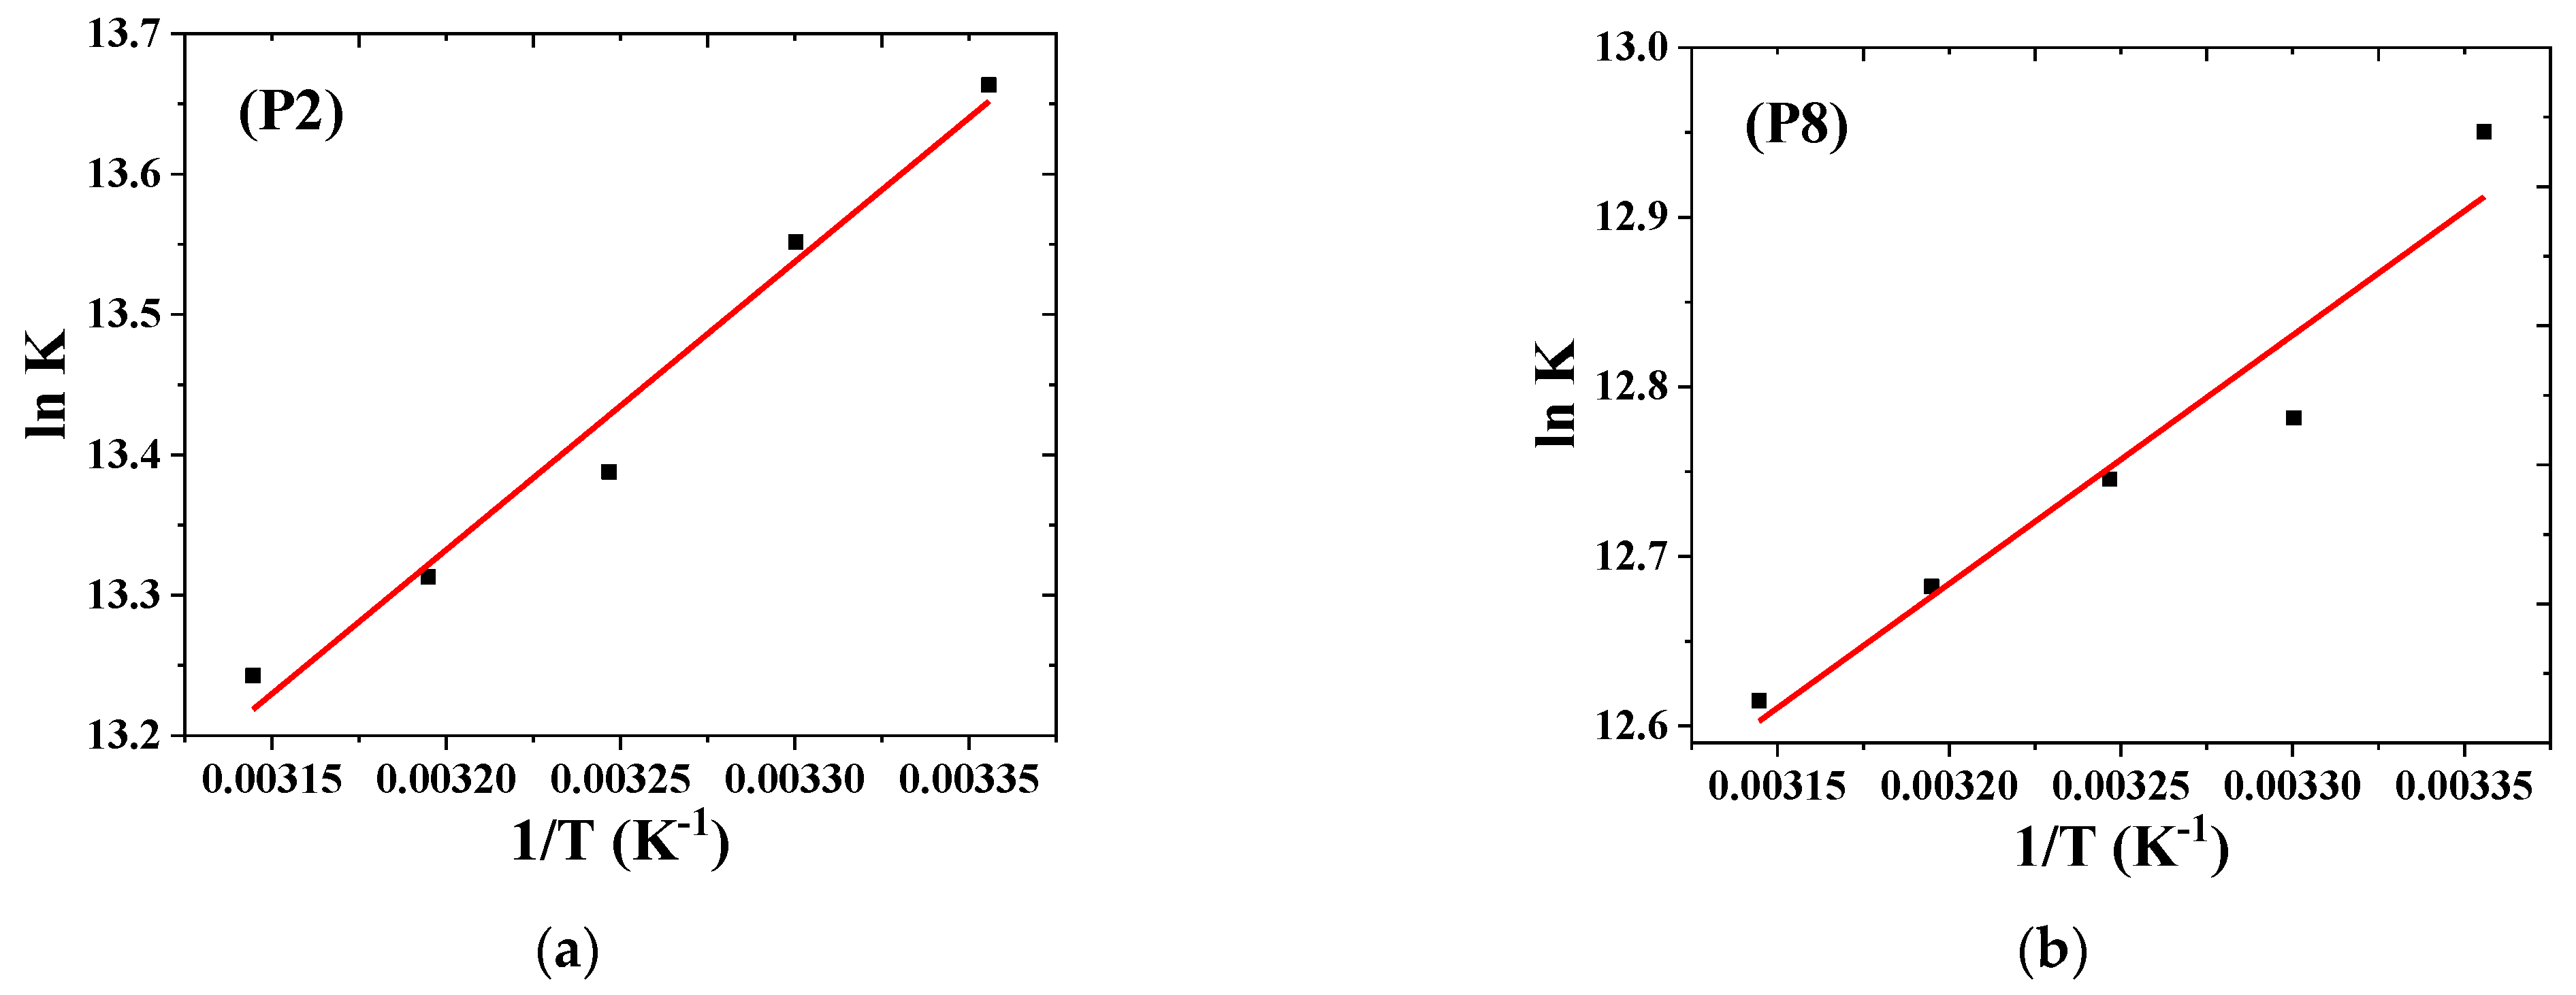
3.2.2. Stoichiometry and Binding Constant

The modified Stern–Volmer equation was used to investigate the stoichiometry and binding constant between the probe and the pesticides under study. These values were obtained by graphing log [(F0/F)/F] vs. log P [M]. The intercepts of the resulting graphs were used to investigate the apparent binding constants (Ka) for the europium (III)–(vitB1)2-P system at five various temperatures. As shown in Figure 9 and Table 4, the values of Ka decreased as the temperature increased, demonstrating that when the temperature rose, the complex formed between the probe and the pesticides was disturbed. Moreover, the number of (n) binding values determined at five different temperatures was close to one, confirming the existence of one binding site of malathion or chlorfenvinphos with europium (III)–complex. Thermodynamic parameters such as the entropy change (ΔS0), enthalpy change (ΔH0), and Gibbs’ free energy (ΔG0) for the europium (III)–(vitB1)2-P system at five various temperatures were determined using the plot of ln Ka vs. 1/T (Figure 10). It was shown that the ΔG0 measured for the europium (III)–(vitB1)2-P system at all temperatures was negative, revealing the spontaneous interaction between the probe and pesticide (Table 4). Similarly, the values of ΔS and ΔH were calculated using Van ’t Hoff plots (Figure 10). The negative sign of the enthalpy change and the positive value of the entropy change refer to the reaction between the probe and chlorfenvinphos (P2) or malathion (P8) being exothermic, and the binding between them mostly being carried out by electrostatic interactions [23].

3.2.3. Selectivity

Ratiometric analysis was performed to determine the binding affinities of the Eu–(vitB1)2 complex with malathion or chlorfenvinphos. First, a series of spectral titrations was performed by adding progressive quantities of pesticides to 25 µM of europium (III)–(vitB1)2. Second, graphs of the europium (III)–(vitB1)2 complex intensity ratio (616/592 nm) vs. pesticide concentration were produced, as shown in Figure S3. Finally, the binding constant affinity (k) was estimated by fitting the data (Table S1). The logarithmic values for the binding affinities (log K) were 5.50 and 6.62 for chlorfenvinphos and malathion, respectively. The probe had a 13-fold higher affinity for malathion than chlorfenvinphos. This is because malathion has more active groups carrying oxygen atoms than for chlorfenvinphos, confirming the oxyphilic nature of europium (III) [23]. In addition, such notable selectivity for malathion may be due to the steric hindrance of chlorfenvinphos in binding to the probe. Additionally, coordination may occur with the Eu (III)–(vitB1)2 complex through the thiophosphoryl group (P = S) of the malathion pesticide.

3.2.4. Effect of Interference

The luminescent europium(III)–(vitB1)2 complex was tested with various anions and cations, found in irrigation water and soil, in the presence of 5 mM of the pesticide under investigation in methanol. The interference criterion was applied with a 10% fluctuation in the average luminescence intensity at the corresponding pesticide concentration. Additionally, the effects of other widely utilized pesticides were compared to the detecting pesticides under investigation (i.e., azinphos-ethyl, crotoxyphos, chlorpyrifos, diazinon, isofenphos, dichlorvos, paraoxon-ethyl, phosdrin, heptachlor, and endosulfan). Table 5 presents the findings in detail.

4. Applications

The accuracy of the proposed method was determined by calculating the recovery percentage of chlorfenvinphos and malathion in three kinds of water samples (tap, river water, and wastewater). The recovery study was performed with the addition of suitable quantities of the OPPs under examination to the water samples. The measurements were performed 24 h after the pesticides were added. The average recovery percentage data were collected in Table 6.
A statistical procedure based on standard addition methods was used to evaluate the method’s accuracy and quality [38,39,40]. Standard addition calibration and standard calibration curves were constructed. Regression analysis was used to compute the intercept, slope, and standard deviation of each curve’s slope as well as its regression coefficient. Table 6 displays the research data used to validate the detection of OPPs in water (the average recovery percentage data based on the results of three tests). The results were quite excellent in terms of recovery. The matrix effect was minimal, as the slopes of the pure pesticides and the actual samples (Table 1 and Table 6) were relatively close. Consequently, the pesticide concentrations could be directly quantified using standard calibration curves.

5. Conclusions

A sensitive, simple, and selective fluorometric technique for measuring chlorfenvinphos and malathion was developed using the europium(III)–(virB1)2 complex. The forming complex’s Eu (III)/vitB1 ratio was 1:2 using the molar ratio method. The optimum solvent for detection was methanol. The chemosensor displayed static quenching of luminescence with increasing concentrations of chlorfenvinphos or malathion. The detection limit was low enough to identify pesticides at sub-micromolar concentrations (0.12 and 0.31 µM for malathion and chlorfenvinphos, respectively). Thus, the europium(III)–(vitB1)2 complex is an efficient chemosensor for determining chlorfenvinphos or malathion.

Supplementary Materials

The following supporting information can be downloaded at: https://www.mdpi.com/article/10.3390/chemosensors10100391/s1, Figure S1: The UV-Vis spectra of the 5 × 10⁻⁵ mol·L−1 ligand (vitB1) in different solvents and at room temperature, Figure S2: The UV-Vis spectra of the 2.5 × 10⁻⁵ mol·L−1 Eu (III)–(vitB1)2 complex in different solvents and at room temperature, Figure S3: The luminescence intensity ratio of the Eu (III)–(vitB1)2 complex at two wavelengths (616/592 nm) vs. 1/[P] in methanol at λex = 268 nm, at room temperature), Table S1: The apparent binding constants (log K) of the Eu(III)–(vitB1)2 complex with chlorfenvinphos and malathion pesticides, using ratiometric analysis by measuring fluorescence intensity at the emission wavelengths of 616 and 592 nm, in methanol, and at room temperature.

Author Contributions

G.M.K., J.S.A. and M.A.R. are the corresponding authors, G.M.K., M.A.M.A., J.S.A. and M.A.R. conceived the experiments. G.M.K. and A.M.A. conducted the experiments and J.S.A. acquired funding. All authors have read and agreed to the published version of the manuscript.

Funding

This research was funded by the Deanship of Scientific Research at Najran University (grant number NU/NRP/SERC/11/2).

Data Availability Statement

All data generated or analyzed during this study are included in this published article (and its Supplementary Information Files).

Acknowledgments

The authors are thankful to the Deanship of Scientific Research at Najran University for funding this work (under the National Research Priorities funding program grant code NU/NRP/SERC/11/2).

Conflicts of Interest

The authors declare no conflict of interest.

References

  1. Zhang, R.; Li, N.; Sun, J.; Gao, F. Colorimetric and Phosphorimetric Dual-Signaling Strategy Mediated by Inner Filter Effect for Highly Sensitive Assay of Organophosphorus Pesticides. J. Agric. Food Chem. 2015, 63, 8947–8954. [Google Scholar] [CrossRef]
  2. Cooper, J.; Dobson, H. The benefits of pesticides to mankind and the environment. Crop Prot. 2007, 26, 1337–1348. [Google Scholar] [CrossRef]
  3. van der Werf, H.M. Assessing the impact of pesticides on the environment. Agric. Ecosyst. Environ. 1996, 60, 81–96. [Google Scholar] [CrossRef]
  4. Bayrami, M.; Hashemi, T.; Malekirad, A.A.; Ashayeri, H.; Faraji, F.; Abdollahi, M. Electroencephalogram, Cognitive State, Psychological Disorders, Clinical Symptom, and Oxidative Stress in Horticulture Farmers Exposed to Organophosphate Pesticides. Toxicol. Ind. Health 2012, 28, 90–96. [Google Scholar] [CrossRef] [PubMed]
  5. McCauley, L.A.; Anger, W.K.; Keifer, M.; Langley, R.; Robson, M.G.; Rohlman, D. Studying Health Outcomes in Farmworker Populations Exposed to Pesticides. Environ. Health Perspect. 2006, 114, 953–960. [Google Scholar] [CrossRef]
  6. Wilson, C.; Tisdell, C. Why Farmers Continue to Use Pesticides despite Environmental, Health and Sustainability Costs. Ecol. Econ. 2001, 39, 449–462. [Google Scholar] [CrossRef]
  7. Hu, T.T.; Lu, C.M.; Li, H.; Zhang, Z.X.; Zhao, Y.H.; Li, J. Determination of Eleven Organophosphorus Pesticide Residues in Textiles by Using HPLC-HRMS. Anal. Sci. 2017, 33, 1027–1032. [Google Scholar] [CrossRef] [PubMed]
  8. Sun, P.; Zheng, S.; Yan, R.; Lian, Y. Determination of Organophosphorus Pesticides Using Solid-Phase Extraction Followed by Gas Chromatography-Mass Spectrometry. J. Chromatogr. Sci. 2022, 60, 1–6. [Google Scholar] [CrossRef]
  9. Boneva, I.; Yaneva, S.; Danalev, D. Development and Validation of Method for Determination of Organophosphorus Pesticides Traces in Liver Sample by GC-MS/MS-Ion Trap. Acta Chromatogr. 2021, 33, 188–194. [Google Scholar] [CrossRef]
  10. Moinfar, S.; Khodayari, A.; Abdulrahman, S.S.; Aghaei, A.; Sohrabnezhad, S.; Jamil, L.A. Development of a SPE/GC–MS Method for the Determination of Organophosphorus Pesticides in Food Samples Using Syringe Filters Packed by GNP/MIL-101(Cr) Nanocomposite. Food Chem. 2022, 371, 130997. [Google Scholar] [CrossRef]
  11. de Souza, D.; Machado, S.A.S. Electroanalytical Method for Determination of the Pesticide Dichlorvos Using Gold-Disk Microelectrodes. Anal. Bioanal. Chem. 2005, 382, 1720–1725. [Google Scholar] [CrossRef] [PubMed]
  12. Chauhan, C. Contemporary voltammetric techniques and its application to pesticide analysis: A review. Mater. Today: Proc. 2020, 37, 3231–3240. [Google Scholar] [CrossRef]
  13. Chen, G.; Wang, P. Electroanalytical Methods for Detecting Pesticides in Agricultural Products: A Review and Recent Developments. Int. J. Electrochem. Sci. 2020, 15, 2700–2712. [Google Scholar] [CrossRef]
  14. Roda, A.; Rauch, P.; Ferri, E.; Girotti, S.; Ghini, S.; Carrea, G.; Bovara, R. Chemiluminescent Flow Sensor for the Determination of Paraoxon and Aldicarb Pesticides. Anal. Chim. Acta 1994, 294, 35–42. [Google Scholar] [CrossRef]
  15. Xu, Z.L.; Sun, W.J.; Yang, J.Y.; Jiang, Y.M.; Campbell, K.; Shen, Y.D.; Lei, H.T.; Zeng, D.P.; Wang, H.; Sun, Y.M. Development of a Solid-Phase Extraction Coupling Chemiluminescent Enzyme Immunoassay for Determination of Organophosphorus Pesticides in Environmental Water Samples. J. Agric. Food Chem. 2012, 60, 2069–2075. [Google Scholar] [CrossRef] [PubMed]
  16. Chowdhary, S.; Bhattacharyya, R.; Banerjee, D. A Novel Fluorescence Based Assay for the Detection of Organophosphorus Pesticide Exposed Cholinesterase Activity Using 1-Naphthyl Acetate. Biochimie 2019, 160, 100–112. [Google Scholar] [CrossRef]
  17. Luo, Q.J.; Li, Z.G.; Lai, J.H.; Li, F.Q.; Qiu, P.; Wang, X.L. An On-off-on Gold Nanocluster-Based Fluorescent Probe for Sensitive Detection of Organophosphorus Pesticides. RSC Adv. 2017, 7, 55199–55205. [Google Scholar] [CrossRef]
  18. Hemmilä, I.; Laitala, V. Progress in Lanthanides as Luminescent Probes. J. Fluoresc. 2005, 15, 529–542. [Google Scholar] [CrossRef] [PubMed]
  19. Liang, F.-C.; Kuo, C.-C.; Chen, B.-Y.; Cho, C.-J.; Hung, C.-C.; Chen, W.-C.; Borsali, R. RGB-Switchable Porous Electrospun Nanofiber Chemoprobe-Filter Prepared from Multifunctional Copolymers for Versatile Sensing of PH and Heavy Metals. ACS Appl. Mater. Interfaces 2017, 9, 16381–16396. [Google Scholar] [CrossRef] [PubMed]
  20. Lehn, J.-M. Perspectives in Supramolecular Chemistry—From Molecular Recognition towards Molecular Information Processing and Self-Organization. Angew. Chem. Int. Ed. Engl. 1990, 29, 1304–1319. [Google Scholar] [CrossRef]
  21. Azab, H.A.; Khairy, G.M.; Kamel, R.M. Time-Resolved Fluorescence Sensing of Pesticides Chlorpyrifos, Crotoxyphos and Endosulfan by the Luminescent Eu(III)-8-Allyl-3-Carboxycoumarin Probe. Spectrochim. Acta A Mol. Biomol. Spectrosc. 2015, 148, 114–124. [Google Scholar] [CrossRef] [PubMed]
  22. Hussein, B.H.M.; Khairy, G.M.; Kamel, R.M. Fluorescence Sensing of Phosdrin Pesticide by the Luminescent Eu(III)- and Tb(III)-Bis(Coumarin-3-Carboxylic Acid) Probes. Spectrochim. Acta A Mol. Biomol. Spectrosc. 2016, 158, 34–42. [Google Scholar] [CrossRef] [PubMed]
  23. Azab, H.A.; Khairy, G.M.; Abd El-Ghany, N.; Ahmed, M.A. A New Luminescent Bio-Probe of Europium(III)-Complex for Sensing Some Biomolecules and CT-DNA. J. Photochem. Photobiol. A Chem. 2019, 374, 1–9. [Google Scholar] [CrossRef]
  24. Azab, H.A.; Khairy, G.M.; Abd El-Ghany, N.; Ahmed, M.A. Time-Resolved Fluorescence Sensing of N-Acetyl Amino Acids, Nucleobases, Nucleotides and DNA by the Luminescent Tb (III)-8-Alkyl-2-Oxo-2H-Chromene-3-Carbaldehyde Probe. J. Lumin. 2016, 176, 181–192. [Google Scholar] [CrossRef]
  25. Leonard, J.P.; Jensen, P.; McCabe, T.; O’Brien, J.E.; Peacock, R.D.; Kruger, P.E.; Gunnlaugsson, T. Self-Assembly of Chiral Luminescent Lanthanide Coordination Bundles. J. Am. Chem. Soc. 2007, 129, 10986–10987. [Google Scholar] [CrossRef]
  26. Anwar, Z.M.; Ibrahim, I.A.; Kamel, R.M.; Abdel-Salam, E.T.; El-Asfoury, M.H. New Highly Sensitive and Selective Fluorescent Terbium Complex for the Detection of Aluminium Ions. J. Mol. Struct. 2018, 1154, 272–279. [Google Scholar] [CrossRef]
  27. Qu, L.-L.; Liu, Y.-Y.; He, S.-H.; Chen, J.-Q.; Liang, Y.; Li, H.-T. Highly Selective and Sensitive Surface Enhanced Raman Scattering Nanosensors for Detection of Hydrogen Peroxide in Living Cells. Biosens. Bioelectron. 2016, 77, 292–298. [Google Scholar] [CrossRef]
  28. Lakowicz, J.R. Principles of Fluorescence Spectroscopy; Springer: New York, NY, USA, 1983; p. 454. [Google Scholar]
  29. Kazakov, V.P.; Voloshin, A.I.; Ostakhov, S.S.; Shavaleev, N.M. The Anomalous Influence of Water on the Intensity and Lifetime of Fluorescence in Tris(Benzoyltrifluoroacetonate)Europium(III). Mendeleev Commun. 1998, 8, 47–49. [Google Scholar] [CrossRef]
  30. Wang, S.; Cao, T.; Yan, H.; Li, Y.; Lu, J.; Ma, R.; Li, D.; Dou, J.; Bai, J. Functionalization of Microporous Lanthanide-Based Metal–Organic Frameworks by Dicarboxylate Ligands with Methyl-Substituted Thieno[2,3- b ]Thiophene Groups: Sensing Activities and Magnetic Properties. Inorg. Chem. 2016, 55, 5139–5151. [Google Scholar] [CrossRef]
  31. Leonard, J.P.; Nolan, C.B.; Stomeo, F.; Gunnlaugsson, T. Photochemistry and Photophysics of Coordination Compounds: Lanthanides. In Photochemistry and Photophysics of Coordination Compounds II; Springer: Berlin/Heidelberg, Germany; pp. 1–43.
  32. Lakowicz, J.R. Quenching of Fluorescence. In Principles of Fluorescence Spectroscopy; Springer: Boston, MA, USA, 1999; pp. 237–265. [Google Scholar]
  33. Kamel, R.M. Facile Luminescent Sensing Trace Levels of Pesticides Azinphos Ethyl, Diazinon, Chlorfenviphos and Isofenphos. Inorg. Chem. Commun. 2020, 111, 107662. [Google Scholar] [CrossRef]
  34. Azab, H.A.; Ibrahim, I.A.; Hassan, N.; Abbas, A.M.; Darwish, H.M. Synthesis and Photo-Physical Properties of Novel Tb(III) -[Ethyl-4-Hydroxy-1-(4-Methoxyphenyl)−2-Quinolinone-3-Carboxylate] Complex and Luminescence Sensitivity towards Malathion and Crotoxyphos Pesticides. J. Lumin. 2017, 192, 376–384. [Google Scholar] [CrossRef]
  35. Azab, H.A.; Kamel, R.M. Sensitive and Selective Fluorescent Chemosensor for the Detection of Some Organophosphorus Pesticides Using Luminescent Eu(III) Complex. J. Photochem. Photobiol. A Chem. 2016, 321, 33–40. [Google Scholar] [CrossRef]
  36. Azab, H.A.; Kamel, R.M. Binding of Chlorfenvinphos and Malathion with DNA and Their Detection Using New Sensitive Luminescent Tb(III) Complex Probe. J. Lumin. 2016, 170, 671–678. [Google Scholar] [CrossRef]
  37. Azab, H.A.; Orabi, A.S.; Abbas, A.M. New Polymerizable Luminescence Probe for Detection of Chlorfenvinphos and Dichlorvos Pesticides. J. Lumin. 2015, 167, 360–370. [Google Scholar] [CrossRef]
  38. Azab, H.A.; Anwar, Z.M.; Rizk, M.A.; Khairy, G.M.; El-Asfoury, M.H. Determination of Organophosphorus Pesticides in Water Samples by Using a New Sensitive Luminescent Probe of Eu (III) Complex. J. Lumin. 2015, 157, 371–382. [Google Scholar] [CrossRef]
  39. Azab, H.A.; Duerkop, A.; Anwar, Z.M.; Hussein, B.H.M.; Rizk, M.A.; Amin, T. Luminescence Recognition of Different Organophosphorus Pesticides by the Luminescent Eu(III)–Pyridine-2,6-Dicarboxylic Acid Probe. Anal. Chim. Acta 2013, 759, 81–91. [Google Scholar] [CrossRef]
  40. Azab, H.A.; El-Korashy, S.A.; Anwar, Z.M.; Khairy, G.M.; Duerkop, A. Reactivity of a Luminescent “off–on” Pyrylium Dye toward Various Classes of Amines and Its Use in a Fluorescence Sensor Microtiter Plate for Environmental Samples. J. Photochem. Photobiol. A Chem. 2012, 243, 41–46. [Google Scholar] [CrossRef]
Scheme 1. The chemical structures of the organophosphorus pesticides and ligands under study.
Chemosensors 10 00391 sch001
Figure 1. The UV-vis spectra of (1) 5 × 10⁻⁵ mol·L−1 vitB1 and (2) 2.5 × 10⁻⁵ mol·L−1 Eu (III)–(vitB1)2 complex in methanol at room temperature.
Chemosensors 10 00391 g001
Figure 2. The excitation and emission spectra of the 2.5 × 10⁻⁵ mol·L−1 of Eu (III)–(vitB1)2 complex in methanol at room temperature (λex/em = 268/616 nm). (The red numbers scale for the emission spectra).
Chemosensors 10 00391 g002
Figure 3. The luminescence spectra of the 2.5 × 10⁻⁵ mol·L−1 Eu (III)–(vitB1)2 complex in various solvents, with the λex = 268 nm, at room temperature.
Chemosensors 10 00391 g003
Figure 4. (a) The effect of vitB1 concentrations on the fluorescence of 2.5 × 10⁻⁵ mol·L−1 Eu (III) in methanol at room temperature, λex = 268 nm. (b) The [vitB1]/[Eu (III)] mole ratio plot at λem = 616 nm. (c) The hypothesized structure of the Eu (III)–(vitB1)2 complex.
Chemosensors 10 00391 g004aChemosensors 10 00391 g004b
Figure 5. (a) The luminescence spectra of 2.5 × 10⁻⁵ mol·L−1 Eu (III)–complex with 2.5 × 10⁻⁵ mol·L−1 of different pesticides in a methanol medium, λex = 268 nm, at room temperature; (b) Azinphos-ethyl (P1), chlorfenvinphos (P2), chlorpyrifos (P3), crotoxyphos (P4), diazinon (P5), dichlorvos (P6), isofenphos (P7), malathion (P8), paraoxon-ethyl (P9), phosdrin (P10), endosulfan (P11), and heptachlor (P12).
Chemosensors 10 00391 g005
Figure 6. The (a) luminescence spectra and (b) calibration plot of the 2.5 × 10⁻⁵ mol·L−1 of Eu (III)–complex with different concentrations of chlorfenvinphos (p2) (0, 0.4, 0.6, 1, 2, 4, 8, 10, and 20 µM) in methanol, at λex = 268 nm and room temperature.
Chemosensors 10 00391 g006
Figure 7. The (a) luminescence spectra and (b) calibration plot of the 2.5 × 10⁻⁵ mol·L−1 of Eu (III)–complex with different concentrations of malathion (p8) (0, 0.4, 0.6, 1, 2, 4, 6, 8, and 10 µM) in methanol, at λex = 268 nm and room temperature.
Chemosensors 10 00391 g007
Figure 8. The F0/F vs. the pesticide, (a) chlorfenvinphos (p2) or (b) malathion (p8) upon its interaction with the 2.5 × 10⁻⁵ mol·L−1 of Eu (III)–(vitB1)2 complex in methanol, (λex = 268 nm), at different temperatures.
Chemosensors 10 00391 g008
Figure 9. The effects of increasing concentrations of (a) chlorfenvinphos (P2) and (b) malathion (P8) on the luminescence intensity of the Eu (III)–(vitB1)2 complex in methanol at different temperatures.
Chemosensors 10 00391 g009
Figure 10. Van ’t Hoff plots for the interaction between the Eu (III)–(vitB1)2 probe, and (a) chlorfenvinphos (P2) and (b) malathion (P8) in methanol.
Chemosensors 10 00391 g010
Table 1. The Stern–Volmer constants (KSV) at various temperatures for 2.5 × 10⁻⁵ mol·L−1 of the Eu (III)–(vitB1)2 complex with chlorfenvinphos or malathion in methanol.
PesticidesTemp.
(K)
R2Stern–Volmer Quenching Constant K (L mol−1) × 105SD
Chlorfenvinphos2980.99988.610.22
3030.99857.850.25
3080.99396.930.3.44
3130.99536.150534
3180.99495.420.117
Malathion2980.99984.210.235
3030.99643.820.085
3080.99433.410.034
3130.99453.330.016
3180.99653.100.018
Table 2. The calibration data of the Eu (III)–(vitB1)2 probe with chlorfenvinphos (P2) and malathion (P8).
ParametersP2P8
Regression equationF0/F = 8600 X + 0.92F0/F = 4300 X + 0.98
Slope86004300
Intercept0.920.98
R20.99330.9993
Accuracy (n = 8)100.61 ± 2.74101.88 ± 1.99
Correlation coefficient (r)0.99980.99926
Linear range0.95–20 µM0.36–6 µM
SE of intercept0.033580.01359
SD of intercept0.0950.036
LOQ0.95 µM0.36 µM
LOD0.31 µM0.12 µM
Table 3. A comparison of luminescent lanthanide complexes as chemosensors for chlorfenvinphos and malathion detection.
ChemosensorsDetection LimitOther Pesticides Sensitive to the ProbeOptimum Condition for DetectionRef.
Eu(III)–(vitB1)2 complex0.31 and 0.12 µM for chlorfenvinphos and malathion, respectively-----In methanolThis work
Eu–bathophenanthroline (batho) probe1.46 µM for chlorfenvinphosAzinphos-ethyl, diazinon, and isofenphosIn 50% (v/v) acetonitrile–water mixture at pH = 6[33]
Tb(III)-[ethyl-4-hydroxy-1-(4-methoxyphenyl)−2-quinolinone-3-carboxylate] complex0.94 and 2.68 μM for malathion in ethanol and water, respectivelyCrotoxyphosIn water or ethanol[34]
Europium-o-(4-methoxy benzoyl) benzoic acid [o-(4-anisoyl)] complex2.82 µM for chlorfenvinphosAzinphos-ethyl, diazinon, and isofenphosIn ethanol–water (5:5 v/v) solution[35]
Terbium-N(acetoacetyl)-3-allyl-2hydroxybenzaldehyde hydrazone complex4.53 and 9.59 μ M for chlorfenvinphos and malathion, respectively------In ethanol[36]
Europium-(allyl-3-carboxycoumarin) complex-------Chlorpyrifos, endosulfan, and crotoxyphosIn ethanol[21]
Tb(III)-(3-allyl-2-hydroxybenzoic acid)3 complex1.9 μM for chlorfenvinphosDichlorvosIn methanol[37]
Eu(III)–TAN-1,10 phenanthroline0.64 μM for malathionEndosulfan, heptachlor, and chlorpyrifosIn HEPS buffer (pH = 7.5)[38]
Eu(III)–pyridine-2,6-dicarboxylic acid probe2.5 and 0.55 μM for malathion and chlorfenvinphosAzinphosIn 0.10 volume fraction ethanol–water mixture at pH 7.5 (HEPES buffer)[39]
Table 4. The thermodynamic and binding data of the europium (III)–(vitB1)2 complex with the OPPs under study.
PesticidesTemp.
(K)
Ka
(L. mol−1) × 105
SDnR2∆H0
(kJ mol−1)
∆S0
(J mol−1 K−1)
∆G0
(kJ mol−1)
Chlorfenvinphos2988.590.251.060.9990−17.09 ±
1.47
56.29 ±
4.77
−33.85
3037.680.221.040.9995−34.14
3086.520.021.020.9984−34.28
3136.050.031.000.9964−34.64
3185.640.031.000.9924−35.01
Malathion2984.210.031.060.9987−12.18 ±
1.85
66.43 ±
6.01
−32.09
3033.540.021.030.9790−32.19
3083.430.011.000.9710−32.64
3133.220.050.980.9760−33.00
3183.010.010.930.9961−33.35
Table 5. The interference concentrations tolerated in the presence of 2.5 × 10⁻⁵ mol·L−1 chlorfenvinphos (P2) and malathion (P8).
Interfering SpeciesTolerance (µM)
Chlorfenvinphos (P2)Malathion (P8)
Co2+1525
Cd2+4860
CO32-50200
Cu2+16100
K+15050
Na+2030
NH4+4060
Ni2+1020
NO32520
Pb2+200205
PO43−30150
Azinphos-ethyl, chlorpyrifos, crotoxyphos, diazinon, dichlorvos, isofenphos, paraoxon-ethyl, phosdrin, endosulfan, and heptachlor100100
Table 6. The recovery data of chlorfenvinphos and malathion in various water samples.
Pesticide (P)Type of Water SampleEquation for Regressionr2RDS (%)Added
[µM]
Calculated
[µM]
Recovery (%)
Chlorfenvinphos
(P2)
Tap waterF0/F = 0.89 + 4500 (P2)0.993212.332.002.01100.50
2.001.9296.00
2.002.10105.00
4.004.27106.75
4.004.13103.25
4.004.03100.75
River waterF0/F = 0.91 + 4200 (P2)0.994592.212.002.04102.00
2.001.8492.00
2.002.18109.00
4.004.24101.2
4.004.05101.25
4.003.8596.25
WastewaterF0/F = 0.88 + 4320 (P2)0.995932.372.002.13105.50
2.002.08104.00
2.001.9798.50
4.004.32108.00
4.004.11102.75
4.004.04101.00
Malathion (P8)Tap waterF0/F = 0.93 + 8600 (P8)0.994891.785.004.2384.60
5.004.5290.4
5.004.5591.00
10.009.4194.10
10.009.7097.00
10.009.7997.90
River waterF0/F = 0.97 + 8700 (P8)0.996581.825.005.05101.00
5.005.10102.00
5.005.06101.20
10.009.5995.90
10.009.7897.80
10.009.7797.70
WastewaterF0/F = 0.89 + 8500 (P8)0.998751.625.005.30106.00
5.005.20104.00
5.005.12102.4
10.0010.20102.00
10.0010.20102.00
10.0010.19101.90
Publisher’s Note: MDPI stays neutral with regard to jurisdictional claims in published maps and institutional affiliations.

