
Self-Assembled Corn-Husk-Shaped Fullerene Crystals as Excellent Acid Vapor Sensors


Abstract
:
1. Introduction
2. Materials and Methods
2.1. Materials
2.2. Synthesis of Corn-Husk-Shaped Fullerene Crystals (CHFCs)
2.3. Characterizations
2.4. Vapor Sensing by Quartz Crystal Microbalance (QCM)
3. Results
4. Discussion
5. Conclusions
Author Contributions
Funding
Data Availability Statement
Conflicts of Interest
References
- Dryahina, K.; Pospisilova, V.; Sovova, K.; Shestivska, V.; Kubista, J.; Spesyvyi, A.; Pehal, F.; Turzikova, J.; Votruba, J.; Spanel, P. Exhaled breath concentrations of acetic acid vapour in gastro-esophageal reflux disease. J. Breath Res. 2014, 8, 037109. [Google Scholar] [CrossRef]
- Lvova, L.; Yaroshenko, I.; Kirsanov, D.; Natale, C.D.; Paolesse, R.; Legin, A. Electronic Tongue for Brand Uniformity Control: A Case Study of Apulian Red Wines Recognition and Defects Evaluation. Sensors 2018, 18, 2584. [Google Scholar] [CrossRef]
- Magalhães, K.T.; Dragone, G.; de Melo Pereira, G.V.; Oliveira, J.M.; Domingues, L.; Teixeira, J.A.; e Silva, J.B.A.; Schwan, R.F. Comparative study of the biochemical changes and volatile compound formations during the production of novel whey-based kefir beverages and traditional milk kefir. Food Chem. 2011, 126, 249–253. [Google Scholar] [CrossRef]
- Mas, A.; Torija, M.J.; García-Parrilla, M.d.C.; Troncoso, A.M. Acetic Acid Bacteria and the Production and Quality of Wine Vinegar. Sci. World J. 2014, 2014, 394671. [Google Scholar] [CrossRef] [PubMed]
- Mikhailov, A.A. Effect of Low-Molecular Carbon Acids on Atmospheric Corrosion of Metals. Prot. Met. Phys. Chem. Surf. 2009, 45, 757–765. [Google Scholar] [CrossRef]
- Lou, X.; Singh, P.M. Role of Water, Acetic acid and Chloride on Corrosion and Pitting Behaviour of Carbon Steel in Fuel-Grade Ethanol. Corros Sci. 2010, 52, 2303–2315. [Google Scholar] [CrossRef]
- Greenwald, R.; Fitzpatrick, A.M.; Gaston, B.; Marozkina, N.V.; Erzurum, S.; Teague, W.G. Breath Formate is a Marker of Airway S-Nitrosothiol Depletion in Severe Asthma. PLoS ONE 2010, 5, e11919. [Google Scholar] [CrossRef]
- Stavrakou, T.; Müller, J.F.; Peeters, J.; Razavi, A.; Clarisse, L.; Clerbaux, C.; Coheur, P.F.; Hurtmans, D.; De Mazière, M.; Vigouroux, C.; et al. Satellite Evidence for a Large Source of Formic Acid from Boreal and Tropical Forests. Nat. Geosci. 2012, 5, 26–30. [Google Scholar] [CrossRef]
- Itoh, T.; Koyama, Y.; Shin, W.; Akamatsu, T.; Tsuruta, A.; Masuda, Y.; Uchiyama, K. Selective Detection of Target Volatile Organic Compounds in Contaminated Air Using Sensor Array with Machine Learning: Aging Notes and Mold Smells in Simulated Automobile Interior Contaminant Gases. Sensors 2020, 20, 2687. [Google Scholar] [CrossRef]
- Yuan, Z.; Yang, C.; Gao, H.; Qin, W.; Meng, F. High Response Formic Acid Gas Sensor Based on MoS2 Nanosheets. IEEE Trans. Nanotechnol. 2021, 20, 177–184. [Google Scholar] [CrossRef]
- Tammanoon, N.; Wisitsoraat, A.; Tuantranont, A.; Liewhiran, C. Flame-Made Zn-Substituted SnO2 Nanoparticulate Compound for Ultra-Sensitive Formic Acid Gas Sensing. J. Alloys Compd. 2021, 871, 159547. [Google Scholar] [CrossRef]
- Pineau, N.J.; Krumeich, F.; Güntner, A.T.; Pratsinis, S.E. Y-Doped ZnO Films for Acetic Acid Sensing Down to ppb at High Humidity. Sens. Actuators B Chem. 2021, 327, 128843. [Google Scholar] [CrossRef]
- Lin, S.; Swager, T.M. Carbon Nanotube Formic Acid Sensors Using a Nickel Bis(ortho-diiminosemiquinonate) Selector. ACS Sens. 2018, 3, 569–573. [Google Scholar] [CrossRef] [PubMed]
- Evtugyn, G.; Porfireva, A.; Shamagsumova, R.; Hianik, T. Advances in Electrochemical Aptasensors Based on Carbon Nanomaterials. Chemosensors 2020, 8, 96. [Google Scholar] [CrossRef]
- Kroto, H.; Heath, J.; O’Brien, S.; Curl, R.; Smalley, R. C60: Buckminsterfullerene. Nature 1985, 318, 162–163. [Google Scholar] [CrossRef]
- Park, C.; Yoon, E.; Kawano, M.; Joo, T.; Choi, H.C. Self-Crystallization of C70 Cubes and Remarkable Enhancement of Photoluminescence. Angew. Chem. Int. Ed. 2010, 49, 9670–9675. [Google Scholar] [CrossRef]
- Ehsani, M.; Rahimi, P.; Joseph, Y. Structure–Function Relationships of Nanocarbon/Polymer Composites for Chemiresistive Sensing: A Review. Sensors 2021, 21, 3291. [Google Scholar] [CrossRef]
- Bairi, P.; Minami, K.; Nakanishi, W.; Hill, J.P.; Ariga, K.; Shrestha, L.K. Hierarchically Structured Fullerene C70 Cube for Sensing Volatile Aromatic Solvent Vapors. ACS Nano 2016, 10, 6631–6637. [Google Scholar] [CrossRef]
- Kalanur, S.S.; Jaldappagari, S.; Balakrishnan, S. Enhanced Electrochemical Response of Carbamazepine at a Nano-Structured Sensing Film of Fullerene-C60 and its Analytical Applications. Electrochim. Acta 2011, 56, 5295–5301. [Google Scholar] [CrossRef]
- Thirumalraj, B.; Palanisamy, S.; Chen, S.-M.; Yang, C.-Y.; Periakaruppan, P.; Lou, B.-S. Direct Electrochemistry of Glucose Oxidase and Sensing of Glucose at a Glassy Carbon Electrode Modified with a Reduced Graphene Oxide/Fullerene-C60 Composite. RSC Adv. 2015, 5, 77651–77657. [Google Scholar] [CrossRef]
- Nag, S.; Castro, M.; Choudhary, V.; Feller, J.-F. Boosting Selectivity and Sensitivity to Biomarkers of Quantum Resistive Vapour Sensors used for Volatolomics with Nanoarchitectured Carbon Nanotubes or Graphene Platelets Connected by Fullerene Junctions. Chemosensors 2021, 9, 66. [Google Scholar] [CrossRef]
- Wei, L.; Yao, J.; Fu, H. Solvent-Assisted Self-Assembly of Fullerene into Single-Crystal Ultrathin Microribbons as Highly Sensitive UV–Visible Photodetectors. ACS Nano 2013, 7, 7573–7582. [Google Scholar] [CrossRef]
- Kim, K.-H.; Ko, D.-K.; Kim, Y.-T.; Kim, N.H.; Paul, J.; Zhang, S.-Q.; Murray, C.B.; Acharya, R.; DeGrado, W.F.; Kim, Y.H.; et al. Protein-Directed Self-Assembly of a Fullerene Crystal. Nat. Commun. 2016, 7, 11429. [Google Scholar] [CrossRef]
- Lu, F.; Neal, E.A.; Nakanishi, T. Self-Assembled and Nonassembled Alkylated-Fullerene Materials. Acc. Chem. Res. 2019, 52, 1834–1843. [Google Scholar] [CrossRef]
- Ciotta, E.; Prosposito, P.; Tagliatesta, P.; Lorecchio, C.; Stella, L.; Kaciulis, S.; Soltani, P.; Placidi, E.; Pizzoferrato, R. Discriminating between Different Heavy Metal Ions with Fullerene-Derived Nanoparticles. Sensors 2018, 18, 1496. [Google Scholar] [CrossRef] [PubMed]
- Liu, H.; Li, Y.; Jiang, L.; Luo, H.; Xiao, S.; Fang, H.; Li, H.; Zhu, D.; Yu, D.; Xu, J.; et al. Imaging As-Grown [60]Fullerene Nanotubes by Template Technique. J. Am. Chem. Soc. 2002, 124, 13370–13371. [Google Scholar] [CrossRef]
- Tachibana, M.; Kobayashi, K.; Uchida, T.; Kojima, K.; Tanimura, M.; Miyazawa, K. Photo-Assisted Growth and Polymerization of C60 ‘nano’whiskers. Chem. Phys. Lett. 2003, 374, 279–285. [Google Scholar] [CrossRef]
- Wang, L.; Liu, B.; Liu, D.; Yao, M.; Hou, Y.; Yu, S.; Cui, T.; Li, D.; Zou, G.; Iwasiewicz, A.; et al. Synthesis of Thin, Rectangular C60 Nanorods Using m-Xylene as a Shape Controller. Adv. Mater. 2006, 18, 1883–1888. [Google Scholar] [CrossRef]
- Miyazawa, K.; Kuwasaki, Y.; Obayashi, A.; Kuwabara, M. C60 Nanowhiskers Formed by the Liquid–liquid Interfacial Precipitation Method. J. Mater. Sci. 2002, 17, 83–88. [Google Scholar] [CrossRef]
- Sathish, M.; Miyazawa, K. Size-Tunable Hexagonal Fullerene (C60) Nanosheets at the Liquid−Liquid Interface. J. Am. Chem. Soc. 2007, 129, 13816–13817. [Google Scholar] [CrossRef] [PubMed]
- Wang, B.; Zheng, S.; Saha, A.; Bao, L.; Lu, X.; Guldi, D.M. Understanding Charge-Transfer Characteristics in Crystalline Nanosheets of Fullerene/(Metallo)porphyrin Cocrystals. J. Am. Chem. Soc. 2017, 139, 10578–10584. [Google Scholar] [CrossRef]
- Matsuoka, K.; Matsumura, S.; Akiyama, T.; Yamada, S. Shape Control of Fullerene Microparticles by Using Ethylenediamine. Chem. Lett. 2008, 37, 932–933. [Google Scholar] [CrossRef]
- Gavat, O.; Trinh, T.M.N.; Moulin, E.; Ellis, T.; Maaloum, M.; Buhler, E.; Fleith, G.; Nierengarten, J.-F.; Giuseppone, N. 3D Supramolecular Self-Assembly of [60]fullerene Hexaadducts Decorated with Triarylamine Molecules. Chem. Commun. 2018, 54, 7657–7660. [Google Scholar] [CrossRef] [PubMed]
- Das, S.; Presselt, M. Progress and Development in Structural and Optoelectronic Tunability of Supramolecular Nonbonded Fullerene Assemblies. J. Mater. Chem. C 2019, 7, 6194–6216. [Google Scholar] [CrossRef]
- Hsieh, C.-T.; Hsu, S.-h.; Maji, S.; Chahal, M.K.; Song, J.; Hill, J.P.; Ariga, K.; Shrestha, L.K. Post-assembly dimension-dependent face-selective etching of fullerene crystals. Mater. Horiz. 2020, 7, 787–795. [Google Scholar] [CrossRef]
- Ramm, M.; Luger, P.; Zobel, D.; Duczek, W.; Boeyens, J.C.A. Static Disorder in Hexagonal Crystal Structure of C60 at 100 K and 20 K. Cryst. Res. Technol. 1996, 31, 43–53. [Google Scholar] [CrossRef]
- Rana, M.; Bharathanatha, R.R.; Gautam, U.K. Kinetically Stabilized C60-Tolulene Solvate Nanostructures with a Discrete Absorption Edge Enabling Supramolecular Topotactic Molecular Exchange. Carbon 2014, 74, 44–53. [Google Scholar] [CrossRef]
- Shrestha, L.K.; Shrestha, R.G.; Yamauchi, Y.; Hill, J.P.; Nishimura, T.; Miyazawa, K.; Kawai, T.; Okada, S.; Wakabayashi, K.; Ariga, K. Nanoporous Carbon Tubes from Fullerene Crystals as the π-Electron Carbon Source. Angew. Chem. Int. Ed. 2015, 54, 951–955. [Google Scholar] [CrossRef] [PubMed]
- Arie, A.A.; Chang, W.; Lee, J.K. Effect of Fullerene Coating on Silicon Thin Film Anodes for Lithium Rechargeable Batteries. J. Solid State Electrochem. 2009, 14, 51–56. [Google Scholar] [CrossRef]
- Vimalanathan, K.; Shrestha, R.G.; Zhang, Z.; Zou, J.; Nakayama, T.; Raston, C.L. Surfactant-Free Fabrication of Fullerene C60 Nanotubes Under Shear. Angew. Chem. Int. Ed. 2017, 56, 8398–8401. [Google Scholar] [CrossRef]
- Furuuchi, N.; Shrestha, R.G.; Yamashita, Y.; Hirao, T.; Ariga, K.; Shrestha, L.K. Self-Assembled Fullerene Crystals as Excellent Aromatic Vapor Sensors. Sensors 2019, 19, 267. [Google Scholar] [CrossRef]
- Gibson, L.T.; Watt, C.M. Acetic and Formic Acids Emitted from Wood Samples and Their Effect on Selected Materials in Museum Environments. Corros. Sci. 2010, 52, 172–178. [Google Scholar] [CrossRef]
- Al-Hardan, N.H.; Abdullah, M.J.; Abdul Aziz, A.; Ahmad, H.; Low, L.Y. ZnO Thin Films for VOC Sensing Applications. Vacuum 2010, 85, 101–106. [Google Scholar] [CrossRef]
- Han, L.; Shi, X.; Wu, W.; Kirk, F.L.; Luo, J.; Wang, L.; Mott, D.; Cousineau, L.; Lim, S.I.I.; Lu, S.; et al. Nanoparticle-Structured Aensing Array Materials and Pattern Recognition for VOC Detection. Sens. Actuators B Chem. 2005, 106, 431–441. [Google Scholar] [CrossRef]
- Kaur, N.; Zappa, D.; Ferroni, M.; Poli, N.; Campanini, M.; Negrea, R.; Comini, E. Branch-Like NiO/ZnO Heterostructures for VOC Sensing. Sens. Actuators B Chem. 2018, 262, 477–485. [Google Scholar] [CrossRef]
- Kılınç, N.; Şennik, E.; Öztürk, Z.Z. Fabrication of TiO2 Nanotubes by Anodization of Ti Thin Films for VOC Sensing. Thin Solid Films 2011, 520, 953–958. [Google Scholar] [CrossRef]
- Şennik, E.; Alev, O.; Öztürk, Z.Z. The Effect of Pd on the H2 and VOC Sensing Properties of TiO2 Nanorods. Sens. Actuators B Chem. 2016, 229, 692–700. [Google Scholar] [CrossRef]
- Sennik, E.; Kilinc, N.; Ozturk, Z.Z. Electrical and VOC Sensing Properties of Anatase and Rutile TiO2 Nanotubes. J. Alloys Compd. 2014, 616, 89–96. [Google Scholar] [CrossRef]
- Seo, M.-H.; Yuasa, M.; Kida, T.; Huh, J.-S.; Yamazoe, N.; Shimanoe, K. Microstructure Control of TiO2 Nanotubular Films for Improved VOC Sensing. Sens. Actuators B Chem. 2011, 154, 251–256. [Google Scholar] [CrossRef]
- Cappelli, I.; Fort, A.; Grasso, A.L.; Panzardi, E.; Mugnaini, M.; Vignoli, V. RH Sensing by Means of TiO2 Nanoparticles: A Comparison among Different Sensing Techniques Based on Modeling and Chemical/Physical Interpretation. Chemosensors 2020, 8, 89. [Google Scholar] [CrossRef]
- Pandhi, T.; Chandnani, A.; Subbaraman, H.; Estrada, D. A Review of Inkjet Printed Graphene and Carbon Nanotubes Based Gas Sensors. Sensors 2020, 20, 5642. [Google Scholar] [CrossRef] [PubMed]
- Love, C.; Nazemi, H.; El-Masri, E.; Abbrose, K.; Freund, M.S.; Emadi, A. A Review on Advanced Sensing Materials for Agricultural Gas Sensors. Sensors 2021, 21, 3423. [Google Scholar] [CrossRef] [PubMed]


| Sample | Selectivity | ΔF (Hz) | Reference |
|---|---|---|---|
| FC | Toluene | 206 | 18 |
| HFC | Toluene | 721 | 18 |
| FNR | Toluene | 131 | 35 |
| FNR-EDA | Formic acid | 1758 | 35 |
| FNT | Toluene | 40 | 38 |
| HT-FNT | Benzene | 125 | 38 |
| BMFC | Aniline | 310 | 41 |
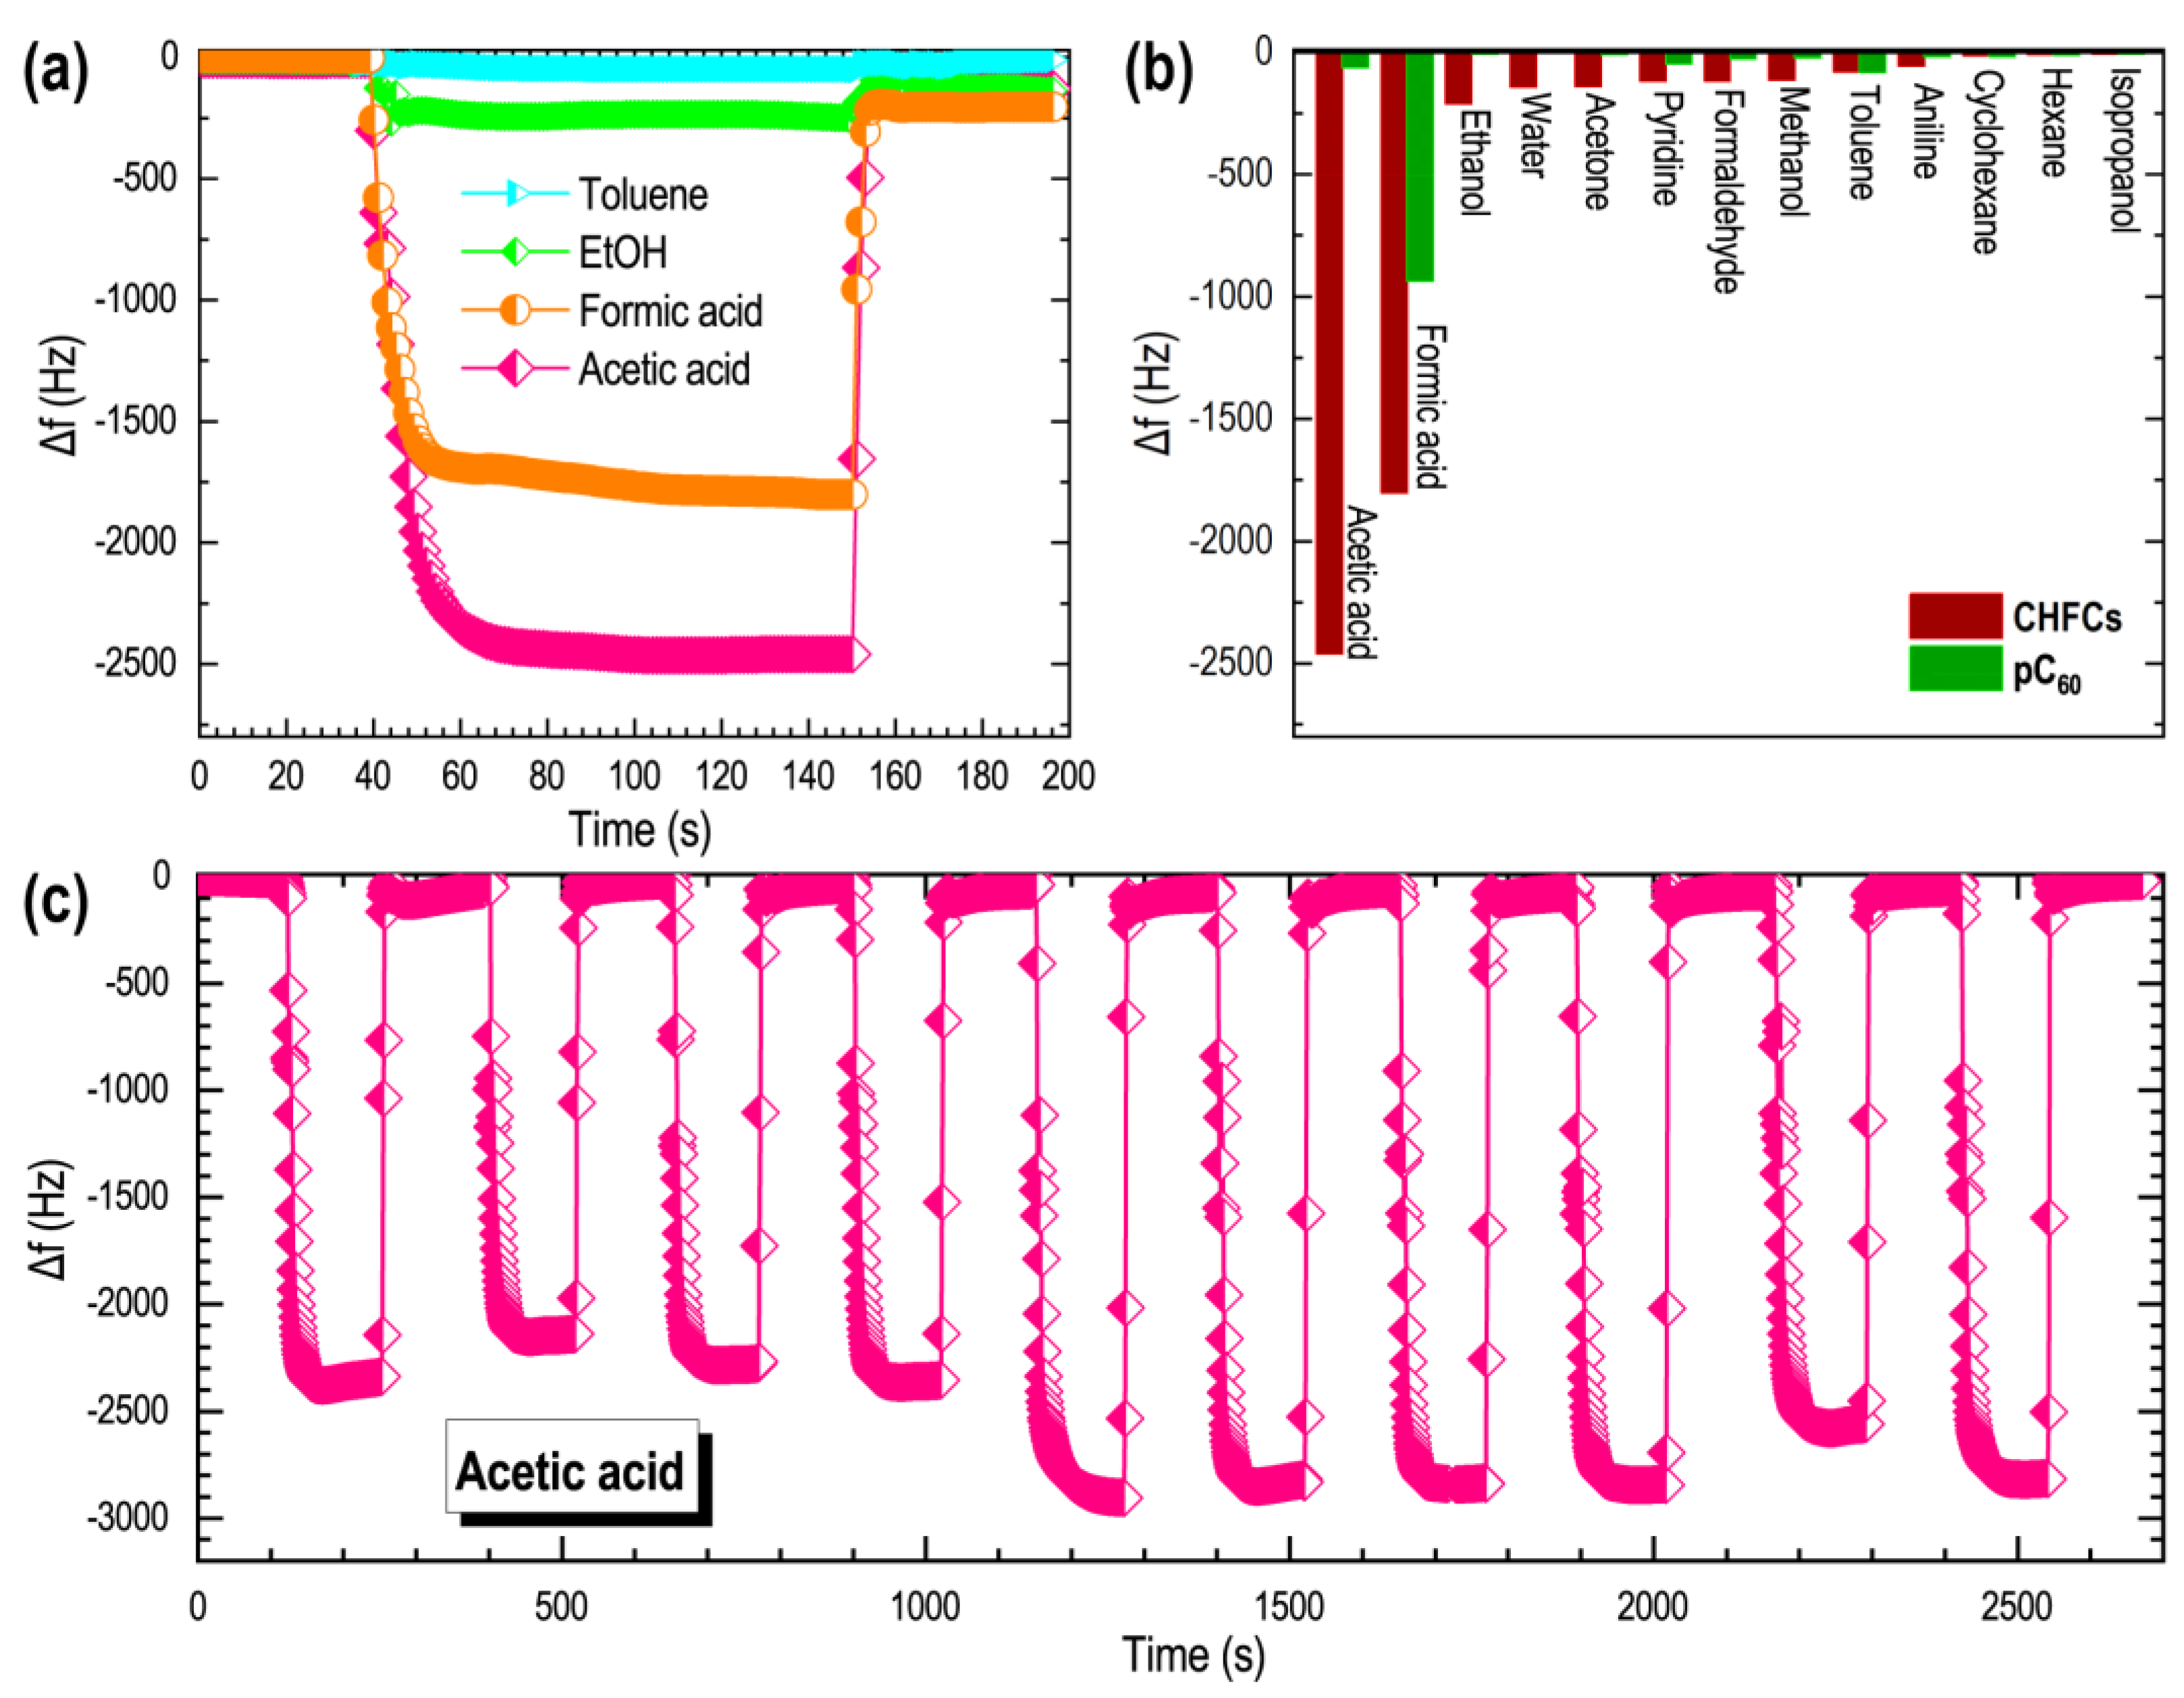
| CHFCs | Acetic acid | 2460 | This work |
Publisher’s Note: MDPI stays neutral with regard to jurisdictional claims in published maps and institutional affiliations. |
© 2022 by the authors. Licensee MDPI, Basel, Switzerland. This article is an open access article distributed under the terms and conditions of the Creative Commons Attribution (CC BY) license (https://creativecommons.org/licenses/by/4.0/).
Share and Cite
Wei, Z.; Song, J.; Ma, R.; Ariga, K.; Shrestha, L.K. Self-Assembled Corn-Husk-Shaped Fullerene Crystals as Excellent Acid Vapor Sensors. Chemosensors 2022, 10, 16. https://doi.org/10.3390/chemosensors10010016
Wei Z, Song J, Ma R, Ariga K, Shrestha LK. Self-Assembled Corn-Husk-Shaped Fullerene Crystals as Excellent Acid Vapor Sensors. Chemosensors. 2022; 10(1):16. https://doi.org/10.3390/chemosensors10010016
Chicago/Turabian StyleWei, Zexuan, Jingwen Song, Renzhi Ma, Katsuhiko Ariga, and Lok Kumar Shrestha. 2022. "Self-Assembled Corn-Husk-Shaped Fullerene Crystals as Excellent Acid Vapor Sensors" Chemosensors 10, no. 1: 16. https://doi.org/10.3390/chemosensors10010016
APA StyleWei, Z., Song, J., Ma, R., Ariga, K., & Shrestha, L. K. (2022). Self-Assembled Corn-Husk-Shaped Fullerene Crystals as Excellent Acid Vapor Sensors. Chemosensors, 10(1), 16. https://doi.org/10.3390/chemosensors10010016