Article

Impact of Oxygen Concentration Delivered via Nasal Cannula on Different Lung Conditions: A Bench Study

1
Department of Chemistry, Fu Jen Catholic University, New Taipei City 242062, Taiwan
2
Graduate Institute of Biomedical and Pharmaceutical Science, Fu Jen Catholic University, New Taipei City 242062, Taiwan
3
Department of Respiratory Therapy, Fu Jen Catholic University, New Taipei City 242062, Taiwan
4
Department of Respiratory Therapy, Chang Gung University, Taoyuan 33302, Taiwan
*
Author to whom correspondence should be addressed.
Healthcare 2021, 9(9), 1235; https://doi.org/10.3390/healthcare9091235
Submission received: 3 August 2021 / Revised: 12 September 2021 / Accepted: 15 September 2021 / Published: 19 September 2021

Abstract

:
Background: Measuring the fraction of inspired oxygen (FiO2) is challenging in spontaneously breathing patients with impaired respiratory mechanics during low-flow nasal cannula. Our study investigates the FiO2 with varied tidal volume (VT) and respiratory rate (RR) among different lung mechanics and provides equations to estimate the FiO2. Methods: Two training and test lungs were used in this study, and the three lung mechanics (normal (R5/C60), restrictive (R20/C80), obstructive (R5/C40)) were designed. Spontaneous breathing with VT (300, 500, and 700 mL) and RR (10, 20, and 30 breaths/min) was simulated. The flow rate of the nasal cannula was set to 1, 3, and 5 L per minute (LPM), and the FiO2 was measured at the carina. Results: The lowest and highest FiO2 were evident during high (700 mL) and low VT (300 mL), respectively, among normal, restrictive, and obstructive lung models. As RR increases, this decreases the FiO2. However, we found that VT and oxygen flow rate are the principal factors influencing measured FiO2 by multiple linear regression analysis. Conclusions: Our data suggest that the actual FiO2 is never as high in spontaneously breathing patients as that estimated. VT and oxygen flow rate had a substantial impact on the FiO2.

1. Introduction

Supplemental oxygen is one of the most commonly prescribed treatments to treat spontaneously breathing patients in general units, and for long-term oxygen therapy in the home care setting [1,2,3]. In contemporary clinical practice, 50–84% of patients are exposed to excess oxygen and hyperoxia via various interfaces [1,2,3,4,5]. Recently, a systematic review and meta-analysis provided high-quality evidence that hyperoxia is life-threatening in acutely ill adults with acute myocardial infarction, sepsis, critical illness, stroke, trauma, and cardiac arrest [5].
A nasal cannula is a low-flow oxygen device most widely used in the acute or chronic care setting [1,2,3,4], yet room air dilution is an unavoidable situation [6,7,8,9,10,11]. Rule of thumb suggests that every liter per minute increases the fraction of inspired oxygen (FiO2) by approximately 4% for normal rate and depth of breathing [12,13,14]. In sick patients, there is no universal breathing pattern at a different stage; a common pattern is lower tidal volume (VT) with an increased respiratory rate (RR) [15,16,17,18,19,20,21,22]. Previous studies reported that estimated FiO2 varies from 24% to 33% at 2 L/min (LPM) and from 27% to 50% at 4 LPM [11,23,24,25]. Therefore, the precise FiO2 is difficult to measure owing to the variation of the breathing pattern for both VT and RR.
Although the increasing use of continuous monitoring of oxygen saturation by pulse oximetry (SpO2) provides an assessment of the adequacy of oxygenation, the risk may not be recognized since SpO2 may remain in a satisfactory range because of hyperoxia [12]. The ideal method for determining the FiO2 may be to sample tracheal air; however, the invasive procedure has only been performed in small numbers and may lead to changes in patterns [26].
No systemic attempt has been made to estimate the FiO2 and its likely variability in patients with obstructive and restrictive lung diseases through a nasal cannula. Therefore, we conducted this bench study to investigate the performance of a nasal cannula in a manikin head-test lung-ventilator system to simulate a spontaneous breathing pattern in normal, restrictive, and obstructive lung models. Our aim was to describe the effects of various VT and RR on the measured FiO2 at the carina and provide equations to estimate the FiO2 during standard nasal cannula oxygen therapy.

2. Materials and Methods
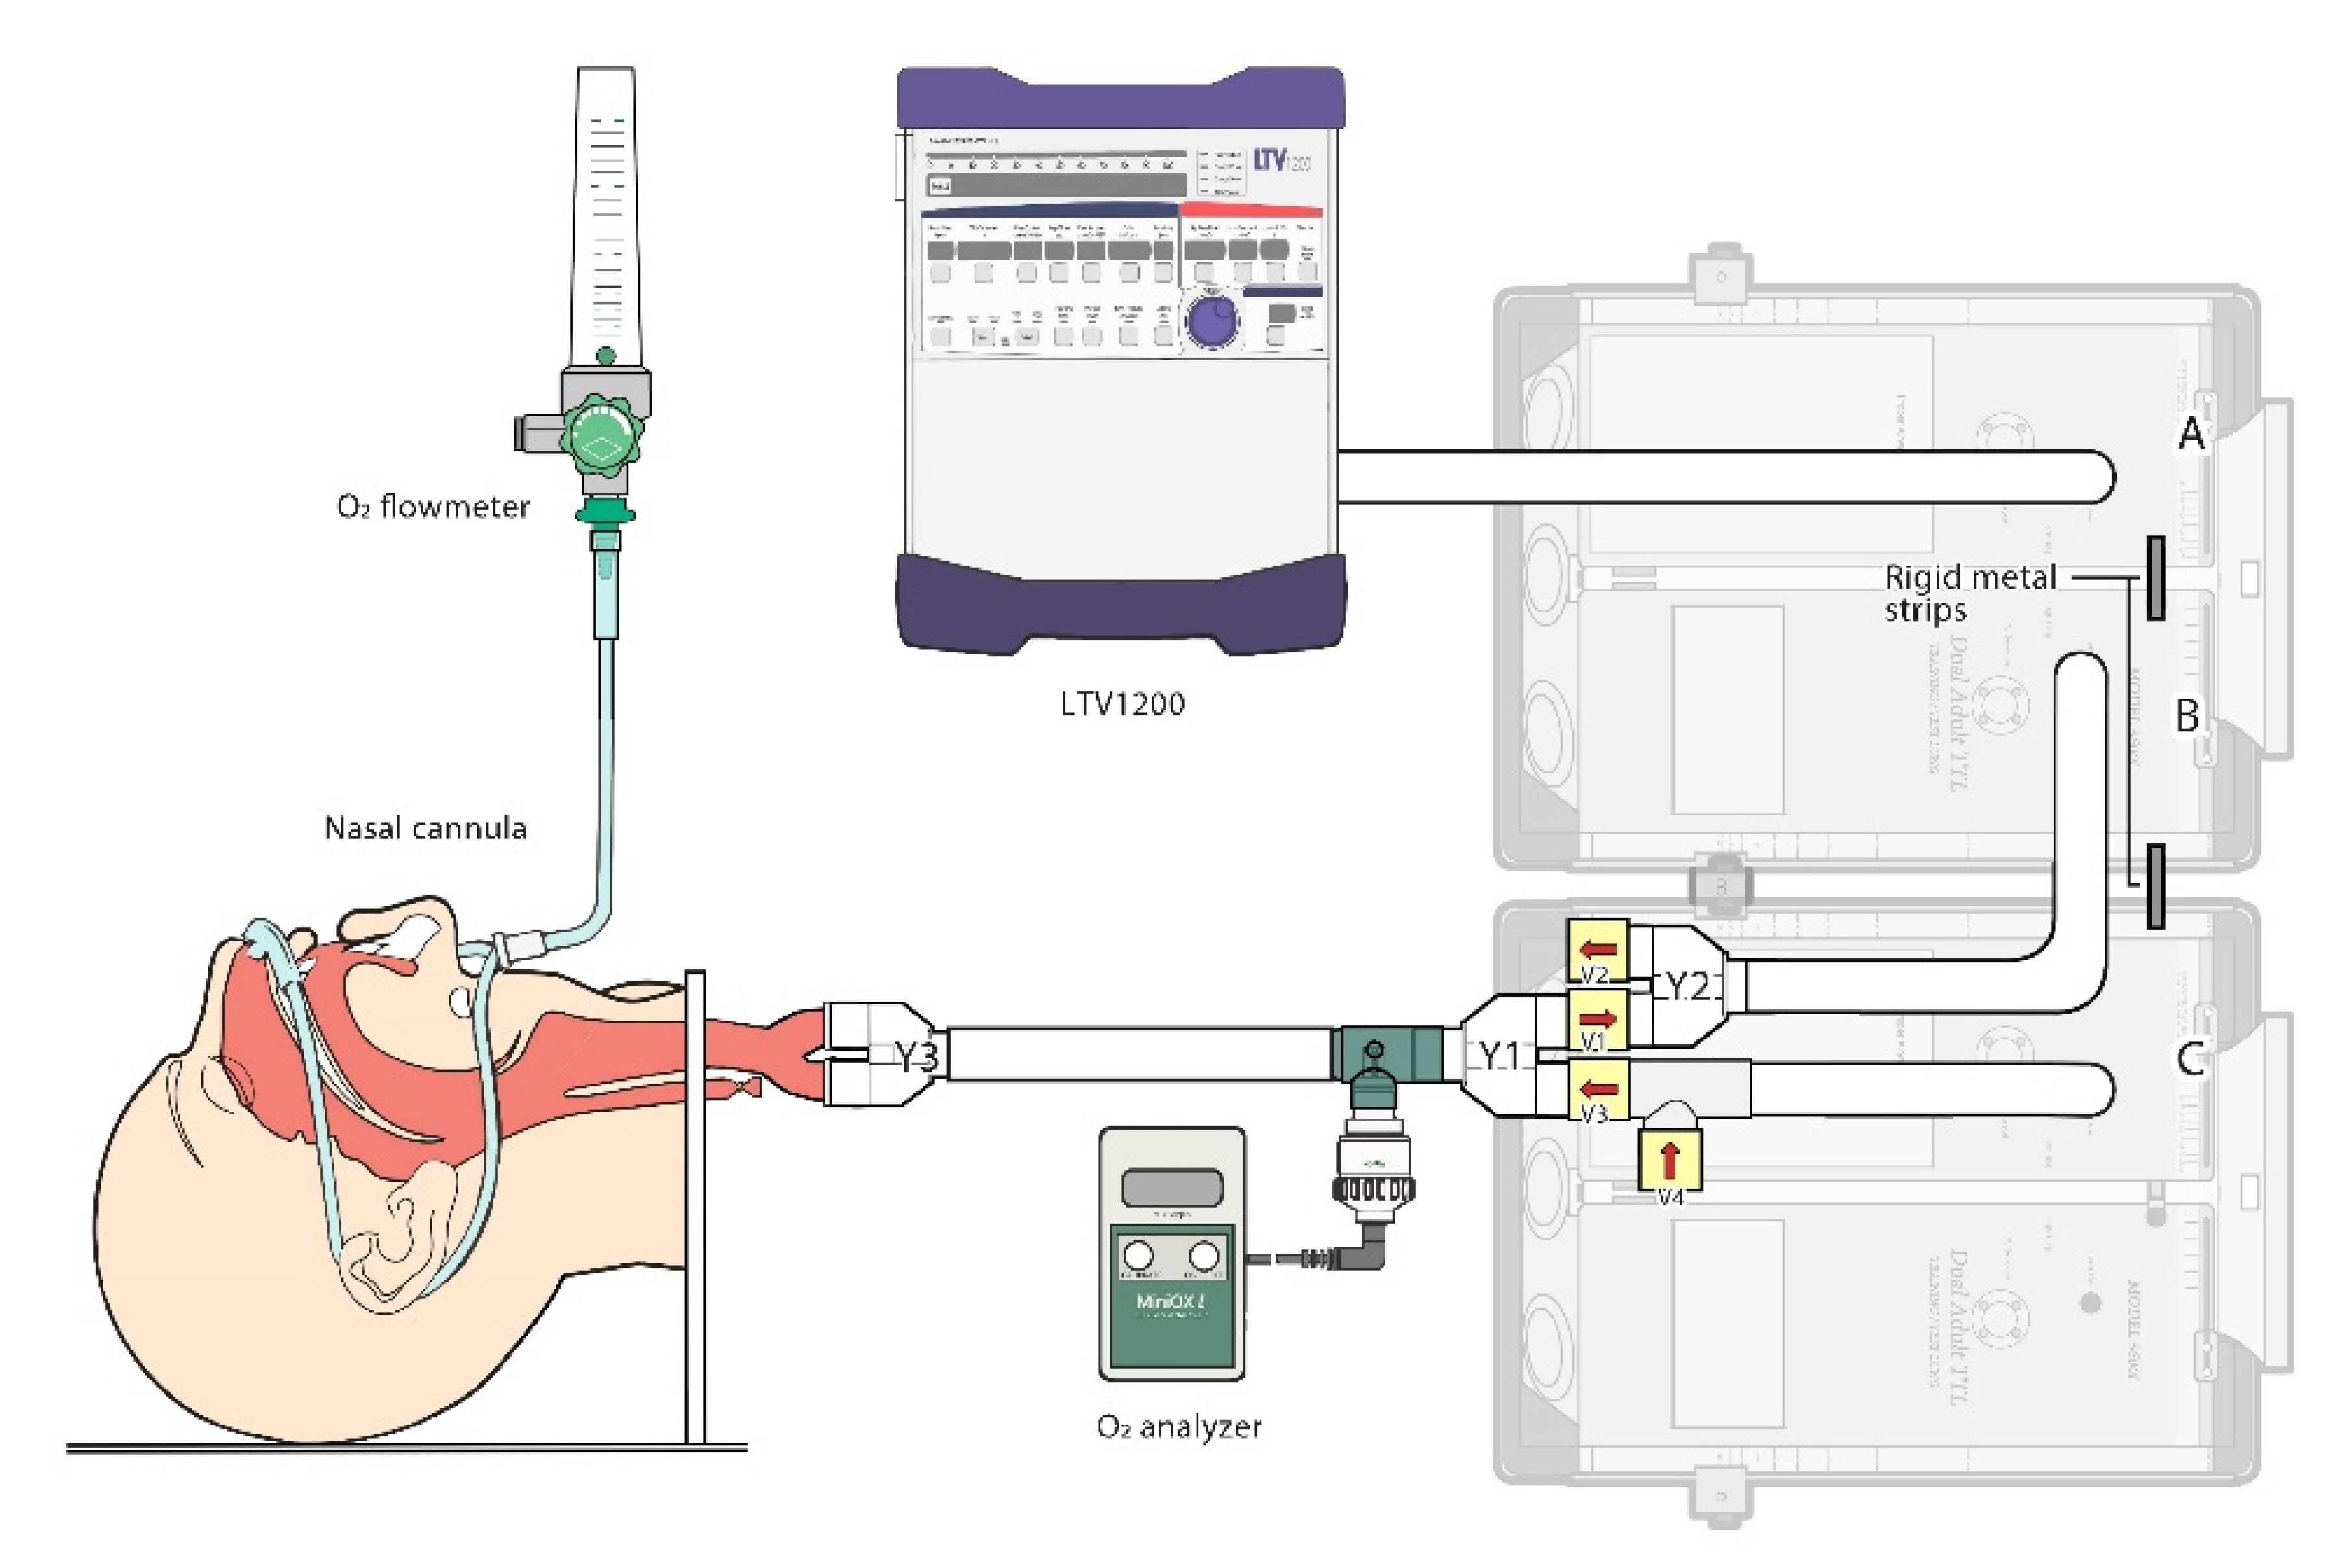
2.1. The Lung Model

An experimental apparatus was constructed as shown in Figure 1. Spontaneous breathing was generated with a mechanical ventilator (LTV 1200, CareFusion, San Diego, CA, USA) and two sets of two compartments training and test lung (TTL, Model 5600i, Michigan Instruments, Grand Rapids, Michigan) [26]. We linked the two TTLs with two rigid metal strap manually for three bellows. The driving bellow (A) and ventilation (B) bellow were used to achieve spontaneous breathing simulation, while the expiratory gas modification bellow (C) was used to generate the expiration gas flow. The driving bellow was connected to an LTV1200 ventilator, which allows for changes in RR and VT. As the driving bellow expands, a reciprocal negative pressure is produced in the ventilation bellow. This acts as “inspiration”, through the in-line one-way valve 1. Gas is thus “inhaled” into the ventilation bellow, which is connected to a human-like anatomy airway model (Laerdal Airway Management Trainer 25 00 00) with oxygen therapy applied via a nasal cannula (VADI Medical Technology, Taoyuan, Taiwan), and an oxygen analyzer (MiniOX I; MSA Medical, Gurnee, IL, USA) was connected to the bronchi for the measurement of FiO2. During expiration, the air was exhaled from the ventilation bellow through the one-way valve 2. To simulate the expired gas in the trachea, room air was inhaled through one-way valve 4 into the expiratory gas modification bellow during inspiration period. Hereafter, the air was exhaled to the anatomic dead space in the airway trainer through the one-way valve 3 during the expiration period.

2.2. Testing Protocol

This experiment included three levels of resistance (R in L/s/cmH2O) and compliance (C in mL/cmH2O) of TTL to represent the lung mechanics of normal, obstructive, and restrictive lung diseases, as suggested by the manufacturer and previous studies [27,28,29,30]. In the normal lung model, R5/C60, R20/C80, and R5/C40 were represented as obstructive and restrictive lung diseases, respectively. The protocols were performed with a wide-ranging change in the ventilatory pattern by the LTV1200 ventilator (volume control mode; low VT: 300, normal VT: 500, and high VT: 700 mL; low RR:10, normal RR: 20, and high RR: 30 breaths/min); oxygen flow rates of 1, 3, and 5 LPM were set for the nasal cannula.

2.3. Variables and Measurements

Our primary outcome was determining the FiO2. Before beginning the experiment, the oxygen analyzer was calibrated according to the manufacturer’s instructions using 50 psi wall gas source of oxygen and air. Oxygen concentration measurements were obtained at equilibrium, which was assumed to occur when the reading was steady over the 3 min period. In each experiment, the FiO2 was recorded for 10 breaths and triplicated for each experimental condition. In addition, to verify the pressure generated at the beginning of inhalation, we measured the pressure change at the carina to represent the inspiratory driving pressure during various lung mechanics.

2.4. Statistics

Means and standard deviations (SDs) were calculated within repeated sampling. The small SD of each condition confirmed the stability and reproducibility of the measurements in our simulated model. A one-way ANOVA with a post hoc Tukey’s was performed to test between-group differences. In addition, to test the predictive factors associated with the FiO2, multiple linear regression analysis was performed to determine whether VT, RR, and oxygen flow rate were predictors. Statistical analysis was performed using SPSS 22.0 software (SPSS Inc., Chicago, IL, USA). A p value of <0.05 was considered statistically significant.

3. Results

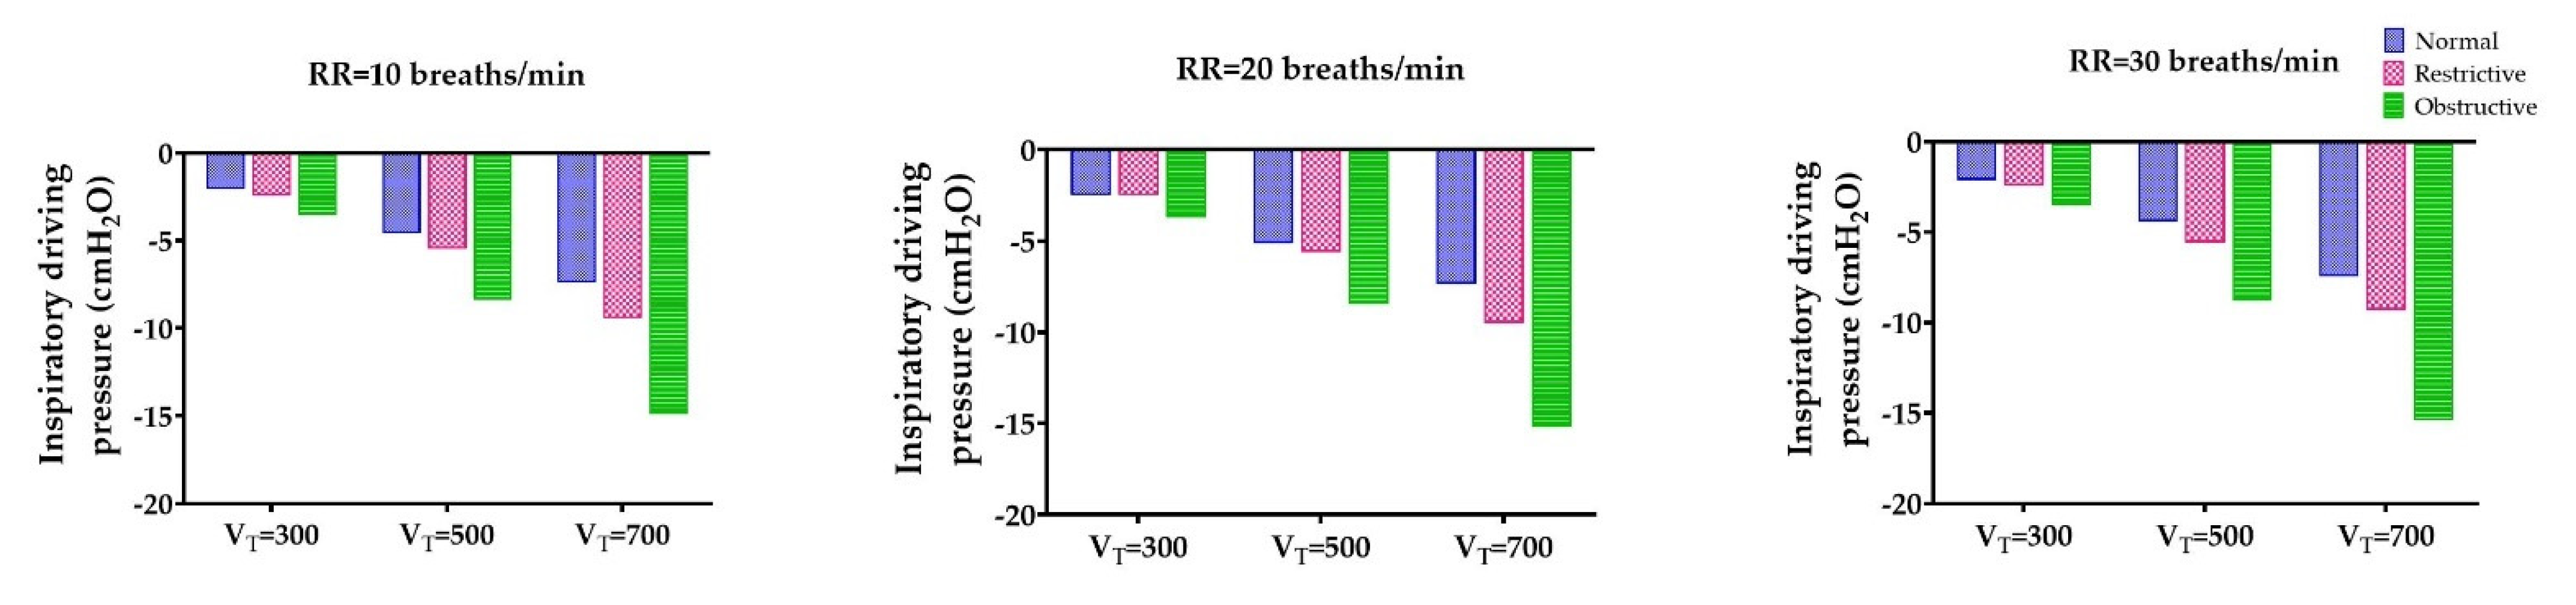
3.1. The Lowest Inspiratory Driving Pressure Obtained through the Obstructive Lung Model

We observed that the inspiratory driving pressure generated in the obstructive lung model was greater than that in the normal and restrictive lung disease models, regardless of RR and VT settings in our experiment (Figure 2). However, the trend of decreased inspiratory driving pressure was more profound in the high VT (700 mL) than in the low (300 mL) and normal (500 mL). For example, at the same RR of 30 breaths/min, the inspiratory driving pressure decreased from −2.1 to −7.4 cmH2O, −2.4 to −9.3 cmH2O, and −3.5 to −15.4 cmH2O in the normal, restrictive, and obstructive lung mechanics settings, respectively, for VT of 300, 500, and 700 mL.

3.2. Decreased Fraction of Inspired Oxygen as Tidal Volumes Increased

In normal, restrictive, and obstructive lung conditions, as VT increased, the measured FiO2 showed a statistically significant difference at all oxygen flow rates (p < 0.05) during low, normal, and high RR settings (Figure 3). In normal lung mechanics, at low RR (10 breaths/min) with 1 LPM oxygen flow delivery, the measured FiO2 was 1.116 times greater at low VT (300 mL) than at normal VT (500 mL); conversely, it was 0.966 times greater at high VT than at normal VT. Moreover, when the obstructive lung model set at VT 300, 500, and 700 mL and RR 20 breaths/min, with 1 LPM oxygen delivery, the FiO2 was 21.97 ± 0.31%, 21.63 ± 0.12%, and 21.40 ± 0.1%. With 3LPM, it was found that the increase of TV results in the decrease of the FiO2, 27.13 ± 0.31%, 24.27 ± 0.06%, and 22.87 ± 0.15% with VT of 300, 500, and 700 mL, respectively. A s result was identified with 5 LPM. When VT increased from 300 to 700 mL, the FiO2 decreased from 30.70 ± 0.61% to 27.93 ± 0.12%. The restrictive lung model showed the same trend. Consequently, at the same RR, a smaller FiO2 was recorded when a larger VT was present.

3.3. Effect of Fraction of Inspired Oxygen by the Change of Respiratory Rate

We observed a different measured FiO2 with various RRs (Figure 4). At an oxygen delivery rate of 3 LPM in VT 500 mL with the normal lung model, the FiO2 decreased by 0.63% between 20 and 10 breaths/min (p < 0.001), by 1.53% between 20 and 30 breaths/min (p < 0.001), and by 0.90% between 10 and 30 breaths/min (p < 0.001). In addition, we found that under low, normal, and high RR settings, a high VT (700 mL) recorded the smallest difference compared with normal (500 mL) and low VT (300 mL). As in the normal lung model with 3 LPM oxygen flow rate, the difference between FiO2 measurements from RR 10 to RR 20 breaths/min was 0.133% in high VT, and 0.633% and 1.867% in normal and low VT, respectively.

3.4. Tidal Volume and Oxygen Flow Rate Were Impact Factors on Oxygen Delivery

According to the above results, FiO2 measurements were affected by VT, RR, and oxygen flow rate. Therefore, we tested their relationship using multiple linear regression analysis (Table 1). In normal, restrictive, and obstructive lung models, we found no obvious effect of RR on measured FiO2, but these appeared statistically significantly affected by the VT and oxygen flow rate. The linear model produced Equation (1) for the normal lung, Equation (2) for the restrictive lung, and Equation (3) for the obstructive lung, as follows:
FiO 2 = 24.181 0.447 × V T ( liter ) + 0.753 × O 2   flow   rate
FiO 2 = 23.857 0.405 × V T ( liter ) + 0.768 × O 2   flow   rate
FiO 2 = 23.680 0.406 × V T ( liter ) + 0.769 × O 2   flow   rate

4. Discussion

Our experiment demonstrated that the variation of oxygen flow rate, VT, and RR with a low-flow nasal cannula influenced the delivery of oxygen concentrations in the normal, restrictive, and obstructive lung models. Our findings also showed that despite the different RR, a greater increase in measured FiO2 was seen in low VT (300 mL) than in normal (500 mL) and high (700 mL). Compared with RR 10 breaths/min and RR 30 breaths/min, FiO2 measured by RR 20 breaths/min had a higher value. In addition, we developed equations for low-flow nasal cannula oxygen therapy for clinicians’ reference.
Different research designs and monitoring locations result in a wide range of FiO2 measured. During oxygen therapy with nasal cannula, the rule of thumb is that for patients with a normal rate and depth of breathing, each 1 LPM of oxygen supplied increases FiO2 by approximately 4% [1,2,3]; therefore, the expected delivery is a FiO2 of 24–44%. However, if the patient’s RR approaches or exceeds 20 breaths/min, FiO2 will likely be well below the estimates, and the delivered FiO2 will only increase by approximately 2.5% for each 1 LPM above the ambient oxygen level [1,31]. Wagstaff et al. reported that effective inspired oxygen concentration with nasal cannula was 69.67% (RR 10 breaths/min) and 48% (RR 30 breaths/min) at 2 LPM, and 81.22% (RR 10 breaths/min) and 54.67% (RR 30 breaths/min) at 6 LPM during a VT of 500 mL via sampling as far down the airway [32]. In those studies, the FiO2 was measured by an oxygen analyzer placed in the lower or distal airway, for example, using an oxygen analyzer port of the TTL bellow. Chikata et al. measured the FiO2 of inspired gas downstream of the external nares and found that FiO2 with VT of 300, 500, and 700 mL was 0.37 ± 0.01, 0.32 ± 0, and 0.29 ± 0 at 2 LPM; 0.45 ± 0.01, 0.39 ± 0.01, and 0.34 ± 0 at 4 LPM; and 0.58 ± 0.01, 0.45 ± 0.01, and 0.40 ± 0 at 6 LPM [33].
Unlike previous models that measured the FiO2 in the lower airway, we measured the FiO2 at the carina. Lower measured FiO2 than estimated were found at all settings, which might have been due to differences in monitoring sites and the experimental design. By contrast, Gibson et al. reported that in healthy subjects with a percutaneously placed tracheal sensing catheter, the highest absolute inspired tracheal oxygen concentration with a nasal cannula was 23.6% at 3 LPM and 25.4% at 5 LPM during normal breathing (VT: 690 mL; RR: 17 breaths/min; minute ventilation (MV): 11 L/min; and peak inspiratory flow rate (PIFR): 37 L/min), 22.4% at 3 LPM and 23.8% at 5 LPM during quiet breathing (VT: 400 mL; RR: 16 breaths/min; MV: 6.4 L/min; and PIFR: 21 L/min), and 22.7% at 3 LPM and 25.2% at 5 LPM during hyperventilation (VT: 1400 mL; RR: 14 breaths/min; MV: 19.5 L/min; and PIFR: 63 L/min) [11]. Caille et al. used a cadaveric preparation to preserve upper airway patency; the measured FiO2 was 22.8 ± 0.6% and 31.2 ± 3.2% at oxygen flow rates of 1 and 3 LPM with a nasal cannula [34]. In another report, in patients with 97% oxygen supply via nasal cannula, the effective FiO2 was 22.8 ± 0.1%, 27.6 ± 0.5%, and 31.8 ± 0.5% during oxygen supply at 1, 3, and 5 LPM based on trachea sampling, respectively [33]. Our findings concur reasonably well with those data, but contrast with a previously published formula. However, FiO2 is difficult to measure in spontaneously breathing patients and is influenced by the heterogeneous ventilatory conditions observed in clinical practice. Furthermore, the oxygen flow rates higher than 4 LPM significantly disturbs a patient, causes irritation, and dries nasal mucosae. If required, an oxygen mask may be applied.
It is commonly believed that the effectiveness of low-flow oxygen supply systems is affected by the patient’s VT and inspiratory flow rate [1,2,3]. This conclusion is consistent with our results. A study by Chikata et al. reported that statistically significant changes in VT affected measured FiO2 at all flow levels: at 2 LPM and VT of 300, 500, and 700 mL, FiO2 was 0.37 ± 0.01, 0.32 ± 0 and 0.29 ± 0, respectively; and at 4 LPM, FiO2 was 0.45 ± 0.01, 0.39 ± 0.01, and 0.34 ± 0, respectively [33]. Various authors have reported decreasing FiO2 values when increasing MV and RR [9]. Gibson et al. reported that the air dilution effect of hyperventilation was evidenced by lower tracheal fractions compared with those of normal or quiet breathing [11]. Our data are consistent with previous studies demonstrating that changes in VT affect the measured oxygen concentration. This suggests that as VT increased (VT 700 mL) with a fixed RR in the normal, restrictive, and obstructive lung models, larger inspiratory flow rates were generated, more room air was inspired to the dilution of the oxygen concentration, and thus lower measurements of FiO2 were found.
Previous studies indicated that the FiO2 is affected by the RR, the inspiratory time, the presence of a reservoir from which entrainment occurs, and the presence of an expiratory pause [10,27]. The increase in FiO2 with increasing oxygen flow rates through an Ncan has been demonstrated in a mannequin model [29,32] and humans [7,11,24,35]. The study by Gibson et al., which used a nasal cannula for the administration of low-flow oxygen, resulted in only slight increases in tracheal oxygen concentration (23.6% at 3 LPM and 25.4% at 5 LPM). The air dilutional effect of hyperventilation was evidenced by lower tracheal fractions compared with those of normal or quiet breathing [11]. Our findings concur reasonably well with those data, but contrast with a published formula that would predict the FiO2 to be 32% at 3 LPM and 40% at 5 LPM. Zhou and Chatburn reported that inspiratory time and anatomic reservoir (AR) are key factors during nasal cannula therapy. As the frequency increases (due to either exercise or disease), the inspiratory time decreases from one second to 0.5 s, which in turn decreases FiO2 from 34% to 32%, referred to as the frequency effect. Patients with COPD (chronic obstruction pulmonary disease) often have non-zero expiratory flows when the next inspiratory effort is made (i.e., they have alveolar gas-trapping or long expiratory time); thus, end-expiratory flow could prohibit oxygen accumulating in the AR, in this case, decreasing FiO2 from 34% to 26% [27]. This refers to the reservoir effect. Sim [10] and O’Reilly [36] also demonstrated that decreased FiO2 was due to prevent AR during a stress breathing pattern in a mannequin model. In our experiments with different lung mechanical models (normal, restrictive, and obstructive), we also found that the breathing frequency increases, which in turn decreases FiO2; this suggests that frequency and prohibited AR effects should be considered during oxygen administration. A relatively low breathing rate resulted in more stability in measured FiO2 during the 3 and 5 LPM oxygen supply; therefore, we speculate that there is sufficient time to fill the oxygen flush in the AR during the zero expiratory flow and before the next inspiratory effort is made.
Our results show that the FiO2 measured at the carina by RR 20 breaths/min had a higher value compared with FiO2 measured by RR 10 and 30 breaths/min. This fascinating phenomenon of FiO2 variation at the conduction airway from nasal to carina during oxygen delivery is not easily observed in the clinic.
In our human-like anatomy model, while the breathing pattern with RR 10 breaths/min exhibited an FiO2 plateau on setting the oxygen flow rate from 3 to 5 LPM, presumably the longer expiratory time may have provided more time to mix oxygen and fresh air from the oral cavity, resulting in an increased FiO2 that was not obvious. The finding is similar to a clinical study of Nugent et al., which indicated that the RR factor can affect the FiO2 [36]. However, compared with normal (20 breaths/min) and higher (30 breaths/min) breathing rates, we demonstrated that an increased RR decreases the FiO2, which is related to insufficient oxygen filling time and reduces oxygen reservation in the airway. Thus, any variation in AR affects the composition of the next inspiration. In addition, a more decreased difference of measured FiO2 during high VT (700 mL) than during normal VT (500 mL) and low VT (300 mL) at different breathing rates suggests that the high inspiratory flow rate results in more room air dilution. This resembles the results of Wagstaff [32] and Sim [10], wherein a higher RR and shorter expiratory time led to the air dilution effect of FiO2 in the airway anatomic dead space and reduced oxygen reserves. The RR 20 breaths/min is a valuable reference during the use of nasal cannula, which suggests that RR 20 breaths/min provides an opportune time to mix inspired room air and oxygen in the AR space.
According to our calculations, the prediction formulas are suited to adult patients with normal lungs and those with restrictive or obstructive lung disease. Our study showed that VT and oxygen flow rate affect the measured FiO2 rather than RR. Therefore, we proposed equations for future clinical practice with nasal cannula oxygen therapy during spontaneous breathing. These equations are based on different lung mechanics, VT, and oxygen flow rates, and they will provide clinicians with a reference when using nasal cannula among patients with normal lungs and those with restrictive and obstructive lung disease.
Our results provide a salutary reminder about the variability of the FiO2 delivered via nasal cannula. When using the nasal cannula, clinicians must carefully consider the alveolar PO2 and the physiological shunt, based on the alveolar-arterial oxygen difference to decrease the risk of hypoxemia.
This study had several limitations. First, regarding our research design, we controlled the VT, RR, and inspiratory time using a simulating ventilator that differed from natural conditions. In addition, we did not consider the factors of open or closed mouth breathing, although the oxygen concentration was influenced by the reservoir space (oral cavity), and the rebreathing phenomenon of CO2 in the low oxygen supply flow. Additionally, the necessity of humidified oxygen for patients should take into consideration the effect of the oxygen concentration of water vapor.
Second, a previous study demonstrated that a larger inspiratory flow rate consequently lowered the measured FiO2 because of the higher amount of inspired room air dilution [11]. However, we did not measure the inspiratory peak flow in our experiment, which is a limitation of our research. Third, measurement of FiO2 was affected by the shunt and dead space during ventilation of the restrictive and obstructive lung disease models. Obviously, a mannequin model cannot simulate this complexity, which is a limitation of our study.

5. Conclusions

Since room air dilution was an unavoidable situation in low-flow oxygen therapy and the apparatus dead space varied between devices, it was necessary to estimate the FiO2 value to assure one device brought up the oxygen concentration. The data obtained suggest that the actual inspired percentage of oxygen reaching the trachea is never as high in spontaneously breathing patients as that estimated. According to our observations, the VT and oxygen flow rate had a substantial impact on the FiO2 and can therefore lead to over or under oxygenation without careful monitoring. Our experiment proposed a prediction formula regarding various lung mechanics and respiratory patterns that considers oxygen flow rate and VT for clinical application.
Although our result provides a salutary reminder about the variability of the FiO2 delivered via nasal cannula, when using the nasal cannula, clinicians must carefully consider the alveolar PO2 and the physiological shunt, based on the alveolar-arterial oxygen difference, to decrease the risk of the hypoxemia.

Author Contributions

Conceptualization, H.-Y.T. and S.-H.Y.; data curation, H.-Y.T. and S.-H.Y.; investigation, H.-Y.T.; methodology, H.-Y.T. and S.-H.Y.; resources, S.-H.Y. and H.-S.C.; supervision, H.-S.C.; validation, H.-Y.T., S.-H.Y., and H.-S.C.; visualization, S.-H.Y.; writing—original draft, H.-Y.T.; writing—review and editing, S.-H.Y. and H.-S.C. All authors have read and agreed to the published version of the manuscript.

Funding

This research received no external funding.

Institutional Review Board Statement

Not applicable.

Informed Consent Statement

Not applicable.

Data Availability Statement

Not applicable.

Acknowledgments

We thank Fang Jung (Department of Respiratory Therapy, FU-Jen Catholic University, New Taipei City, Taiwan) for model design, and Hui-Ling Lin (Department of Respiratory Therapy, Chang Gung University, Taoyuan City, Taiwan) for technical support.

Conflicts of Interest

The authors have disclosed no conflict of interest. This study was independently conducted without financial grants from any group or institution.

References

  1. Hess, D.R.; Macintyre, N.R.; Galvin, W.F. Respiratory Care: Principles and Practice, 3rd ed.; Jones & Bartlett Learning: Sudbury, MA, USA, 2016. [Google Scholar]
  2. Kacmarek, R.M.; Stoller, J.K.; Heuer, A.J. Egan’s Fundamentals of Respiratory Care, 11th ed.; Mosby: St. Louis, MO, USA, 2016. [Google Scholar]
  3. Cairo, J.M. Mosby’s Respiratory Care Equipment, 9th ed.; Mosby: St. Louis, MO, USA, 2013. [Google Scholar]
  4. O’Driscoll, B.R.; Howard, L.S.; Earis, J.; Mak, V. BTS guideline for oxygen use in adults in healthcare and emergency settings. Thorax 2017, 72 (Suppl. 1), ii1–ii90. [Google Scholar] [CrossRef] [Green Version]
  5. Chu, D.K.; Kim, L.H.-Y.; Young, P.J.; Zamiri, N.; Almenawer, S.A.; Jaeschke, R.; Szczeklik, W.; Schünemann, H.J.; Neary, J.D.; Alhazzani, W. Mortality and morbidity in acutely ill adults treated with liberal versus conservative oxygen therapy (IOTA): A systematic review and meta-analysis. Lancet 2018, 391, 1693–1705. [Google Scholar] [CrossRef]
  6. Leigh, J.M. Variation in performance of oxygen therapy devices. Towards the rational employment of ‘The dephlogisticated air described by Priestley’. Ann. R. Coll. Surg. Engl. 1973, 52, 234–253. [Google Scholar] [PubMed]
  7. Bazuaye, E.A.; Stone, T.N.; Corris, P.A.; Gibson, G.J. Variability of inspired oxygen concentration with nasal cannulas. Thorax 1992, 47, 609–611. [Google Scholar] [CrossRef] [Green Version]
  8. Davies, R.J.; Hopkin, J.M. Variability of inspired oxygen concentration with nasal cannulas. Thorax 1992, 47, 1086. [Google Scholar] [CrossRef] [PubMed] [Green Version]
  9. Ooi, R.; Joshi, P.; Soni, N. An evaluation of oxygen delivery using nasal prongs. Anaesthesia 1992, 47, 591–593. [Google Scholar] [CrossRef] [PubMed]
  10. Sim, M.A.B.; Dean, P.; Kinsella, J.; Black, R.; Carter, R.; Hughes, M. Performance of oxygen delivery devices when the breathing pattern of respiratory failure is simulated*. Anaesthesia 2008, 63, 938–940. [Google Scholar] [CrossRef] [PubMed]
  11. Gibson, R.L.; Comer, P.B.; Beckham, R.W.; McGraw, C.P. Actual Tracheal Oxygen Concentrations with Commonly Used Oxygen Equipment. Anesthesiology 1976, 44, 71–73. [Google Scholar] [CrossRef]
  12. McDonald, C.F. Low-flow oxygen: How much is your patient really getting? Respirology 2014, 19, 469–470. [Google Scholar] [CrossRef] [PubMed] [Green Version]
  13. Yamamoto, N.; Miyashita, T.; Takaki, S.; Goto, T. Effects of Breathing Pattern on Oxygen Delivery Via a Nasal or Pharyngeal Cannula. Respir. Care 2015, 60, 1804–1809. [Google Scholar] [CrossRef] [Green Version]
  14. Nishimura, M. High-Flow Nasal Cannula Oxygen Therapy in Adults: Physiological Benefits, Indication, Clinical Benefits, and Adverse Effects. Respir. Care 2016, 61, 529–541. [Google Scholar] [CrossRef] [PubMed] [Green Version]
  15. Ware, L.B.; Matthay, M.A. The acute respiratory distress syndrome. N. Engl. J. Med. 2000, 342, 1334–1349. [Google Scholar] [CrossRef] [PubMed]
  16. Nava, S.; Larovere, M.T.; Fanfulla, F.; Navalesi, P.; Delmastro, M.; Mortara, A. Orthopnea and inspiratory effort in chronic heart failure patients. Respir. Med. 2003, 97, 647–653. [Google Scholar] [CrossRef] [Green Version]
  17. Poletti, V.; Tomassetti, S.; Ravaglia, C. Idiopathic pulmonary fibrosis. N. Engl. J. Med. 2018, 379, 795–798. [Google Scholar]
  18. Branson, R.D. Oxygen Therapy in COPD. Respir. Care 2018, 63, 734–748. [Google Scholar] [CrossRef] [Green Version]
  19. Pavlov, N.; Haynes, A.G.; Stucki, A.; Jüni, P.; Ott, S.R. Long-term oxygen therapy in COPD patients: Population-based cohort study on mortality. Int. J. Chronic Obstr. Pulm. Dis. 2018, 13, 979–988. [Google Scholar] [CrossRef] [PubMed] [Green Version]
  20. Iyer, V.N. Low-dose oxygen therapy in copd patients: Are there any radiation-like risks? Curr. Opin. Pulm. Med. 2018, 24, 187–190. [Google Scholar] [CrossRef] [PubMed]
  21. Inwald, D.; Roland, M.; Kuitert, L.; McKenzie, S.A.; Petros, A. Oxygen treatment for acute severe asthma. BMJ 2001, 323, 98–100. [Google Scholar] [CrossRef] [Green Version]
  22. Tokuda, Y.; Miyagi, S. Oxygen treatment for acute severe asthma. Home oxygenation would be more effective. BMJ 2001, 323, 1069. [Google Scholar] [CrossRef] [PubMed]
  23. Schacter, E.N.; Littner, M.R.; Luddy, P.; Beck, G.J. Monitoring of oxygen delivery systems in clinical practice. Crit. Care Med. 1980, 8, 405–409. [Google Scholar] [CrossRef]
  24. Waldau, T.; Larsen, V.H.; Bonde, J. Evaluation of five oxygen delivery devices in spontaneously breathing subjects by oxygraphy. Anaesthesia 1998, 53, 256–263. [Google Scholar] [CrossRef] [Green Version]
  25. Wettstein, R.B.; Shelledy, D.C.; Peters, J.I. Delivered oxygen concentrations using low-flow and high-flow nasal cannulas. Respir. Care 2005, 50, 604–609. [Google Scholar] [PubMed]
  26. Duprez, F.; Mashayekhi, S.; Cuvelier, G.; Legrand, A.; Reychler, G. A New Formula for Predicting the Fraction of Delivered Oxygen During Low-Flow Oxygen Therapy. Respir. Care 2018, 63, 1528–1534. [Google Scholar] [CrossRef] [PubMed] [Green Version]
  27. Zhou, S.; Chatburn, R.L. Effect of the Anatomic Reservoir on Low-Flow Oxygen Delivery Via Nasal Cannula: Constant Flow Versus Pulse Flow With Portable Oxygen Concentrator. Respir. Care 2014, 59, 1199–1209. [Google Scholar] [CrossRef] [Green Version]
  28. Baboi, L.; Subtil, F.; Guérin, C. A bench evaluation of fraction of oxygen in air delivery and tidal volume accuracy in home care ventilators available for hospital use. J. Thorac. Dis. 2016, 8, 3639–3647. [Google Scholar] [CrossRef] [Green Version]
  29. Hsu, W.-C.; Orr, J.; Lin, S.-P.; Yu, L.; Tsou, M.-Y.; Westenskow, D.R.; Ting, C.-K. Efficiency of oxygen delivery through different oxygen entrainment devices during sedation under low oxygen flow rate: A bench study. J. Clin. Monit. 2017, 32, 519–525. [Google Scholar] [CrossRef] [PubMed]
  30. Arnal, J.-M.; Garnero, A.; Saoli, M.; Chatburn, R.L. Parameters for Simulation of Adult Subjects During Mechanical Ventilation. Respir. Care 2018, 63, 158–168. [Google Scholar] [CrossRef] [PubMed] [Green Version]
  31. Ward, J.J. High-Flow Oxygen Administration by Nasal Cannula for Adult and Perinatal Patients. Respir. Care 2012, 58, 98–122. [Google Scholar] [CrossRef] [Green Version]
  32. Wagstaff, T.A.J.; Soni, N. Performance of six types of oxygen delivery devices at varying respiratory rates*. Anaesthesia 2007, 62, 492–503. [Google Scholar] [CrossRef] [PubMed]
  33. Chikata, Y.; Onodera, M.; Oto, J.; Nishimura, M. FiO2 in an adult model simulating high-flow nasal cannula therapy. Respir. Care 2017, 62, 193–198. [Google Scholar] [CrossRef]
  34. Caille, V.; Ehrmann, S.; Boissinot, E.; Perrotin, D.; Diot, P.; Dequin, P.-F. Influence of Jet Nebulization and Oxygen Delivery on the Fraction of Inspired Oxygen: An Experimental Model. J. Aerosol Med. Pulm. Drug Deliv. 2009, 22, 255–261. [Google Scholar] [CrossRef] [PubMed]
  35. Markovitz, G.H.; Colthurst, J.; Storer, T.W.; Cooper, C.B. Effective inspired oxygen concentration measured via transtracheal and oral gas analysis. Respir. Care 2010, 55, 453–459. [Google Scholar] [PubMed]
  36. O’Reilly-Nugent, A.; Kelly, P.T.; Stanton, J.; Swanney, M.P.; Graham, B.; Beckert, L. Measurement of oxygen concentration delivered via nasal cannulae by tracheal sampling. Respirology 2014, 19, 538–543. [Google Scholar] [CrossRef] [PubMed] [Green Version]
Figure 1. Experimental apparatus of the test lung model. (A) driving bellow; (B) ventilation bellow; (C) expiratory gas modification bellow was constructed.
Healthcare 09 01235 g001
Figure 2. Effect of tidal volume (VT) on inspiratory driving pressure.
Healthcare 09 01235 g002
Figure 3. Effect of tidal volume (VT) on FiO2. (a,d,g) RR: 10 breaths/min.; (b,e,h) RR: 20 breaths/min.; (c,f,i) RR: 30 breaths/min.
Healthcare 09 01235 g003
Figure 4. Effect of respiratory rate (RR) on FiO2. (a,d,g) VT: 300 mL.; (b,e,h) VT: 500 mL.; (c,f,i) VT: 700 mL.
Healthcare 09 01235 g004
Table 1. Multiple Linear Regression Analysis Predicting the measured FiO2.
ModelsVariables Standardized β Coefficientst Value bp ValueCollinearity Statistics
ToleranceVIF
NormalConstant24.181 44.682
O2 flow rate 0.75313.758 **<0.0011.0001.000
VT −0.447−8.164 **<0.0011.0001.000
RR 0.0370.5030.1611.0001.000
RestrictiveConstant23.857 45.642
O2 flow rate 0.76813.665 **<0.0011.0001.000
VT −0.405−7.208 **<0.0011.0001.000
RR 0.0851.1820.2411.0001.000
ObstructiveConstant23.680 46.112
O2 flow rate 0.76913.790 **<0.0011.0001.000
VT −0.406−7.282 **<0.0011.0001.000
RR −1.0000.3201.0001.000
b Calculated from t distribution. ** p < 0.001.
Publisher’s Note: MDPI stays neutral with regard to jurisdictional claims in published maps and institutional affiliations.

