1. Introduction
The current COVID-19 global pandemic spreading from the initial outbreak in Wuhan, China, in December 2019 still poses threat to many regions of the world including those that have apparently peaked [
1]. As of early September 2021, there have been over 4,638,800 deaths related to COVID-19 globally [
2]. Data collected from across the world suggest that the overall case fatality rate is approximately 6%, ranging between 0.55–14.6% across individual countries [
3]. Many countries have adopted various lockdown measures and several public health policies to prevent the spread of COVID-19. The United Kingdom, for example, has implemented a strict stay at home policy [
4], closing non-essential shops [
4], stopping all large social gatherings [
4], closing pubs, cafés, restaurants and bars [
5] and closing school to almost all children [
6], among other measures.
With different types of restrictions being implemented across the world, it is vitally important to assess the effectiveness of the different responses individually and cumulatively. This will allow better understanding of the relationship between these public health policies and relevant outcomes that indicate the severity of the first wave of the pandemic from different dimensions. By doing so, they may be reviewed and revised during current and potential future waves of the COVID-19 pandemic and for future pandemics. To allow comparisons between restrictions imposed by different governments in response to COVID-19, the Blavatnik School of Government of the University of Oxford has developed the Oxford COVID-19 Government Response Tracker (OxCGRT); a platform which collates information across 17 indicators to provide degrees of restriction [
7]. They have proposed the Stringency Index (SI) as a tool to allow for day-to-day and between-country comparisons of lockdown measures which aim to reduce civilian activity and social contact [
7]. Whether these measures have effect beyond peak spread (and thus deaths) of the pandemic is important to discern in order to help guide future public health policy making.
In this study, we aim to add to the literature by determining the relationship between policy indicators including the stringency index score, and the severity of the first wave of the COVID-19 pandemic using a profiling approach (several outcomes which form the shape of pandemic curve). Thus we not only consider the peak of the first wave of the epidemic curve, but also evolution after the peak, the combination of which provides a better global assessment of the effectiveness of these public health policies.
2. Materials and Methods
We used an ecological study design to assess the relationship between policy indicators and their respective stringency index on several outcomes that form the epidemic curve; the mean mortality rate during the rising phase of the curve defined as the mean slope of the mean mortality curve till current peak, time to peak, peak deaths per 100,000 population, cumulative deaths after peak per 100,000 population and the ratio of the mean slope of the descending curve to the mean slope of the ascending curve. We hypothesised that the effectiveness of individual public health policies are unlikely to be “one size fit for all”. Therefore, each analysis was stratified according to age (younger and older populations), income (low- and high-income countries) and region (European and non-European countries), respectively. Due to the ecological study design and the use of publicly accessible data, ethical approval was not required.
2.1. Selection of Countries
A total of 22 countries in which the pandemic had reached its peak and which had reported at least 25 daily deaths up till the 31 May 2020 were analysed. These countries included Algeria, Austria, Belgium, Canada, Ecuador, France, Germany, Hungary, Iran, Ireland, Italy, Japan, The Netherlands, Poland, Portugal, Romania, Spain, Sweden, Switzerland, Turkey, UK and the USA.
2.2. Definitions of Outcomes, Policy Measures and Stratification Measures
2.2.1. Outcomes
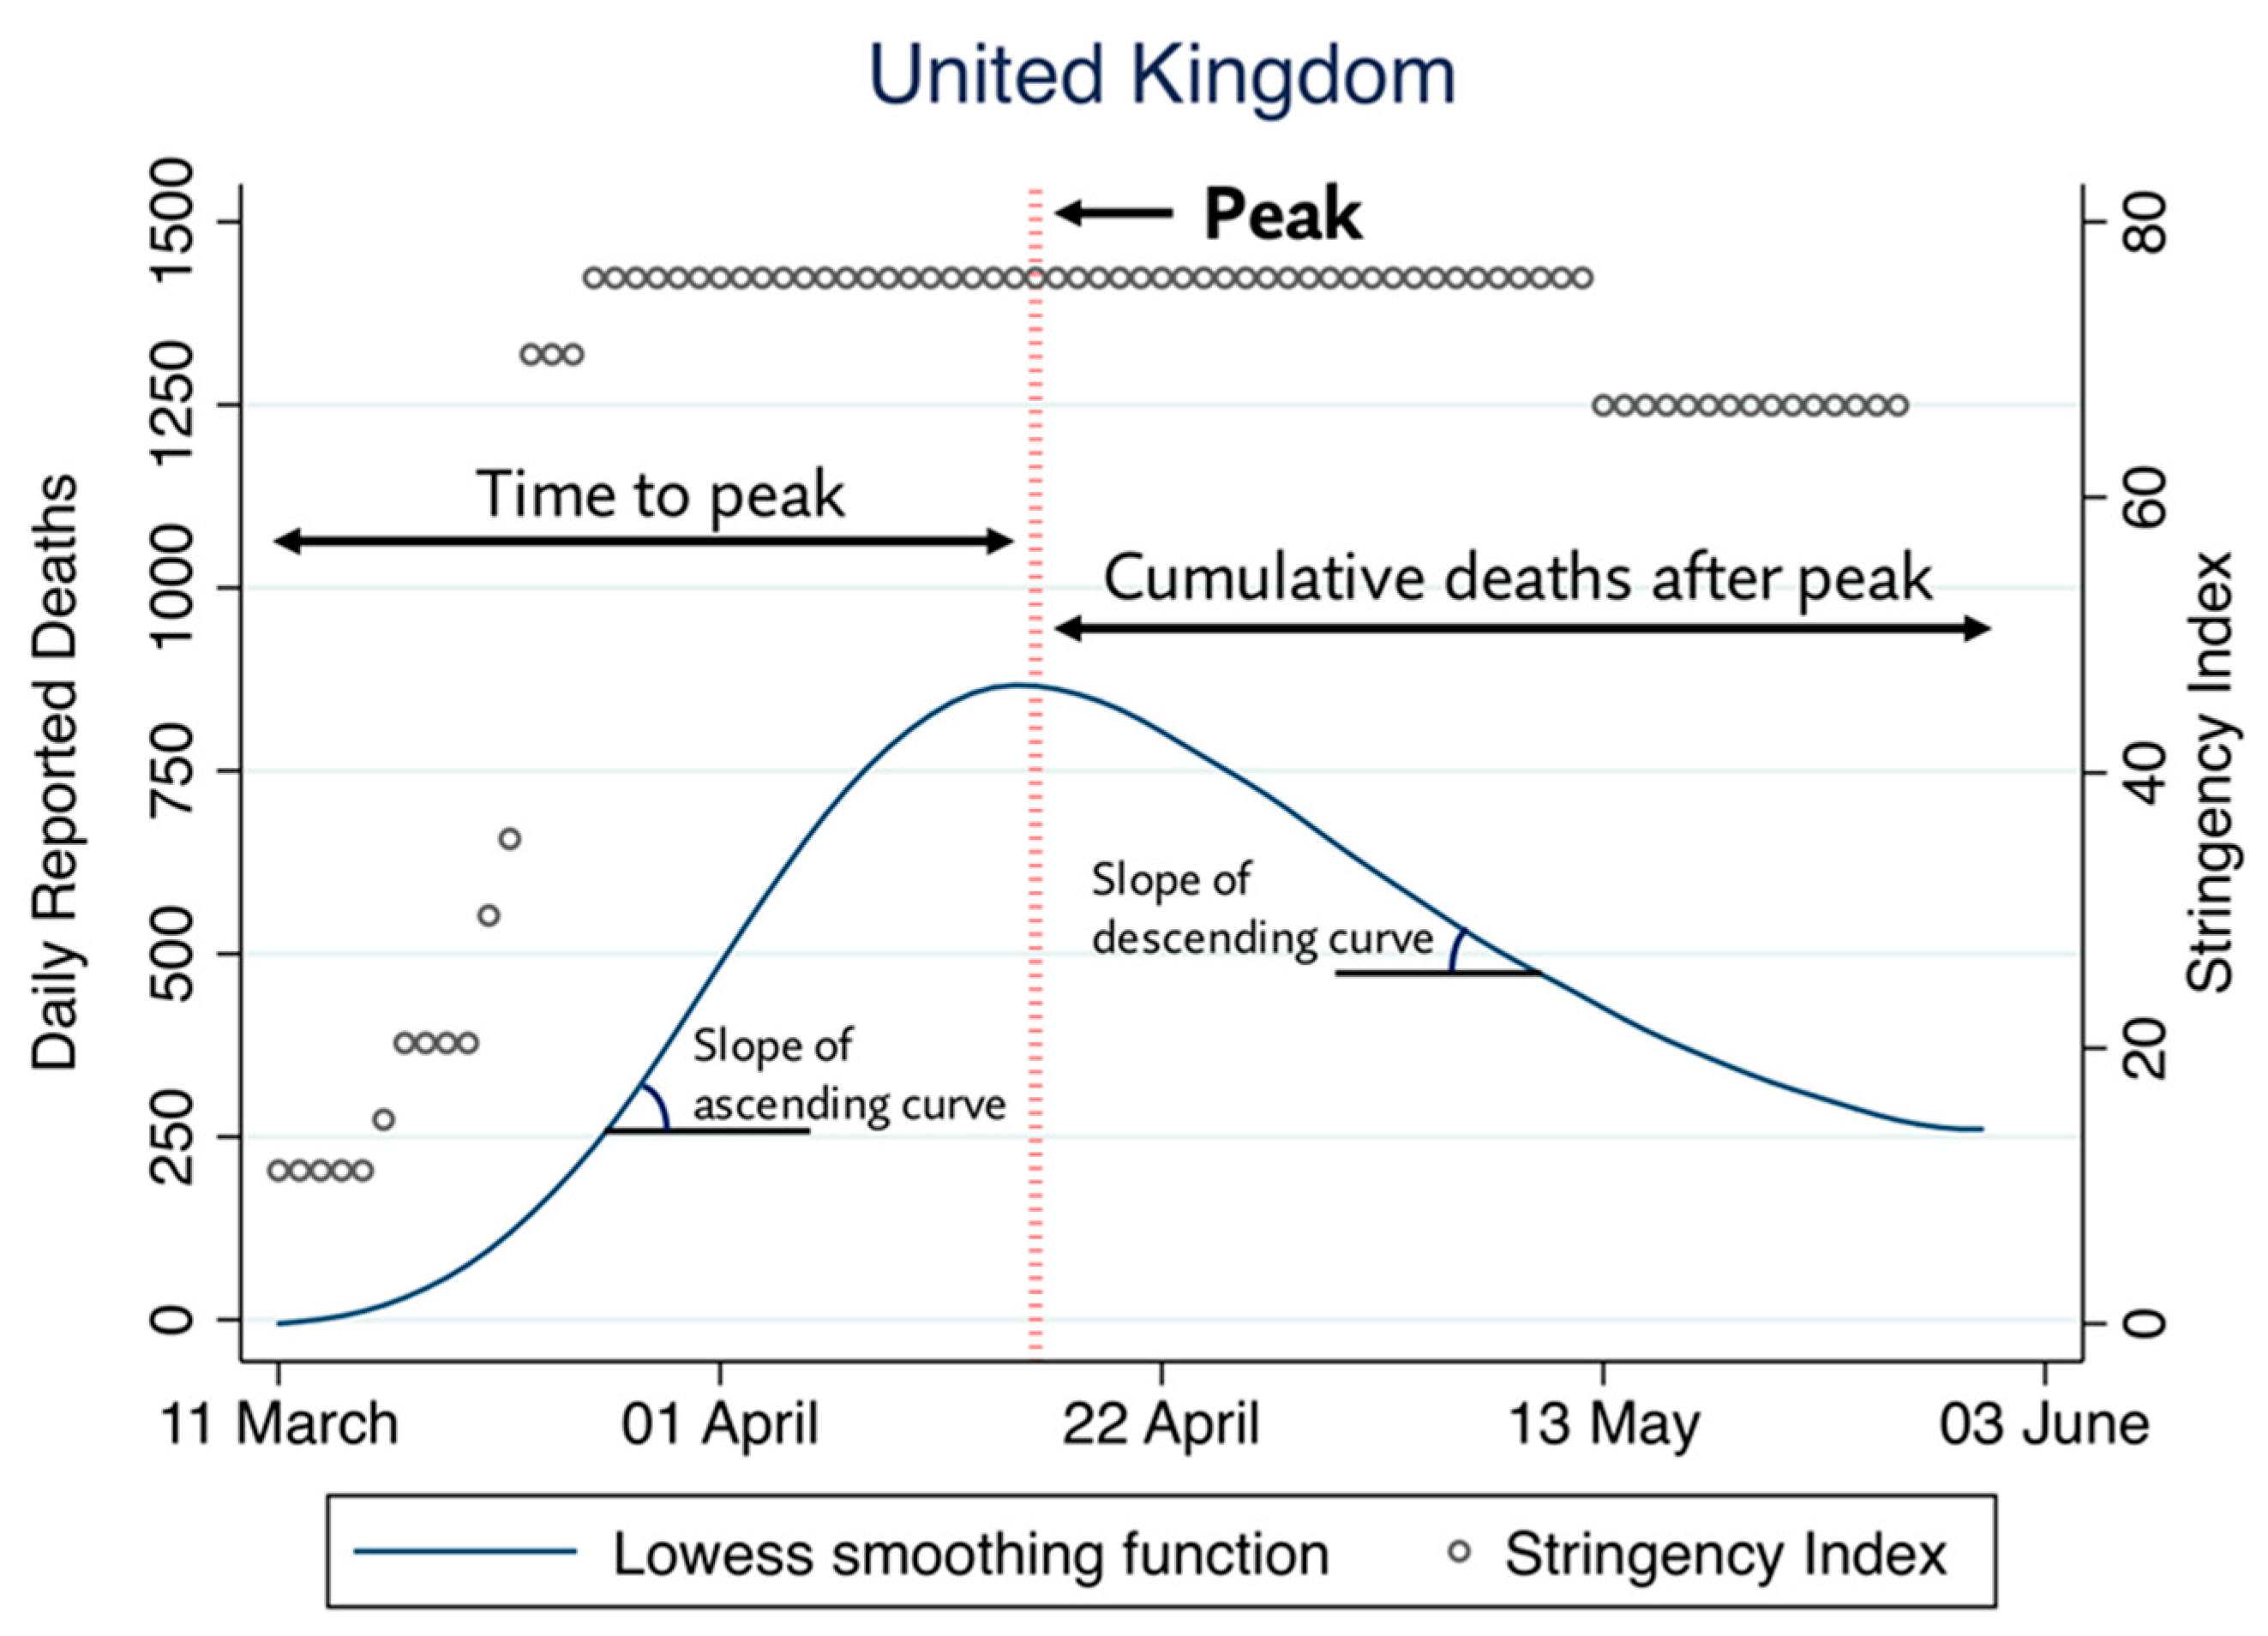
Several parameters of the first wave of the COVID-19 mortality curve were utilised to quantify the severity of the pandemic as well as the evolution of the pandemic after its peak. The severity of the pandemic was quantified using the following measures: (i) the mean mortality rate (ii) time to peak and (iii) the peak number of deaths per 100,000 population. The favourability of the pandemic course after the mortality peaked was quantified using: (i) the cumulative number of deaths recorded after peak, standardised per 100,000 population and (ii) the ratio between the mean slopes of the descending and ascending segments of the mortality curve. The definitions for each of these outcome measures have been listed in
Table 1.
All the outcomes were derived from a smoothed mortality curve, obtained by the application of a locally weighted (Lowess) regression using a bandwidth of 0.4 on the raw daily mortality data reported by the World Health Organisation [
1]. The peak of the mortality curve was defined as the point at which the first derivate of the Lowess regression line became null.
Figure 1 details the derivation of each parameter from the daily mortality data, exemplified using the data from the United Kingdom.
2.2.2. Exposure: Policy Indicators and the Stringency Index
The Oxford COVID-19 Government Response Tacker (OxCGRT) systematically collects data on various public health-related government policies which have been established due to the COVID-19 pandemic [
7]. In this case, 17 indicators have been described. These include eight containment and closure indicators (C1: school closures, C2: workplace closures, C3: cancelling of public events, C4: restrictions on gathering size, C5: closing public transport, C6: stay at home requirements, C7: restrictions on internal movement, C8: restrictions on international travel), four economic response indicators (E1: income support, E2: debt contract/relief for households, E3: fiscal measures, E4: giving international support) and five health systems indicators (H1: public information campaigns, H2: testing policy, H3: contact tracing, H4: emergency investment in healthcare, H5: investment in COVID-19 vaccines) [
8]. All indicators are measured using a simple ordinal scale except for five (E3, E4, H4, H5 and M1). Indicators E3, E4, H4 and H5 were numeric and numeric indicators were typically measured in the value United States Dollar (USD) and M1 represents a miscellaneous indicator which included free text data [
8]. Indicators (e.g., stay at home requirements) are assigned a score (e.g., 0–3) based upon the strictness of each policy. A total stringency index has been calculated using only policy indicators (C1–C8 and H1). Details of the approach to scoring of indicators and formulae for calculation of the stringency index has been previously described [
9].
For the analyses evaluating the mean mortality rate, time to peak and the number of peak deaths per 100,000 population, the mean SI and its indicators were calculated for each of the 22 countries from the first day when more than 2 COVID-19 deaths were reported until two weeks before the peak of the mortality curve. For the analyses evaluating the cumulative number of deaths after the pandemic peak as well as the slope of the descending mortality curve, the mean SI and its indicators were calculated for each country from the first day when more than 2 COVID-19 deaths were reported until the 17 May 2020 (2 weeks before the end of the study period). A two-week delay between the exposure and the measured outcomes from starting point to end point was implemented to allow for these restrictions to have an effect.
Data used for the stratification of analyses were collected from publicly accessible resources. The median population age was extracted from the United Nations World Population Prospects [
10]. Country income data were extracted as GDP per capita by Purchasing Power Parity (PPP) in current international dollars in the year 2018, from the World Bank [
11].
2.3. Statistical Analysis
All analyses were performed in Stata 15.1SE, Stata Statistical Software. A 5% threshold of statistical significance was utilised for all analyses (p < 0.05). Spearman rank-order correlation coefficients were computed to measure the strength of association between eligible policy indicators and SI against each of the five outcomes. Results were stratified by the median value of the median country age (42.133) into those with younger (Belgium, Canada, Algeria, Ecuador, the United Kingdom, Ireland, Iran, Poland, Sweden, Turkey and the United States) and older populations (Austria, Switzerland, Germany, Spain, France, Hungary, Italy, Japan, the Netherlands, Portugal and Romania). Stratification was also performed by median country GDP per capita as cut off point ($45,342) into low- (Algeria, Ecuador, Spain, France, Hungary, Iran, Italy, Japan, Poland, Portugal, Romania and Turkey) and high-income countries (Austria, Belgium, Canada, Switzerland, Germany, the United Kingdom, Ireland, the Netherlands, Sweden and the United States) as well as European (Austria, Belgium, Switzerland, Germany, Spain, France, the United Kingdom, Hungary, Ireland, Italy, The Netherlands, Poland, Portugal, Romania and Switzerland) and non-European countries (Canada, Algeria, Ecuador, Iran, Japan, Turkey, the United States). All outcomes were transformed using a natural logarithm prior to analysis.
4. Discussion
In this study evaluating the association between government-led public health policies and the severity of the first wave of the COVID-19 pandemic using profiling approach, we found that containment and closure policies were generally effective in younger populations and high-income countries, and debt/contract relief in older populations. Similarly, containment and closure policies were generally associated with good outcomes in European countries, whereas in non-European countries, school closures alone had the most favourable association with several outcomes. Moreover, health system policies did not appear to be associated with better outcomes in low-income countries, in contrast to high-income countries, where policies for testing were generally effective, along with closure and containment measures. To the best of our knowledge, this is one of few studies evaluating the association of different government policies on a number of different outcome measures that form the components of the first wave of the COVID-19 pandemic severity.
In a recent nationwide preprint study assessing the impact of lockdown measures on COVID-19 mortality and case numbers, the authors found that early introduction for every government policy with the exception of testing policy, contact tracing and workplace closures, was associated with reduced mortality and case numbers [
12]. They noted that the size of effect of introducing such measures at an early stage, such as school closure policies being implemented 24 days earlier, was associated with halving of the mortality as of the 29 April 2020 [
12]. Similarly, our analysis showed limited benefit of contact tracing and testing policy, though some benefit was seen in high-income countries. This finding may reflect that high-income countries are better equipped with specialised diagnostic facilities and have access to formal healthcare systems [
13]. Yet, despite this apparent advantage, it should also be appreciated that the formation of a successful contact tracing programme is likely more complex than solely having access to high-quality resources, and many other factors may come into play, for example, the ability to install and maintain adequate organisational and leadership approaches. This may explain the observation that, indeed not all high-income countries were in fact successful with regards to their contact tracing [
14].
Moreover, a study with data compiled from 1717 local, regional and national non-pharmaceutical interventions deployed across China, South Korea, Italy, Iran, France and the United States (US) found that anti-contagion policies have significantly slowed the growth rate of COVID-19 infections [
15]. They estimated that in the absence of such policy actions, early infections of COVID-19 exhibit exponential growth rates of roughly 38% per day [
15].
Undoubtedly, there is evidence to support the beneficial impact of such policies on public health [
12,
15,
16,
17,
18] and the timing at which these policies are introduced are important [
12,
15]. However, some policies can be more effective than others, and tailoring these measures with knowledge of population characteristics may allow for more tactful intervention.
In younger populations, we observed that containment and closure policies, in particular school closures and cancellation of public events, had the most statistically significant associations with good outcomes, rather than economic and health policies. A systematic review on school closure and management practices during coronavirus outbreaks reported limited and inconsistent results in the literature on the effectiveness of school closures during previous coronavirus outbreaks, such as SARS [
19]. However, they reported that recent modelling studies of COVID-19 predict that school closures alone would prevent 2–4% of deaths [
19]. Nevertheless, the role of children in the transmission of COVID-19 is still to be elucidated [
20] and in contrast with Influenza where children appear to be a key source of transmission, children are more likely to have milder or asymptomatic forms of COVID-19 and are less likely to transmit the disease whilst coughing or sneezing, despite having comparable infection rates to adults [
19].
A strong association was found with regards to cancellation of public events and lower peak deaths per 100,000 in the stratification of countries with a younger median age, and this may mirror the fact that younger age groups are more likely to be involved in public gatherings and mass events. A preprint study from Japan reported that to control COVID-19 outbreak, voluntary event cancellations took place from 26 of February to 11 of March where sports and entertainment events were cancelled [
21]. The authors found that such measures can reduce COVID-19 infectiousness by 35% but the reproduction number remains higher than one [
21].
We also found that contact tracing was positively associated with peak deaths per 100,000 in countries with a younger median age population. It could be plausible that this finding may be attributable to reverse causation, where contact tracing measures have subsequently heightened following government alerting of increasing COVID-19 deaths.
Among health system policies, we found that investment in vaccines was positively associated with mean mortality rates in countries stratified according to older median age. This policy relates to announced public spending on vaccine development [
8]. Given that there was no available vaccine during this time, the expenditure in this domain by governments may still necessitate time to allow its benefits in the long-run to be observed. Additionally, in non-European countries, we observed that testing policy had the strongest positive association with peak deaths per 100,000. The testing policy indicator describes who can be tested in a country. Thus, in countries where testing was extensively performed, such as publicly available testing, a higher number of COVID-19 related deaths may have consequently been recorded.
Strengths and Limitations
The main strength of this study is the use of various outcome measures to assess the severity of the pandemic and its evolution after peak, which provides a broader picture of pandemic severity (using a profiling approach), compared to solely using mere mortality peak/rates. Whilst outcome measures such as death rates and case fatality rates may be difficult to compare because of differences in testing rates across countries and true counts of actual deaths, we utilised the mean slope of the mortality curve amongst other parameters which allows for more comparable measures.
This study has some limitations. Whilst daily mortality data were extracted from a reputable source (World Health Organization), we appreciate that deaths may be underreported, particularly if occurring out with hospitals. Whilst we have utilised all policy indictors recorded by the Blavatnik school of Government to be considered in our analysis, data on important public health measures such as the use of personal protective equipment (PPE) including usage of face masks, were not available. However, due to the timing of our study which covered the early phase of the pandemic, countries such as the UK still followed strict stay at home requirements which could make measuring the true effects of PPE usage in public spaces more difficult to determine. Additionally, government policies may be placed into effect in rapid succession and thus true independent associations between a policy measure and outcome may be difficult to disentangle. It is also important to acknowledge that much of public health and disease prevention occurs at the local level [
15,
22]. Therefore, the effect of local and regional policies on managing the COVID-19 pandemic in different countries may be overlooked, given the national scope of the data used in the analysis. It is therefore likely that greater inclusion and awareness of local health policies would play a major role in mitigating spread of COVID-19. By setting eligibility criteria to only include countries with at least 25 COVID-related deaths our sample size was modest. Further, this research followed an ecological study design and the limitations and biases conforming to the nature of such study designs must be acknowledged. We cannot exclude the ecological fallacy nor reverse causation, and it is important to note that at best, our results are only hypothesis generating. Moreover, it must be acknowledged that significant variance may exist within the stratification groups for age and income groups.


 ,
, 


