Abstract
Social support has been demonstrated to be associated with the health status of old adults, but no study has clarified the relationship between social support, morbidities and self-rated health among the migrant elderly following children (MEFC) to new cities. This study aimed to explore the effect of social support and morbidities on self-rated health among MEFC to Jinan, China. A total of 656 MEFC were included in this study by using multi-stage cluster random sampling. Social support was measured by the Social Support Rating Scale. Correlation analysis and multivariable logistic regression analysis were employed to clarify the association between social support, morbidities and self-rated health among the MEFC. Approximately 75.9% of the MEFC rated their health as good. Logistic regression analysis showed that MEFC who lived with family were more likely to have a higher level of self-rated health. In addition to social support, body mass index (BMI), monthly income, one-year living style, the presence of an elevator, heart disease, stroke, duration of chronic disease, and outpatient service attendance were also associated with the self-rated health of MEFC. Social support and morbidities were significantly associated with self-rated health among MEFC. Targeted policies should be made to improve social support status and lower the morbidities in MEFC.
1. Introduction
The aging of China’s population has accelerated since the 1990s. By 2040, people aged 65 and over are expected to make up more than 20% of the population in China [1]. Many people have moved to big cities in recent decades to seek opportunities for work and study [2]. Moreover, population migration in China has shown a family-tied flow as more elderly migrated from their hometowns to new cities. As a group derived from rapid social transformation in modern China, the migrant elderly are a unique population. The number of Chinese elderly people moving to cities increased sharply after 2000, from 5.03 million in 2000 to 13.04 million in 2015 (an average annual growth rate of 6.6%) [3]. As these elderly people moved to unfamiliar places, they faced new challenges to their health. Different from local elderly, migrant elderly generally have low socioeconomic status and cannot enjoy the same social benefits as local residents; they are also less likely to have access to comprehensive health care [4]. Most migrant elderly are less willing to seek medical care, which could be detrimental to their physical and mental health and cause a range of health problems [5]. Compared with the local elderly, the MEFC are far away from their hometown, and their social network and social supports become weaker [6]. They are more likely to solve problems by themselves than to ask for help. From the perspective of social communication, there is less communication between the MEFC and the local elderly, showing a state of alienation. Therefore, social support could have an impact on the communication of the MEFC with the outside, and then affect their physical and mental health [7,8]. Consequently, the effect of social support and morbidities on the health of MFEC deserves close attention [9].
Social support refers to the communication and contact between individuals and others for the purpose of obtaining information and comfort [10]. Xiao Shuiyuan believed that social support includes subjective support, objective support, and the degree of support utilization [11]. Although different scholars have different definitions and measurement standards for social support, the concept is generally related to the social functioning and health status of an individual. Social support could help old adults to cope with various life changes and adverse circumstances, especially when they encounter physical and mental problems [12]. Some previous studies found that social networks play an important role in the elderly’s access to psychosocial care, and support of the MEFC mainly comes from their social network [13,14]. A complex relationship between social support, marital status, and mental health in later life was found. Specifically, social support and marriage were protective factors for mental health [15]. Long Thanh Giang’s study among elderly Vietnamese men and women found that social support and social networks were positively correlated with self-rated health [16]. Padmore Adusei Amoah explored the relationship between health literacy, social support, and self-reported health among young and older Ghanaians, and the results showed that social support changed health literacy and self-rated health among young and elderly people to different degrees and in different ways [17].
Previous studies had explored the relationship between morbidities and self-rated health. Anthony V. Perruccio [18] investigated the health burden of chronic diseases and found that the association of comorbidity and individual self-reported health was greater than that of morbidities alone. A study in Russia revealed that groups with multiple chronic diseases were at higher self-rated health risk, and new disease patterns posed serious challenges to health systems [19]. Through clarifying residents’ self-rated health status and its influencing factors, Zhu Lele [20] found that the possibility of self-rated health without a family history of chronic diseases was 1.775 times higher than that of people with more than two family histories of chronic diseases. Wang Xuan [21] explored the relationship between chronic disease and self-rated health and found that chronic disease was a key factor affecting residents’ self-rated health.
In China, there are some studies that have explored the relationship between social support and the health status of the migrant elderly. Most of the migrant elderly have problems with reduced social and recreational activities, and interpersonal communication. Social support could help old adults integrate into their families and communities, and enhance their life satisfaction [22]. Duan Liangxia found that the social support of the migrant elderly was mainly informal; their family members played a core role in the support network of the migrant elderly. However, household registration has become an obstacle for the migrant elderly seeking to obtain community resources [23]. Cui Lijuan found that the support of social institutions had the greatest impact on the life satisfaction of the migrant elderly, and the psychological needs of the migrant elderly in terms of social communication could be met by improving community functions [24]. Tong Xiaojuan advocated improving social support for the migrant elderly from rural areas by improving medical insurance policies, cultivating their ability to participate in the community, expanding community service, and enhancing communication with their families [25].
In summary, previous research investigated and highlighted the important effect from social support on healthcare utilization, mental health, and life satisfaction among the migrant elderly. However, no study has clarified the relationship between social support, morbidities and self-rated health of the MEFC. To fill in this gap, this study aimed to clarify the effect of social support and morbidities on self-rated health of the MEFC in Jinan, China.
2. Methods
2.1. Data Collection and Research Subjects
The data were collected in the city of Jinan, Shandong Province, China, in August 2020. Shandong Province lies in the east of China, and Jinan City is the capital city with gross domestic product (GDP) of CNY 1.01 trillion (≈USD 157,285.51 million) in 2020 [26]. As of 1 July 2020, Jinan has 10 districts and two counties (132 sub-districts and 29 towns) under its jurisdiction [27]. By the end of 2019, the local resident population was 8.91 million, an increase of 0.78% over the previous year, while the registered population was 7.98 million, an increase of 1.46% [28]. There were 2.9 million migrants in Jinan City in 2019 [29], of whom those older than 60 years and who followed their children to Jinan were the subjects of this study. Multi-stage cluster random sampling was used to select the participants of the study. In the first stage, three districts were chosen from the 10 districts as the primary sampling units (PSUs) following consideration of the economic development and the geographic location. In the second stage, a total of three sub-districts were selected from each PSU as the secondary sampling units (SSUs), which means one sub-district was chosen from each of the previously selected districts. In the third stage, three communities were selected from the SSUs, which means one community was chosen from each of the previously selected sub-districts. All of the MEFC who were over 60 years of age and followed their children to Jinan in these three communities constituted the total sample of this study (as shown in Figure 1).
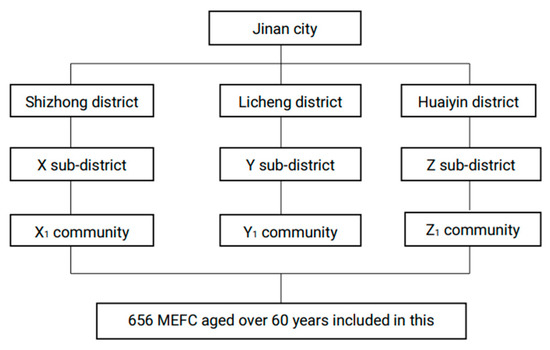
Figure 1.
Flow chart of participant enrolment.
Thirty-two university students became the investigators after training with the background information about the whole study, the contents of the questionnaire, and the social survey technique. Eleven of the investigators were from Shandong University, while 13 were from Jinan University, two from Dongying Vocational Institute, and seven from Weifang Medical University. Twenty-minute face-to-face interviews were conducted between the investigators and subjects to collect the data. A total of 670 MEFC who followed their children were initially chosen and interviewed. However, 14 of them were excluded from the sample due to obvious logical errors in the questionnaire or uncompleted questionnaires. A total of 656 elderly individuals were eventually included in the database.
2.2. Variables
2.2.1. Dependent Variable
The dependent variable of this study was defined by asking the respondents “How would you describe your current state of health?” The self-rated health had two options, namely, “good” and “average or below”.
2.2.2. Independent Variables
Sociodemographic Characteristics
The sociodemographic characteristics included ethnic group, education level, height, weight, religions, marriage, Hukou (commonly known as household registration, each person is assigned a Hukou type based on his or her birthplace) [30], migration range, migration years, employment, monthly income, and current living conditions. The participants’ age is described by the mean and standard deviation. Other demographic characteristics were categorized as follows: ethnic group, including ethnic minority groups (Manchu, Hui, Tibetan, and other minority ethnic groups) and Hans; education level including middle school and below, high school, and high school and above; religions were divided into Buddhism, Islam, Christianity, Catholicism, Taoism, and no faith; and marriage situation (married, unmarried, divorced, widowed, and others). There are two types of migration range: inter-provincial and intra-provincial. We divided the migration years into five years and below, and more than five years. Employment (working, retired, and unemployed); current living conditions and assessment of living condition (good and poor) were also included.
Social Support
Social support was assessed using the Social Support Rating Scale, which contains ten kinds of support: friends, residents, neighbors, colleagues, family members, economy, comfort, talk, help, and activities. This scale has been widely used in China and has good reliability and validity [31]. The higher the total social support score, the more social support subjects received. The full score is 66 points; a total score of ≤ 22 points is the low level; 23 ≤ total score ≤ 44 is the medium level; 45 ≤ total score ≤ 66 is considered to be high level.
Morbidities
Total chronic diseases, heart disease, stroke, headache, back pain, leg pain, duration of chronic disease, degree of pain discomfort (no pain, have a pain), and outpatient service attendance (yes or no) were included.
2.3. Analysis Approach
All statistical analyses were performed using SPSS24.0 (International Business Machines Corporation, Armonk, NY, USA), and p-values less than 0.05 were regarded as statistically significant. The relationship between social support, morbidities and self-rated health among the MEFC was firstly identified through correlation analysis. Three binary logistic regression models were then adopted to explore the associations between social support, morbidities and self-rated health. Crude odds ratios (OR) and 95% confidence intervals (95% CI) were calculated at the meantime. In Model 1, we only included basic demographic information variables, Model 2 included basic demographic information and health conditions, and Model 3 included demographic, morbidities, and social support as the 3 variables.
3. Results
3.1. The Demographic Characteristics
Table 1 shows the basic demographic information of the 656 MEFCs. Approximately 63.7% of the participants were female, and the remaining 36.3% were male. The majority of the MEFCs had a body mass index (BMI) of 24–27.9 (45.7%). The majority of the MEFC (69.1%) had a monthly income level of below CNY 2000 (≈USD 309.2). Meanwhile, 51.8% of MEFC had an education level of middle school and below, 29.3% of high school and only 18.9% had an education level above high school. As for employment status, most of them (74.4%) were unemployed. A total of 54.1% of MEFCs moved to here less than five years ago while the other 45.9% of MEFC migrated here five years ago. More than half of the MEFC (79.7%) had a good evaluation of their current living conditions. According to the results of Chi-square test, sex, employment, the presence of an elevator in the place of residence, and assessment of living conditions were significantly associated with the self-rated health among MEFCs. Kendall tau-b analysis showed that BMI and migration years were positively associated with MEFCs, while monthly income was negatively associated with MEFCs.

Table 1.
Demographic characteristics and self-rated health of the MEFC.
3.2. Social Support
Table 2 shows that most of the MEFCs had one or more close friends (86.1%), while 98.3% had been living with their families in the past year, and most people have good relationships with their neighbors (86.1%) and friends (89.8%). Most of them stated that they would take the initiative to talk (35.8%) and ask for help (41.6%) when in trouble. Approximately 72.3% of participants never attended group activities, and 76.7% scored between 23 and 44 for social support. In terms of crisis economic support and crisis comfort support, the variables of colleagues, employer, party union, religious group and others were not significantly associated with self-rated health of the MEFC; these results are not shown in Table 2. The Kendall tau-b analysis results showed that the number of close friends, relationships with neighbors and friends, and the relationship with a spouse were positively associated with self-rated health, while the social support scores were negatively associated with self-rated health. Chi-square testing showed that economic support, comfort support, and one-year living style were significantly associated with self-rated health.
Table 2.
Social support and self-rated health of the MEFC.
3.3. Morbidities and Self-Rated Health
Table 3 is mainly about morbidities and self-rated health of the MEFC. The results showed that approximately 41.6% of the MEFC had one or more chronic disease. The majority of participants were free of heart disease (96.3%), stroke (92.7%), headache (95.1%), back pain (87.5%), and leg pain (83.2%). Moreover, 74.4% of the MEFC had not attended an outpatient service in the past year. The correlation analysis results showed that heart disease, stroke, back pain, leg pain, chronic disease duration and outpatient service attendance were significantly associated with the self-rated health among MEFC.
Table 3.
Morbidities and self-rated health of the MEFC.
3.4. The Association between Social Support, Morbidities and Self-Rated Health
In order to better demonstrate the relationship between social support, morbidities and self-rated health, we put the results into three models by using logistic regression (Table 4). In Model 1, we only included basic demographic information variables. The results showed that the association between basic demographic information and the self-rated health among the MEFCs was statistically significant. In detail, the MEFCs with a monthly income of CNY 1001–2000 were more likely to report poor health than those with a monthly income of CNY 0–100 (p = 0.037, OR = 1.827). People whose residence did not have an elevator more likely to report poor self-rated health than those who did have an elevator (p = 0.000, OR = 7.023). In Model 2, we included basic demographic information and health conditions. The results showed that people whose residence did not have an elevator (p = 0.000, OR = 18.296) were more likely to report poor self-rated health than those who did. Additionally, people who didn’t suffer from heart disease (p = 0.042, OR = 0.181) or stroke (p = 0.028, OR = 0.187) were less likely to report poor self-reported health, and people who did not attend outpatient services (p = 0.015, OR = 0.503) were less likely to report poor self-reported health. The MEFCs with chronic diseases have poorer self-rated health than those without chronic diseases. Model 3 included demographic, morbidities, and social support as variables. It was found that BMI, monthly income, the presence of an elevator in the place of residence, heart disease, stroke, duration of chronic disease, and outpatient service attendance were all statistically significant. Moreover, the association between one-year living style and self-rated health was significant; specifically, the MEFC who lived with family (p = 0.010, OR = 0.033) were less likely to report poor levels of health.
Table 4.
The binomial logistic regression of demographic characteristics, morbidities, social support and self-rated health of the MEFC.
4. Discussion
4.1. Association between Demographic Characteristics and Self-Rated Health
The results of this study show that 75.9% (n = 498) of the MEFC were categorized into the “good” self-rated health group, which was similar to previous studies [32]. Statistically significant relationships between self-rated health, BMI, monthly income, and whether or not their place of residence had an elevator were found in this study. BMI < 18.5 was considered as underweight, 18.5 ≤ BMI < 24.0 was considered normal, 24.0 ≤ BMI ≤ 28.0 was considered overweight, and BMI ≥ 28 was considered obese [33]. The results of Table 4 show that the MEFC with a BMI of less than 18.5 and between 18.5 and 23.9 were less likely to report poor health. Studies have shown that a high BMI indicates overweightness and obesity conditions, which could further lead to many chronic diseases [34,35]. The results of this study show that the MEFC with a monthly income of CNY 1001–2000 were more likely to report poor health than those with an income of CNY 0–100. This is contrary to many previous studies in which people with higher income levels were more likely to report on their health [36]. This may be because people with higher income levels also have higher health literacy and higher expectations of their own health, while those MEFC with relatively low incomes do not have such high expectations of their own health. Elderly people whose residence had an elevator rated themselves healthier than those without an elevator, possibly because they become less mobile as they became older and elevators are easier for those who live on higher floors, thus making them feel healthier [37]. It should be noted that the relationship between presence of an elevator and self-rated health of MEFC implied the impact of social status of the subjects. This also provided evidence for the suggestion that elevators and barrier-free facilities could be added according to local conditions in order to meet the needs of the elderly [38].
4.2. Association between Morbidities and Self-Rated Health
Consistent with previous studies, our study found that elderly individuals with heart disease, stroke and other conditions reported poorer self-rated health. A number of previous studies have documented the relationship between chronic disease and self-reported health and have consistently shown that chronic diseases have a negative impact on health [39,40,41]. Chronic diseases are a serious threat to the health of the elderly and are a common problem that needs to be addressed globally [42,43]. This study also provides scientific evidence for the promotion of the self-rated health among the MEFC.
4.3. Association between Social Support and Self-Rated Health
High levels of neighbor, colleague, family, financial and comfort support are more beneficial to an individual’s physical and mental health than lower levels of support, as has been addressed in previous studies [44]. However, our study revealed that the association between neighbor, colleague, family, financial, and comfort support and the self-rated health of the MEFC was not statistically significant. One possible reason for this might be that most of the MEFC were living with their families, so there was less support from friends and colleagues. However, the monthly income of most of the MEFC was at a low level, meaning the economic support they obtained from both family and friends was very limited. In this study, living with family was positively associated with the self-rated health of the MEFC. Family is the main source of dependence for the MEFC, and living with family members will be beneficial for their health. This may be related to the prevalence of diseases; when living with family members, chronic diseases such as heart disease and stroke may have a great impact on elderly people’s self-rated health. However, most of the MEFC in the survey sample were living with their family members, and their families’ support and care may have resulted in a high level of health and life satisfaction, which is similar to the results of previous studies [45,46,47]. Our study is similar to a previous study which also found that children were identified as the most important source of financial and comfort support, followed by relatives and spouses [48]. This showed that in the minds of the MEFC, the closest family members, such as spouse and children, are the main sources of help and support for them. Elderly people communicating with their families for help when they are in trouble is beneficial to their health [49].
This study also found that the total score of social support for the MEFC was between 23 and 44, which is characterized as a moderate level of support. Moreover, there was a correlation between the total score of social support and self-rated health. However, in the multi-stage logistic regression, the relationship between the total social support score and self-rated health was not statistically significant. A possible reason for this is that morbidities and socioeconomic status may have a disproportionate impact on self-rated health compared with social support.
4.4. Implications
In view of these findings, we offer the following policy recommendations. First, morbidities are an obstacle to the health of the elderly. The MEFC should develop a healthy lifestyle by performing regular physical exercise to keep fit and lower the possibility of morbidities [50]. Second, considering that the presence of an elevator in the residence is an important factor affecting the health of the MEFC, the government should pay attention to the needs and physical characteristics of the elderly and upgrade the facilities in their communities [51]. Third, income played a role in this study, and the government needs to pay more attention to expanding re-employment channels and gradually raising the pension level. Only when pensions increase, can more capital be invested in health [52]. Finally, we call for stronger support within the family, as the MEFC show a high dependence on their family members when they encounter economic or emotional difficulties.
4.5. Limitations
This study has some limitations. First, because of the COVID-19 pandemic, our survey in Shanghai was not carried out as scheduled, so the data were limited to Jinan. In the future, we will try to complete the survey and make the results more meaningful. Second, the individual health levels in this study were based on a self-report measure, which might have a certain impact on the results of our data analysis. Compared with a comprehensive health evaluation scale, a self-rated assessment of health is a subjective evaluation, which may be less objective and might lead to recall bias.
5. Conclusions
It was found that 75.9% of the MEFC rated their health as good in this study. Moreover, self-rated health of the MEFC was significantly associated with BMI, monthly income, one-year living style, the presence of an elevator in the place of residence, heart disease, stroke, duration of chronic disease, outpatient service attendance and living with family. As an initial study on the effects of social support and morbidities on self-rated health among MEFC in Jinan, China, the results of this study could be used as a reference for the promotion of health and well-being of the MEFC in other cities inside or outside of China.
Author Contributions
S.W. analyzed the data and drafted the manuscript; F.K. applied for the funding to support this study, designed the study, completed the questionnaire design, supervised and joined the data collection, instructed the writing, conducted statistical analysis, processed the data and provided comments on the modification of manuscript; S.L. gave many valuable comments on the draft and also polished it. All authors have read and agreed to the published version of the manuscript.
Funding
This study was supported and funded by the National Natural Science Foundation of China (no. 71804094), the China Postdoctoral Science Foundation (no. 2016M592161), the Natural Science Foundation of Shandong Province (no. ZR2016GB02), the Postdoctoral Science Foundation of Shandong Province (no. 201603021), and the Fundamental Research Funds of Shandong University (no. 2015HW002, no. 2018JC055).
Institutional Review Board Statement
The study was conducted according to the guidelines of the Declaration of Helsinki, and approved by the Ethics Committee of Shandong University (No. 20180225).
Informed Consent Statement
Informed consent for data collection and use of the data were obtained from all subjects.
Data Availability Statement
The data that support the findings of this study are available from the corresponding author, upon request.
Acknowledgments
The research team greatly appreciates the funding support, and the research participants for their cooperation and support.
Conflicts of Interest
The authors declare no conflict of interest.
References
- National Bureau of Statistics of China (NBS). China Statistical Year Book 2020; China Statistics Press: Beijing, China, 2020.
- Lin, K.; Yin, P.; Loubere, N. Social Support and the ‘Left Behind’ Elderly in Rural China: A Case Study from Jiangxi Province. J. Community Health 2014, 39, 674–681. [Google Scholar] [CrossRef] [PubMed]
- National Health Commission (NHC). Report on China’s Floating Population Development 2018; China Population Publishing House: Beijing, China, 2018. [Google Scholar]
- Wang, Q. Health of the Elderly Migration Population in China: Benefit from Individual and Local Socioeconomic Status? Int. J. Environ. Res. Public Health 2017, 14, 370. [Google Scholar] [CrossRef]
- Tang, D.; Wang, J. Basic Public Health Service Utilization by Internal Older Adult Migrants in China. Int. J. Environ. Res. Public Health 2021, 18, 270. [Google Scholar] [CrossRef]
- Lin, Y.; Chu, C.; Chen, Q.; Xiao, J.; Wan, C. Factors influencing utilization of primary health care by elderly internal migrants in China: The role of social contacts. BMC Public Health 2020, 20, 1054. [Google Scholar] [CrossRef] [PubMed]
- Wang, Y.; Yin, H. A study on the social integration of the “Lao Piao tribe” from the perspective of social support networks: Taking Guangzhou as an example. Sci. Res. Aging 2016, 04, 53–64. [Google Scholar]
- Qi, Y.; Zhang, X. Research on the status and influencing factors of social support for the elderly in urban communities. Chin. Gen. Pract. 2016, 19, 3099–3102. [Google Scholar]
- Kong, F.; Kong, M.; Li, C.; Li, S.; Lv, J. Research progress of the elderly migrant following child at home and abroad. Chin. J. Gerontol. 2020, 40, 2443–2447. [Google Scholar]
- Wallston, B.S.; Pdagna, S.W.; DeVellis, B.M. Social support and physical health. J. Health Psychol. 1983, 2, 367–391. [Google Scholar] [CrossRef]
- Xiao, S. Social Support Scale: Theoretical Basis and Research Application. J. Clin. Psychiatry 1994, 4, 98–100. [Google Scholar]
- Li, M. A Review on the Social Adaptation of the Elderly. Sci. Res. Aging 2014, 2, 20–27. [Google Scholar]
- Schoenmakers, D.; Lamkaddem, M.; Suurmond, J. The Role of the Social Network in Access to Psychosocial Services for Migrant Elderly—A Qualitative Study. Int. J. Environ. Res. Public Health 2017, 14, 1215. [Google Scholar] [CrossRef] [PubMed]
- Albert, M.; Becker, T.; McCrone, P.; Thornicroft, G. Social networks and mental health service utilization—A literature review. Int. J. Soc. Psychiatry 1998, 44, 248–266. [Google Scholar] [CrossRef] [PubMed]
- Jennings, E.A.; Ralston, M.; Schatz, E. Support in times of need: How depressive symptoms can impact receipt of social support among aging adults in rural South Africa. SSM Popul. Health 2020, 12, 100666. [Google Scholar] [CrossRef] [PubMed]
- Giang, L.T.; Nguyen, T.T.; Nguyen, N.T. Social Support and Self-Rated Health among Older Men and Women in Vietnam. JPA 2020, 13, 427–442. [Google Scholar]
- Amoah, P. The Relationship between Functional Health Literacy, Self-Rated Health, and Social Support between Younger and Older Adults in Ghana. Int. J. Environ. Res. Public Health 2019, 16, 3188. [Google Scholar] [CrossRef]
- Perruccio, A.V.; Katz, J.N.; Losina, E. Health burden in chronic disease: Comorbidity is associated with self-rated health more than medical comorbidity alone. J. Clin. Epidemiol. 2012, 65, 100–106. [Google Scholar] [CrossRef]
- Kaneva, M.; Gerry, C.J.; Baidin, V. The effect of chronic conditions and multi-morbidity on self-assessed health in Russia. Scand. J. Public Health 2018, 46, 886–896. [Google Scholar] [CrossRef]
- Zhu, L.; Zhu, G.; Meng, M.; Wu, X. Self-rated health status of Bengbu residents and its influencing factors. Chin. J. Dis. Control 2018, 22, 1173–1176. [Google Scholar]
- Wang, X.; Wang, L.; Wang, Z.; Qi, S.; Zhang, X.; Chen, Z.; Zhang, M. Status and influencing factors of self-rated health of elderly people in China. Chin. J. Prevent. Control Chronic Dis. 2019, 27, 406–411. [Google Scholar]
- Yi, D. Migrant elderly: A group in urgent need of social attention. J. Lanzhou IOE 2014, 30, 46–47. [Google Scholar]
- Duan, L. The Impact of Social Support on the Social Integration of Migrant Elderly; Northwest A & F University: Xianyang, China, 2018. [Google Scholar]
- Cui, L.; Li, H. Research on Social Support Network and Life Satisfaction of Urban Elderly. Psychol. Sci. 1997, 20, 123–126. [Google Scholar]
- Tong, X. Social Work Practice Research on Promoting Social Support for the Rural Elderly. Master’s Thesis, Yunnan University, Kunming, China, 2017. [Google Scholar]
- Jinan’s GDP Breaks Trillion! Shandong Adds “Promoters”. Available online: http://www.sd.chinanews.com.cn/2/2021/0126/77357.html (accessed on 11 February 2021).
- Administrative Division of Jinan City. Available online: http://www.jinan.gov.cn/col/col24699/index.html (accessed on 11 February 2021).
- Overview of Jinan City. Available online: http://www.jinan.gov.cn/col/col129/index.html (accessed on 11 February 2021).
- Jinan Has a Floating Population of More Than 2.9 Million, So It Is Advisable to Apply for Residence Permit. Available online: https://www.qlwb.com.cn/2019/0419/1419427.shtml (accessed on 11 February 2021).
- Long, C.; Han, J.; Yi, C. Does the Effect of Internet Use on Chinese Citizen’s Psychological Well-Being Differ Base on Their Hukou Category? Int. J. Environ. Res. Public Health 2020, 18, 6680. [Google Scholar] [CrossRef] [PubMed]
- Gao, X.; Wang, D.; Wang, Y. The Relationship between Parents and Mental Health of Chi Shiji Women from the Perspective of Social Support—Based on the Investigation in Qinba Mountain Area. J. Northwest Univ. (Philos. Soc. Sci.). 2021, 51, 76–84. [Google Scholar]
- Kim, Y.; Schneider, T.; Faß, E.; Lochbaum, M. Personal social capital and self-rated health among middle-aged and older adults: A cross-sectional study exploring the roles of leisure-time physical activity and socioeconomic status. BMC Public Health 2021, 21, 48. [Google Scholar] [CrossRef]
- Seo, J.; Choi, B.; Kim, S.; Lee, H.; Oh, D. The relationship between multiple chronic diseases and depressive symptoms among middle-aged and elderly populations: Results of a 2009 korean community health survey of 156,747 participants. BMC Public Health 2017, 17, 844. [Google Scholar] [CrossRef] [PubMed]
- Sun, S.; Li, Z.; Luo, G.; Li, A.; Chen, P.; Huang, L. The prevalence of common chronic diseases and its correlation with body mass index in the elderly in Xuyong County. Chin. Prim. Health Care 2020, 34, 52–55. [Google Scholar]
- Kearns, K.; Dee, A.; Fitzgerald, A.P.; Doherty, E.; Perry, I.J. Chronic disease burden associated with overweight and obesity in Ireland: The effects of a small BMI reduction at population level. BMC Public Health 2014, 14, 143. [Google Scholar] [CrossRef] [PubMed]
- Kim, I.; Bahk, J.; Yun, S.; Khang, Y. Income gaps in self-rated poor health and its association with life expectancy in 245 districts of Korea. Epidemiol. Health 2017, 39, e2017011. [Google Scholar] [CrossRef][Green Version]
- Song, F.; Kang, S. Dilemma and Path of Reconstruction of Old Communities under the Background of Population Aging. Hebei Acad. J. 2020, 40, 191–197. [Google Scholar]
- Zhang, X. Research on Aging Adaptation of Urban Old Community Based on the Behavioral and Psychological Characteristics of the Old. Master’s Thesis, Taiyuan University of Technology, Taiyuan, China, 2017. [Google Scholar]
- Chan, Y.; The, C.; Lim, K.; Lim, K.; Yeo, P.; Kee, C.; Omar, M.; Ahmad, N. Lifestyle, chronic diseases and self-rated health among Malaysian adults: Results from the 2011 National Health and Morbidity Survey (NHMS). BMC Public Health 2015, 15, 754. [Google Scholar] [CrossRef]
- Jiang, J.; Gao, X. Self-rated health status and its influencing factors of the elderly in rural Taizhou. J. Med. Soc. 2019, 32, 111–114. [Google Scholar]
- Chen, L.; Yao, Y. The effect of social support on the mental health of the elderly. Popul. Res. 2005, 4, 73–78. [Google Scholar]
- Wu, Y.; Han, X.; Qian, D.; Zhao, J. Quality of life of elderly chronic disease patients in rural areas of Jiangsu Province. J. Med. Soc. 2020, 33, 76–80. [Google Scholar]
- Zhou, M.; Sun, X.; Huang, L. Chronic disease and medical spending of Chinese elderly in rural region. Int. J. Qual. Health Care 2021, 33. [Google Scholar] [CrossRef]
- Kim, J.; Lee, J.E. Social Support and Health-Related Quality of Life Among Elderly Individuals Living Alone in South Korea: A Cross-Sectional Study. J. Nurs. Res. 2018, 26, 316–323. [Google Scholar] [CrossRef] [PubMed]
- Liu, Y.; Sangthong, R.; Ingviya, T.; Wan, C. Nothing Like Living with a Family: A Qualitative Study of Subjective Well-Being and its Determinants among Migrant and Local Elderly in Dongguan, China. Int. J. Environ. Res. Public Health 2019, 16, 4874. [Google Scholar] [CrossRef] [PubMed]
- Shen, Y.; Yeatts, D.E. Social support and life satisfaction among older adults in China: Family-based support versus community-based support. Int. J. Aging Hum. Dev. 2013, 77, 189–209. [Google Scholar] [CrossRef]
- Cheah, Y.K. An exploratory study on self-rated health status: The case of Penang, Malaysia. Malays. J. Econ. Stud. 2012, 49, 141–155. [Google Scholar]
- Cao, Z. Research on the Involvement of Group Work in the Social Communication Dilemma of the Elderly Migrant. Master’s Thesis, Nanjing Agricultural University, Nanjing, China, 2015. [Google Scholar]
- Li, M. The Emotional Needs and Social Support of the Elderly; China Population: Beijing, China, 2020. [Google Scholar]
- Ning, X.; Lai, Y.; Wu, C.; Huang, Z.; Mo, H.; Li, C.; Sun, Q. Physical health status and influencing factors of 60 to 69 years old people in Guangxi. Modern Prev. Med. 2020, 47, 2030–2034. [Google Scholar]
- Wang, Y. The Reconstruction of Old Residential Areas Should Focus on Solving the “Pain Points” of People’s Livelihood. Econ. Daily 2020, 03, 01. [Google Scholar]
- Wang, Z.; Zhang, Z.; Ma, Y.; Wan, Q. The mediating effect of income level on health literacy and self-rated health. Chin. J. Dis. Control Prev. 2020, 24, 1185–1189. [Google Scholar]
Publisher’s Note: MDPI stays neutral with regard to jurisdictional claims in published maps and institutional affiliations. |
© 2021 by the authors. Licensee MDPI, Basel, Switzerland. This article is an open access article distributed under the terms and conditions of the Creative Commons Attribution (CC BY) license (https://creativecommons.org/licenses/by/4.0/).