
Risk of Dry Eye Syndrome in Patients with Orbital Fracture: A Nationwide Population-Based Cohort Study

 , ,
, ,
Abstract
1. Introduction
2. Method
2.1. Data Resource and Ethics Declaration
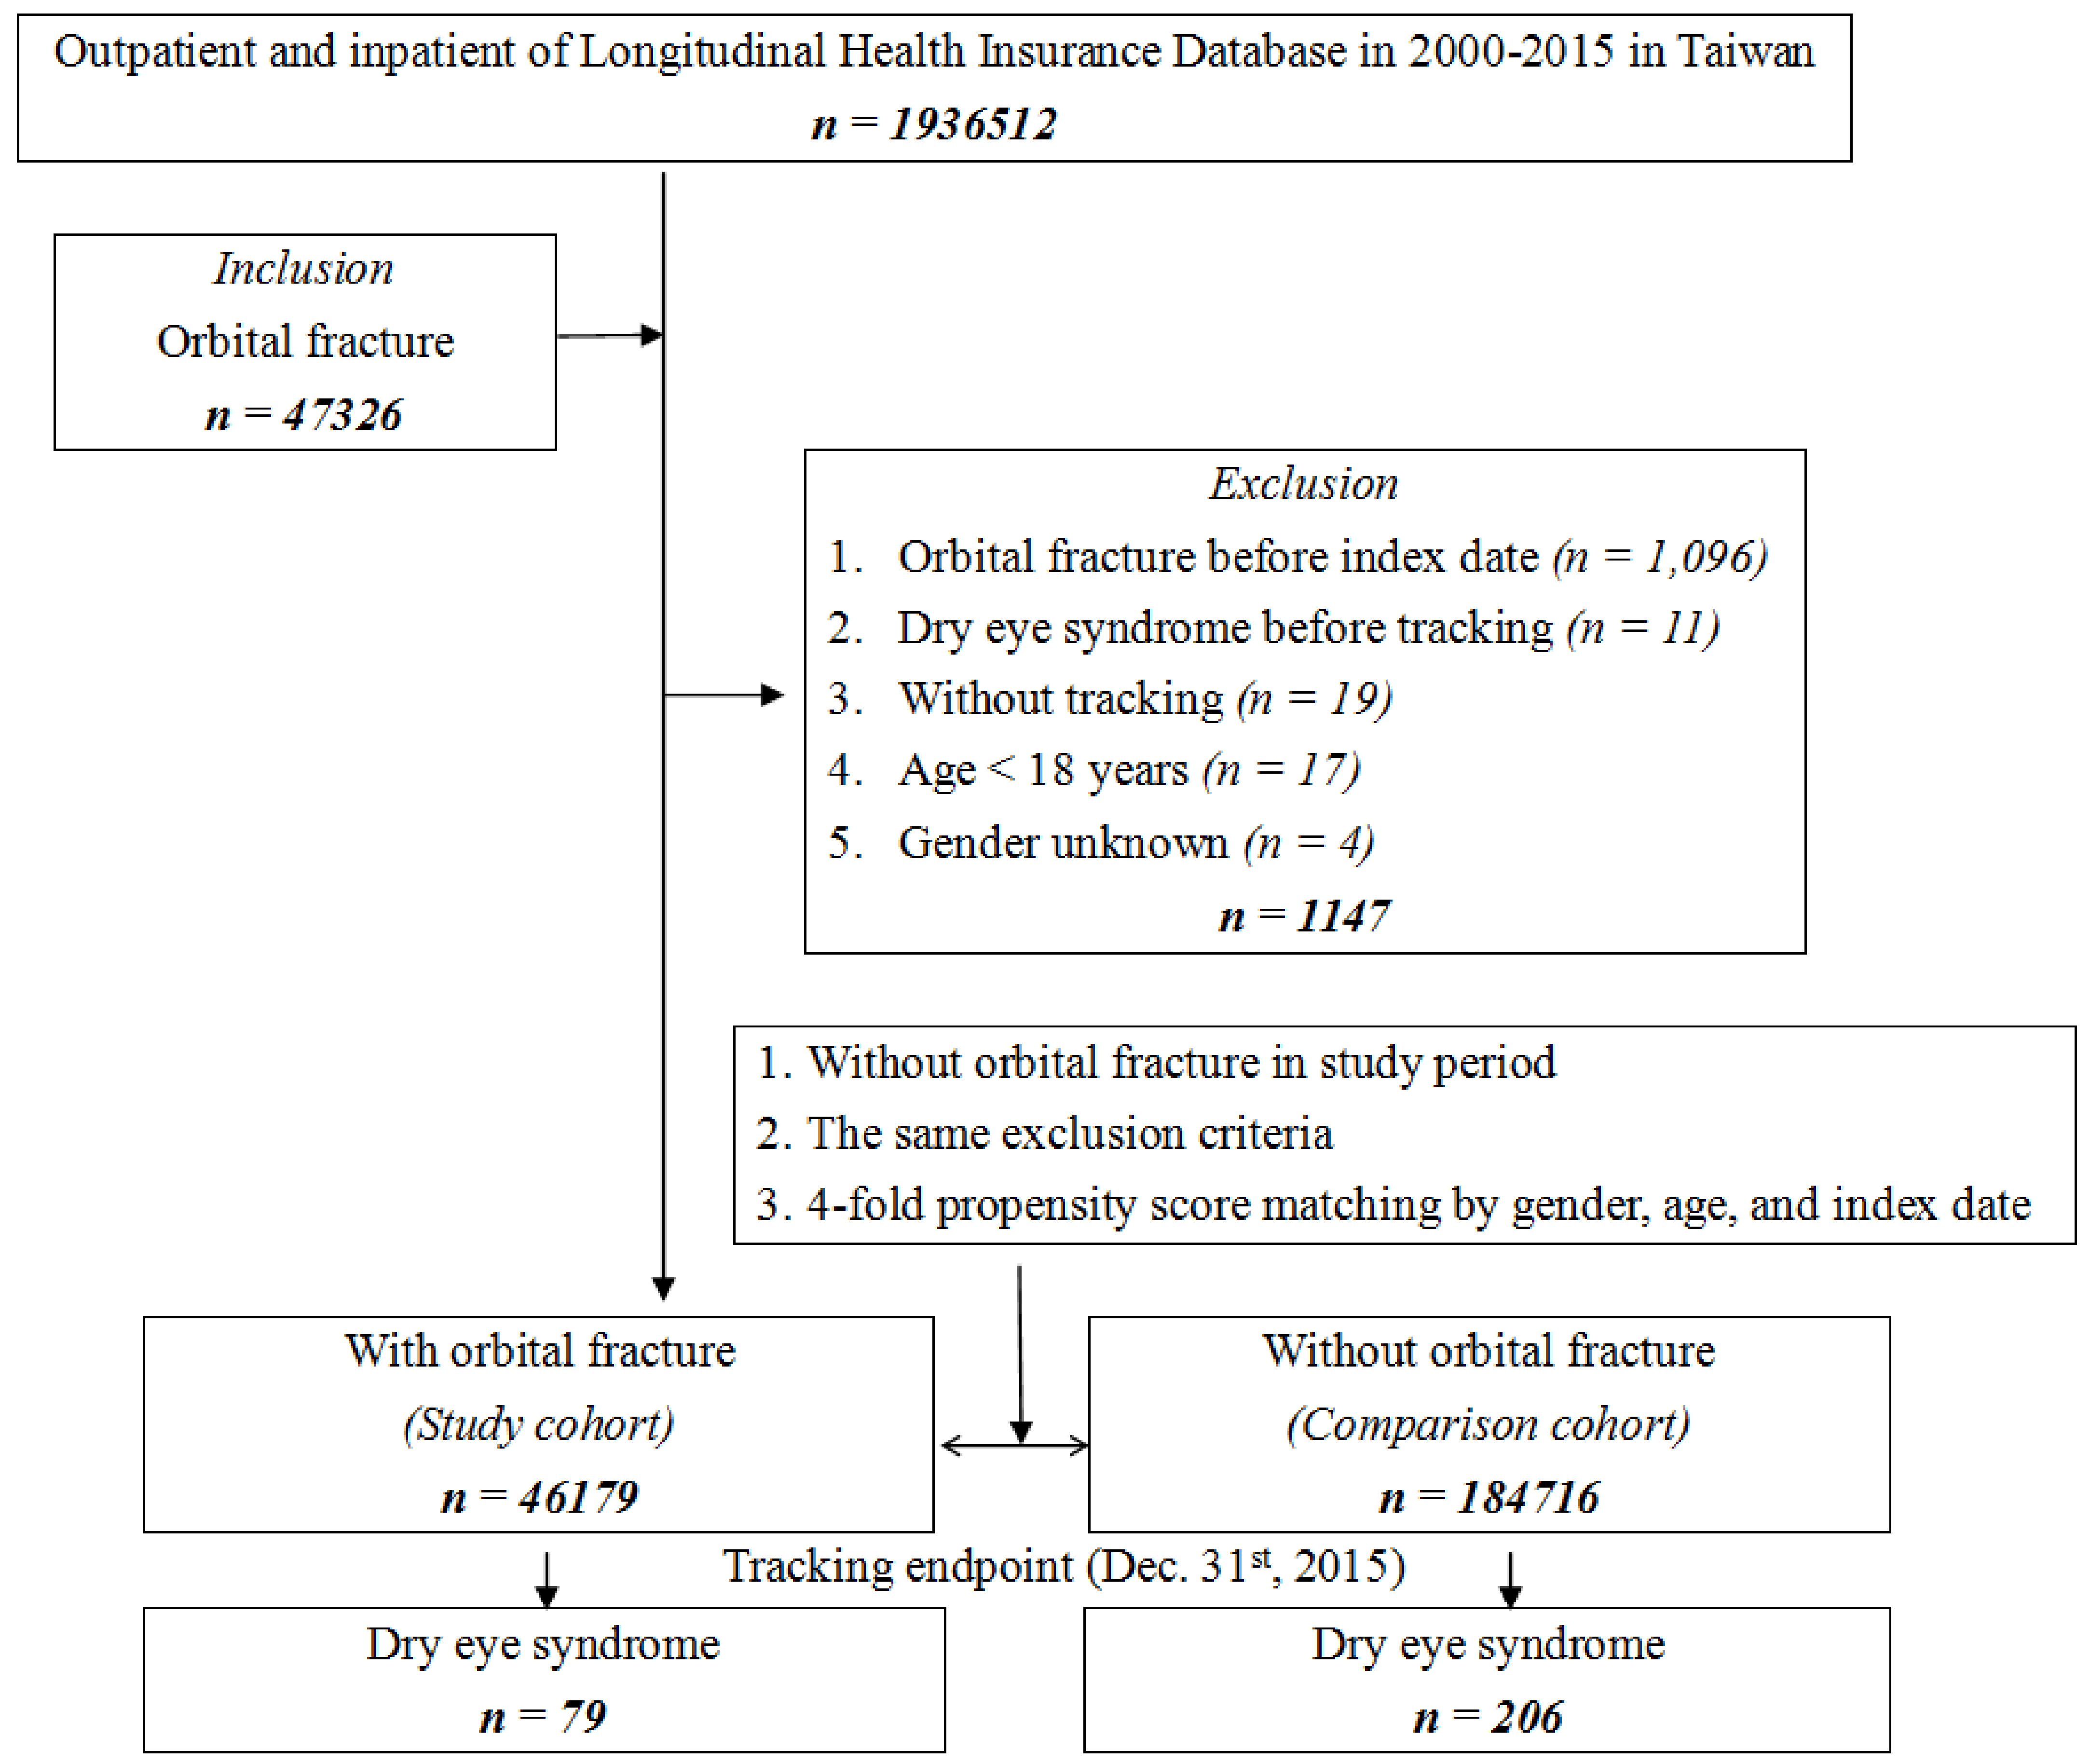
2.2. Study Participants
2.3. Main Outcome Measurement
2.4. Demographic Variables and Comorbidities
2.5. Statistical Analysis
3. Result
3.1. Sample Characteristics
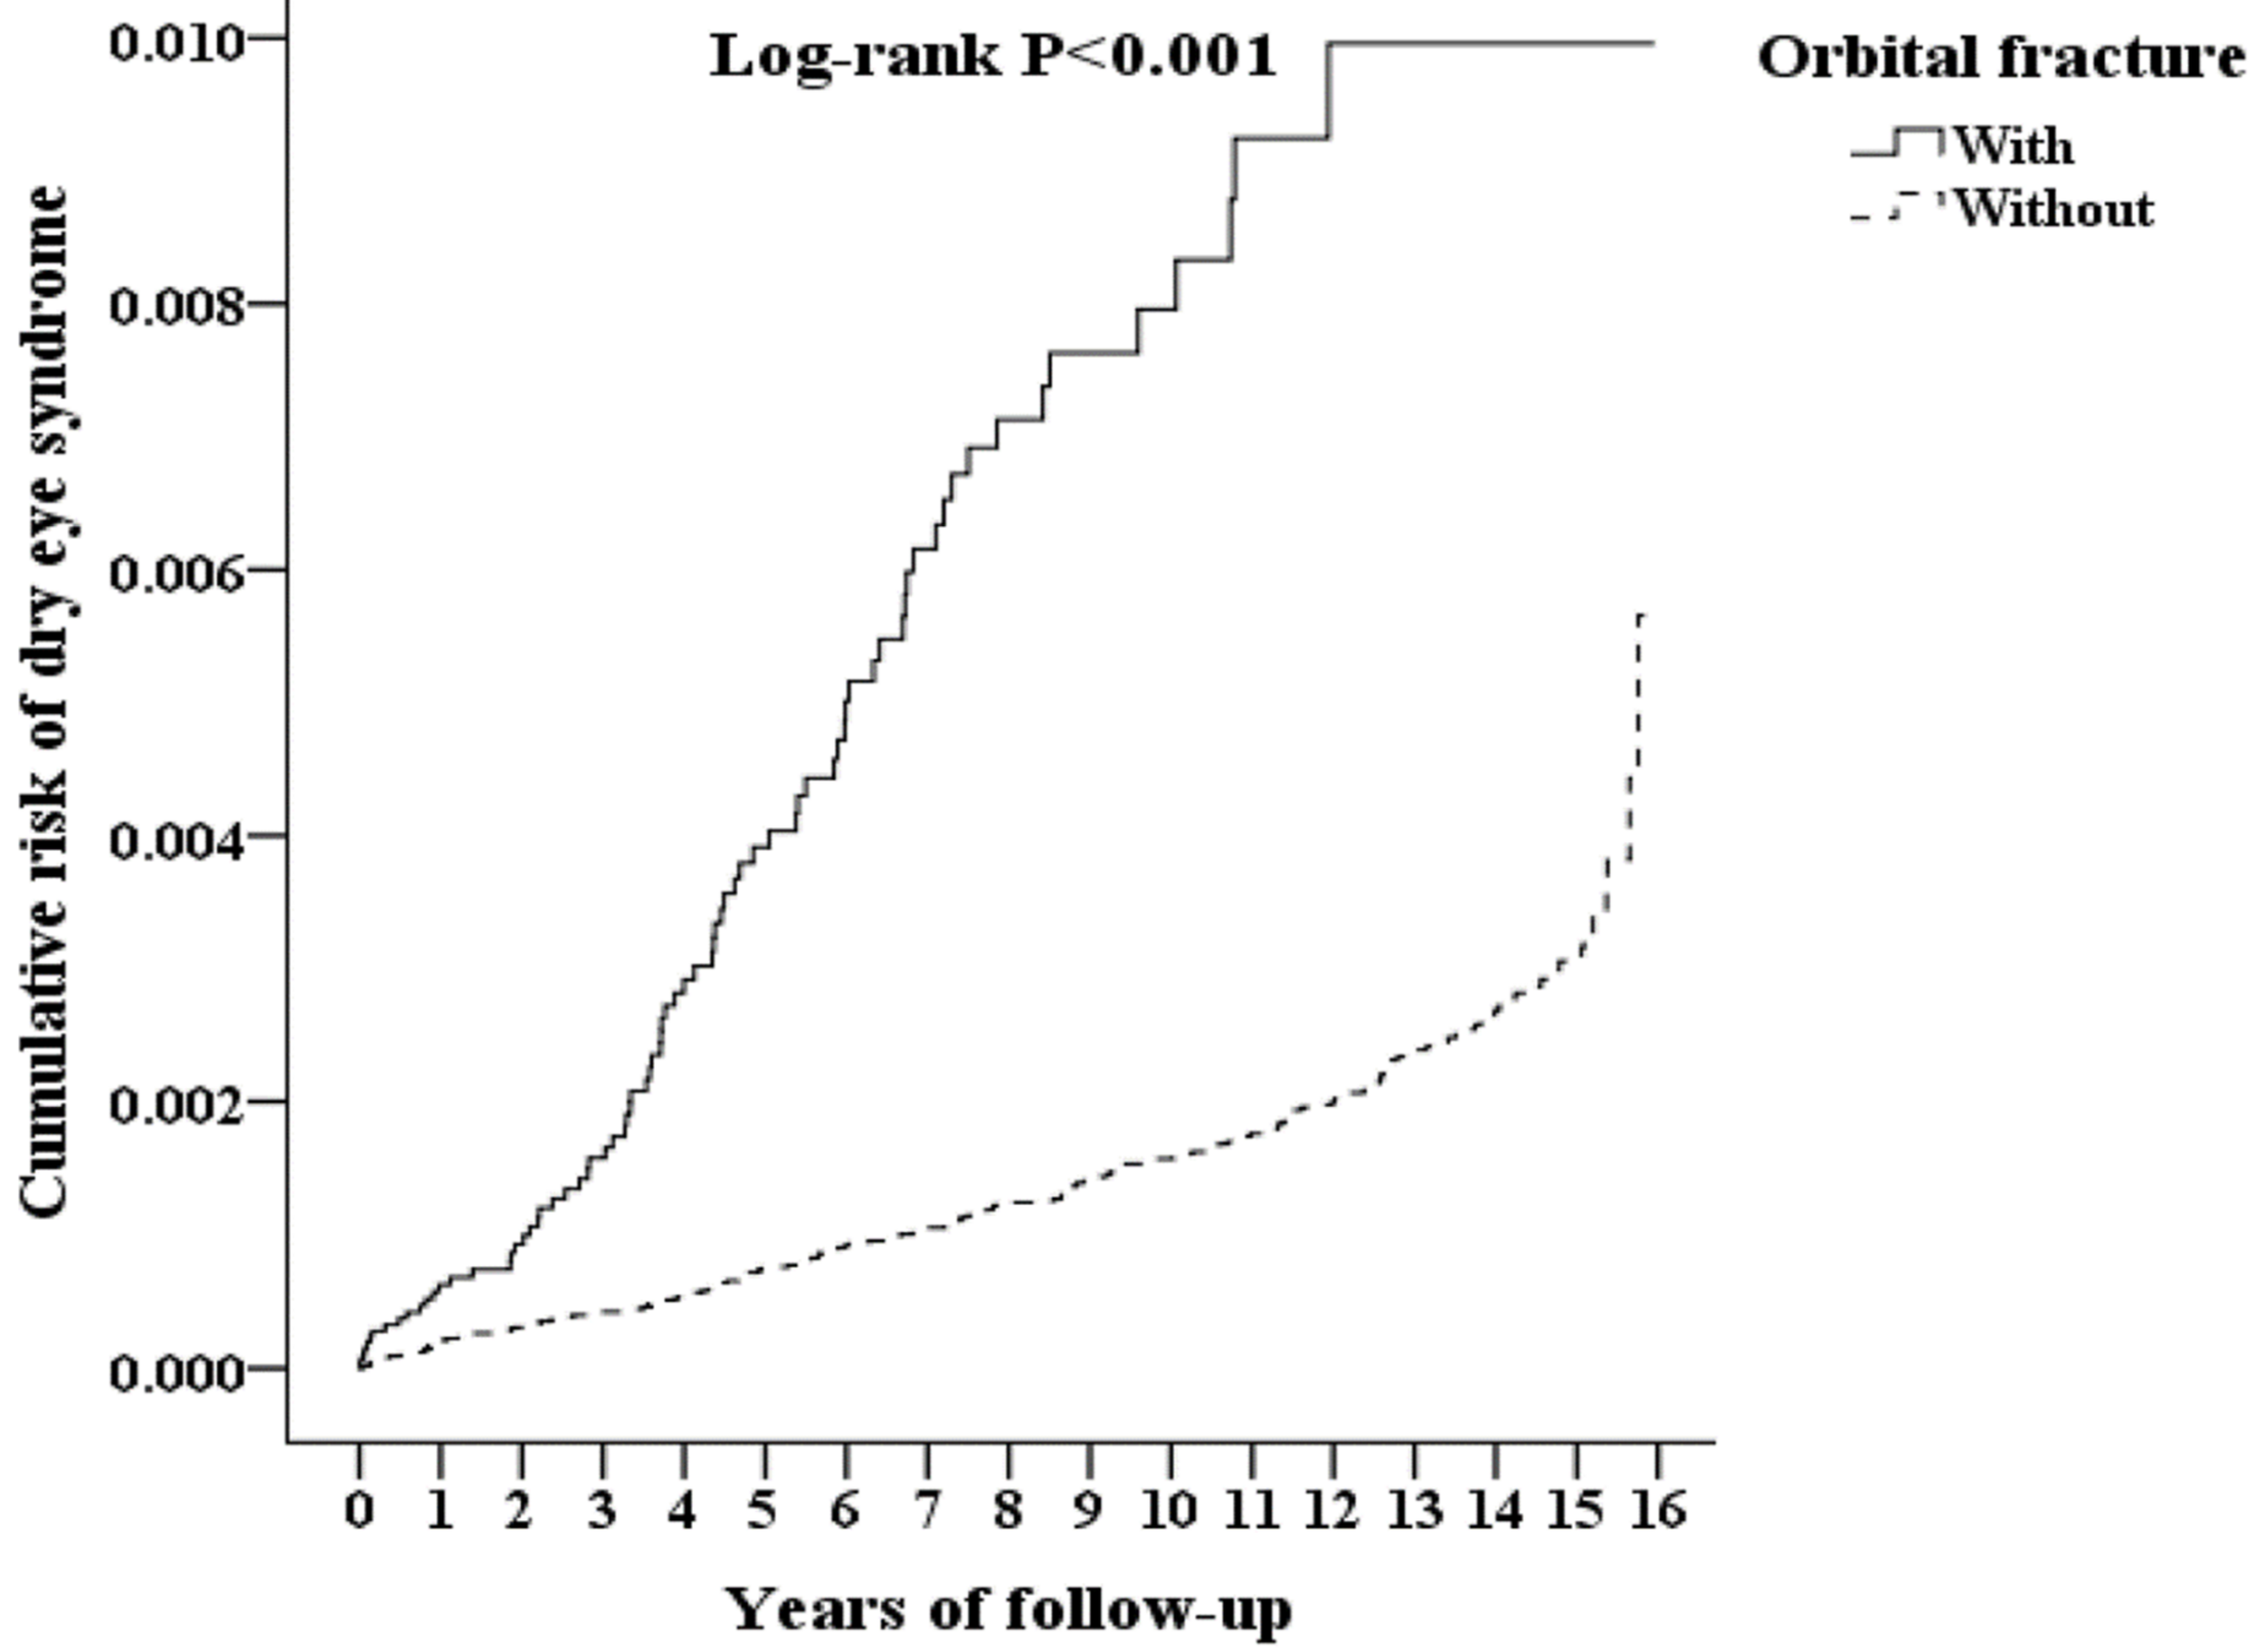
3.2. Kaplan–Meier Model for the Cumulative Risk of DES
3.3. Comparisons of the Prevalence and Risk of DES
3.4. Hazard Ratios Analysis of DES in the Patients with Orbital Fractures
3.5. Hazard Ratio Analysis of DES in the Patients Who Did and Did Not Receive Surgery of Orbital Fracture Subtypes
4. Discussion
5. Conclusions
Supplementary Materials
Author Contributions
Funding
Institutional Review Board Statement
Acknowledgments
Conflicts of Interest
References
- Joseph, J.M.; Glavas, I.P. Orbital fractures: A review. Clin. Ophthalmol. 2011, 5, 95–100. [Google Scholar] [CrossRef]
- Bullock, J.D.; Warwar, R.E.; Ballal, D.R.; Ballal, R.D. Mechanisms of orbital floor fractures: A clinical, experimental, and theoretical study. Trans. Am. Ophthalmol. Soc. 1999, 97, 87–113. [Google Scholar]
- Koenen, L.; Waseem, M. Orbital Floor (Blowout) Fracture. In Stat; Pearls Publishing: Treasure Island, FL, USA, 2019. [Google Scholar]
- Bord, S.P.; Linden, J. Trauma to the Globe and Orbit. Emerg. Med. Clin. N. Am. 2008, 26, 97–123. [Google Scholar] [CrossRef]
- Gosau, M.; Schöneich, M.; Draenert, F.G.; Ettl, T.; Driemel, O.; Reichert, T.E. Retrospective analysis of orbital floor fractures—Complications, outcome and review of literature. Clin. Oral Investig. 2011, 15, 305–313. [Google Scholar] [CrossRef]
- Hwang, K.; You, S.H.; Sohn, I.A. Analysis of orbital bone fractures: A 12-year study of 391 patients. J. Craniofac. Surg. 2009, 20, 1218–1223. [Google Scholar] [CrossRef]
- Shere, J.L.; Boole, J.R.; Holtel, M.R.; Amoroso, P.J. An Analysis of 3599 Midfacial and 1141 Orbital Blowout Fractures Among 4426 United States Army Soldiers, 1980–2000. Otolaryngol. Neck Surg. 2004, 130, 164–170. [Google Scholar] [CrossRef]
- Chiang, E.; Saadat, L.V.; Spitz, J.A.; Bryar, P.J.; Chambers, C.B. Etiology of orbital fractures at a level I trauma center in a large metropolitan city. Taiwan J. Ophthalmol. 2016, 6, 26–31. [Google Scholar] [CrossRef] [PubMed]
- Cruz, A.A.V.; Eichenberger, G.C.D. Epidemiology and management of orbital fractures. Curr. Opin. Ophthalmol. 2004, 15, 416–421. [Google Scholar] [CrossRef] [PubMed]
- Kim, Y.S.; Kim, J.H.; Hwang, K. The Frequency of Decreased Visual Acuity in Orbital Fractures. J. Craniofac. Surg. 2015, 26, 1581–1583. [Google Scholar] [CrossRef]
- Pansell, T.; Alinasab, B.; Westermark, A.; Beckman, M.; Abdi, S. Ophthalmologic Findings in Patients with Non-Surgically Treated Blowout Fractures. Craniomaxillofac. Trauma Reconstr. 2012, 5, 1–5. [Google Scholar] [CrossRef] [PubMed]
- Goto, E.; Yagi, Y.; Matsumoto, Y.; Tsubota, K. Impaired functional visual acuity of dry eye patients. Am. J. Ophthalmol. 2002, 133, 181–186. [Google Scholar] [CrossRef]
- Tutt, R.; Bradley, A.; Begley, C.; Thibos, L.N. Optical and visual impact of tear break-up in human eyes. Investig. Ophthalmol. Vis. Sci. 2000, 41, 4117–4123. [Google Scholar] [PubMed]
- Koh, S. Mechanisms of Visual Disturbance in Dry Eye. Cornea 2016, 35, S83–S88. [Google Scholar] [CrossRef] [PubMed]
- Moss, S.E.; Klein, R.; Klein, B.E.K. Prevalence of and Risk Factors for Dry Eye Syndrome. Arch. Ophthalmol. 2000, 118, 1264–1268. [Google Scholar] [CrossRef] [PubMed]
- Yang, W.J.; Yang, Y.N.; Cao, J.; Man, Z.H.; Yuan, J.; Xiao, X.; Xing, Y.Q. Risk factors for dry eye syndrome: A retrospective case-control study. Optom. Vis. Sci. 2015, 92, e199–e205. [Google Scholar] [CrossRef] [PubMed]
- Cheng, T.-M. Taiwan’s National Health Insurance System: High Value for the Dollar, Six Countries, Six Reform Models: The Health Reform Experience of ISRAEL, The Netherlands, New Zealand, Singapore, Switzerland and Taiwan; World Scientific: Hackensack, NJ, USA, 2009; pp. 171–204. [Google Scholar]
- Cheng, C.-L.; Kao, Y.-H.Y.; Lin, S.-J.; Lee, C.-H.; Lai, M.L. Validation of the national health insurance research database with ischemic stroke cases in Taiwan. Pharmacoepidemiol. Drug Saf. 2010, 20, 236–242. [Google Scholar] [CrossRef]
- A Saleh, T.; McDermott, B.; Bates, A.K.; Ewings, P. Phenol red thread test vs Schirmer’s test: A comparative study. Eye 2005, 20, 913–915. [Google Scholar] [CrossRef]
- Obata, H. Anatomy and Histopathology of the Human Lacrimal Gland. Cornea 2006, 25, S82–S89. [Google Scholar] [CrossRef]
- Kulkarni, A.R.; Aggarwal, S.P.; Deshpande, M.D.; Walimbe, P.B.; Labhsetwar, A.S. Ocular manifestations of head injury: A clinical study. Eye 2004, 19, 1257–1263. [Google Scholar] [CrossRef]
- Coroneo, M.T. High and dry: An update on dry eye syndrome. Ophthalmol. Clin. 2013, 14, 53–61. [Google Scholar]
- Zoukhri, D. Mechanisms Involved in Injury and Repair of the Murine lacrimal Gland: Role of Programmed Cell Death and Mesenchymal Stem Cells. Ocul. Surf. 2010, 8, 60–69. [Google Scholar] [CrossRef]
- Jain, S.M.; Bhavsar, A.S.; Bhavsar, S.G. A review on recent advances in dry eye: Pathogenesis and management. Oman J. Ophthalmol. 2011, 4, 50–56. [Google Scholar] [CrossRef] [PubMed]
- Penfold, C.; Lang, D.; Evans, B. The management of orbital roof fractures. Br. J. Oral Maxillofac. Surg. 1992, 30, 97–103. [Google Scholar] [CrossRef]
- Haug, R.H. Management of the trochlea of the superior oblique muscle in the repair of orbital roof trauma. J. Oral Maxillofac. Surg. 2000, 58, 602–606. [Google Scholar] [CrossRef]
- Kim, J.W.; Bae, T.H.; Kim, W.S.; Kim, H.K. Early Reconstruction of Orbital Roof Fractures: Clinical Features and Treatment Outcomes. Arch. Plast. Surg. 2012, 39, 31–35. [Google Scholar] [CrossRef]
- Donahue, D.J.; Smith, K.; Church, E.; Chadduck, W.M. Intracranial neurological injuries associated with orbital fracture. Pediatr. Neurosurg. 1997, 26, 261–268. [Google Scholar] [CrossRef] [PubMed]
- Flanagan, J.C.; McLachlan, D.L.; Shannon, G.M. Orbital roof fractures: Neurologic and neurosurgical considerations. Ophthalmology 1980, 87, 325–329. [Google Scholar] [CrossRef]
- Jeng, Y.T.; Lin, S.Y.; Hu, H.Y.; Lee, O.K.; Kuo, L.L. Osteoporosis and dry eye syndrome: A previously unappreciated association that may alert active prevention of fall. PLoS ONE 2018, 13, e0207008. [Google Scholar] [CrossRef]
- Ali, F.S.; Akpek, E.K. Glaucoma and Dry Eye. Ophthalmology 2009, 116, 1232. [Google Scholar] [CrossRef]
- Leung, E.W.; Medeiros, F.A.; Weinreb, R.N. Prevalence of Ocular Surface Disease in Glaucoma Patients. J. Glaucoma 2008, 17, 350–355. [Google Scholar] [CrossRef]
- Servat, J.J.; Bernardino, C.R. Effects of Common Topical Antiglaucoma Medications on the Ocular Surface, Eyelids and Periorbital Tissue. Drugs Aging 2011, 28, 267–282. [Google Scholar] [CrossRef] [PubMed]
- Fechtner, R.D.; Godfrey, D.G.; Budenz, D.; A Stewart, J.; Stewart, W.C.; Jasek, M.C. Prevalence of Ocular Surface Complaints in Patients with Glaucoma Using Topical Intraocular Pressure-Lowering Medications. Cornea 2010, 29, 618–621. [Google Scholar] [CrossRef] [PubMed]
- De Seze, J.; Devos, D.; Castelnovo, G.; Labauge, P.; Dubucquoi, S.; Stojkovic, T.; Ferriby, D.; Vermersch, P. The prevalence of Sjögren syndrome in patients with primary progressive multiple sclerosis. Neurology 2001, 57, 1359–1363. [Google Scholar] [CrossRef] [PubMed]


| Orbital Fracture Variables | With | Without | p | ||
|---|---|---|---|---|---|
| n | % | n | % | ||
| Total | 46,179 | 20.00 | 184,716 | 80.00 | |
| Gender | 0.999 | ||||
| Male | 33,115 | 71.71 | 132,460 | 71.71 | |
| Female | 13,064 | 28.29 | 52,256 | 28.29 | |
| Age (years) | 42.32 ± 17.99 | 42.38 ± 17.81 | 0.518 | ||
| Age group (yrs) | 0.999 | ||||
| 18–29 | 15,295 | 33.12 | 61,180 | 33.12 | |
| 30–39 | 7962 | 17.24 | 31,848 | 17.24 | |
| 40–49 | 7511 | 16.26 | 30,044 | 16.26 | |
| 50–59 | 6470 | 14.01 | 25,880 | 14.01 | |
| ≥60 | 8941 | 19.36 | 35,764 | 19.36 | |
| Insured premium (NT$) | <0.001 | ||||
| <18,000 | 45,279 | 98.05 | 180,980 | 97.98 | |
| 18,000–34,999 | 699 | 1.51 | 2606 | 1.41 | |
| ≥35,000 | 201 | 0.44 | 1130 | 0.61 | |
| Education levels (yrs) | 0.337 | ||||
| <12 | 23,792 | 51.52 | 95,629 | 51.77 | |
| ≥12 | 22,387 | 48.48 | 89,087 | 48.23 | |
| Diabetes mellitus (DM) | 5862 | 12.69 | 33,957 | 18.38 | <0.001 |
| Hyperlipidemia | 1562 | 3.38 | 16,416 | 8.89 | <0.001 |
| Hypertension (HTN) | 8487 | 18.38 | 49,378 | 26.73 | <0.001 |
| Chronic kidney disease (CKD) | 1900 | 4.11 | 20,174 | 10.92 | <0.001 |
| Coronary artery disease (CAD) | 3428 | 7.42 | 32,220 | 17.44 | <0.001 |
| Congestive heart failure (CHF) | 1293 | 2.80 | 13,204 | 7.15 | <0.001 |
| Stroke | 4408 | 9.55 | 25,696 | 13.91 | <0.001 |
| Chronic obstructive pulmonary disease (COPD) | 2803 | 6.07 | 24,213 | 13.11 | <0.001 |
| Chronic liver disease (CLD) | 2847 | 6.17 | 29,364 | 15.90 | <0.001 |
| Osteoporosis | 239 | 0.52 | 3065 | 1.66 | <0.001 |
| Rheumatoid arthritis (RA) | 104 | 0.23 | 986 | 0.53 | <0.001 |
| Connective tissue disease (CTD) | 98 | 0.21 | 807 | 0.44 | <0.001 |
| Sarcoidosis | 4 | 0.01 | 30 | 0.02 | 0.287 |
| Trachoma | 74 | 0.16 | 242 | 0.13 | 0.137 |
| Multiple sclerosis (MS) | 8 | 0.02 | 90 | 0.05 | 0.004 |
| Bell’s palsy | 896 | 1.94 | 569 | 0.31 | <0.001 |
| Parkinson disease | 468 | 1.01 | 2900 | 1.57 | <0.001 |
| Blepharitis | 17 | 0.04 | 109 | 0.06 | 0.079 |
| Hordeolum | 29 | 0.06 | 177 | 0.10 | 0.039 |
| Glaucoma | 254 | 0.55 | 1354 | 0.73 | <0.001 |
| CCI_R | 0.04 ± 0.39 | 0.31 ± 1.34 | <0.001 | ||
| Anti-HTN drugs | 7923 | 17.16 | 41,356 | 22.39 | <0.001 |
| Antidepressants drugs | 2656 | 5.75 | 9752 | 5.28 | <0.001 |
| Anti-CA drugs | 136 | 0.29 | 555 | 0.30 | 0.834 |
| Anti-Parkinson drugs | 302 | 0.65 | 1915 | 1.04 | <0.001 |
| Anti-ulcer drugs | 131 | 0.28 | 228 | 0.12 | <0.001 |
| Muscle spasm drugs | 206 | 0.45 | 701 | 0.38 | 0.041 |
| Decongestant drugs | 389 | 0.84 | 1315 | 0.71 | 0.003 |
| Antihistamines drugs | 1136 | 2.46 | 4499 | 2.44 | 0.762 |
| Anesthetics drugs | 117 | 0.25 | 430 | 0.23 | 0.416 |
| Season | 0.999 | ||||
| Spring (Mar–May) | 11,178 | 24.21 | 44,712 | 24.21 | |
| Summer (Jun–Aug) | 11,339 | 24.55 | 45,356 | 24.55 | |
| Autumn (Sep–Nov) | 12,069 | 26.14 | 48,276 | 26.14 | |
| Winter (Dec–Feb) | 11,593 | 25.10 | 46,372 | 25.10 | |
| Location | <0.001 | ||||
| Northern Taiwan | 15,789 | 34.19 | 74,088 | 40.11 | |
| Middle Taiwan | 12,434 | 26.93 | 51,859 | 28.07 | |
| Southern Taiwan | 14,925 | 32.32 | 47,312 | 25.61 | |
| Eastern Taiwan | 2865 | 6.20 | 10,583 | 5.73 | |
| Outlets islands | 166 | 0.36 | 874 | 0.47 | |
| Urbanization level | <0.001 | ||||
| 1 (The highest) | 16,440 | 35.60 | 63,131 | 34.18 | |
| 2 | 19,802 | 42.88 | 76,262 | 41.29 | |
| 3 | 3440 | 7.45 | 16,404 | 8.88 | |
| 4 (The lowest) | 6497 | 14.07 | 28,919 | 15.66 | |
| Level of care | <0.001 | ||||
| Hospital center | 19,913 | 43.12 | 54,086 | 29.28 | |
| Regional hospital | 20,770 | 44.98 | 55,894 | 30.26 | |
| Local hospital | 5496 | 11.90 | 74,736 | 40.46 | |
| Orbital Fracture | With | Without | p | |||
|---|---|---|---|---|---|---|
| Variables | n | % | n | % | ||
| Total | 46,179 | 20 | 184,716 | 80 | ||
| Dry eye syndrome | 0.001 | |||||
| Without | 46,100 | 99.83 | 184,510 | 99.89 | ||
| With | 79 | 0.17 | 206 | 0.11 | ||
| Gender | 0.999 | |||||
| Male | 33,115 | 71.71 | 132,460 | 71.71 | ||
| Female | 13,064 | 28.29 | 52,256 | 28.29 | ||
| Age (years) | 45.72 ± 19.04 | 49.11 ± 19.25 | <0.001 | |||
| Age group (yrs) | <0.001 | |||||
| 18–29 | 12,414 | 26.88 | 35,791 | 19.38 | ||
| 30–39 | 8152 | 17.65 | 37,077 | 20.07 | ||
| 40–49 | 7360 | 15.94 | 30,221 | 16.36 | ||
| 50–59 | 6801 | 14.73 | 25,180 | 13.63 | ||
| ≥60 | 11,452 | 24.8 | 56,447 | 30.56 | ||
| Insured premium (NT$) | <0.001 | |||||
| <18,000 | 45,279 | 98.05 | 180,980 | 97.98 | ||
| 18,000–34,999 | 699 | 1.51 | 2606 | 1.41 | ||
| ≥35,000 | 201 | 0.44 | 1130 | 0.61 | ||
| Education levels (yrs) | ||||||
| <12 | 46,179 | 100 | 184,716 | 100 | ||
| ≥12 | 0 | 0 | ||||
| DM | 5862 | 12.69 | 33,957 | 18.38 | <0.001 | |
| Hyperlipidemia | 1562 | 3.38 | 16,416 | 8.89 | <0.001 | |
| HTN | 8487 | 18.38 | 49,378 | 26.73 | <0.001 | |
| CKD | 1900 | 4.11 | 20,174 | 10.92 | <0.001 | |
| CAD | 3428 | 7.42 | 32,220 | 17.44 | <0.001 | |
| CHF | 1293 | 2.8 | 13,204 | 7.15 | <0.001 | |
| Stroke | 4408 | 9.55 | 25,696 | 13.91 | <0.001 | |
| COPD | 2803 | 6.07 | 24,213 | 13.11 | <0.001 | |
| CLD | 2847 | 6.17 | 29,364 | 15.9 | <0.001 | |
| Osteoporosis | 239 | 0.52 | 3065 | 1.66 | <0.001 | |
| RA | 104 | 0.23 | 986 | 0.53 | <0.001 | |
| CTD | 98 | 0.21 | 807 | 0.44 | <0.001 | |
| Sarcoidosis | 4 | 0.01 | 30 | 0.02 | 0.287 | |
| Trachoma | 74 | 0.16 | 242 | 0.13 | 0.137 | |
| MS | 8 | 0.02 | 90 | 0.05 | 0.004 | |
| Bell’s palsy | 896 | 1.94 | 569 | 0.31 | <0.001 | |
| Parkinson disease | 468 | 1.01 | 2900 | 1.57 | <0.001 | |
| Blepharitis | 17 | 0.04 | 109 | 0.06 | 0.079 | |
| Hordeolum | 29 | 0.06 | 177 | 0.1 | 0.039 | |
| Glaucoma | 254 | 0.55 | 1354 | 0.73 | <0.001 | |
| CCI_R | 0.04 ± 0.39 | 0.31 ± 1.34 | <0.001 | |||
| Anti-HTN drugs | 7923 | 17.16 | 41,356 | 22.39 | <0.001 | |
| Antidepressants drugs | 2656 | 5.75 | 9752 | 5.28 | <0.001 | |
| Anti-CA drugs | 136 | 0.29 | 555 | 0.3 | 0.834 | |
| Anti-Parkinson drugs | 302 | 0.65 | 1915 | 1.04 | <0.001 | |
| Anti-ulcer drugs | 131 | 0.28 | 228 | 0.12 | <0.001 | |
| Muscle spasm drugs | 206 | 0.45 | 701 | 0.38 | 0.041 | |
| Decongestant drugs | 389 | 0.84 | 1315 | 0.71 | 0.003 | |
| Antihistamines drugs | 1136 | 2.46 | 4499 | 2.44 | 0.762 | |
| Anesthetics drugs | 117 | 0.25 | 430 | 0.23 | 0.416 | |
| Season | <0.001 | |||||
| Spring | 10,654 | 23.07 | 45,045 | 24.39 | ||
| Summer | 11,535 | 24.98 | 48,254 | 26.12 | ||
| Autumn | 12,846 | 27.82 | 47,521 | 25.73 | ||
| Winter | 11,144 | 24.13 | 43,896 | 23.76 | ||
| Location | <0.001 | |||||
| Northern Taiwan | 16,139 | 34.95 | 73,831 | 39.97 | ||
| Middle Taiwan | 12,431 | 26.92 | 52,105 | 28.21 | ||
| Southern Taiwan | 14,703 | 31.84 | 47,128 | 25.51 | ||
| Eastern Taiwan | 2740 | 5.93 | 10,798 | 5.85 | ||
| Outlets islands | 166 | 0.36 | 854 | 0.46 | ||
| Urbanization level | <0.001 | |||||
| 1 (The highest) | 15,777 | 34.16 | 60,659 | 32.84 | ||
| 2 | 19,613 | 42.47 | 78,985 | 42.76 | ||
| 3 | 3537 | 7.66 | 15,702 | 8.5 | ||
| 4 (The lowest) | 7252 | 15.7 | 29,370 | 15.9 | ||
| Level of care | <0.001 | |||||
| Hospital center | 18,198 | 39.41 | 60,196 | 32.59 | ||
| Regional hospital | 20,537 | 44.47 | 70,919 | 38.39 | ||
| Local hospital | 61,045 | 26.44 | 7444 | 16.12 | ||
| Variables | Crude HR | 95% CI | 95% CI | p | Adjusted HR | 95% CI | 95% CI | p |
|---|---|---|---|---|---|---|---|---|
| Orbital fracture (Reference: without) | 4.736 | 3.622 | 6.193 | <0.001 | 4.917 | 3.716 | 6.507 | <0.001 |
| Male (Reference: Female) | 1.614 | 1.273 | 2.046 | <0.001 | 1.523 | 1.187 | 1.954 | |
| Age (Reference: ≥60) | ||||||||
| 18–29 | 2.332 | 1.539 | 3.533 | <0.001 | 3.810 | 2.367 | 6.134 | <0.001 |
| 30–39 | 0.745 | 0.518 | 1.071 | 0.111 | 1.348 | 0.89 | 2.044 | 0.159 |
| 40–49 | 0.869 | 0.615 | 1.228 | 0.427 | 1.400 | 0.953 | 2.055 | 0.086 |
| 50–59 | 1.14 | 0.826 | 1.574 | 0.424 | 1.512 | 1.07 | 2.136 | 0.019 |
| Insured premium (Reference: <18,000) | ||||||||
| 18,000–34,999 | 0.432 | 0.107 | 1.735 | 0.236 | 0.448 | 0.111 | 1.801 | 0.258 |
| ≥35,000 | 2.755 | 1.027 | 7.392 | 0.044 | 3.375 | 1.252 | 9.101 | 0.016 |
| Education levels (years) (Reference: <12) | ||||||||
| Comorbidities (Reference: Without) | ||||||||
| DM | 1.354 | 1.059 | 1.730 | 0.016 | 1.243 | 0.936 | 1.650 | 0.133 |
| Hyperlipidemia | 1.619 | 1.223 | 2.144 | 0.001 | 1.472 | 1.08 | 2.006 | 0.014 |
| HTN | 1.350 | 1.068 | 1.705 | 0.012 | 1.080 | 0.801 | 1.456 | 0.613 |
| CKD | 1.003 | 0.718 | 1.401 | 0.988 | 1.007 | 0.514 | 1.358 | 0.098 |
| CAD | 1.448 | 1.132 | 1.853 | 0.003 | 1.269 | 0.943 | 1.708 | 0.115 |
| CHF | 1.203 | 0.840 | 1.721 | 0.313 | 1.006 | 0.609 | 1.348 | 0.626 |
| Stroke | 1.348 | 1.032 | 1.761 | 0.029 | 1.162 | 0.86 | 1.570 | 0.328 |
| COPD | 1.741 | 1.343 | 2.257 | <0.001 | 1.836 | 1.375 | 2.452 | <0.001 |
| CLD | 1.126 | 0.854 | 1.486 | 0.399 | 1.172 | 0.875 | 1.570 | 0.288 |
| Osteoporosis | 2.801 | 1.759 | 4.462 | <0.001 | 1.993 | 1.211 | 3.280 | 0.007 |
| RA | 5.576 | 3.195 | 9.730 | <0.001 | 2.577 | 1.383 | 4.800 | 0.003 |
| CTD | 11.640 | 7.530 | 17.993 | <0.001 | 6.600 | 3.999 | 10.894 | <0.001 |
| Sarcoidosis | 0.000 | - | - | 0.84 | 0.000 | - | - | 0.979 |
| Trachoma | 0.000 | - | - | 0.577 | 0.000 | - | - | 0.955 |
| MS | 11.569 | 2.879 | 46.492 | 0.001 | 8.064 | 1.938 | 33.556 | 0.004 |
| Bell’s palsy | 3.719 | 1.756 | 7.874 | 0.001 | 2.192 | 1.028 | 4.674 | 0.042 |
| Parkinson disease | 1.959 | 1.145 | 3.353 | 0.014 | 1.778 | 1.026 | 3.081 | 0.04 |
| Blepharitis | 7.655 | 1.905 | 30.763 | 0.004 | 6.246 | 1.542 | 25.300 | 0.01 |
| Hordeolum | 8.100 | 3.018 | 21.740 | <0.001 | 5.734 | 2.055 | 16.003 | 0.001 |
| Glaucoma | 6.067 | 3.808 | 9.666 | <0.001 | 4.960 | 3.071 | 8.009 | <0.001 |
| CCI_R | 1.008 | 0.838 | 1.142 | 0.782 | 1.050 | 0.912 | 1.208 | 0.496 |
| Medications (Reference: Without) | ||||||||
| Anti-HTN drugs | 1.453 | 0.88 | 1.979 | 0.546 | 1.210 | 0.797 | 1.871 | 0.514 |
| Antidepressants drugs | 1.103 | 0.794 | 1.29 | 0.464 | 1.092 | 0.722 | 1.238 | 0.478 |
| Anti-CA drugs | 0.981 | 0.357 | 1.599 | 0.785 | 0.946 | 0.332 | 1.524 | 0.762 |
| Anti-Parkinson drugs | 1.584 | 0.877 | 2.601 | 0.578 | 1.423 | 0.758 | 2.34 | 0.588 |
| Anti-ulcer drugs | 0.300 | 2.990 | 0.876 | 1.678 | 0.245 | 2.593 | 0.835 | |
| Muscle spasm drugs | 1.121 | 0.599 | 1.867 | 0.351 | 1.104 | 0.532 | 1.82 | 0.333 |
| Decongestant drugs | 1.266 | 0.451 | 2.384 | 0.623 | 1.298 | 0.489 | 2.415 | 0.601 |
| Antihistamines drugs | 1.986 | 0.230 | 4.350 | 0.927 | 1.834 | 0.202 | 4.030 | 0.911 |
| Anesthetics drugs | 0.989 | 0.149 | 2.846 | 0.933 | 1.006 | 0.164 | 3.000 | 0.976 |
| Season (Reference: Spring) | ||||||||
| Summer | 0.781 | 0.566 | 1.079 | 0.134 | 0.752 | 0.544 | 1.039 | 0.084 |
| Autumn | 0.686 | 0.495 | 0.951 | 0.024 | 0.641 | 0.462 | 0.890 | 0.008 |
| Winter | 0.841 | 0.609 | 1.163 | 0.296 | 0.828 | 0.599 | 1.145 | 0.254 |
| Location (Reference: Northern Taiwan) | ||||||||
| Middle Taiwan | 0.671 | 0.494 | 0.913 | 0.011 | Multicollinearity with urbanization level | |||
| Southern Taiwan | 0.890 | 0.667 | 1.188 | 0.429 | Multicollinearity with urbanization level | |||
| Eastern Taiwan | 1.324 | 0.882 | 1.987 | 0.176 | Multicollinearity with urbanization level | |||
| Outlets islands | 0 | - | - | 0.912 | Multicollinearity with urbanization level | |||
| Urbanization level (Reference: 4) | ||||||||
| 1 (The highest) | 1.564 | 1.088 | 2.248 | 0.016 | 1.181 | 0.801 | 1.740 | 0.401 |
| 2 | 1.501 | 1.024 | 2.202 | 0.037 | 1.026 | 0.587 | 1.796 | 0.927 |
| 3 | 1.071 | 0.616 | 1.863 | 0.807 | 1.011 | 0.655 | 1.560 | 0.960 |
| Level of care (Reference: Local hospital) | ||||||||
| Hospital center | 2.537 | 1.753 | 3.671 | <0.001 | 2.776 | 1.830 | 4.213 | <0.001 |
| Regional hospital | 1.646 | 1.134 | 2.390 | 0.009 | 1.723 | 1.178 | 2.521 | 0.005 |
| Orbital Fracture Stratified | With | Without (Reference) | With vs. Without (Reference) | |||||||
|---|---|---|---|---|---|---|---|---|---|---|
| Events | PYs | Rate (per 105 PYs) | Events | PYs | Rate (per 105 PYs) | Adjusted HR | 95% CI | 95% CI | p | |
| Total | 79 | 475,088.93 | 16.63 | 206 | 1,985,645.35 | 10.37 | 4.917 | 3.716 | 6.507 | <0.001 |
| Gender | ||||||||||
| Male | 44 | 335,656.21 | 13.11 | 118 | 1,409,299.03 | 8.37 | 4.803 | 3.629 | 6.356 | <0.001 |
| Female | 35 | 139,432.71 | 25.10 | 88 | 576,346.32 | 15.27 | 5.043 | 3.811 | 6.674 | <0.001 |
| Age (yrs) | ||||||||||
| 18–29 | 19 | 55,747.48 | 34.08 | 16 | 90,383.93 | 17.70 | 5.906 | 4.463 | 7.816 | <0.001 |
| 30–39 | 11 | 92,878.70 | 11.84 | 28 | 376,713.68 | 7.43 | 4.888 | 3.694 | 6.468 | <0.001 |
| 40–49 | 11 | 79,470.94 | 13.84 | 30 | 355,420.38 | 8.44 | 5.031 | 3.802 | 6.657 | <0.001 |
| 50–59 | 18 | 80,902.99 | 22.25 | 40 | 330,681.83 | 12.10 | 5.643 | 4.264 | 7.467 | <0.001 |
| ≥60 | 20 | 166,088.82 | 12.04 | 92 | 832,445.53 | 11.05 | 3.343 | 2.526 | 4.423 | <0.001 |
| Insured premium (NT$) | ||||||||||
| <18,000 | 77 | 465,576.68 | 16.54 | 202 | 1,943,410.70 | 10.39 | 4.881 | 3.689 | 6.459 | <0.001 |
| 18,000–34,999 | 0 | 7798.00 | 0.00 | 2 | 31,835.37 | 6.28 | 0.000 | - | - | 0.979 |
| ≥35,000 | 2 | 1714.24 | 116.67 | 2 | 10,399.29 | 19.23 | 18.610 | 14.064 | 24.627 | <0.001 |
| Education levels (yrs) | ||||||||||
| <12 | 46 | 248,072.48 | 18.54 | 138 | 1,045,925.08 | 13.19 | 4.311 | 3.258 | 5.705 | <0.001 |
| ≥12 | 33 | 227,016.45 | 14.54 | 68 | 939,720.27 | 7.24 | 6.163 | 4.657 | 8.155 | <0.001 |
| DM | ||||||||||
| Without | 49 | 362,152.29 | 13.53 | 128 | 1,434,066.93 | 8.93 | 4.650 | 3.514 | 6.154 | <0.001 |
| With | 30 | 112,936.64 | 26.56 | 78 | 551,578.42 | 14.14 | 5.763 | 4.355 | 7.626 | <0.001 |
| Hyperlipidemia | ||||||||||
| Without | 62 | 431,204.03 | 14.38 | 152 | 1,687,032.31 | 9.01 | 4.896 | 3.700 | 6.478 | <0.001 |
| With | 17 | 43,884.89 | 38.74 | 54 | 298,613.04 | 18.08 | 6.572 | 4.966 | 8.696 | <0.001 |
| HTN | ||||||||||
| Without | 54 | 305,101.23 | 17.70 | 129 | 1,147,122.95 | 11.25 | 4.828 | 3.649 | 6.389 | <0.001 |
| With | 25 | 169,987.70 | 14.71 | 77 | 838,522.40 | 9.18 | 4.913 | 3.713 | 6.502 | <0.001 |
| CKD | ||||||||||
| Without | 69 | 433,018.39 | 15.93 | 172 | 1,700,934.97 | 10.11 | 4.834 | 3.653 | 6.397 | <0.001 |
| With | 10 | 42,070.54 | 23.77 | 34 | 284,710.38 | 11.94 | 6.106 | 4.614 | 8.080 | <0.001 |
| CAD | ||||||||||
| Without | 59 | 391,342.67 | 15.08 | 137 | 1,463,436.21 | 9.36 | 4.940 | 3.733 | 6.538 | <0.001 |
| With | 20 | 83,746.26 | 23.88 | 69 | 522,209.14 | 13.21 | 5.545 | 4.190 | 7.337 | <0.001 |
| CHF | ||||||||||
| Without | 71 | 444,230.54 | 15.98 | 177 | 1,781,171.96 | 9.94 | 4.934 | 3.729 | 6.529 | <0.001 |
| With | 8 | 30,858.39 | 25.92 | 29 | 204,473.39 | 14.18 | 5.608 | 4.238 | 7.420 | <0.001 |
| Stroke | ||||||||||
| Without | 57 | 381,249.02 | 14.95 | 150 | 1,591,558.41 | 9.42 | 4.866 | 3.678 | 6.440 | <0.001 |
| With | 22 | 93,839.91 | 23.44 | 56 | 394,086.94 | 14.21 | 5.061 | 3.825 | 6.697 | <0.001 |
| COPD | ||||||||||
| Without | 59 | 410,992.47 | 14.36 | 142 | 1,623,732.70 | 8.75 | 5.036 | 3.805 | 6.664 | <0.001 |
| With | 20 | 64,096.46 | 31.20 | 64 | 361,912.64 | 17.68 | 5.413 | 4.091 | 7.163 | <0.001 |
| CLD | ||||||||||
| Without | 59 | 404,963.89 | 14.57 | 153 | 1,568,057.99 | 9.76 | 4.581 | 3.462 | 6.061 | <0.001 |
| With | 20 | 70,125.04 | 28.52 | 53 | 417,587.35 | 12.69 | 6.894 | 5.209 | 9.122 | <0.001 |
| Osteoporosis | ||||||||||
| Without | 73 | 468,938.39 | 15.57 | 188 | 1,934,814.70 | 9.72 | 4.915 | 3.714 | 6.504 | <0.001 |
| With | 6 | 6150.54 | 97.55 | 18 | 50,830.65 | 35.41 | 8.451 | 6.386 | 11.183 | <0.001 |
| RA | ||||||||||
| Without | 77 | 472,765.82 | 16.29 | 198 | 1,968,579.60 | 10.06 | 4.968 | 3.754 | 6.574 | <0.001 |
| With | 2 | 2323.11 | 86.09 | 8 | 17,065.75 | 46.88 | 5.634 | 4.258 | 7.455 | <0.001 |
| CTD | ||||||||||
| Without | 73 | 472,713.12 | 15.44 | 191 | 1,971,480.28 | 9.69 | 4.890 | 3.695 | 6.471 | <0.001 |
| With | 6 | 2375.81 | 252.55 | 15 | 14,165.06 | 105.89 | 7.316 | 5.529 | 9.681 | <0.001 |
| Sarcoidosis | ||||||||||
| Without | 79 | 474,923.46 | 16.63 | 204 | 1,985,048.07 | 10.28 | 4.965 | 3.752 | 6.571 | <0.001 |
| With | 0 | 165.47 | 0.00 | 2 | 597.28 | 334.85 | 0.000 | - | - | 0.976 |
| Trachoma | ||||||||||
| Without | 79 | 472,879.08 | 16.71 | 205 | 1,981,210.18 | 10.35 | 4.953 | 3.743 | 6.554 | <0.001 |
| With | 0 | 2209.85 | 0.00 | 1 | 4435.17 | 22.55 | 0.000 | - | - | 0.989 |
| MS | ||||||||||
| Without | 78 | 474,990.41 | 16.42 | 205 | 1,984,386.50 | 10.33 | 4.876 | 3.685 | 6.453 | <0.001 |
| With | 1 | 98.52 | 1015.01 | 1 | 1258.85 | 79.44 | 39.198 | 29.622 | 51.870 | <0.001 |
| Bell’s palsy | ||||||||||
| Without | 75 | 462,955.91 | 16.20 | 204 | 1,975,921.80 | 10.32 | 4.814 | 3.638 | 6.370 | <0.001 |
| With | 4 | 12,133.02 | 32.97 | 2 | 9723.55 | 20.57 | 4.917 | 3.716 | 6.507 | <0.001 |
| Parkinson disease | ||||||||||
| Without | 76 | 464,221.80 | 16.37 | 199 | 1,935,404.09 | 10.28 | 4.885 | 3.691 | 6.464 | <0.001 |
| With | 3 | 10,867.13 | 27.61 | 7 | 50,241.26 | 13.93 | 6.078 | 4.593 | 8.043 | <0.001 |
| Blepharitis | ||||||||||
| Without | 76 | 474,816.42 | 16.01 | 204 | 1,983,792.45 | 10.28 | 4.775 | 3.608 | 6.319 | <0.001 |
| With | 3 | 272.51 | 1100.88 | 2 | 1852.90 | 107.94 | 31.288 | 23.644 | 41.403 | <0.001 |
| Hordeolum | ||||||||||
| Without | 76 | 474,256.27 | 16.03 | 202 | 1,982,298.80 | 10.19 | 4.824 | 3.646 | 6.384 | <0.001 |
| With | 3 | 832.66 | 360.29 | 4 | 3346.55 | 119.53 | 9.247 | 6.988 | 12.237 | <0.001 |
| Glaucoma | ||||||||||
| Without | 76 | 470,302.16 | 16.16 | 198 | 1,962,759.09 | 10.09 | 4.914 | 3.714 | 6.503 | <0.001 |
| With | 3 | 4786.77 | 62.67 | 8 | 22,886.26 | 34.96 | 5.500 | 4.156 | 7.278 | <0.001 |
| Anti-HTN drugs | ||||||||||
| Without | 56 | 393,561.26 | 14.23 | 139 | 1,541,068.35 | 9.02 | 4.840 | 3.657 | 6.404 | <0.001 |
| With | 23 | 81,527.67 | 28.21 | 67 | 444,577.00 | 15.07 | 5.743 | 4.340 | 7.599 | <0.001 |
| Antidepressants drugs | ||||||||||
| Without | 50 | 447,758.69 | 11.17 | 144 | 1,880,811.35 | 7.66 | 4.474 | 3.381 | 5.921 | <0.001 |
| With | 29 | 27,330.24 | 106.11 | 62 | 104,834.00 | 59.14 | 5.504 | 4.159 | 7.283 | <0.001 |
| Anti-CA drugs | ||||||||||
| Without | 66 | 473,689.49 | 13.93 | 166 | 1,979,679.10 | 8.39 | 5.097 | 3.852 | 6.745 | <0.001 |
| With | 13 | 1399.44 | 928.94 | 40 | 5966.25 | 670.44 | 4.251 | 3.212 | 5.625 | <0.001 |
| Anti-Parkinson drugs | ||||||||||
| Without | 53 | 471,981.35 | 11.23 | 127 | 1,965,059.10 | 6.46 | 5.330 | 4.028 | 7.053 | <0.001 |
| With | 26 | 3107.58 | 836.66 | 79 | 20,586.25 | 383.75 | 6.688 | 5.054 | 8.851 | <0.001 |
| Anti-ulcer drugs | ||||||||||
| Without | 61 | 473,740.94 | 12.88 | 187 | 1,983,194.35 | 9.43 | 4.189 | 3.166 | 5.544 | <0.001 |
| With | 18 | 1347.99 | 1335.32 | 19 | 2451.00 | 775.19 | 5.284 | 3.993 | 6.993 | <0.001 |
| Muscle spasm drugs | ||||||||||
| Without | 70 | 472,969.19 | 14.80 | 188 | 1,978,109.60 | 9.50 | 4.777 | 3.610 | 6.322 | <0.001 |
| With | 9 | 2119.74 | 424.58 | 18 | 7535.75 | 238.86 | 5.453 | 4.121 | 7.216 | <0.001 |
| Decongestant drugs | ||||||||||
| Without | 61 | 471,086.12 | 12.95 | 171 | 1,971,509.10 | 8.67 | 4.580 | 3.461 | 6.060 | <0.001 |
| With | 18 | 4002.81 | 449.68 | 35 | 14,136.25 | 247.59 | 5.572 | 4.211 | 7.373 | <0.001 |
| Antihistamines drugs | ||||||||||
| Without | 65 | 463,399.49 | 14.03 | 173 | 1,937,281.10 | 8.93 | 4.819 | 3.641 | 6.376 | <0.001 |
| With | 14 | 11,689.44 | 119.77 | 33 | 48,364.25 | 68.23 | 5.385 | 4.069 | 7.126 | <0.001 |
| Anesthetics drugs | ||||||||||
| Without | 59 | 473,885.00 | 12.45 | 164 | 1,981,022.85 | 8.28 | 4.614 | 3.486 | 6.105 | <0.001 |
| With | 20 | 1203.93 | 1661.23 | 42 | 4622.50 | 908.60 | 5.609 | 4.239 | 7.422 | <0.001 |
| Season | ||||||||||
| Spring | 25 | 105,038.76 | 23.80 | 56 | 462,940.42 | 12.10 | 6.036 | 4.561 | 7.987 | <0.001 |
| Summer | 18 | 121,136.73 | 14.86 | 51 | 508,305.36 | 10.03 | 4.543 | 3.433 | 6.012 | <0.001 |
| Autumn | 13 | 137,573.52 | 9.45 | 48 | 548,918.18 | 8.74 | 3.315 | 2.505 | 4.387 | <0.001 |
| Winter | 23 | 111,339.92 | 20.66 | 51 | 465,481.39 | 10.96 | 5.784 | 4.371 | 7.654 | <0.001 |
| Urbanization level | ||||||||||
| 1 (The highest) | 29 | 135,162.15 | 21.46 | 55 | 589,023.47 | 9.34 | 7.049 | 5.327 | 9.328 | <0.001 |
| 2 | 21 | 203,152.89 | 10.34 | 53 | 868,522.96 | 6.10 | 5.197 | 3.927 | 6.877 | <0.001 |
| 3 | 15 | 44,460.22 | 33.74 | 44 | 171,456.22 | 25.66 | 4.033 | 3.048 | 5.337 | <0.001 |
| 4 (The lowest) | 14 | 92,313.67 | 15.17 | 54 | 356,642.70 | 15.14 | 3.073 | 2.322 | 4.066 | <0.001 |
| Level of care | ||||||||||
| Hospital center | 35 | 140,015.22 | 25.00 | 80 | 637,196.38 | 12.55 | 6.108 | 4.616 | 8.083 | <0.001 |
| Regional hospital | 29 | 224,241.18 | 12.93 | 75 | 899,300.83 | 8.34 | 4.757 | 3.595 | 6.295 | <0.001 |
| Local hospital | 15 | 110,832.53 | 13.53 | 51 | 449,148.13 | 11.35 | 3.656 | 2.763 | 4.839 | <0.001 |
| Subgroup | Populations | Events | PYs | Rate (per 105 PYs) | Adjusted HR | 95% CI | 95% CI | p | Adjusted HR | 95% CI | 95% CI | p | |
|---|---|---|---|---|---|---|---|---|---|---|---|---|---|
| Without orbital fracture | 184,716 | 206 | 1,985,645.35 | 10.37 | Reference | ||||||||
| With orbital fracture | 46,179 | 79 | 475,088.93 | 16.63 | 4.917 | 3.716 | 6.507 | <0.001 | |||||
| Surgery | Without surgery | 23,007 | 37 | 236,003.86 | 15.68 | 4.718 | 3.276 | 6.796 | <0.001 | Reference | |||
| With surgery | 23,172 | 42 | 239,085.07 | 17.57 | 5.113 | 3.596 | 7.269 | <0.001 | 1.097 | 0.700 | 1.720 | 0.685 | |
| Orbital fracture subtypes | Orbital floor fracture | 10,165 | 12 | 102,987.71 | 11.65 | 3.034 | 1.668 | 5.519 | <0.001 | Reference | |||
| Orbital roof fracture | 36,014 | 67 | 372,101.21 | 18.01 | 5.534 | 4.114 | 7.443 | <0.001 | 1.566 | 0.841 | 2.915 | 0.157 | |
| Surgery × Orbital fracture subtypes | Orbital floor fracture, without surgery | 2125 | 1 | 20,540.24 | 4.87 | 1.431 | 0.200 | 10.238 | 0.721 | Reference | |||
| Orbital roof fracture, without surgery | 20,882 | 36 | 215,463.62 | 16.71 | 5.073 | 3.507 | 7.337 | <0.001 | 3.423 | 0.468 | 25.049 | 0.226 | |
| Orbital floor fracture, with surgery | 8040 | 11 | 82,447.49 | 13.34 | 3.401 | 1.820 | 6.356 | <0.001 | 2.664 | 0.342 | 20.733 | 0.349 | |
| Orbital roof fracture, with surgery | 15,132 | 31 | 156,637.59 | 19.79 | 6.209 | 4.175 | 9.234 | <0.001 | 3.977 | 0.542 | 29.276 | 0.175 |
Publisher’s Note: MDPI stays neutral with regard to jurisdictional claims in published maps and institutional affiliations. |
© 2021 by the authors. Licensee MDPI, Basel, Switzerland. This article is an open access article distributed under the terms and conditions of the Creative Commons Attribution (CC BY) license (https://creativecommons.org/licenses/by/4.0/).
Share and Cite
Hsu, C.Y.-Y.; Tu, J.C.-Y.; Chung, C.-H.; Sun, C.-A.; Chien, W.-C.; Lin, H.-T. Risk of Dry Eye Syndrome in Patients with Orbital Fracture: A Nationwide Population-Based Cohort Study. Healthcare 2021, 9, 605. https://doi.org/10.3390/healthcare9050605
Hsu CY-Y, Tu JC-Y, Chung C-H, Sun C-A, Chien W-C, Lin H-T. Risk of Dry Eye Syndrome in Patients with Orbital Fracture: A Nationwide Population-Based Cohort Study. Healthcare. 2021; 9(5):605. https://doi.org/10.3390/healthcare9050605
Chicago/Turabian StyleHsu, Cindy Yi-Yu, Junior Chun-Yu Tu, Chi-Hsiang Chung, Chien-An Sun, Wu-Chien Chien, and Hsin-Ting Lin. 2021. "Risk of Dry Eye Syndrome in Patients with Orbital Fracture: A Nationwide Population-Based Cohort Study" Healthcare 9, no. 5: 605. https://doi.org/10.3390/healthcare9050605
APA StyleHsu, C. Y.-Y., Tu, J. C.-Y., Chung, C.-H., Sun, C.-A., Chien, W.-C., & Lin, H.-T. (2021). Risk of Dry Eye Syndrome in Patients with Orbital Fracture: A Nationwide Population-Based Cohort Study. Healthcare, 9(5), 605. https://doi.org/10.3390/healthcare9050605