Article

Low Back Pain in Elderly from Belém-Pa, Brazil: Prevalence and Association with Functional Disability

by
Elaine Miyuka Sato
1,2,*,
Mauricio Oliveira Magalhães
3,
Beatriz Coelho Jenkins
1,
Lays da Silva Ferreira
3,
Hallyson Andrey Raposo da Silva
1,
Paulo Renan Farias Furtado
1,
Eder Gabriel Soares Ferreira
1,
Emmanuele Celina Souza dos Santos
1,
Bianca Callegari
2,3 and
Amélia Pasqual Marques
4
1
Faculty of Physical and Occupational Therapy, Institute of Health Sciences, Federal University of Pará, Belém-Pará 66075-110, Brazil
2
Laboratory of Human Motricity Sciences, Federal University of Pará, Belém-Pará 66050-160, Brazil
3
Master’s Program in Human Movement Sciences, Federal University of Pará, Belém-Pará 66050-160, Brazil
4
Department of Physiotherapy, Speech Therapy and Occupational Therapy, Faculty of Medicine, University of São Paulo, São Paulo 05508-060, Brazil
*
Author to whom correspondence should be addressed.
Healthcare 2021, 9(12), 1658; https://doi.org/10.3390/healthcare9121658
Submission received: 5 October 2021 / Revised: 29 October 2021 / Accepted: 1 November 2021 / Published: 30 November 2021
(This article belongs to the Collection Healthcare Strategy and Community Care)

Abstract

:
Background: This cross-sectional study aimed to determine the prevalence of low back pain (LBP) in the elderly population living in Belém-Pará and to assess the spectrum of problems related to these diseases including the demographic, socioeconomic, occupational characteristics and disability in this population. Methods: Three structured questionnaires were applied in a randomly selected representative sample of 512 elderly people aged ≥60 years. Results: LBP prevalence in the elderly population was 55.7%. Among then, 56.1% had pain at the time of the interview (punctual prevalence), 91.7% had LBP in the last 365 days (prevalence in the last year), and 85.3% at some point in life (prevalence at some point in life). Overall, most studies are above average. LBP was positively associated with hypertension and the influence of the physical and mental health on their social activities ranged from slightly to extreme. LBP was negatively associated with characteristics, such as education (over 11 years), class A or B income, physical activity, high satisfaction with previous work, and excellent self-perceived health, corroborating to the literature. Conclusions: Greater intensity of pain and functional disability were associated with the presence of comorbidities, smoking habits, and low physical activity. LBP prevalence was high, above the national average, mainly affecting the underprivileged classes related to several modifiable factors, highlighting the importance of preventive and interventionist actions for healthy aging.

1. Introduction

Low back pain (LBP) is defined as pain or discomfort in the region below the costal margin and above the lower gluteal folds, with or without referred leg pain, which may be acute, subacute, or chronic. Nonspecific LBP is the most common type, with no relation to a known cause or pathology [1].
LBP is the main cause of disability worldwide and is associated with high costs for the health systems and for the individuals affected by direct costs, such as medical, diagnostic, and medication services, in addition to indirect costs reflected in reduced productivity and greater absenteeism at work [2].
Brazil has the second most prevalent chronic condition behind systemic arterial hypertension, and one of the main causes of interference in the quality of life, resulting in a significant increase in years lived with disabilities. The occurrence of such a condition accompanies population aging, directly correlated to it, since the physiological decline in the aging process makes the elderly more prone to chronic health conditions. Some LBP-related factors cannot be modified (e.g., gender, genetics), but others are modifiable (lifestyle and comorbidities) [3,4,5].
A recent systematic review has shown that there is a notable lack of studies with good methodological designs, using validated questionnaires capable of measuring the LBP prevalence in the Brazilian population. Most of them present a significant limitation, mainly in their methodological design related to external and internal validity, with a moderate to high risk of bias [6].
In the case of the elderly population, another systematic review with meta-analysis covered all studies conducted up to 2015 in Brazil, totaling only 16 studies covering cities in the Northeast, Midwest, South, and Southeast regions, highlighting the lack of studies in the northern region [7]. Recently, the first study including the North region was conducted in the older adult population in an Amazonia Brazilian community [8].
Despite being the second largest metropolitan city in the North Region of Brazil, with 2,275,032 inhabitants [3], there are no studies to date reporting the LBP prevalence in the elderly population in the city of Belém, PA.
Given the importance of the region’s representativeness (whereas Brazil is a country of continental dimension with great variability of population profile), the present study aimed to estimate the LBP prevalence in the elderly population living in the city of Belém-PA, in addition to substantiating demographic, socioeconomic, and occupational characteristics and disability related to LBP.

2. Methods

This epidemiological cross-sectional study was approved by the Ethics Committee of the Faculty of Medicine of the University of São Paulo, Brazil (#1581420). A total of 512 elderly volunteers, who signed the consent form, participated in the survey, in a convenience sample, through a structured interview in the municipality and metropolitan region of Belém, PA.

2.1. Participants and Sample Size
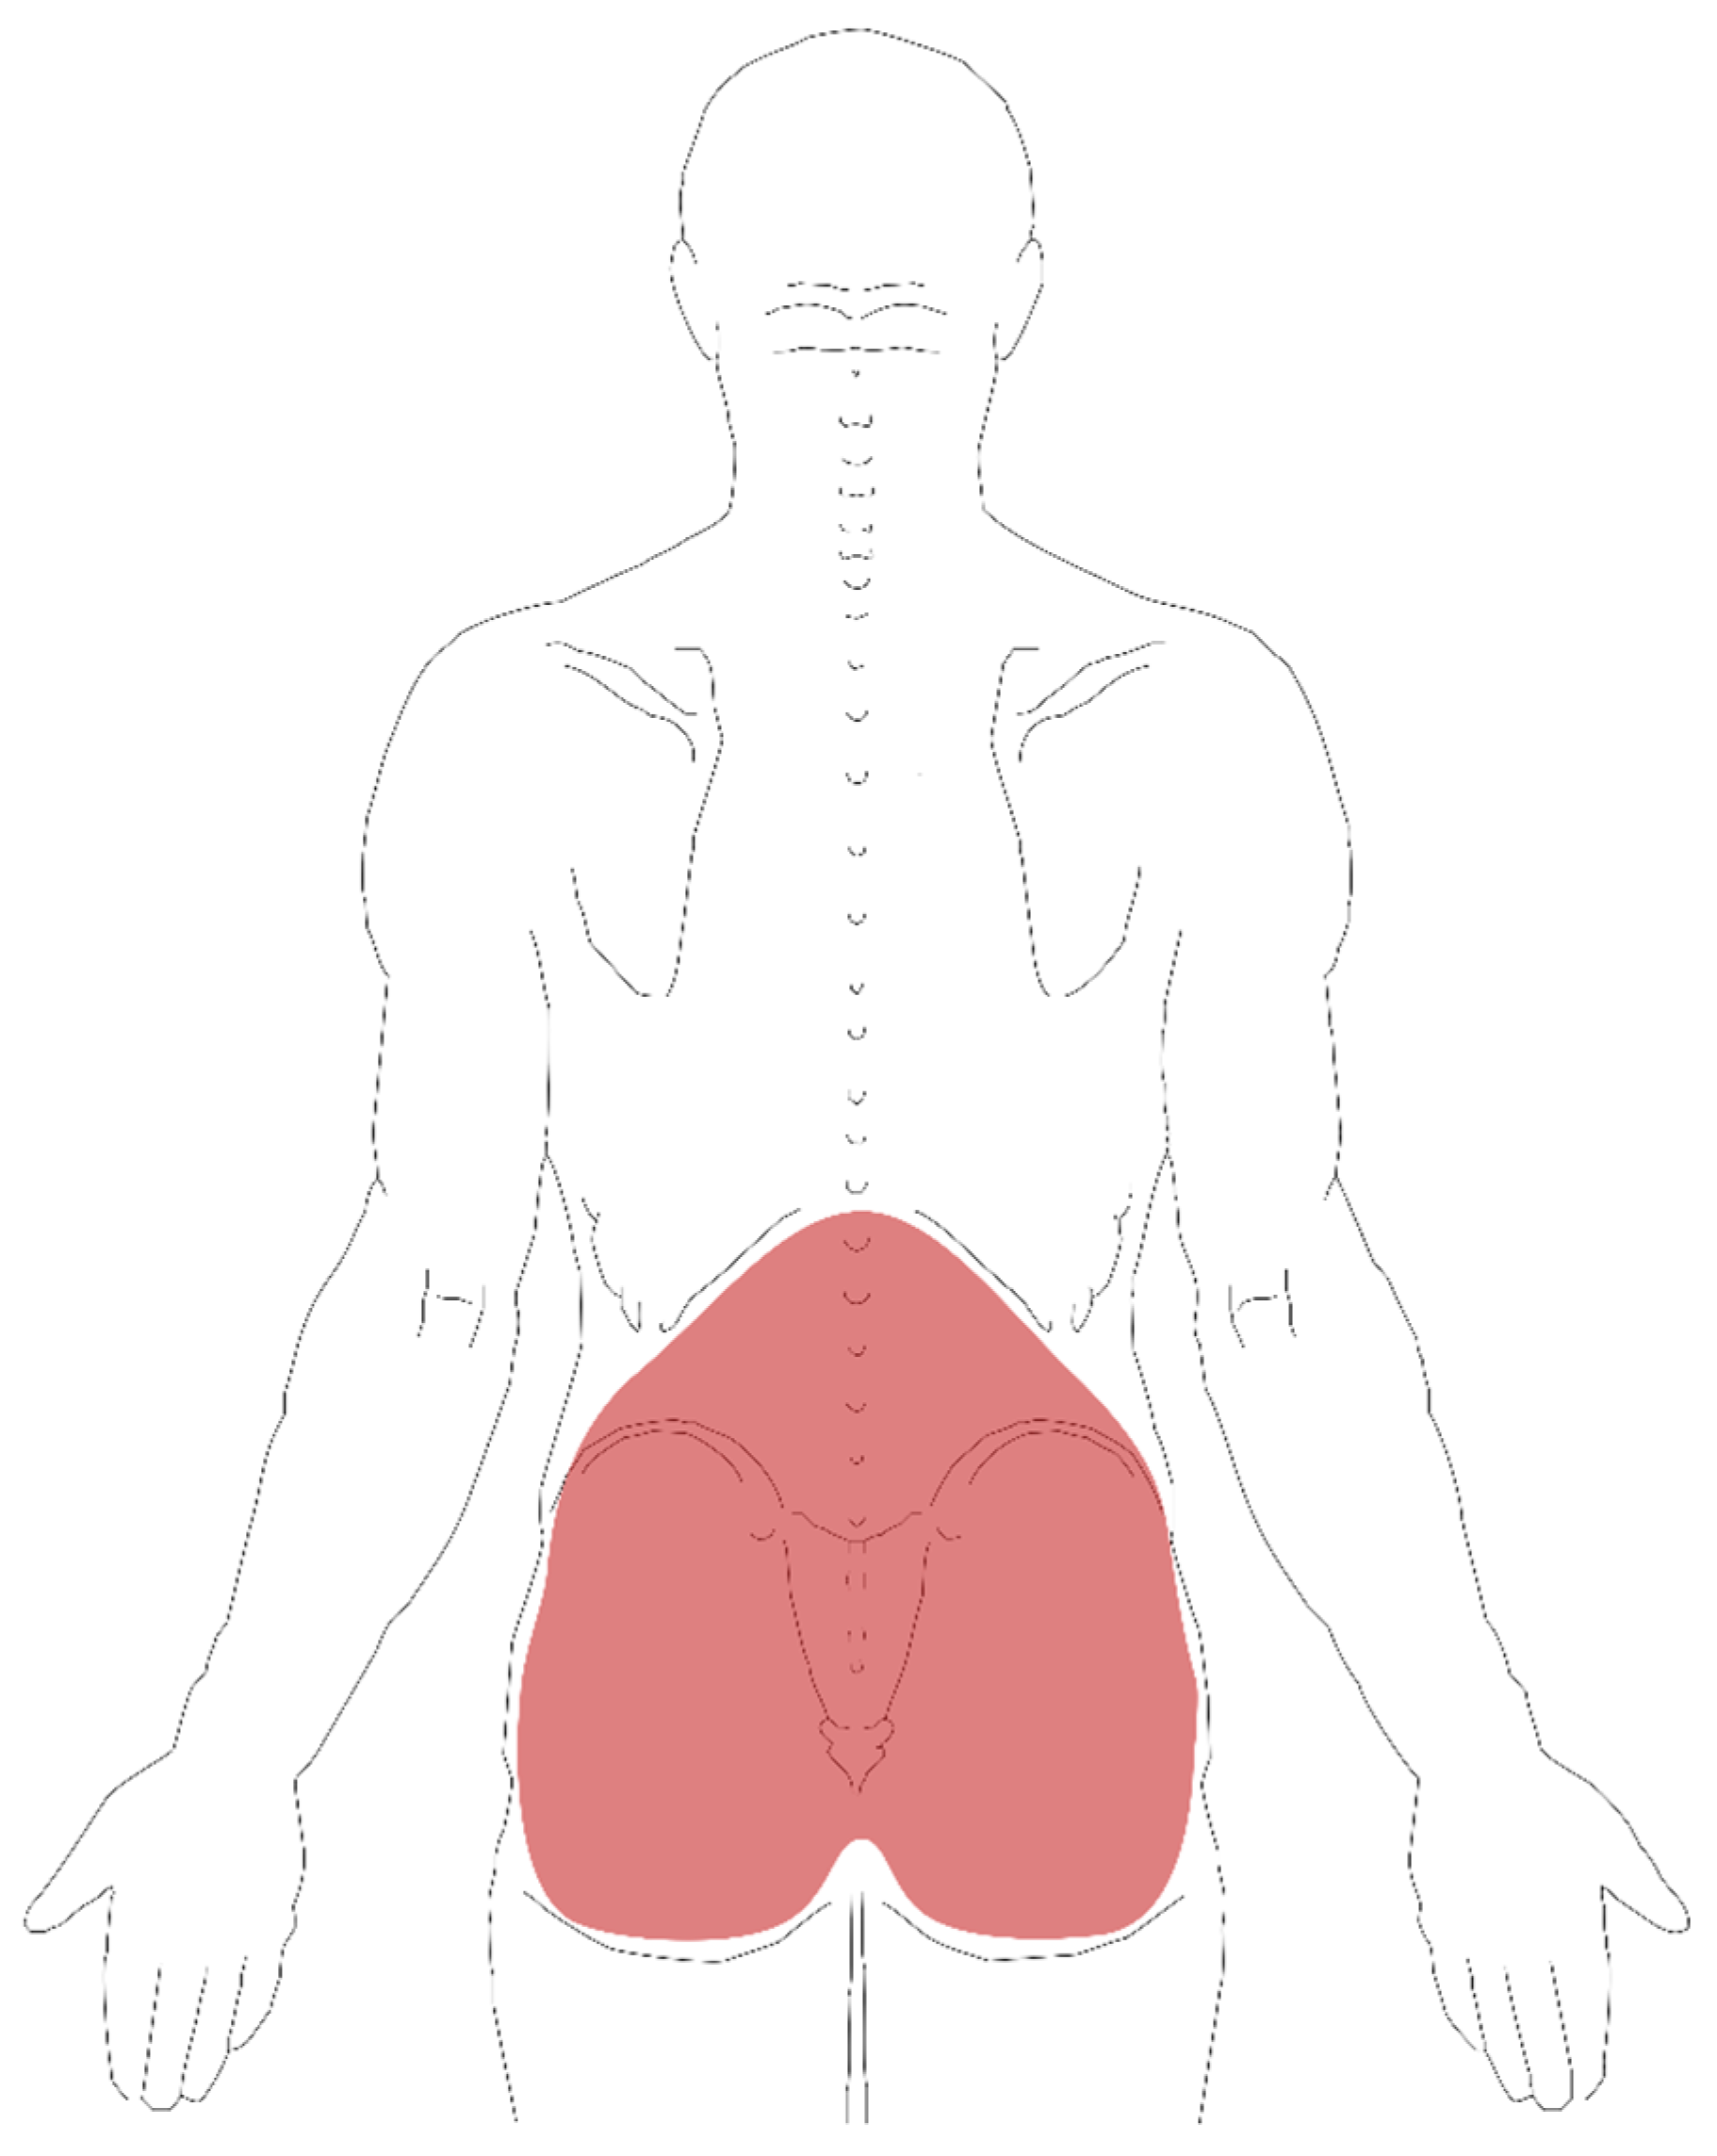
The population of this study was composed of elders of the municipality and metropolitan region of Belém, Pará, Brazil, aged 60 years or older, of both genders, without cognitive impairments to limit understanding and answering the questionnaire in Portuguese. The sample was enrolled by convenience and participants were excluded if they were unable to understand the questions presented; refused to sign the free and informed consent form; or had a self-reported clinical diagnosis of a serious condition in the spine, such as cancer, vertebral infection, vertebral compression fractures, cauda equina syndrome, ankylosing spondylitis, or neurodegenerative diseases [9].
For the sample size, the parameters used were the total elderly population in the city of Belém (N = 128,720) and average LBP global prevalence adjusted in the last month of 23.2% (p = 0.232) [10], 4% accuracy (p = 0.04), 95% confidence interval (z = 1.96), and maximum sample loss of 20%. Thus, the estimated population was 512 individuals.

2.2. Procedures

The assessment was administered through a structured interview based on three questionnaires, from May 2017 to May 2018, with questions being applied by a group of previously trained researchers. All scales and questionnaires used, which are described below, were translated and adapted to Brazilian Portuguese and their clinimetric properties tested [11,12,13].
To apply the questionnaires, the Google Forms survey administration application was used as part of the Google Drive office suite. Initially, the demographic, socioeconomic, anthropometric, behavioral, and occupational data of the participants were surveyed. The demographic, anthropometric, and socioeconomic variables recorded were gender, age, marital status, weight, height, body mass index (BMI), education level, and economic class.
Regarding the behavioral variables, the level of physical activity was assessed using the International Physical Activity Questionnaire short version [14], which classifies the level of physical activity by considering the frequency, duration, and intensity, stratifying the individual into sedentary (no physical activity for 10 continuous minutes), insufficiently active (light activities lasting 10 min for 5 days a week), active (moderate activities lasting more than 20 min for 3 to 5 days a week), and very active (vigorous activities lasting more than 30 min and for more than 5 days a week) [15]. In addition, smoking was also considered, dividing respondents into non-smokers (those who never smoked), ex-smokers (those who quit more than a year ago), and current smokers (those who consumed any number of cigarettes per day) [16].
Regarding occupational characteristics, we asked about satisfaction in previous jobs, considering those satisfied who felt well fulfilled in their profession and those dissatisfied who did not feel fulfilled at work, and whether the elderly still performed any work at the time of the interview. In the second questionnaire, the volunteers answered if they had LBP in any of three different periods: at the time of the interview (punctual), in the last 365 days (last year), and at any time in life (some time in life). For the purpose of conceptual standardization, participants received an illustrative figure of the human body, specifying the lumbar region (Figure 1) and were instructed to consider an episode of pain “any pain between the last rib and the bottom of the buttocks lasting more than 24 h, preceded by 30 days without pain” [17]. In the affirmative answers, information was also collected on frequency, intensity, duration, and irradiation of pain to the leg [10], in addition to the average pain intensity, quantified using the numeric rating scale (NRS), a scale of 11 points, ranging from 0 to 10, with zero indicating no pain and 10 the worst pain imaginable [13,17].
Finally, in a third questionnaire, the participants who reported pain were given the Roland–Morris disability questionnaire [12,18,19], composed of 24 items that describe everyday situations in which the subjects may have difficulty performing because of LBP. Each affirmative answer corresponds to a point, and the final score ranges from 0 (the absence of disability) to 24 (severe disability).

2.3. Statistical Analysis

The quantitative variables were expressed by the mean and standard deviation, and the qualitative variables were expressed as absolute frequency and percentage. To verify the association between qualitative variables, univariate logistic regression was used to express the effect of the odds ratio (OR). For the comparison of quantitative variables between the two groups, the Student t-test or Mann–Whitney test was used depending on the assumption of normality of the data, and in cases of three or more groups, ANOVA (assumption of normality) or the Kruskal–Wallis test (non-parametric). If there was significance in any of these tests, a comparison was made in pairs to determine which groups differed by Turkey test. Spearman’s correlation between quantitative and ordinal variables was calculated. The level of significance was set at α < 0.05. Statistical tests were performed using R core (version 3.6.1, R Foundation, Vienna, Austria) and SPSS (version 19, IBM, Armonk, NY, USA). There were no missing data.

3. Results

A total of 512 elderly individuals participated in the study with a mean age of 70.4 ± 7.4 years and mean BMI 26.1 ± 4.2. Among these, the majority were women (69.7%), mixed race (41.2%), married (37.9%), sedentary (38.7%), and had no income or class E income (62.3%). Furthermore, only 53 (10.4%) reported dissatisfaction with their work throughout their lives.
LBP prevalence was 55.7% (285), with a mean pain of 5.7 ± 2.3; 160 respondents (56.1% of the 285) accused pain at the time of the interview (punctual prevalence), 261 (91.7%) in the previous 365 days (prevalence in the last year), and 243 (85.3%) at some point in life (prevalence at some point in life).
Regarding the clinical characteristics of the participants with pain at the time of the interview, 72 (45%) elderly said that this pain was enough to limit their usual activities and 99 (61.9%) felt the pain radiating to the leg. Regarding the participants who reported pain in the last year, 157 (60.2%) stated that this pain was sufficient to limit their usual activities and 168 (64.4%) felt the pain radiating to the leg. In addition, among participants who reported pain at some point in life, 162 (66.7%) stated that this pain was sufficient to limit their usual activities, and 159 (65.4%) felt the pain radiating to the leg.
Regarding individual characteristics, there was a positive and significant association between LBP and hypertension (HT) (OR, 2.1; 95% CI, 1.5–3.1) and the influence of physical and mental health interfered slightly (OR, 3.6; 95% CI, 2.3–5.7) to extremely (OR, 11.1; 95% CI, 1.3–91.3) in their social activities. Education (>11 years; OR, 0.3; 95% CI 0.2–0.6), income (classes A or B; OR, 0.3; 95% CI 0,1–0.7), physical activity (very active; OR, 0.3; 95% CI 0.1–0.5), satisfaction with their previous work (very satisfied; OR, 0.2; 95% CI 0.1–0.3), and self-perception of health (excellent; OR, 0.1; 95% CI 0.0–0.4) showed significant negative associations with reported LBP (Table 1).
Table 2 summarizes the correlations between population characteristics and the levels of pain and functional disability. For variables with more than two categories, post hoc analysis was performed.
We identified that pain intensity (score ranges from 0, the absence of pain, to 10, worse pain) was higher in women (p < 0.02), in individuals with osteoarthritis (p < 0.05), and in blacks (p < 0.01).
A greater functional disability (score ranges from 0, the absence of disability, to 24, severe disability) was identified in the elderly who presented HT (p < 0.01), had diabetes mellitus (p < 0.01), underwent less than 11 years of education (p < 0.01), had brown skin (p < 0.01), were widowed (p < 0.01), were sedentary (p < 0.01), and were ex-smokers (p < 0.01). Moreover, elderly people who consumed alcohol once a month or less (p < 0.03), were classified in class D income or below (p < 0.01), were more dissatisfied with previous work (p < 0.01), had poor or regular self-perceived health (p < 0.01), and any negative influence of physical and mental health on social activity (p < 0.01) (Table 2). There were no missing data.

4. Discussion

This is the first representative study with the objective of measuring the LBP prevalence in the elderly population in the city of Belém, PA. Prevalence rates showed LBP to affect more than half of the elderly, leading to significant functional disability. The LBP prevalence was measured in three moments, being 56.1% at the time of the interview, 91.7% in the last year, and 85.3% at any moment in life. Between 45–66.7% of the elderly stated that LBP limited their usual activities, and 61.9–65.4% felt the pain radiating through the leg. HT and the negative influence of physical and mental health on social activities are positively associated with LBP, in contrast to extended education, higher income, levels of physical activity, satisfaction with previous work, and better self-perception of health, which were identified as negatively associated with LBP.
The prevalence of punctual LBP in Belém (56.1%) was above the punctual prevalence in Brazil (25%) [7]; however, there is no homogeneity in the literature regarding the LBP definitions and evaluated regions. For this reason, the worldwide prevalence has a wide spectrum ranging from 21% to 75% among the elderly populations [20]. The prevalence in the last year, found to be 91.7%, was much higher than the 13% systematized in the review by Leopoldino et al. [7]. However, a more recent systematic review identified annual prevalence rates of 21.7–68.3% [20], including three Brazilian studies ranging between 55.8–68.3% [21,22,23]. In addition, the prevalence at some point in life (85.3%) is high and similar to the values estimated in industrialized countries [1]. In comparison to another study in the north region (Manaus, Amazonas), we found similar prevalence, with punctual prevalence was 42.4% and the prevalence for the last 365 days was 93.7% [8].
In the present study, having HT and declaring that physical and mental health negatively influences social activities was positively associated with LBP. Quintino et al. [23] also found a greater propensity to pain in individuals with more severe comorbidities, especially in those with more than three. In a recent study, De Souza et al. [8] found association between LBP and BMI, health perception, and emotional level in a similar population in Manaus, Amazonas.
Other characteristics, such as the extent of education, income, physical activity, satisfaction with previous work, and good self-perception of health, was negatively associated with pain. These results corroborate with those reported by Barros et al. [24], who evaluated the sociodemographic characteristics of 1518 elderly people from Campinas, SP and found that elderly people with more than nine years of education were more active, with better self-reported health and lower comorbidities, for example, hypertension and LBP. In addition, a review by Wong et al. [5] found that less educated elderly people with lower income, smokers, and females, in addition to those with psychological symptoms, limiting beliefs about pain, who performed vigorous physical activities and had poor self-reported health and other comorbidities, were more prone to LBP.
In our study, being female was not directly related to the presence of pain, and this difference can also be observed in the literature [22,25]; however, this characteristic is not described as a direct cause of pain, but as a population that may be more prone to hormonal, psychological, or social causes [26]. Smoking was evidenced as a risk factor for the development and worsening of chronic pain; however, this association was not significant in this study and may have been masked by the low prevalence of smokers among the elderly people who we interviewed [27]. Elderly people who presented with osteoarthritis, who were female, and who were black had greater pain intensity. In the study by Pereira et al. [28], which included 934 elderly people, it was observed that a higher LBP intensity was associated with worse self-perception of health, the presence of comorbidities, joint diseases, and female gender, similar to our findings. The female gender factor in the increased perception of pain intensity may be related to greater sensitivity because of biopsychosocial contributions, such as the influence of hormonal reduction after menopause and its greater tendency to catastrophize pain [26,29].
The association between greater pain intensity and osteoarthritis may be because of its greater co-occurrence as age advances or to the inflammatory contributions of joint wear; however, it is not usually seen as an expressive portion of asymptomatic patients, highlighting the complexity of the pain mechanism [30].
The association between pain and race is not yet well established. Indeed, the pain seems to be more associated with socioeconomic factors, such as education, income, and exposure to risks, with the black population of our country being more expressive in the less favored classes [31,32].
In addition, elderly people that presented higher functional disability had HT, had DM, underwent less than 11 years of schooling, were mixed race, were widowed, were sedentary, were an ex-smoker, consumed alcohol once a month or less, were in income class D or lower, were dissatisfied with the work performed, had poor or regular self-perception of health, and were subject to negative influence of physical and mental health on a social activity.
Low back pain, when accompanied by irradiation to regions below the knee, was highly observed in this study. This demonstrates a warning factor, since it can be related to pathologies that lead to radicular involvement, and can represent a group with higher functional disability, pain intensity, and, consequently, worse prognosis, when compared with patients who present only a local low back pain [33]. Studies indicate that pain, such as low back pain, affects elderly in the basic and instrumental activities of daily living [25]. The characteristics of the elderly with higher functional disability found in this study corroborate with the literature. Some studies show that the Brazilian elderly population with low education, low income, worse self-rated health, and chronic diseases have high scores of functional disability associated [8,34]. More specifically, elderly people with low back pain, or sedentary elderly people with more comorbidities, have higher functional disability [22].
Thus, the importance of sociodemographic characteristics and health indicators on pain and functional disability is evidenced, as higher income and education are directly related to greater and better access to health services, access to information and the viability of a healthier lifestyle, and better working conditions, representing less exposure to occupational risks. Moreover, in view of the growth projections in the number of elderly people worldwide, knowing the prevalence of low back pain is extremely important to improve the management of this condition, which is still precarious. This involves optimizing and minimizing expenses with highly complex problems (for the person and for the country), investing in public policies of prevention, and providing information and earlier interventions.
The results of this study, due to its cross-sectional design, should be interpreted with caution, visualized as representing a situation characteristic of a given moment, with a construction of the causality relationship limited by the knowledge of the event schedule. The inquiries due to their automatic reported character are influenced by memory, but they still consider that pain and disability are subjectively assessed for suffering socio-cultural influences due to their biopsychosocial character.

5. Conclusions

In this study of the elderly population of Belém, PA, the LBP prevalence was high (56.1%), above the national average (25%), mainly affecting the underprivileged classes. Greater functional disability correlated with several modifiable factors, highlighting the importance of education in changing the situation by gaining access to better jobs, and, thus, better income; less exposure to occupational risks; better access to information; and an ability to adopt healthy habits, physical exercise, and healthcare. Thus, this study highlights the importance to increase qualified studies on the subject in a large scale in the country by improving investments in public policies to manage pain in the elderly population, in addition to preventive actions throughout the entire life to minimize the impact of the lack of access to information and services on healthy aging.

Author Contributions

Conceptualization, E.M.S., M.O.M., B.C. and A.P.M.; methodology, E.M.S., B.C.J., L.d.S.F., H.A.R.d.S., P.R.F.F., E.G.S.F. and E.C.S.d.S.; software, E.M.S., B.C.J., M.O.M., B.C. and A.P.M.; validation, M.O.M., B.C. and A.P.M.; formal analysis, M.O.M., B.C. and A.P.M.; investigation, E.M.S., B.C.J., L.d.S.F., H.A.R.d.S., P.R.F.F., E.G.S.F. and E.C.S.d.S.; resources, M.O.M., B.C. and A.P.M.; writing—original draft preparation, M.O.M., B.C. and A.P.M.; writing—review and editing, E.M.S., M.O.M., B.C. and A.P.M.; visualization, E.M.S., B.C.J., M.O.M., B.C. and A.P.M.; supervision, M.O.M., B.C. and A.P.M.; project administration, M.O.M., B.C. and A.P.M.; funding acquisition, A.P.M. All authors have read and agreed to the published version of the manuscript.

Funding

The National Council funded this study for Scientific and Technological Development— CNPq (grant number: 408500/2016-6). The funding sources had no role in the study design; in the collection, analysis, or interpretation of data; in the writing of the manuscript; in the decision to submit the manuscript for publication.

Institutional Review Board Statement

The study was conducted according to the guidelines of the Declaration of Helsinki and approved by the Research Ethics Committee of the Faculty of Medicine of the University of São Paulo, São Paulo, Brazil (protocol code: 189/16, date of approval: 8 June 2016).

Informed Consent Statement

Informed consent was obtained from all participants involved in the study.

Data Availability Statement

The data presented in this study are available on request from the corresponding author. The data are not publicly available due to personal participation information.

Acknowledgments

We thank PROPESP/UFPA (Pro-Rectory for Research and Post-Graduation of Federal University of Pará) for financial support.

Conflicts of Interest

The authors declare no conflict of interest.

References

  1. Duthey, B. Priority Medicines for Europe and the World “A Public Health Approach to Innovation” Update on 2004 Background Paper Background Paper 6. 24 Low Back Pain, Geneva. 2013. Available online: https://www.who.int/medicines/areas/priority_medicines/BP6_24LBP.pdf (accessed on 6 February 2018).
  2. Hartvigsen, J.; Hancock, M.; Kongsted, A.; Louw, Q.; Ferreira, M.L.; Genevay, S.; Hoy, D.; Karppinen, J.; Pransky, G.; Sieper, J.; et al. What low back pain is and why we need to pay attention. Lancet 2018, 391, 2356–2367. [Google Scholar] [CrossRef] [Green Version]
  3. IBGE. Um Panorama da Saúde no Brasil. In Acesso e Utilização dos Serviços, Condições de Saúde e Fatores de Risco e Proteção à Saúd; Instituto Brasileiro de Geografi a e Estatística—IBGE: Rio de Janeiro, Brazil, 2010. [Google Scholar]
  4. GBD 2016 Disease and Injury Incidence and Prevalence Collaborators. Global, regional, and national incidence, prevalence, and years lived with disability for 328 diseases and injuries for 195 countries, 1990–2016: A systematic analysis for the global burden of disease study 2016. Lancet 2017, 390, 1211–1259. [Google Scholar] [CrossRef] [Green Version]
  5. Wong, A.Y.; Karppinen, J.; Samartzis, D. Low back pain in older adults: Risk factors, management options and future directions. Scoliosis Spinal Disord. 2017, 12, 1–23. [Google Scholar] [CrossRef]
  6. Nascimento, P.R.C.D.; Costa, L.O.P. Prevalência da dor lombar no Brasil: Uma revisão sistemática low back pain prevalence in Brazil: A systematic review La prevalencia de dolor lumbar en Brasil: Una revisión sistemática. Cad. Saude Publica 2015, 31, 1141–1155. [Google Scholar] [CrossRef] [PubMed] [Green Version]
  7. Leopoldino, A.A.O.; Diz, J.B.M.; Martins, V.T.; Henschke, N.; Pereira, L.S.M.; Dias, R.C.; Oliveira, V.C. Prevalência de lombalgia na população idosa brasileira: Revisão sistemática com metanálise. Rev. Bras. Reum. 2016, 56, 258–269. [Google Scholar] [CrossRef] [Green Version]
  8. de Souza, I.; Merini, L.; Ramos, L.; Pássaro, A.; França, J.; Marques, A. Prevalence of low back pain and associated factors in older adults: Amazonia Brazilian community study. Health 2021, 9, 539. [Google Scholar] [CrossRef]
  9. Chou, R.; Qaseem, A.; Snow, V.; Casey, D.; Cross, J.T., Jr.; Shekelle, P.; Owens, D.K. Clinical guidelines diagnosis and treatment of low back pain: A joint clinical practice guideline from the American College of physicians and the American. Ann. Intern. Med. 2007, 147, 478–491. [Google Scholar] [CrossRef] [PubMed]
  10. Hoy, D.; Bain, C.; Williams, G.; March, L.; Brooks, P.; Blyth, F.; Woolf, A.; Vos, T.; Buchbinder, R. A systematic review of the global prevalence of low back pain. Arthritis Rheum. 2012, 64, 2028–2037. [Google Scholar] [CrossRef]
  11. Nusbaum, L.; Natour, J.; Ferraz, M.; Goldenberg, J. Translation, adaptation and validation of the Roland-Morris questionnaire -Brazil Roland-Morris. Braz. J. Med. Biol. Res. 2001, 34, 203–210. [Google Scholar] [CrossRef] [Green Version]
  12. Costa, L.O.P.; Maher, C.; Latimer, J.; Ferreira, P.; Pozzi, G.C.; Ribeiro, R.N. Psychometric characteristics of the brazilian-portuguese versions of the functional rating index and the roland morris disability questionnaire. Spine 2007, 32, 1902–1907. [Google Scholar] [CrossRef]
  13. Costa, L.O.P.; Maher, C.G.; Latimer, J.; Ferreira, P.H.; Ferreira, M.L.; Pozzi, G.C.; Freitas, L.M.A. Clinimetric testing of three self-report outcome measures for low back pain patients in Brazil which one is the best? Spine 2008, 33, 2459–2463. [Google Scholar] [CrossRef] [PubMed]
  14. Craig, C.L.; Marshall, A.L.; Sjöström, M.; Bauman, A.E.; Booth, M.L.; Ainsworth, B.E.; Pratt, M.; Ekelund, U.; Yngve, A.; Sallis, J.F.; et al. International Physical Activity Questionnaire: 12-Country Reliability and Validity. Med. Sci. Sports Exerc. 2003, 35, 1381–1395. [Google Scholar] [CrossRef] [Green Version]
  15. Pai, S.; Sundaram, L.J. Low back pain: An economic assessment in the United States. Orthop. Clin. N. Am. 2004, 35, 1–5. [Google Scholar] [CrossRef]
  16. Waddell, G. The back pain revolution. In Curchill Livingstone, Edinborough; Elsevier Health Sciences: Amsterdam, The Netherlands, 2004. [Google Scholar]
  17. Almeida, I.C.G.B.; Sá, K.N.; Silva, M.; Baptista, A.; Matos, M.A.; Lessa, Í. Prevalência de dor lombar crônica. Rev. Bras. Ortop. 2003, 43, 96–102. [Google Scholar] [CrossRef] [Green Version]
  18. Andrusaitis, S.F.; Oliveira, R.P.; TFilho, E.P.B. Clinical sciences study of the prevalence and risk factors for low back pain in truck drivers in the state of São Paulo, Brazil. Clinics 2006, 61, 503–510. [Google Scholar] [CrossRef] [PubMed] [Green Version]
  19. Cardoso, J.P.; Ribeiro, I.D.Q.B.; Araújo, T.M.D.; Carvalho, F.M.; Reis, E.J.F.B.D. Prevalence of musculoskeletal pain among teachers Prevalência de dor. Rev. Bras. Epidemiol. 2009, 12, 1–10. [Google Scholar]
  20. de Souza, I.M.B.; Sakaguchi, T.F.; Yuan, S.; Matsutani, L.A.; Espírito-Santo, A.D.S.D.; Pereira, C.A.D.B.; Marques, A.P. Prevalence of low back pain in the elderly population: A systematic review. Clinics 2019, 74, e789. [Google Scholar] [CrossRef] [PubMed] [Green Version]
  21. De Figueiredo, V.F.; Pereira, L.S.M.; Ferreira, P.H.; Pereira, A.; De Amorim, J.S.C. Incapacidade funcional, sintomas depressivos e dor lombar em idosos. Fisioter. Mov. 2013, 26, 549–557. [Google Scholar] [CrossRef] [Green Version]
  22. Palma, R.; De Conti, M.H.S.; Quintino, N.M.; Gatti, M.A.N.; Simeão, S.F.A.P.; De Vitta, A. Functional capacity and its associated factors in the elderly with low back pain. Acta Ortopédica Bras. 2014, 22, 295–299. [Google Scholar] [CrossRef] [Green Version]
  23. Quintino, N.M.; De Conti, M.H.S.; Palma, R.; Gatti, M.A.N.; Simeão, S.F.A.P.; De Vitta, A. Prevalence and factors associated with low back pain in elderly registered in the family health strategy. Fisioter. Mov. 2017, 30, 367–377. [Google Scholar] [CrossRef] [Green Version]
  24. de Azevedo Barros, M.B.; Francisco, P.M.S.B.; Lima, M.G.; César, C.L.G. Social inequalities in health among the elderly desigualdades sociais em saúde entre idosos. Cad. Saude Publica 2011, 27, 198–208. [Google Scholar] [CrossRef] [PubMed] [Green Version]
  25. Silva, M.C.D.; Fassa, A.G.; Valle, N.C. Chronic low back pain in a Southern Brazilian adult population: Prevalence and associated factors. Cad. Saude Publica 2004, 20, 377–385. [Google Scholar] [CrossRef] [PubMed] [Green Version]
  26. Bartley, E.J.; Fillingim, R. Sex differences in pain: A brief review of clinical and experimental findings. Br. J. Anaesth. 2013, 111, 52–58. [Google Scholar] [CrossRef] [PubMed] [Green Version]
  27. Bendayan, R.; Cooper, R.; Muthuri, S.G. Lifetime cigarette smoking and chronic widespread and regional pain in later adulthood: Evidence from the 1946 British birth cohort study. BMJ Open 2018, 8, e021896. [Google Scholar] [CrossRef] [PubMed]
  28. Pereira, L.V.; de Vasconcelos, P.P.; Souza, L.; Pereira, G.D.A.; Nakatani, A.Y.K.; Bachion, M.M. Prevalence and intensity of chronic pain and self-perceived health among elderly people: A population-based study. Rev. Latino-Am. Enferm. 2014, 22, 662–669. [Google Scholar] [CrossRef] [Green Version]
  29. de Kruijf, M.; Stolk, L.; Zillikens, M.C.; de Rijke, Y.B.; Bierma-Zeinstra, S.M.; Hofman, A.; Huygen, F.J.; Uitterlinden, A.G.; van Meurs, J.B. Lower sex hormone levels are associated with more chronic musculoskeletal pain in community-dwelling elderly women. Pain 2016, 157, 1425–1431. [Google Scholar] [CrossRef]
  30. Khan, A.N.; Jacobsen, H.E.; Khan, J.; Filippi, C.G.; Levine, M.; Lehman, R.A.; Riew, K.D.; Lenke, L.G.; Chahine, N.O. Inflammatory biomarkers of low back pain and disc degeneration: A review. Ann. N. Y. Acad. Sci. 2017, 1410, 68–84. [Google Scholar] [CrossRef]
  31. Santos, A.M.B.; Burti, J.S.; Lopes, J.B.; Scazufca, M.; Marques, A.P.; Pereira, R.M.R. Prevalence of fibromyalgia and chronic widespread pain in community-dwelling elderly subjects living in São Paulo, Brazil. Maturitas 2010, 67, 251–255. [Google Scholar] [CrossRef]
  32. Brasil. Ministério da Saúde. Temático Saúde da População Negra. 2016. Available online: http://bvsms.saude.gov.br/bvs/publicacoes/tematico_saude_populacao_negra_v._7.pdf (accessed on 7 January 2020).
  33. Kongsted, A.; Kent, P.; Jensen, T.S.; Albert, H.; Manniche, C. Prognostic implications of the Quebec Task Force classification of back-related leg pain: An analysis of longitudinal routine clinical data. BMC Musculoskelet. Disord. 2013, 14, 1–9. [Google Scholar]
  34. Ferreira, G.; Costa, L.D.C.M.; Stein, A.; Hartvigsen, J.; Buchbinder, R.; Maher, C. Tackling low back pain in Brazil: A wake-up call. Braz. J. Phys. Ther. 2019, 23, 189–195. [Google Scholar] [CrossRef]
Figure 1. Low back pain map.
Healthcare 09 01658 g001
Table 1. Characteristics of the elderly population in the metropolitan region of Belém, PA.
OutcomeDo You Have or Did You Have Low Back PainO.R.IC(95%) Do O.R.p-Value
NoYes
N%N%Inf.
Lim.
Sup.
Lim.
Gender Female15267.0%20571.9%1.000
Male7533.0%8028.1%0.7910.5421.1550.2244
RaceYellow125.3%93.2%1.000
White10546.3%10135.4%1.2830.5183.1750.5905
Mixed8035.2%13146.0%2.1830.8815.4130.0919
Black3013.2%4415.4%1.9560.7335.2160.1802
Marital StatusSingle4921.6%5318.6%1.000
Stable Union or Married10044.1%11941.8%1.1000.6871.7620.6910
Divorced187.9%3612.6%1.8490.9313.6730.0790
Widow6026.4%7727.0%1.1860.7091.9850.5150
SAHNo15267.0%13948.8%1.000
Yes7533.0%14651.2%2.1291.4833.055<0.0001
DMNo18280.2%20973.3%1.000
Yes4519.8%7626.7%1.4710.9672.2360.0710
ArthrosisNo19485.5%22779.6%1.000
Yes3314.5%5820.4%1.5020.9402.3990.0887
ArthritisNo21795.6%26994.4%1.000
Yes104.4%165.6%1.2910.5742.9020.5370
Degree of Education0–4 years4821.1%9734.0%1.000
5–8 years3917.2%4114.4%0.5200.2980.9090.0220
9–11 years8336.6%10938.2%0.6500.4151.0180.0600
>11 years5725.1%3813.3%0.3300.1930.564<0.0001
IncomeNone ou Class E13057.3%18966.3%1.000
Class D4419.4%6121.4%0.9540.6101.4920.8350
Class C3415.0%269.1%0.5260.3010.9180.0240
Class B or A 198.4%93.2%0.3260.1430.7430.0080
Physical ActivitySedentary5825.6%14049.1%1.000
Insufficiently active4118.1%5920.7%0.5960.3610.9850.0436
Active10244.9%7024.6%0.2840.1850.438<0.0001
Very active2611.5%165.6%0.2550.1270.5100.0001
SmokingNo12856.4%15052.6%1.000
Ex9341.0%12343.2%1.1290.7891.6140.5077
Yes62.6%124.2%1.7070.6234.6760.2986
Alcohol Consumption How often do you consume alcohol-containing drinksDo not applicable16271.4%20772.6%1.000
Once a month or less3615.9%4214.7%0.9130.5591.4910.7160
Twice to four times a month229.7%289.8%0.9960.5491.8060.9900
Twice or more times a week73.1%82.8%0.8940.3182.5180.8330
SatisfactionDissatisfied115.0%4214.9%1.000
Satisfied13661.5%19368.7%0.3720.1850.7480.0055
Very Satisfied7433.5%4616.4%0.1630.0760.348<0.0001
Are you currently workingNo18681.9%22478.6%1.000
Yes4118.1%6121.4%1.2350.7951.9200.3474
During the past four weeks. how did your physical health or emotional problems interfere with your normal social activities in relation to family, friends or groupNo way15066.1%9533.3%1.000
Lightly3816.7%8630.2%3.5732.2555.662<0.0001
Moderately2912.8%7225.3%3.9202.3736.475<0.0001
Quite94.0%258.8%4.3861.9639.8010.0003
Extremely10.4%72.5%11.0531.33991.2550.0257
Do you classify your health asPoor20.9%155.3%1.000
Fair6428.2%13146.0%0.2730.0611.2300.0909
Good11450.2%10737.5%0.1250.0280.5600.0066
Very Good229.7%186.3%0.1090.0220.5410.0067
Excelent2511.0%144.9%0.0750.0150.3750.0016
Age (years)71.387.6969.617.070.9680.9450.9910.0076
BMI (kg/m2)25.624.0526.454.241.0501.0061.0960.0259
BMIMalnutrition3816.7%3512.3%1.000
Eutrophy11450.2%13848.4%1.3140.7802.2150.3050
Obesity7533.0%11239.3%1.6210.9412.7940.0820
O.R.: oddis ratio; IC (95%): interval of 95% de confidence; SAH: systemic arterial hypertension; DM: diabetes mellitus; BMI: body mass index.
Table 2. Population characteristics and the level of pain and functional disability.
OutcomePain ScaleSum (RM)
MeanStandard Deviationp-ValueMeanStandard Deviationp-Value
GenderFemale5.892.330.02729.787.620.1626
Male5.181.9511.098.34
SAHNo5.842.380.32127.706.91<0.0001
Yes5.552.1212.497.95
DMNo5.622.390.47758.867.32<0.0001
Yes5.881.8313.688.15
ArthrosisNo5.552.200.047410.407.520.2465
Yes6.222.389.168.96
ArthritisNo5.692.240.963410.207.890.6438
Yes5.632.559.197.04
Degree of Education0–4 years5.822.460.42339.617.550.0004
5–8 years6.122.5110.517.48
9–11 years5.472.0512.068.08
>11 years5.501.945.616.26
RaceYellow5.222.950.00287.008.230.0002
White5.742.607.517.36
Mixed5.341.8911.967.65
Black6.681.9911.417.73
Marital StatusSingle5.792.310.72517.747.000.0009
Stable Union or Married5.822.1610.008.08
Divorced5.641.9314.866.85
Widow5.442.509.827.62
Physical ActivitySedentary5.621.990.164212.457.84<0.0001
Insufficiently active5.862.009.977.74
Active5.942.816.766.38
Very active4.502.345.446.86
SmokingNo5.712.430.66078.457.200.0002
Ex5.632.0412.267.97
Yes6.082.079.589.37
Alcohol Consumption How often do you consume alcohol-containing drinksDo not applicable5.642.340.272210.327.810.0077
Once a month or less5.671.9512.197.13
Twice to four times a month6.211.977.438.27
Twice or more times a week5.132.594.255.99
Are you currently workingNo5.782.300.103210.657.970.0861
Yes5.342.048.307.05
IncomeNone ou Class E5.852.310.380910.587.880.0030
Class D5.201.9811.497.70
Class C5.732.655.235.40
Class B or A 5.561.136.008.19
SatisfactionDissatisfied5.502.140.873214.107.910.0002
Satisfied5.702.2510.097.69
Very Satisfied5.722.486.616.96
During the past four weeks, how did your physical health or emotional problems interfere with your normal social activities in relation to family, friends or groupNo way5.822.580.32145.005.70<0.0001
Lightly5.312.1911.667.19
Moderately5.691.9013.587.66
Quite6.242.0914.327.38
Extremely6.431.9911.009.09
Do you classify your health asPoor7.002.000.126417.476.33<0.0001
Fair5.831.8914.086.85
Good5.352.626.496.32
Very Good5.832.233.834.90
Excelent5.362.211.502.71
BMIMalnutrition5.302.750.41906.506.400.0958
Eutrophy5.782.247.586.83
Obesity5.672.2411.488.00
RM: Roland–Morris; SAH: systemic arterial hypertension; DM: diabetes mellitus; BMI: body mass index.
Publisher’s Note: MDPI stays neutral with regard to jurisdictional claims in published maps and institutional affiliations.

