Computer Tomography in the Diagnosis of Ovarian Cysts: The Role of Fluid Attenuation Values

 ,
,
Abstract
1. Introduction
2. Materials and Methods
2.1. Patients
2.2. Reference Standard
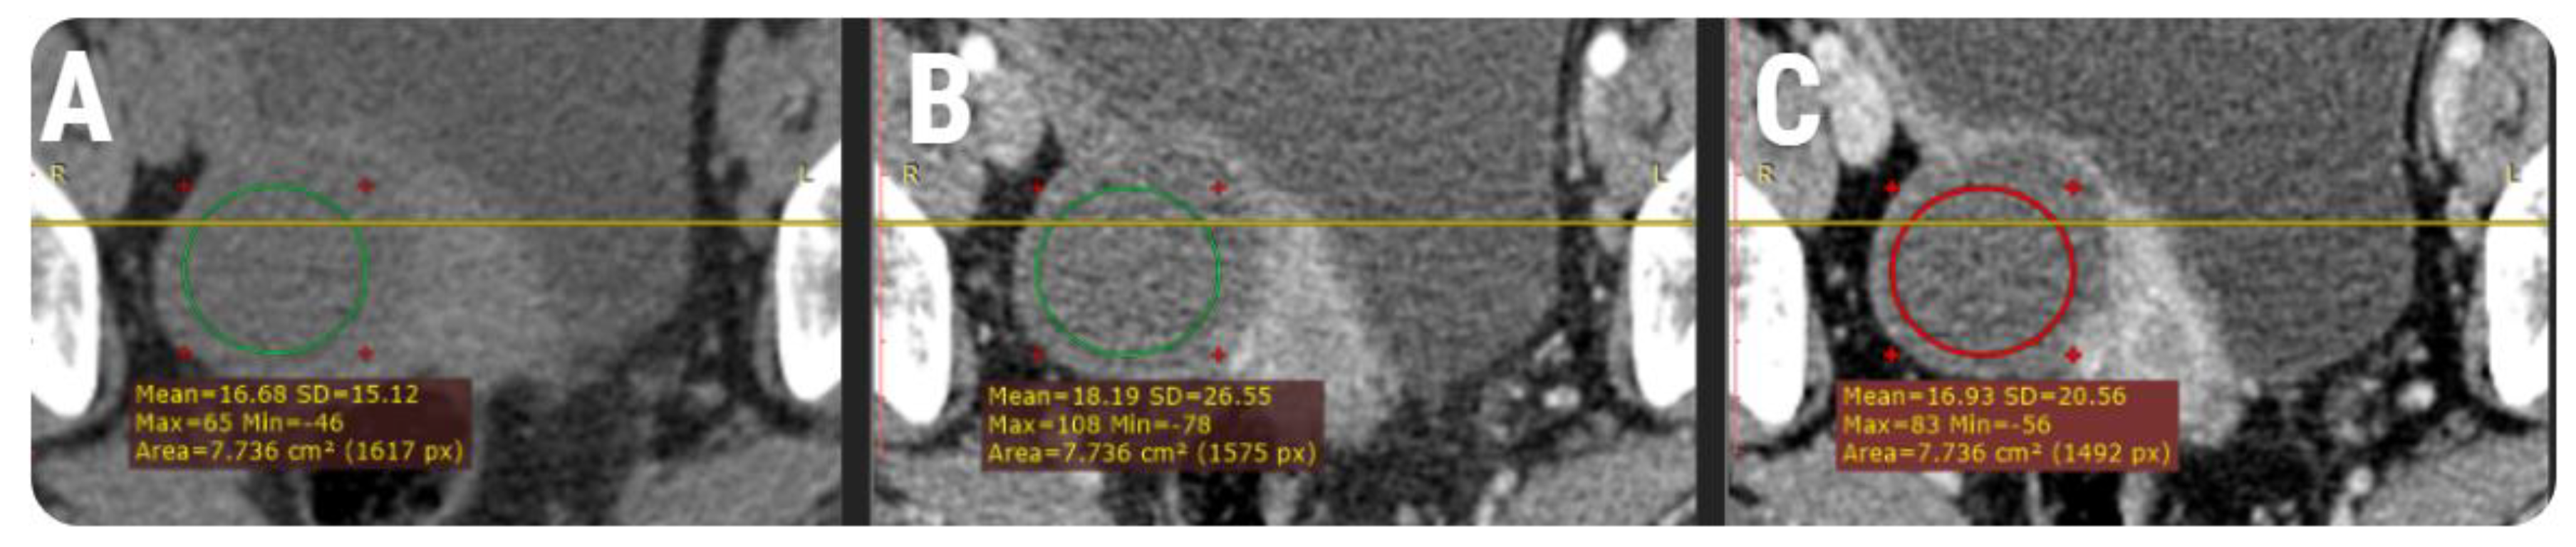
2.3. CT protocol
2.4. Imaging Evaluation
2.5. Statistical Analysis
3. Results
4. Discussion
5. Conclusions
Supplementary Materials
Author Contributions
Funding
Conflicts of Interest
Ethics Statements
References
- Mubarak, F.; Alam, M.S.; Akhtar, W.; Hafeez, S.; Nizamuddin, N. Role of multidetector computed tomography (MDCT) in patients with ovarian masses. Int. J. Women’s Health 2011, 3, 123–126. [Google Scholar] [CrossRef][Green Version]
- Jung, S.I.; Park, H.S.; Kim, Y.J.; Jeon, H.J. Multidetector Computed Tomography for the Assessment of Adnexal Mass: Is Unenhanced CT Scan Necessary? Korean J. Radiol. 2014, 15, 72–79. [Google Scholar] [CrossRef] [PubMed]
- Van Nagell, J.R.J.; Miller, R.W. Evaluation and Management of Ultrasonographically Detected Ovarian Tumors in Asymptomatic Women. Obstet. Gynecol. 2016, 127, 848–858. [Google Scholar] [CrossRef]
- Jeong, Y.Y.; Outwater, E.K.; Kang, H.K. Imaging evaluation of ovarian masses. Radiographics 2000, 20, 1445–1470. [Google Scholar] [CrossRef] [PubMed]
- Chilla, B.; Hauser, N.; Singer, G.; Trippel, M.; Froehlich, J.M.; Kubik-Huch, R.A. Indeterminate adnexal masses at ultrasound: Effect of MRI imaging findings on diagnostic thinking and therapeutic decisions. Eur. Radiol. 2011, 21, 1301–1310. [Google Scholar] [CrossRef] [PubMed]
- Bouic-Pagès, E.; Perrochia, H.; Mérigeaud, S.; Giacalone, P.Y.; Taourel, P. Corrélations anatomopathologiques: IRM des tumeurs ovariennes primitives. J. Radiol. 2009, 90, 787–802. [Google Scholar] [CrossRef]
- Shin, Y.M.; Lee, J.K.T.; Turan, N.; Mauro, D.; Chong, W. Computed Tomography Appearance of Ovarian Cysts With Hyperenhancing Rim During the Menstrual Cycle in Women of Different Ages. J. Comput. Asist. Tomogr. 2010, 34, 532–536. [Google Scholar] [CrossRef]
- Zhao, Y.; Mao, X.; Yao, L.; Shen, J. Computed tomography imaging features of benign ovarian Brenner tumors. Oncol. Lett. 2018, 16, 1141–1146. [Google Scholar] [CrossRef]
- Radiology Assistant: Roadmap to Evaluate Ovarian Cysts. Available online: https://radiologyassistant.nl/abdomen/ovarium/roadmap-to-evaluate-ovarian-cysts (accessed on 19 August 2020).
- Marko, J.; Marko, K.I.; Pachigolla, S.L.; Crothers, B.A.; Mattu, R.; Wolfman, D.J. Mucinous Neoplasms of the Ovary: Radiologic-Pathologic Correlation. RadioGraphics 2019, 39, 982–997. [Google Scholar] [CrossRef]
- Buy, J.N.; Ghossain, M. Surface Epithelial—Stromal Tumors of the Ovary. In Gynecological Imaging, 4th ed.; Springer: Berlin/Heidelberg, Germany, 1994; pp. 705–782. [Google Scholar]
- Wood, D.; Bibbo, M. Comprehensive Cytopathology E-Book; Elsevier Health Sciences: Amsterdam, The Netherlands, 2014; pp. 291–301. [Google Scholar]
- Greenebaum, E. Aspirating Nonneoplastic Ovarian Cysts: Rationale, Technique, and Controversy. Lab. Med. 1996, 27, 462–467. [Google Scholar] [CrossRef][Green Version]
- Nadrljanski, M.M.; Attenuation coefficient | Radiology Reference Article | Radiopaedia.org. Radiopaedia n.d. Available online: https://radiopaedia.org/articles/attenuation-coefficient?lang=us (accessed on 19 August 2020).
- Jung, S.E.; Lee, J.M.; Rha, S.E.; Byun, J.Y.; Jung, J.I.; Hahn, S.T. CT and MR Imaging of Ovarian Tumors with Emphasis on Differential Diagnosis. RadioGraphics 2002, 22, 1305–1325. [Google Scholar] [CrossRef] [PubMed]
- Yada-Hashimoto, N.; Yamamoto, T.; Kamiura, S.; Seino, H.; Ohira, H.; Sawai, K.; Kimura, T.; Saji, F. Metastatic ovarian tumors: A review of 64 cases. Gynecol. Oncol. 2003, 89, 314–317. [Google Scholar] [CrossRef]
- Varadhachary, G.R. Carcinoma of Unknown Primary Origin. Gastrointest. Cancer Res. 2007, 1, 229–235. [Google Scholar] [PubMed]
- Kubeček, O.; Laco, J.; Špaček, J.; Petera, J.; Kopecký, J.; Kubečková, A.; Filip, S. The pathogenesis, diagnosis, and management of metastatic tumors to the ovary: A comprehensive review. Clin. Exp. Metastasis 2017, 34, 295–307. [Google Scholar] [CrossRef]
- Brown, D.L.; Zou, K.H.; Tempany, C.M.C.; Frates, M.C.; Silverman, S.G.; McNeil, B.J.; Kurtz, A.B. Primary versus Secondary Ovarian Malignancy: Imaging Findings of Adnexal Masses in the Radiology Diagnostic Oncology Group Study. Radiology 2001, 219, 213–218. [Google Scholar] [CrossRef]
- Kim, S.H.; Kim, W.H.; Park, K.J.; Lee, J.K.; Kim, J.S. CT and MR Findings of Krukenberg Tumors: Comparison with Primary Ovarian Tumors. J. Comput. Assist. Tomogr. 1996, 20, 393–398. [Google Scholar] [CrossRef]
- Young, R.H.; Hart, W.R. Metastatic Intestinal Carcinomas Simulating Primary Ovarian Clear Cell Carcinoma and Secretory Endometrioid Carcinoma: A Clinicopathologic and Immunohistochemical Study of Five Cases. Am. J. Surg. Pathol. 1998, 22, 805–815. [Google Scholar] [CrossRef]
- Ovarian Serous Cystadenocarcinoma disease: Malacards - Research Articles, Drugs, Genes, Clinical Trials n.d. Available online: https://www.malacards.org/card/ovarian_serous_cystadenocarcinoma (accessed on 19 August 2020).
- Togashi, K. Ovarian cancer: The clinical role of US, CT, and MRI. Eur. Radiol. 2003, 13 (Suppl. 4), L87–L104. [Google Scholar] [CrossRef]
- Kinkel, K.; Lu, Y.; Mehdizade, A.; Pelte, M.-F.; Hricak, H. Indeterminate ovarian mass at US: Incremental value of second imaging test for characterization--meta-analysis and Bayesian analysis. Radiology 2005, 236, 85–94. [Google Scholar] [CrossRef]
- Guo, B.; Lian, W.; Liu, S.; Cao, Y.; Liu, J. Comparison of diagnostic values between CA125 combined with CA199 and ultrasound combined with CT in ovarian cancer. Oncol. Lett. 2019, 17, 5523–5528. [Google Scholar] [CrossRef]
- Guerriero, S.; Mallarini, G.; Ajossa, S.; Risalvato, A.; Satta, R.; Mais, V.; Angiolucci, M.; Melis, G.B. Transvaginal ultrasound and computed tomography combined with clinical parameters and CA-125 determinations in the differential diagnosis of persistent ovarian cysts in premenopausal women. Ultrasound Obstet. Gynecol. 1997, 9, 339–343. [Google Scholar] [CrossRef] [PubMed]
- Choi, H.J.; Lee, J.-H.; Seok Lee, J.; Choi, J.-I.; Kang, S.; Lee, S.; Seo, S.S.; Park, S.Y. CT Findings of Clear Cell Carcinoma of the Ovary. J. Comput. Assist. Tomogr. 2006, 30, 875–879. [Google Scholar] [CrossRef] [PubMed]
- Potter, A.W.; Chandrasekhar, C.A. US and CT Evaluation of Acute Pelvic Pain of Gynecologic Origin in Nonpregnant Premenopausal Patients. RadioGraphics 2008, 28, 1645–1659. [Google Scholar] [CrossRef] [PubMed]
- Wiliam, E.B. Introduction to CT of the Abdomen & Pelvis. In Fundamentals of Body CT E-Book; Webb, W.R., Brant, W.E., Major, N.M., Eds.; Elsevier Health Sciences: Amsterdam, The Netherlands, 2014; pp. 289–302. [Google Scholar]
- Foti, P.V.; Tonolini, M.; Costanzo, V.; Mammino, L.; Palmucci, S.; Cianci, A.; Ettorre, G.C.; Basile, A. Cross-sectional imaging of acute gynaecologic disorders: CT and MRI findings with differential diagnosis-part II: Uterine emergencies and pelvic inflammatory disease. Insights Imaging 2019, 10, 118. [Google Scholar] [CrossRef]
- Johnstone, C.; Rich, S.E. Bleeding in cancer patients and its treatment: A review. Ann. Palliat. Med. 2018, 7, 265–273. [Google Scholar] [CrossRef] [PubMed]
- Themes UFO. Benign Ovarian Masses. Radiology Key. 2019. Available online: https://radiologykey.com/benign-ovarian-masses/ (accessed on 19 August 2020).
- Schwartz, P.E. The Role of Tumor Markers in the Preoperative Diagnosis of Ovarian Cysts. Clin. Obstet. Gynecol. 1993, 36, 384–394. [Google Scholar] [CrossRef] [PubMed]
- Zanetta, G.; Lissoni, A.; Torri, V.; Dalla Valle, C.; Trio, D.; Rangoni, G.; Mangioni, C. Role of puncture and aspiration in expectant management of simple ovarian cysts: A randomised study. BMJ 1996, 313, 1110–1113. [Google Scholar] [CrossRef]
- Lee, N.K.; Kim, S.; Kim, K.H.; Suh, D.S.; Kim, T.U.; Han, G.J.; Lee, J.W.; Kim, J.Y. Diffusion-weighted magnetic resonance imaging in the differentiation of endometriomas from hemorrhagic cysts in the ovary. Acta. Radiol. 2016, 57, 998–1005. [Google Scholar] [CrossRef]
Publisher’s Note: MDPI stays neutral with regard to jurisdictional claims in published maps and institutional affiliations. |


| Group | Histological Entity | n | Pathologic Confirmation (d) | Cases with Available Description | Pathological Findings | Diameter (mm) |
|---|---|---|---|---|---|---|
| Benign cysts (n = 32) | simple cyst | 24 | 43.2 ± 12.8 | 3 | clear; slightly haemorrhagic; serous | 31.28 ± 9.41 |
| serous cystadenoma | 3 | 74.2 ± 21.4 | 3 | serous; yellow | 71.6 ± 26.76 | |
| serous cystadenofibroma | 3 | 38.2 ± 5.6 | 2 | watery; serous | 12.56 ± 8.25 | |
| mucinous cystadenoma | 2 | 18.5 ± 8.4 | 1 | mucinous | 135.05 ± 7 | |
| Primary tumors (n = 27) | serous carcinoma | 21 | 29.5 ± 10.3 | 9 | gelatinous; brownish; serous; slightly haemorrhagic | 59.42 ± 24.07 |
| clear cell carcinoma | 4 | 12 ± 4.8 | 3 | clear; watery; turbid | 54.06 ± 23.11 | |
| mucinous cystadenocarcinoma | 2 | 22.6 ± 5.2 | 1 | thick; viscous | 230 ± 36.3 | |
| Ovarian metastases (n = 11) | colon adenocarcinoma | 1 | - | 0 | - | 40.3 |
| gastric adenocarcinoma | 5 | - | 0 | - | 61.81 ± 48.76 | |
| breast cancer | 5 | - | 0 | - | 60.02 ± 12.72 |
| Group | Contrast phase | ||
|---|---|---|---|
| Nm | Am | Vm | |
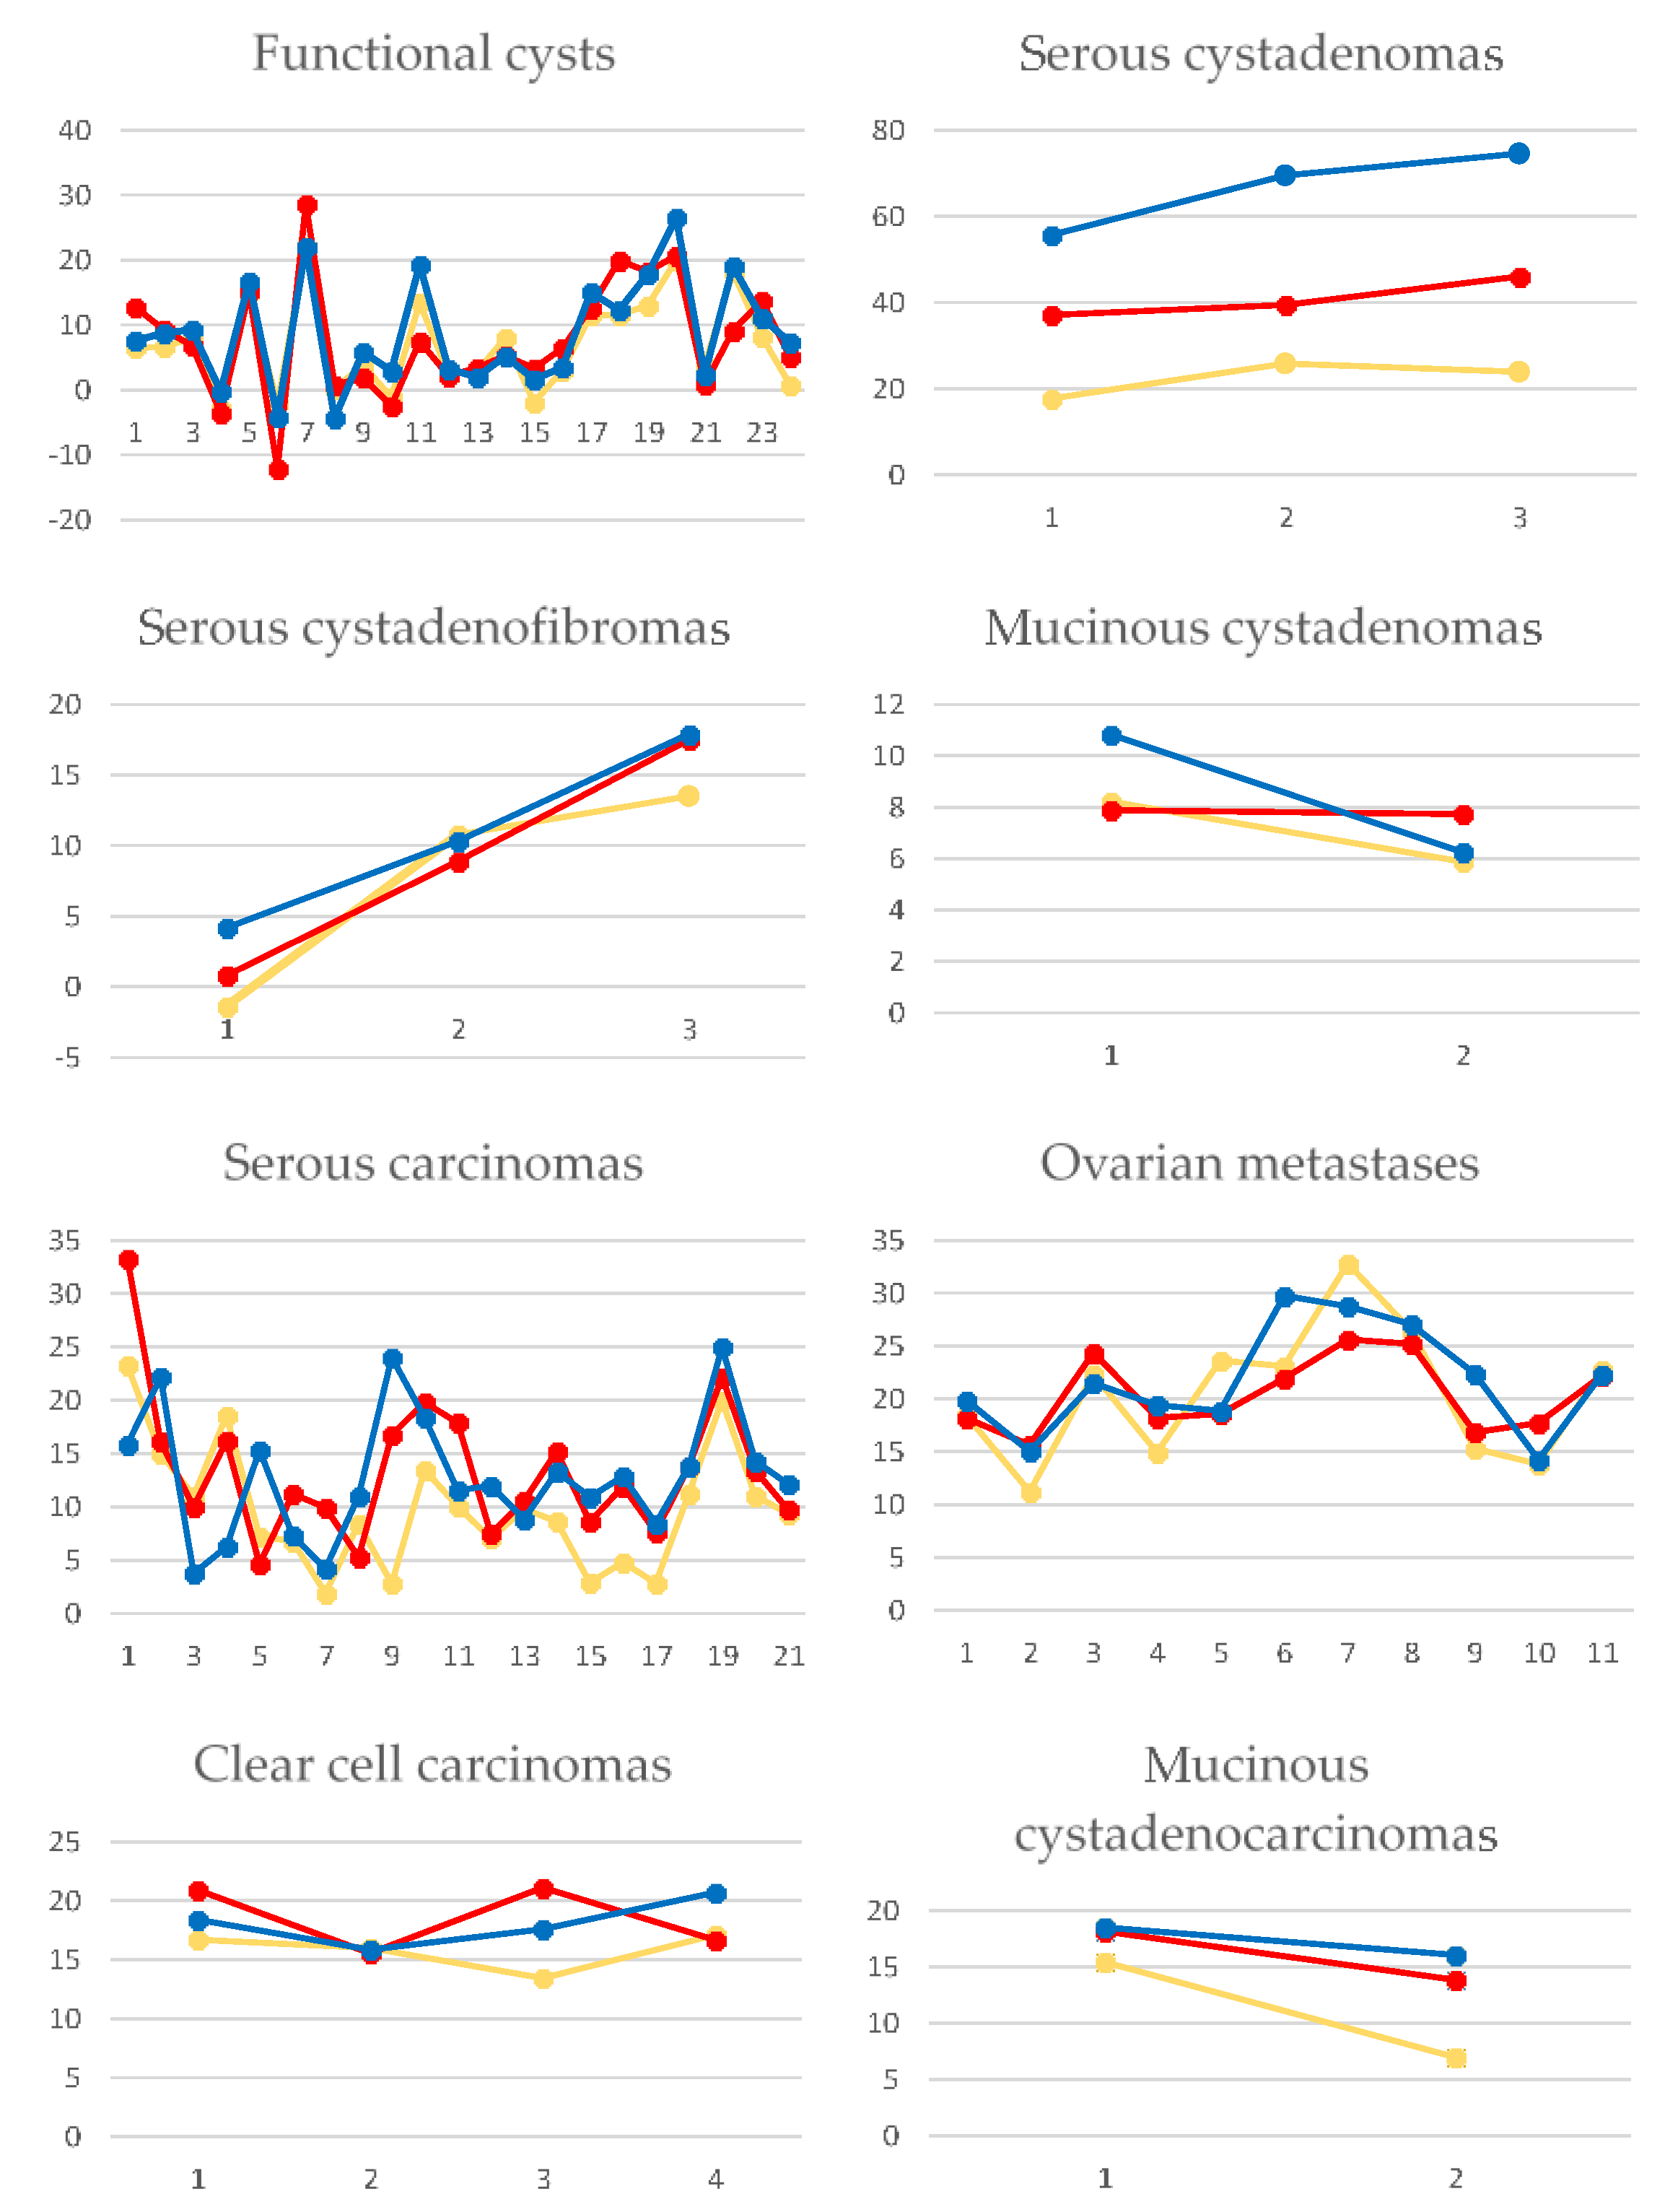
| benign cysts | 7.95 (2.63–13.47) | 7.81 (2.73–14.4) | 9.01 (3.35–17.88) |
| primary tumors | 10.04 (6.98–15.34) | 13.84 (9.93–17.61) | 13.8 (10.92–18.17) |
| metastases | 22.31 (15.01–23.47) | 18.58 (17.81–23.81) | 21.49 (19.05–25.89) |
| malignant cysts | 13.45 (8.4–18.4) | 16.41 (11.21–19.7) | 15.84 (11.96–20.7) |
| simple cysts | 6.56 (1.58–12.28) | 6.63 (2.03–13.24) | 7.45 (2.62–15.87) |
| serous cystadenoma | 23.95 (17.69–25.8) | 19.44 (13.67–19.45) | 28.52 (18.52–29.98) |
| serous cystadenofibroma | 10.78 (−1.37–13.49) | 8.87 (0.8–17.5) | 10.31 (4.18–17.89) |
| mucinous cystadenoma | 7.05 (5.88–8.22) | 7.81 (7.73–7.89) | 8.53 (6.25–10.82) |
| serous carcinoma | 9.34 (5.78–12.34) | 11.9 (4.6–16.45) | 12.13 (8.6–15.65) |
| clear cell carcinoma | 16.35 (14.72–16.91) | 18.77 (16.10–21) | 18 (16.73–19.55) |
| mucinous cystadenocarcinoma | 11.21 (6.97–15.45) | 16 (13.84–18.16) | 17.27 (16.04–18.51) |
| colon adenocarcinoma | 22.72 | 22.18 | 22.28 |
| gastric adenocarcinoma | 18.4 (13.06–22.95) | 18.19 (16.91–21.47) | 19.42 (15.02–21.49) |
| breast cancer | 22.89 (13.81) | 22.04 (17.69–25.21) | 24.72 (22.28–28.76) |
| (A) Compared groups | Contrast phase | ||
| Np | Ap | Vp | |
| Benign and malignant | 0.0083 | 0.0002 | 0.0029 |
| Primary tumors and metastases | 0.0005 | 0.001 | 0.0008 |
| (B) Group | Contrast phases’ comparison | ||
| Np-Ap | Np-Vp | Ap-Vp | |
| Benign | 0.8016 | 0.4508 | 0.61 |
| Malignant | 0.0828 | 0.0856 | 0.8926 |
| Metastases | 0.947 | 0.7477 | 0.4385 |
| Primary tumors | 0.0371 | 0.0476 | 0.9655 |
| Serous carcinomas | 0.0575 | 0.0609 | 0.9298 |
| Simple cysts | 0.7728 | 0.5637 | 0.7650 |
| Predictors of Malignant Cysts | Predictors of Metastases | ||||||||
|---|---|---|---|---|---|---|---|---|---|
| Contrast phase | Coefficient | Standard error | p-value | VIF | Contrast phase | Coefficient | Standard error | p-value | VIF |
| Np | −0.01618 | 0.01492 | 0.2822 | 4.709 | Np | 0.03577 | 0.01470 | 0.0204 | 3.163 |
| Ap | 0.03496 | 0.01286 | 0.0084 | 3.693 | Ap | −0.01525 | 0.01719 | 0.3813 | 3.070 |
| Vp | 0.006727 | 0.01324 | 0.6131 | 3.928 | Vp | 0.02151 | 0.01317 | 0.1116 | 1.997 |
| Sign.lvl. | 0.0013 | Sign.lvl. | 0.0003 | ||||||
| R2 | 0.2114 | R2 | 0.4178 | ||||||
| R2 adjusted | 0.1755 | R2 adjusted | 0.3664 | ||||||
| M.C. Coef. | 0.8789 | M.C. Coef. | 0.6463 | ||||||
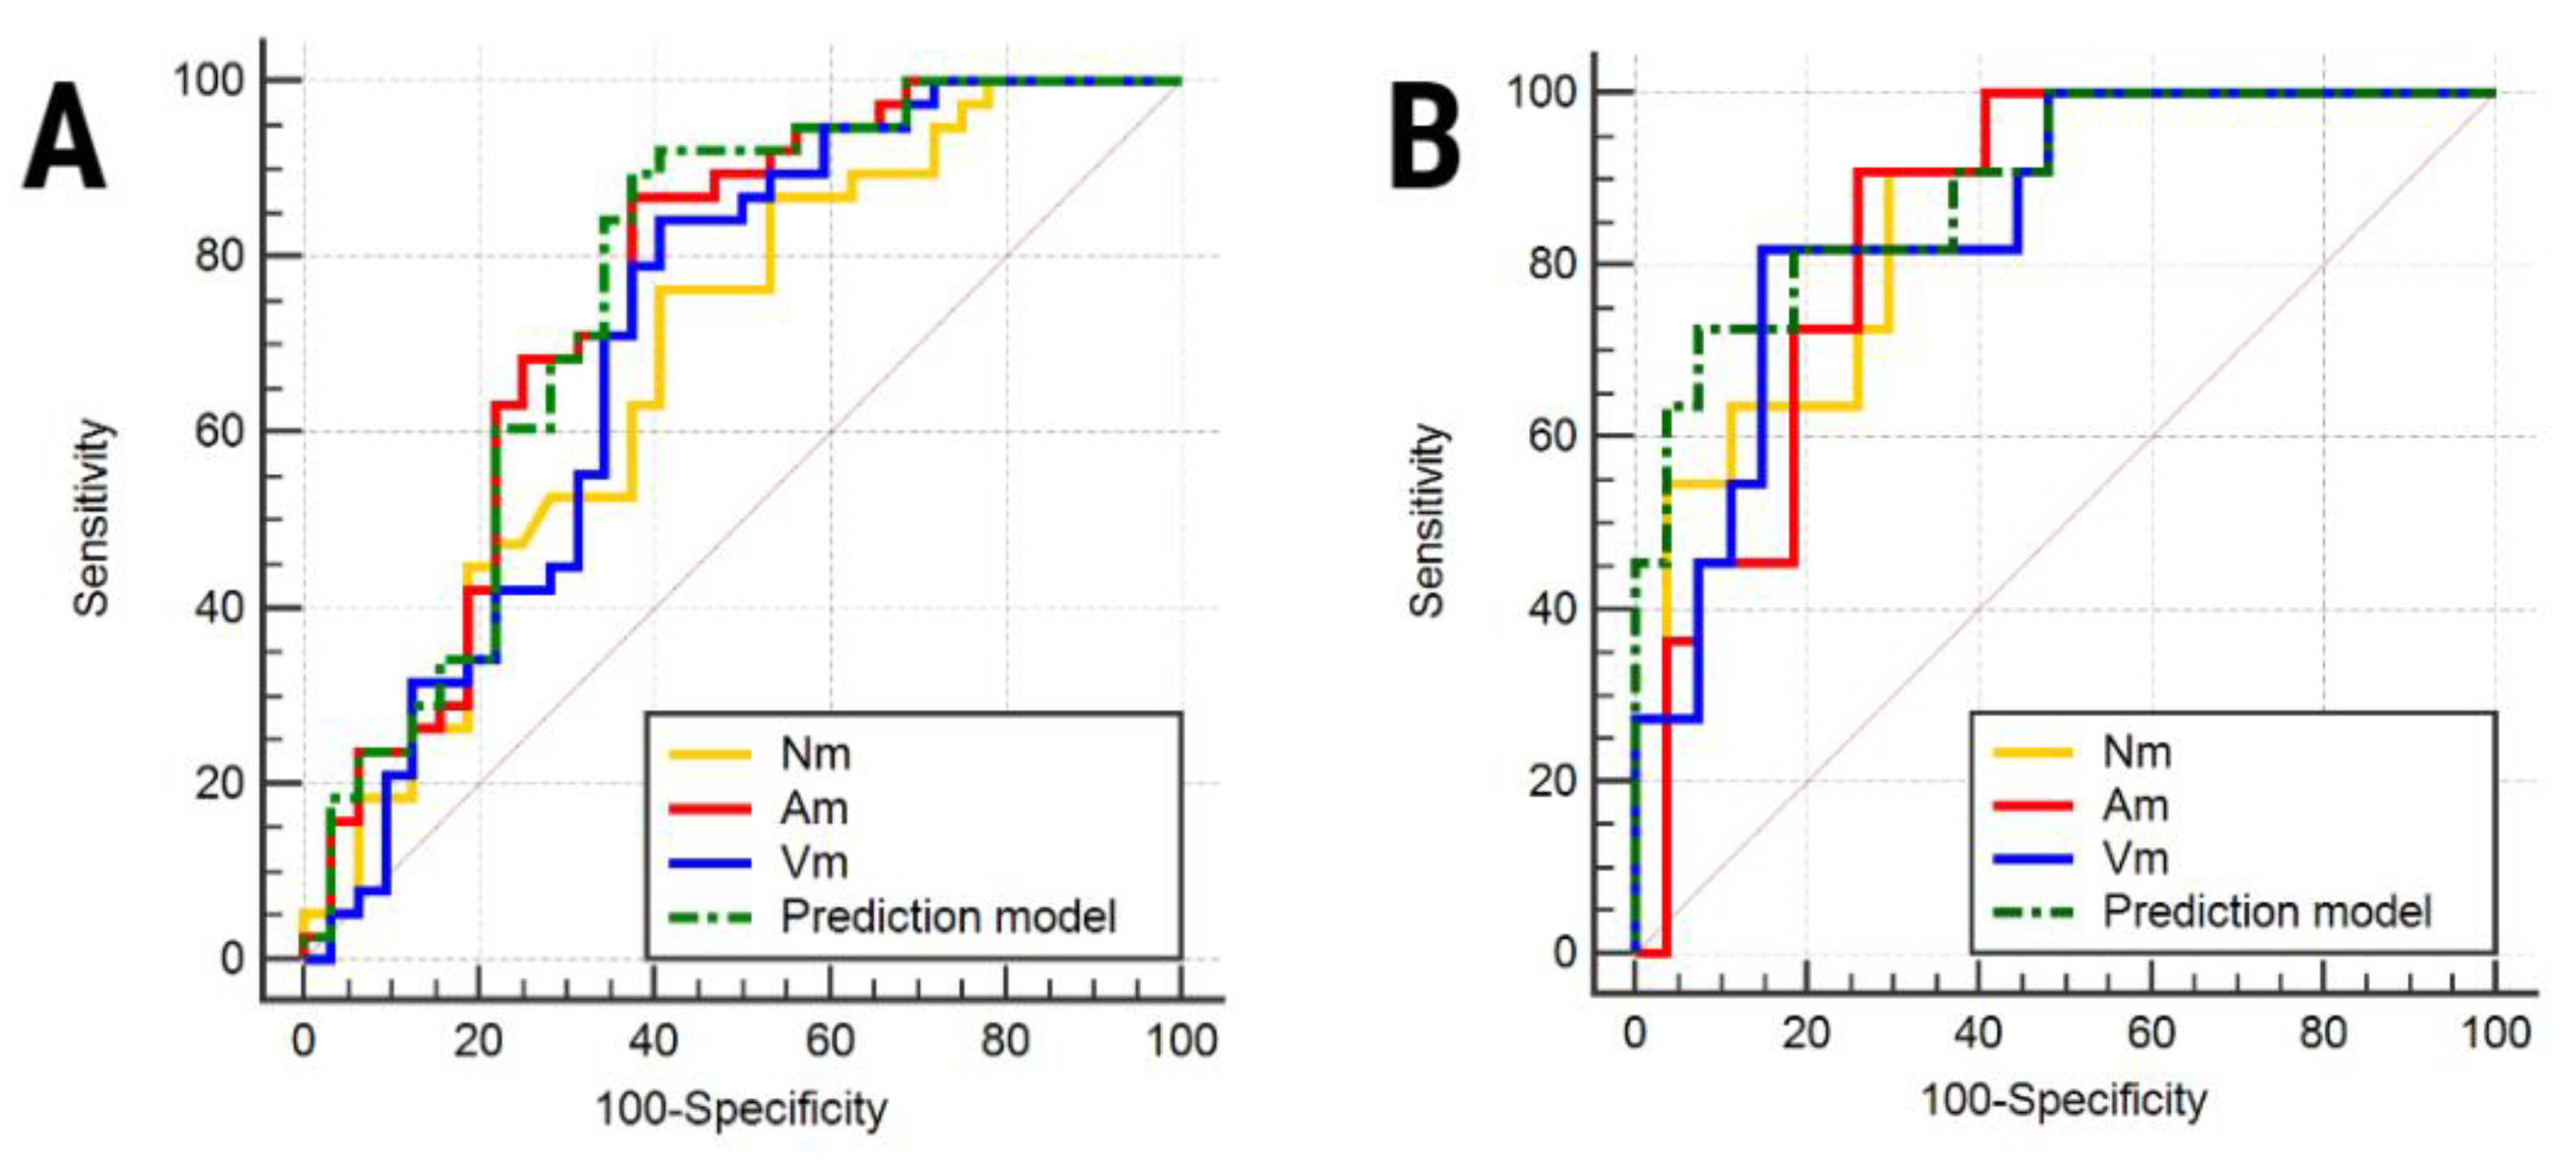
| Compared Groups | Contrast Phase | AUC | Sign. lvl. | J | Cut-off | Sensitivity (%) | Specificity (%) |
|---|---|---|---|---|---|---|---|
| (A) | Np | 0.684 (0.562–0.79) | 0.005 | 0.36 | >8.225 | 76.32 (59.8–88.6) | 59.38 (40.6–76.3) |
| Ap | 0.756 (0.638–0.851) | <0.0001 | 0.49 | >9.3 | 86.84 (71.9–95.6) | 62.5 (43.7–78.9) | |
| Vp | 0.708 (0.587–0.811) | 0.0016 | 0.43 | >10.82 | 84.21 (68.7–94.0) | 59.38 (40.6–76.3) | |
| Prediction model | 0.762 (0.646–0.856) | <0.0001 | 0.51 | >0.4491 | 89.47 (75.2–97.1) | 62.5 (43.7–78.9) | |
| (B) | Np | 0.865 (0.715–0.954) | <0.0001 | 0.61 | >13.45 | 90.91 (58.7–99.8) | 70.37 (49.8–86.2) |
| Ap | 0.845 (0.691–0.942) | <0.0001 | 0.64 | >16.725 | 90.91 (58.7–99.8) | 74.07 (53.7–88.9) | |
| Vp | 0.852 (0.699–0.946) | <0.0001 | 0.67 | >18.51 | 81.82 (48.2–97.7) | 85.19 (66.3–95.8) | |
| Prediction model | 0.892 (0.749–0.969) | <0.0001 | 0.65 | >0.4678 | 72.73 (39–94) | 92.59 (75.7–99.1) |
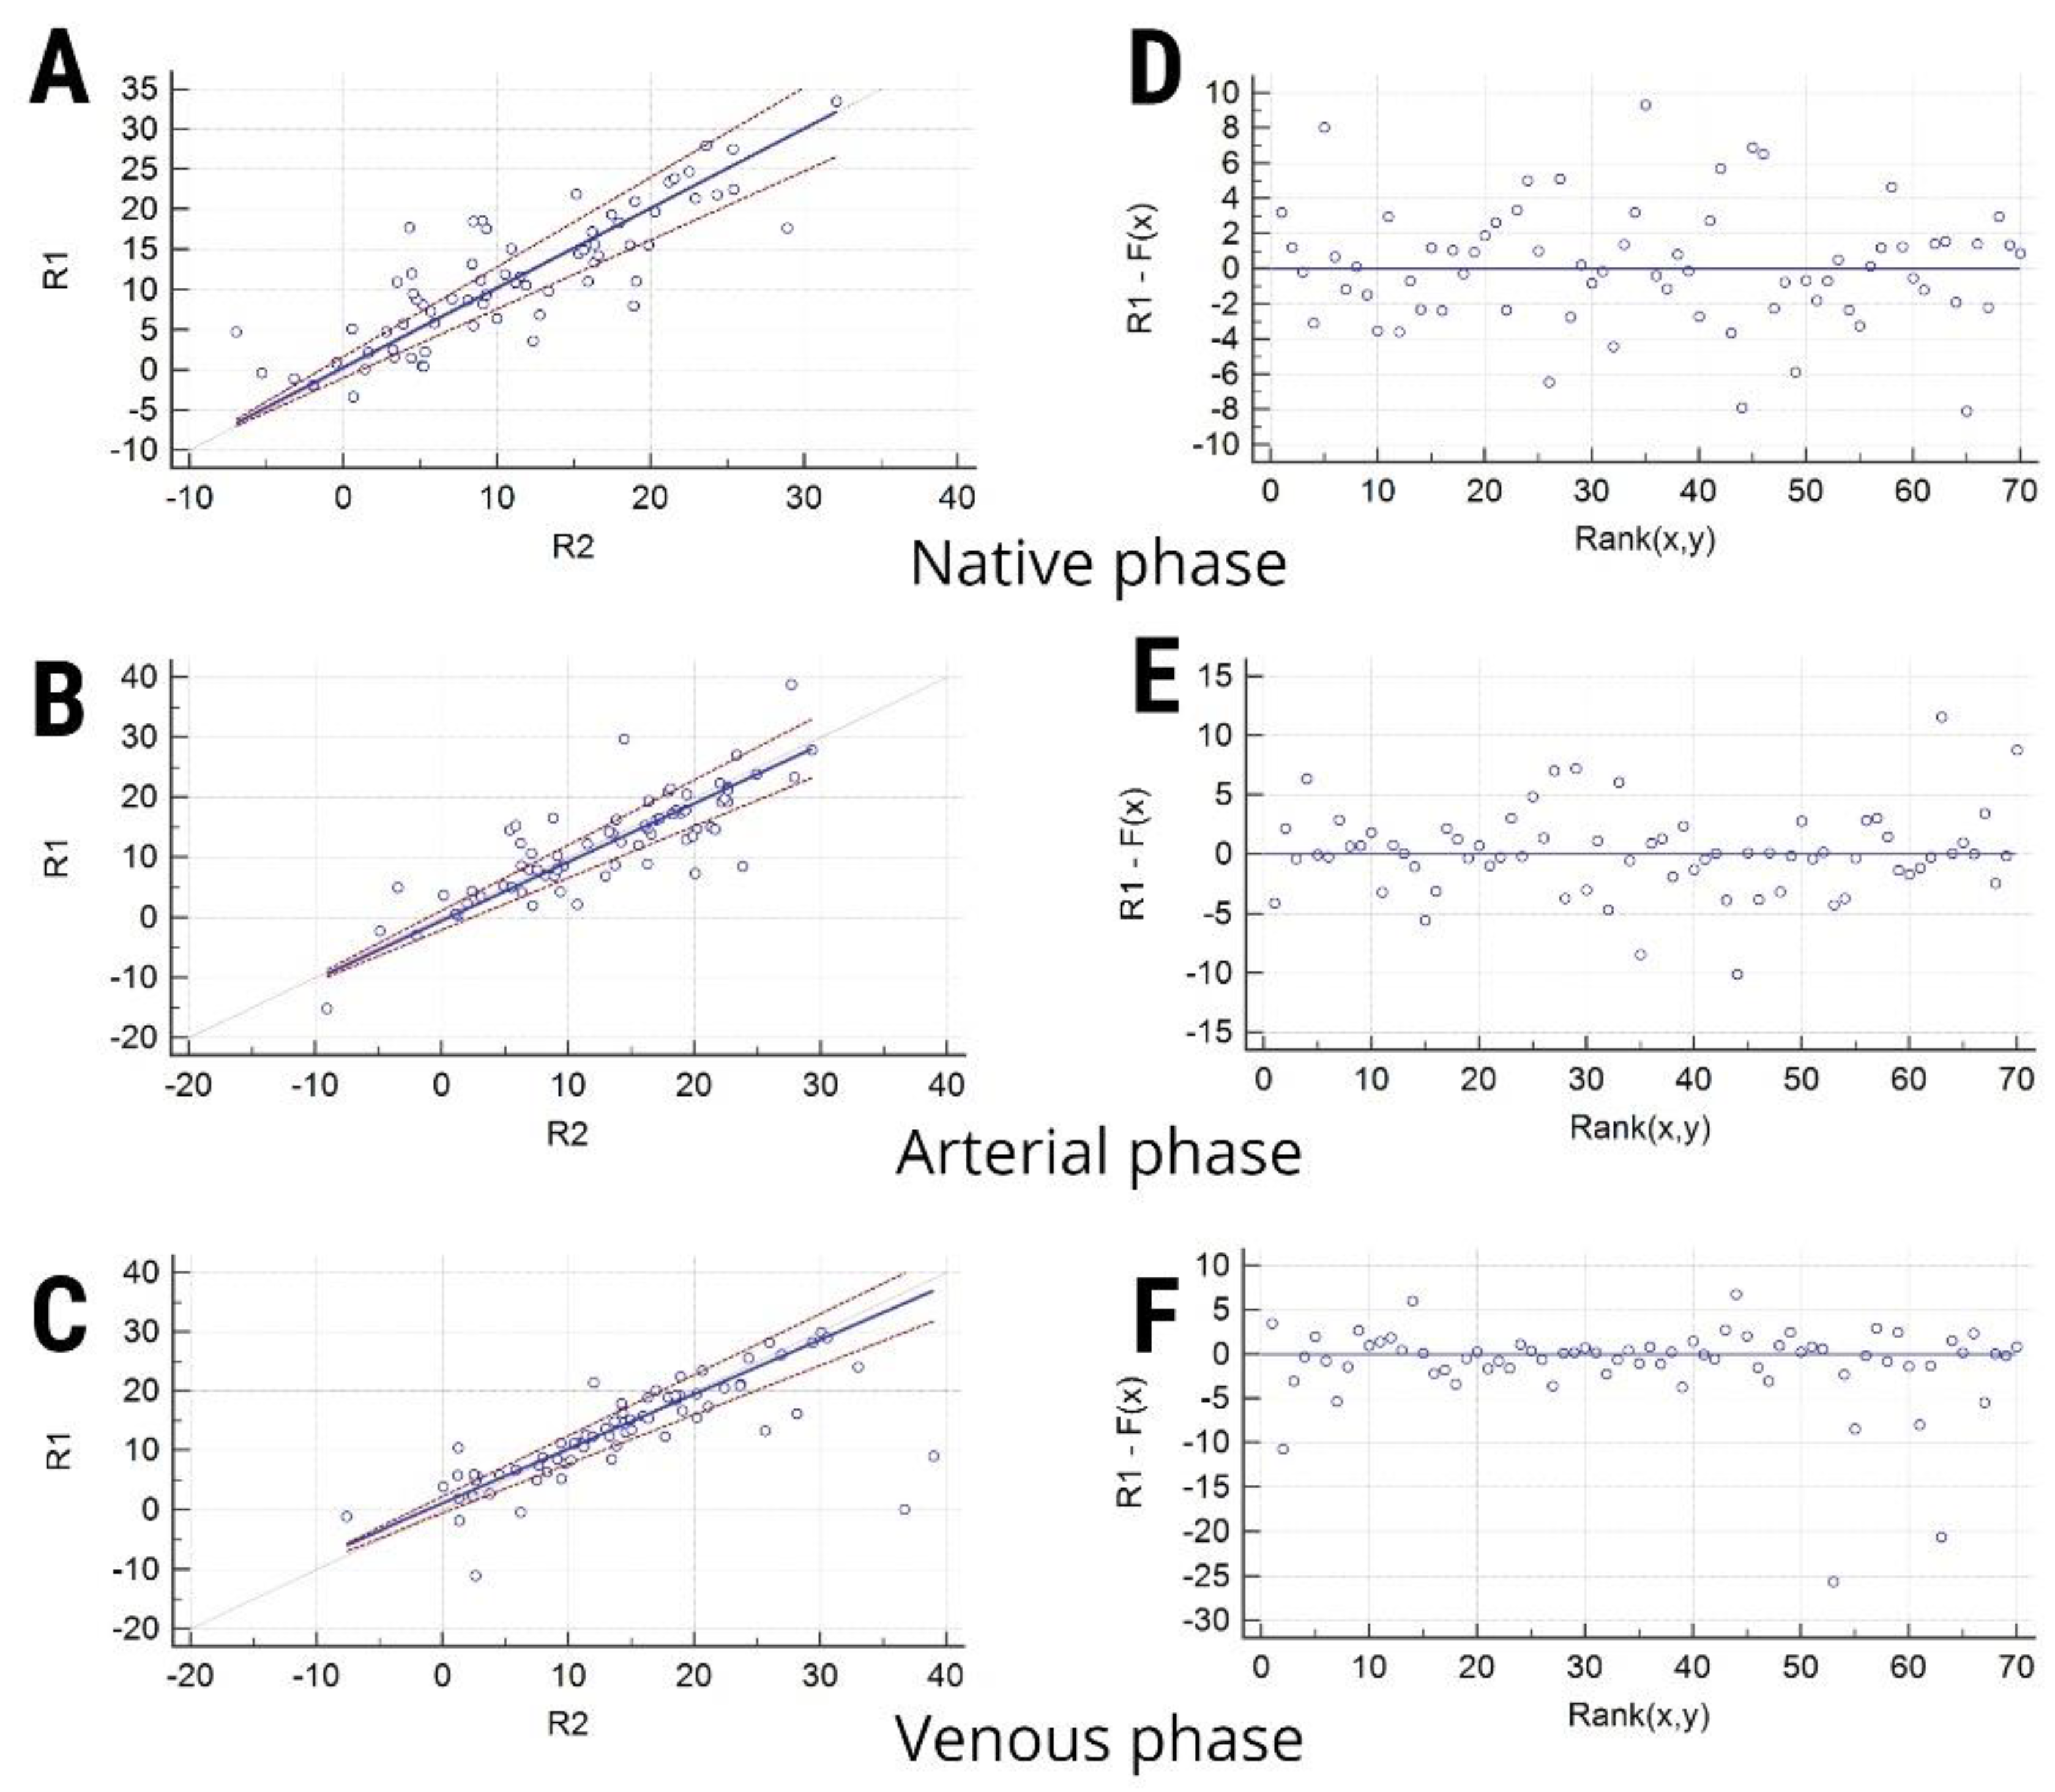
| Contrast Phase | R1 (Mean ± SD) | R2 (Mean ± SD) | Systematic Differences (95% CI) | Proportional Differences (95% CI) | RSD (± 1.96 RSD Interval) | Test for Linearity |
|---|---|---|---|---|---|---|
| Np | 11.06 ± 8.48 | 11.54 ± 8.16 | 0.35 (−0.95–1.69) | 0.99 (0.85–1.17) | 3.38 ± 6.64) | 0.85 |
| Ap | 13.08 ± 8.47 | 13.26 ± 8.67 | −0.56 (−2–1.15) | 0.97 (0.86–1.08) | 3.59 ± 7.04 | 0.97 |
| Vp | 14.37 ± 9.47 | 12.91 ± 8.27 | 1.13 (−0.55–2.24) | 0.91 (0.82–1.02) | 4.91 ± 9.63 | 0.97 |
© 2020 by the authors. Licensee MDPI, Basel, Switzerland. This article is an open access article distributed under the terms and conditions of the Creative Commons Attribution (CC BY) license (http://creativecommons.org/licenses/by/4.0/).
Share and Cite
Lupean, R.-A.; Ștefan, P.-A.; Oancea, M.D.; Măluțan, A.M.; Lebovici, A.; Pușcaș, M.E.; Csutak, C.; Mihu, C.M. Computer Tomography in the Diagnosis of Ovarian Cysts: The Role of Fluid Attenuation Values. Healthcare 2020, 8, 398. https://doi.org/10.3390/healthcare8040398
Lupean R-A, Ștefan P-A, Oancea MD, Măluțan AM, Lebovici A, Pușcaș ME, Csutak C, Mihu CM. Computer Tomography in the Diagnosis of Ovarian Cysts: The Role of Fluid Attenuation Values. Healthcare. 2020; 8(4):398. https://doi.org/10.3390/healthcare8040398
Chicago/Turabian StyleLupean, Roxana-Adelina, Paul-Andrei Ștefan, Mihaela Daniela Oancea, Andrei Mihai Măluțan, Andrei Lebovici, Marius Emil Pușcaș, Csaba Csutak, and Carmen Mihaela Mihu. 2020. "Computer Tomography in the Diagnosis of Ovarian Cysts: The Role of Fluid Attenuation Values" Healthcare 8, no. 4: 398. https://doi.org/10.3390/healthcare8040398
APA StyleLupean, R.-A., Ștefan, P.-A., Oancea, M. D., Măluțan, A. M., Lebovici, A., Pușcaș, M. E., Csutak, C., & Mihu, C. M. (2020). Computer Tomography in the Diagnosis of Ovarian Cysts: The Role of Fluid Attenuation Values. Healthcare, 8(4), 398. https://doi.org/10.3390/healthcare8040398