Spatio-Temporal Comprehensive Measurements of Chinese Citizens’ Health Levels and Associated Influencing Factors


Abstract
1. Introduction
2. Literature Review
3. Data and Methodology
3.1. Index System and Data Sources
3.2. Research Method
3.2.1. Measurement of Citizens’ Health Levels
3.2.2. A Spatial Pattern Analysis of Citizens’ Health Levels
3.2.3. An Analysis of the Influencing Factors that Affect Citizens’ Health Levels
4. Results and Discussion
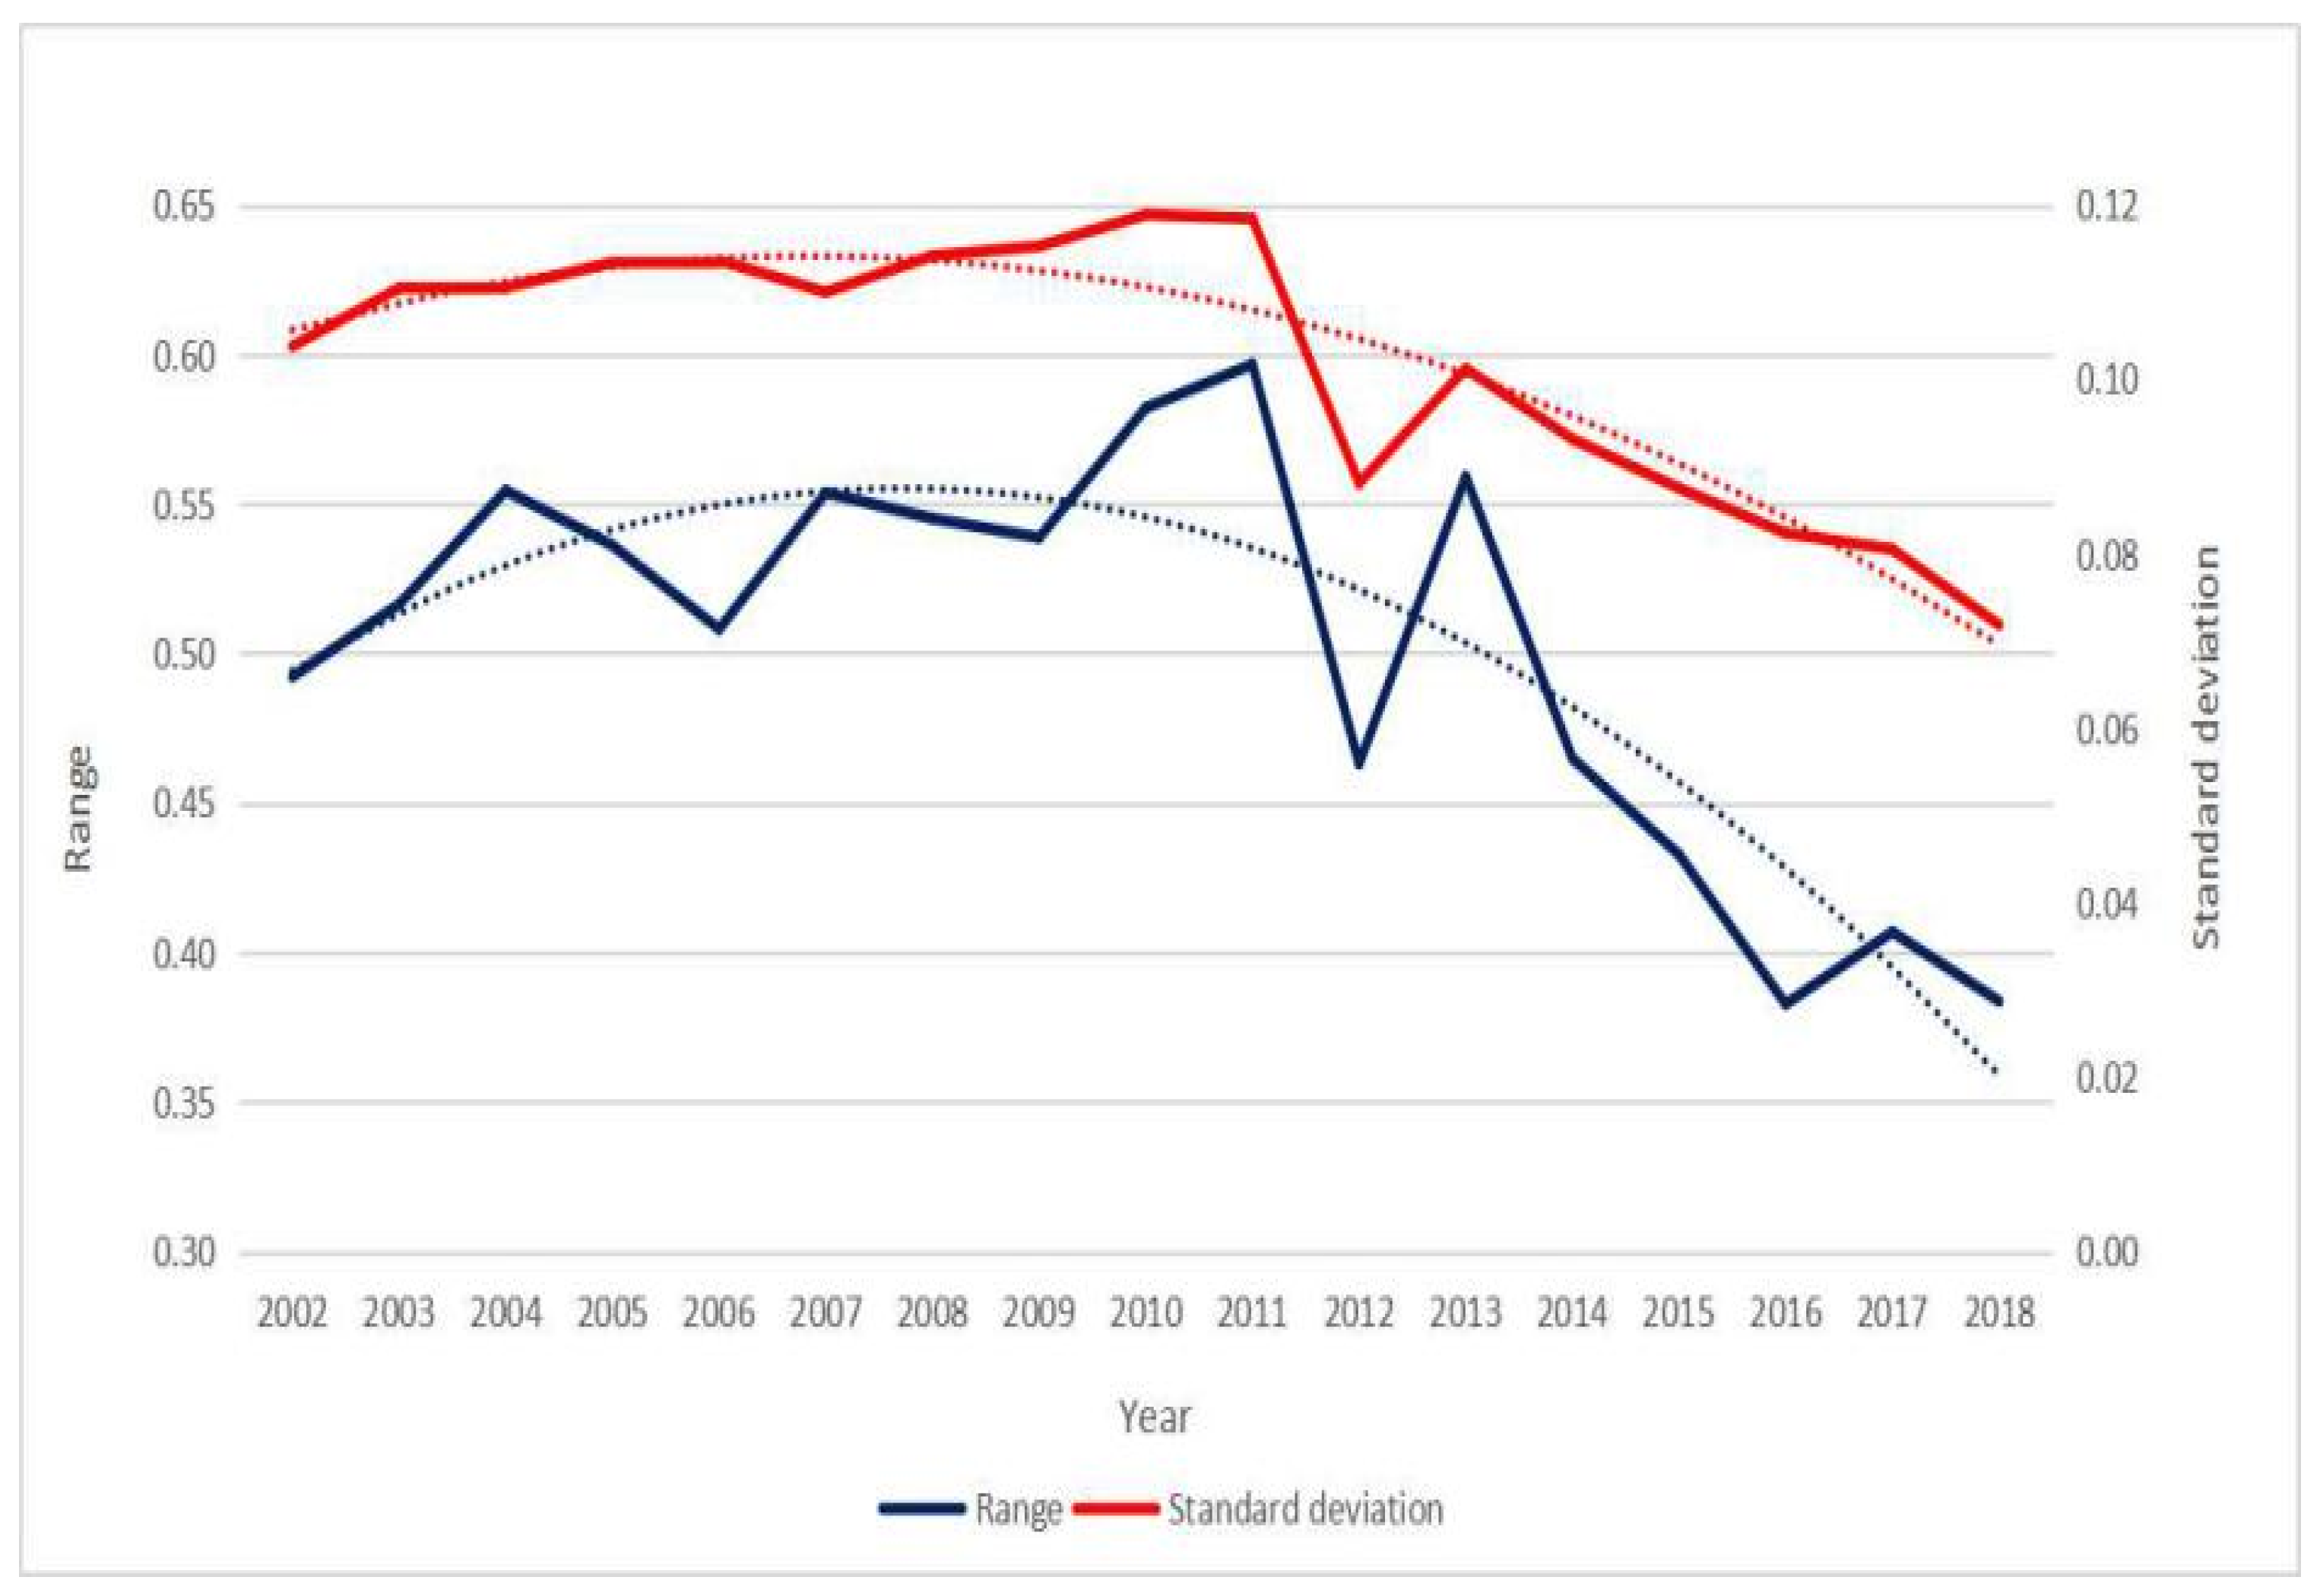
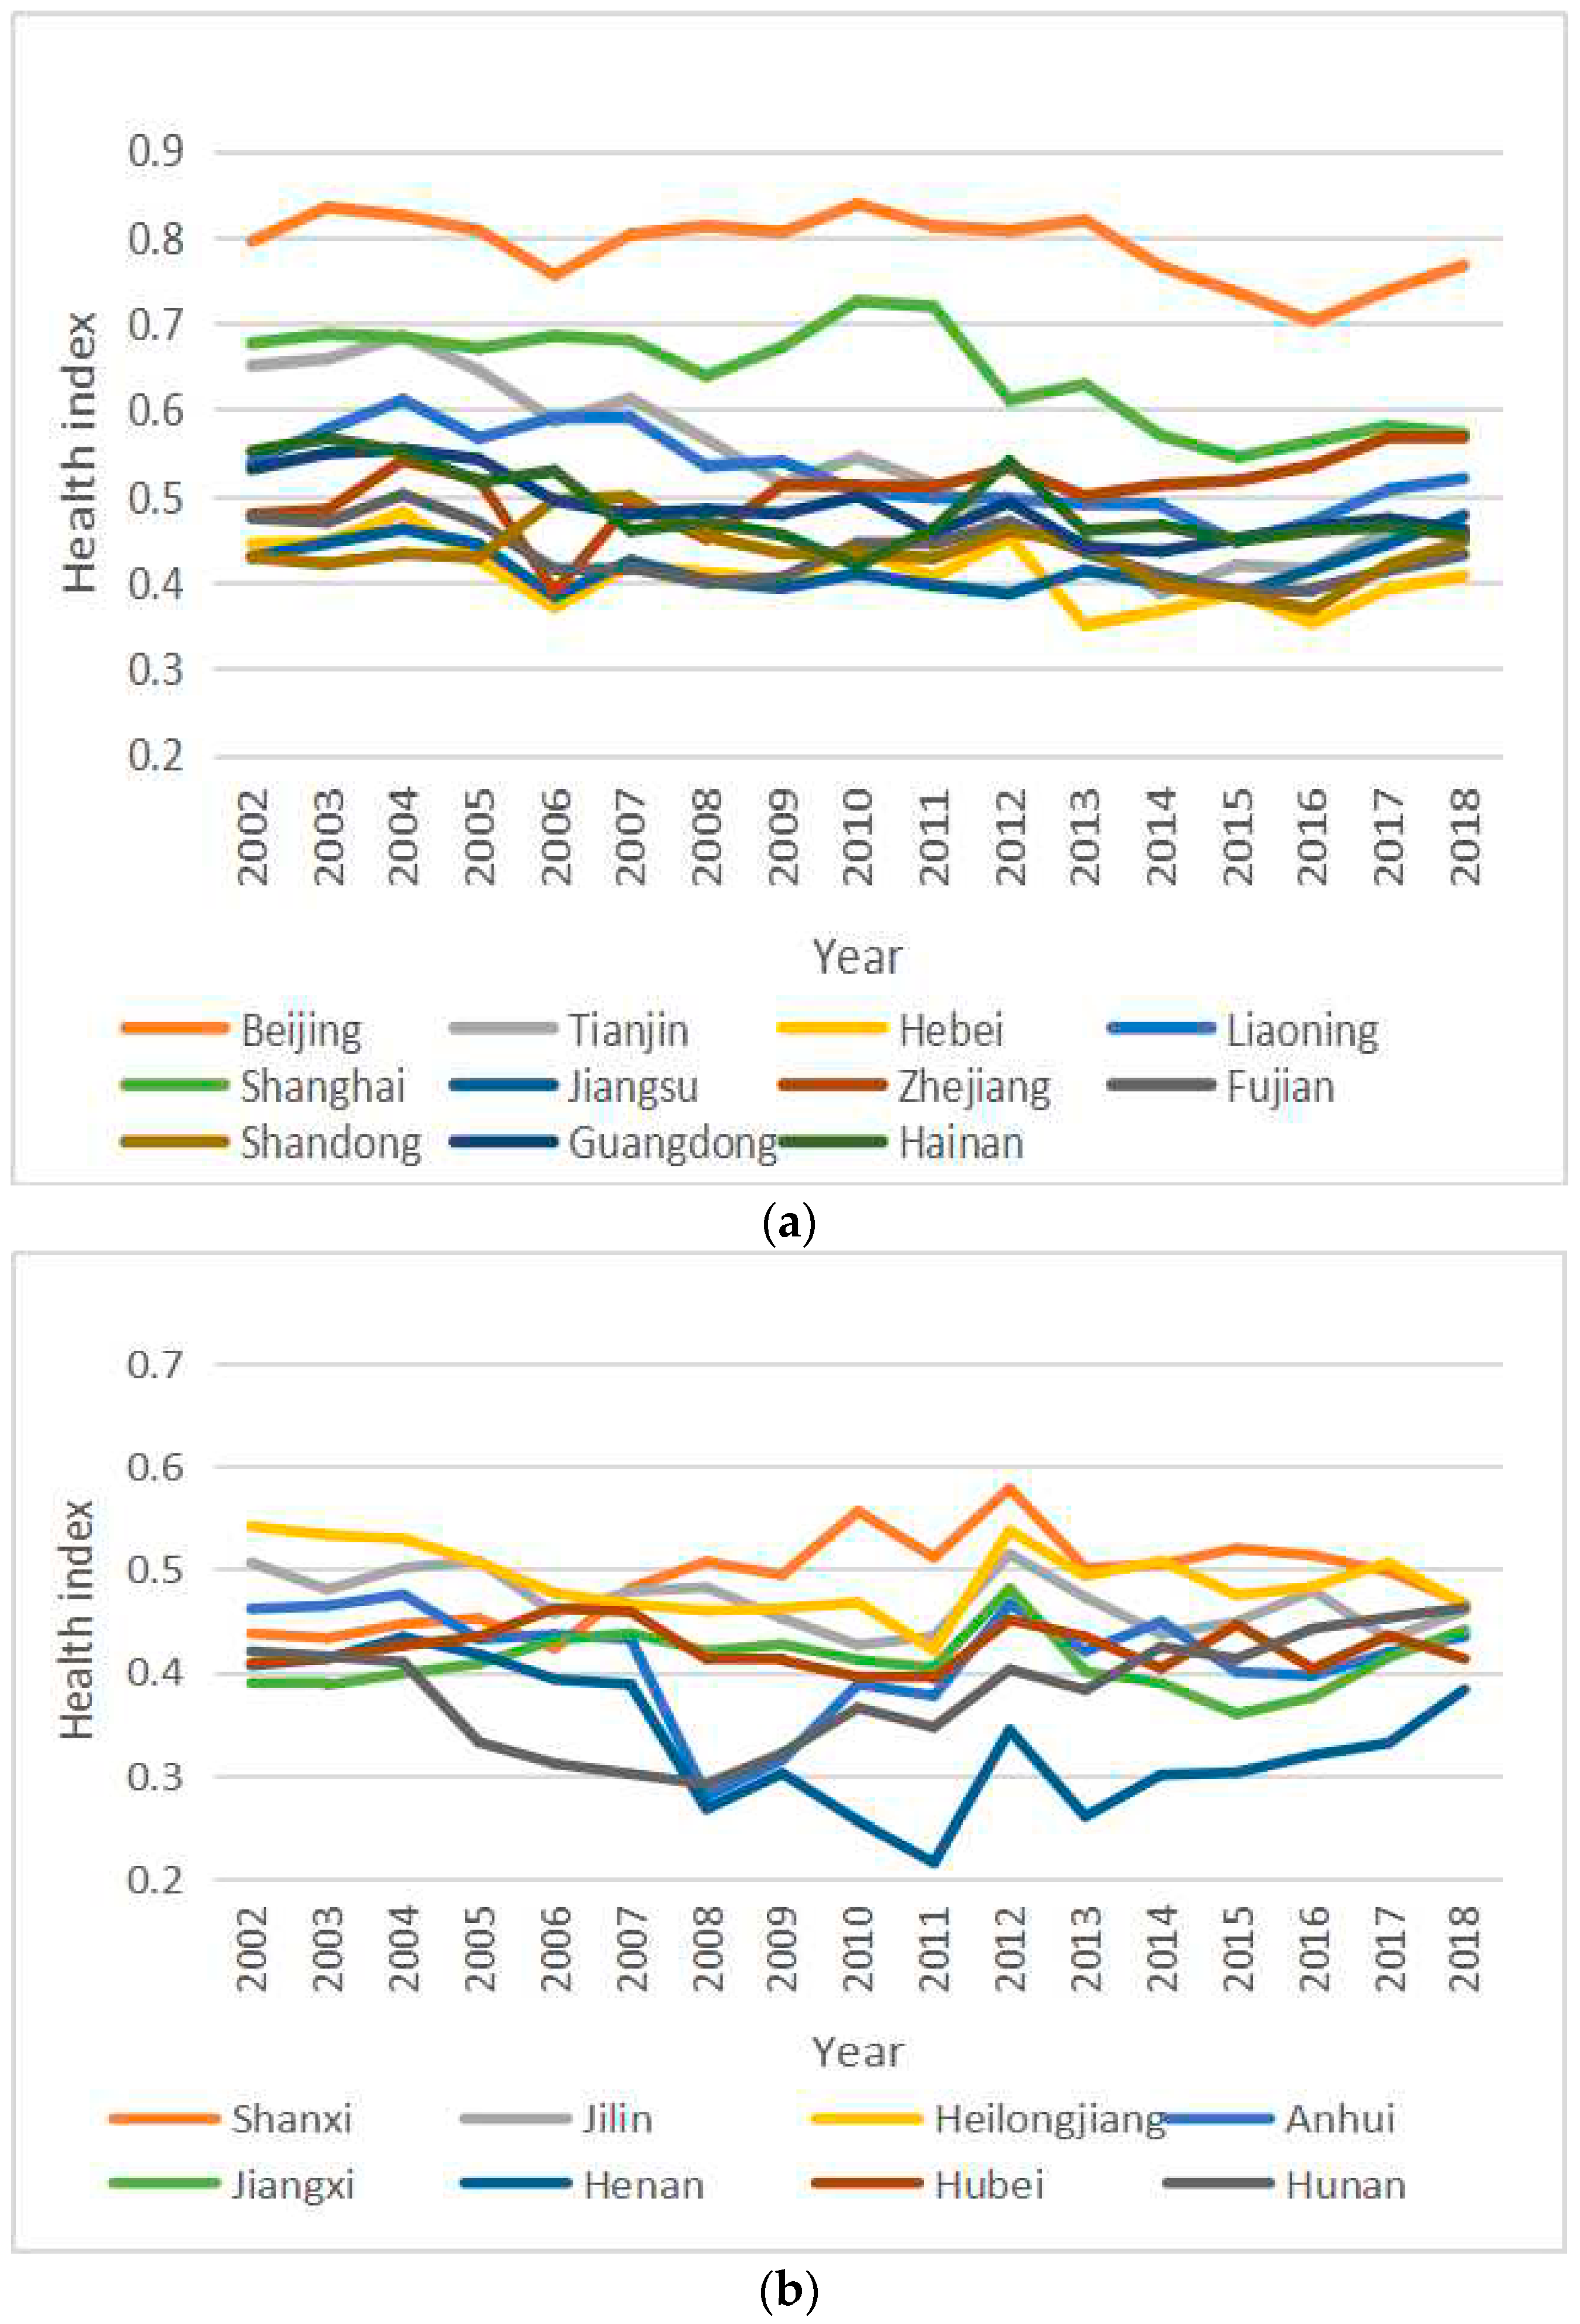
4.1. A Comprehensive Evaluation of Citizens’ Health Levels
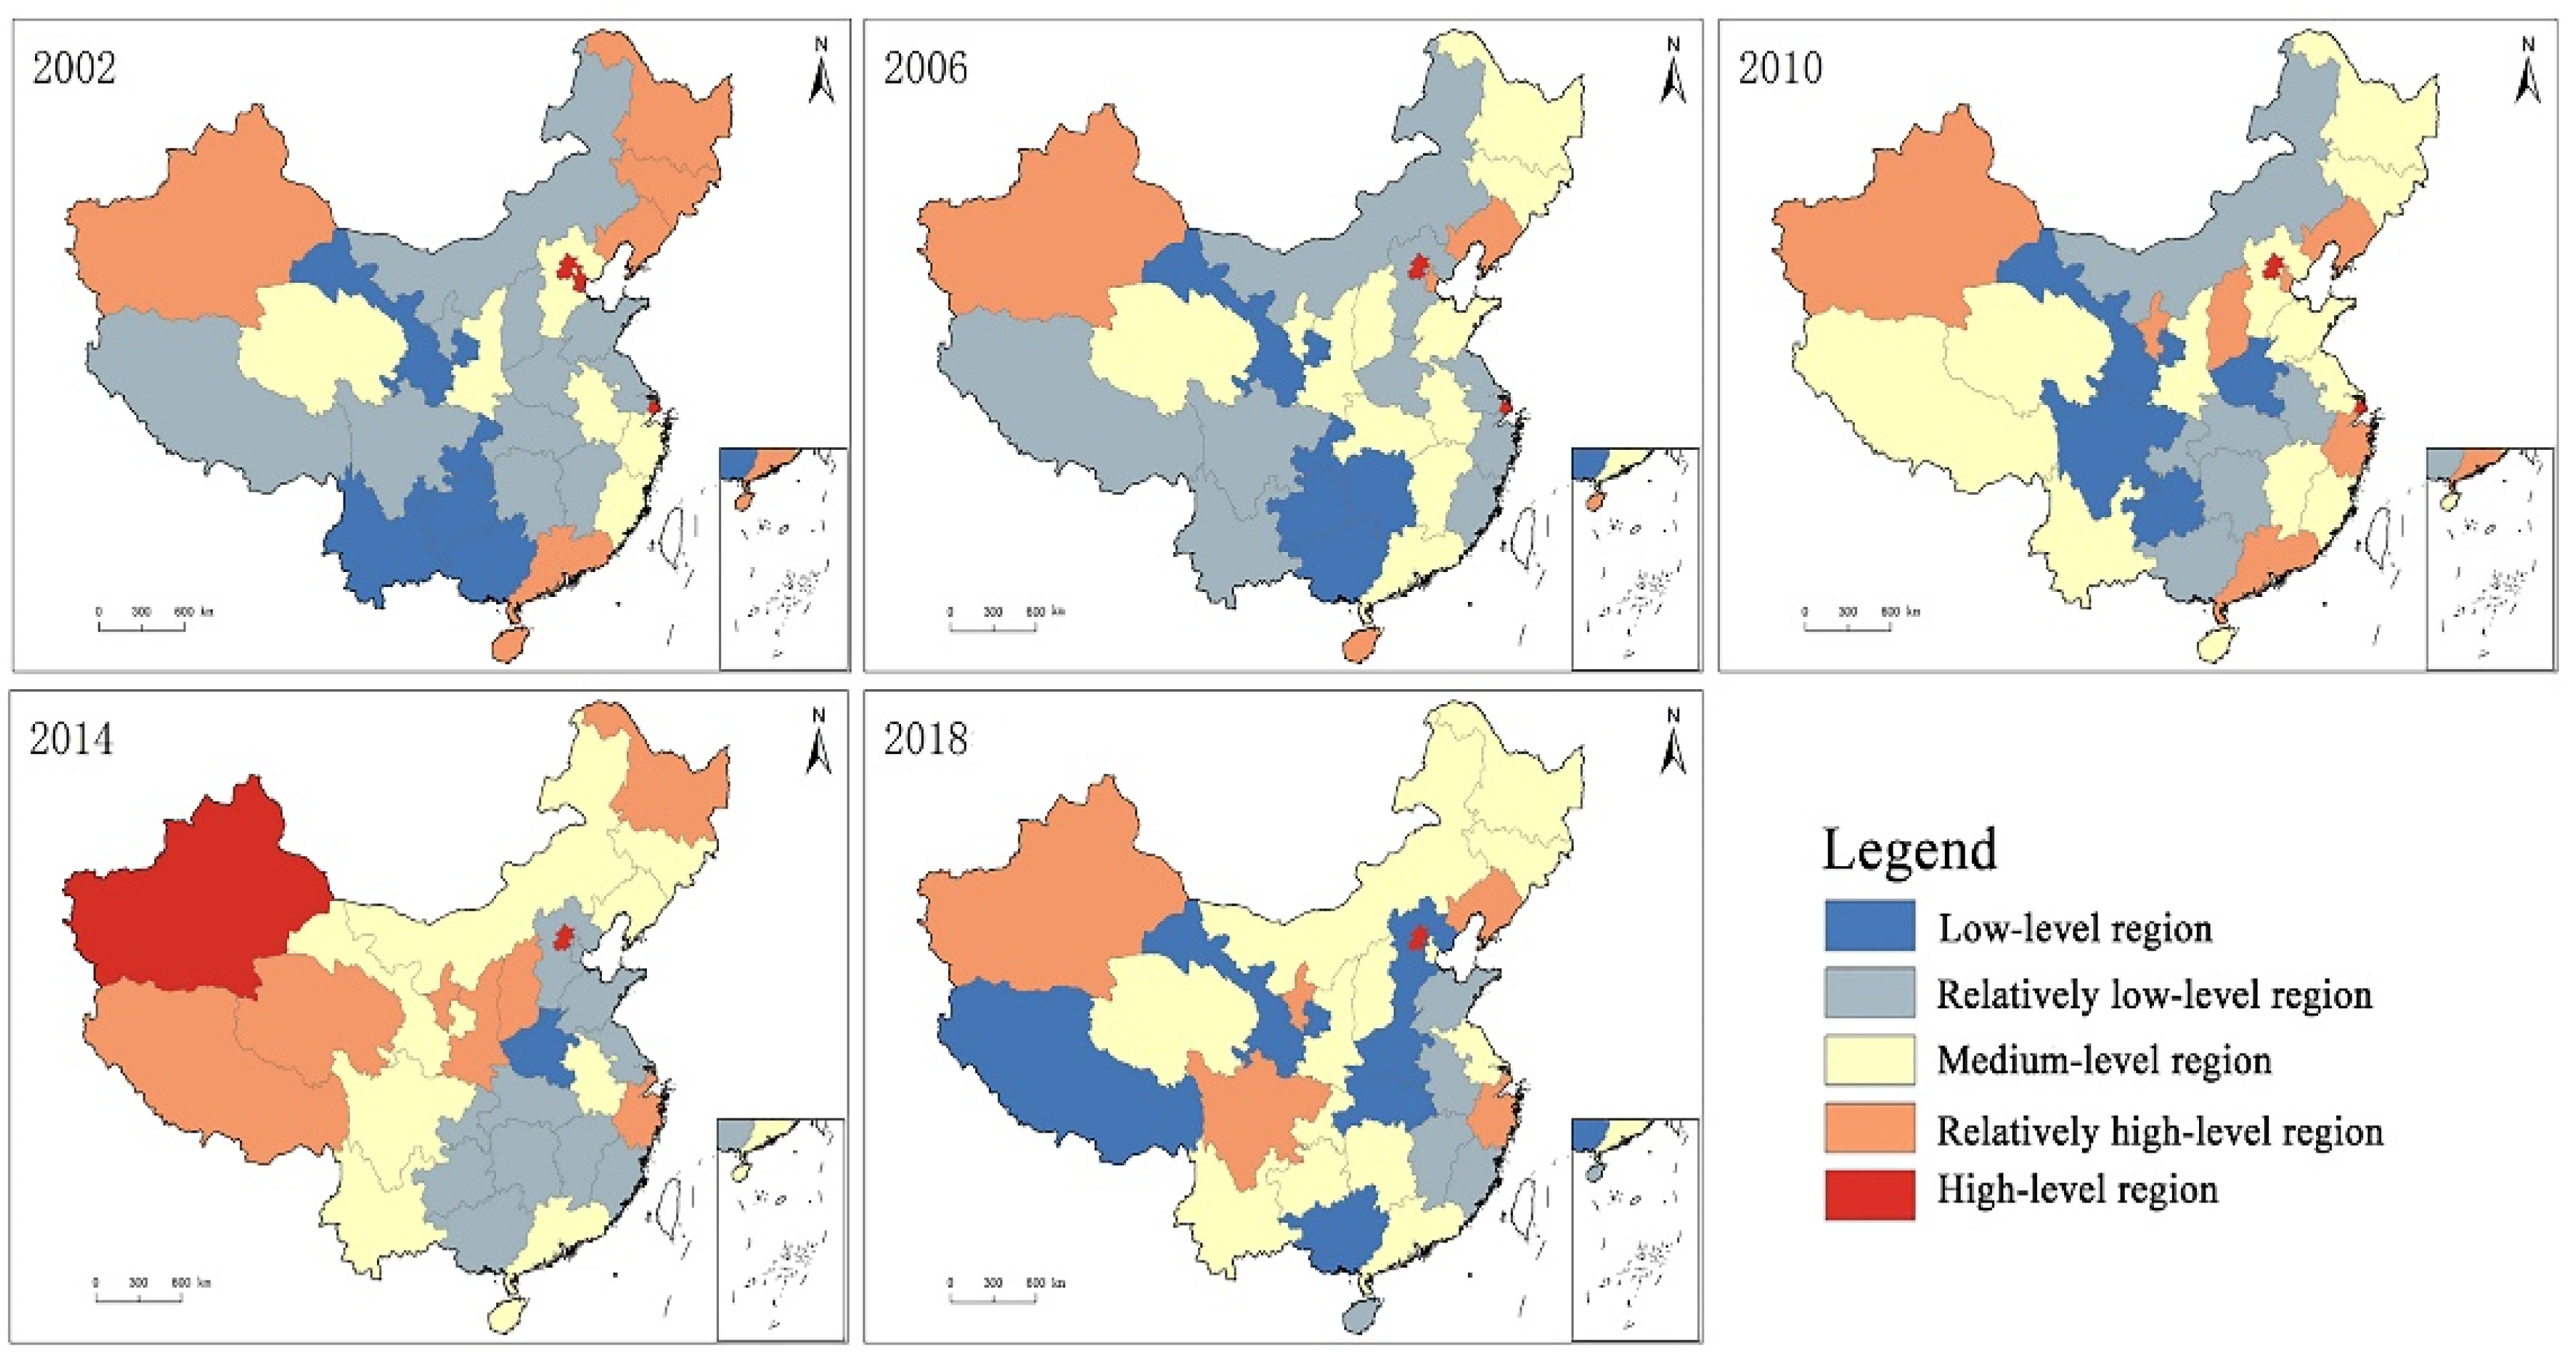
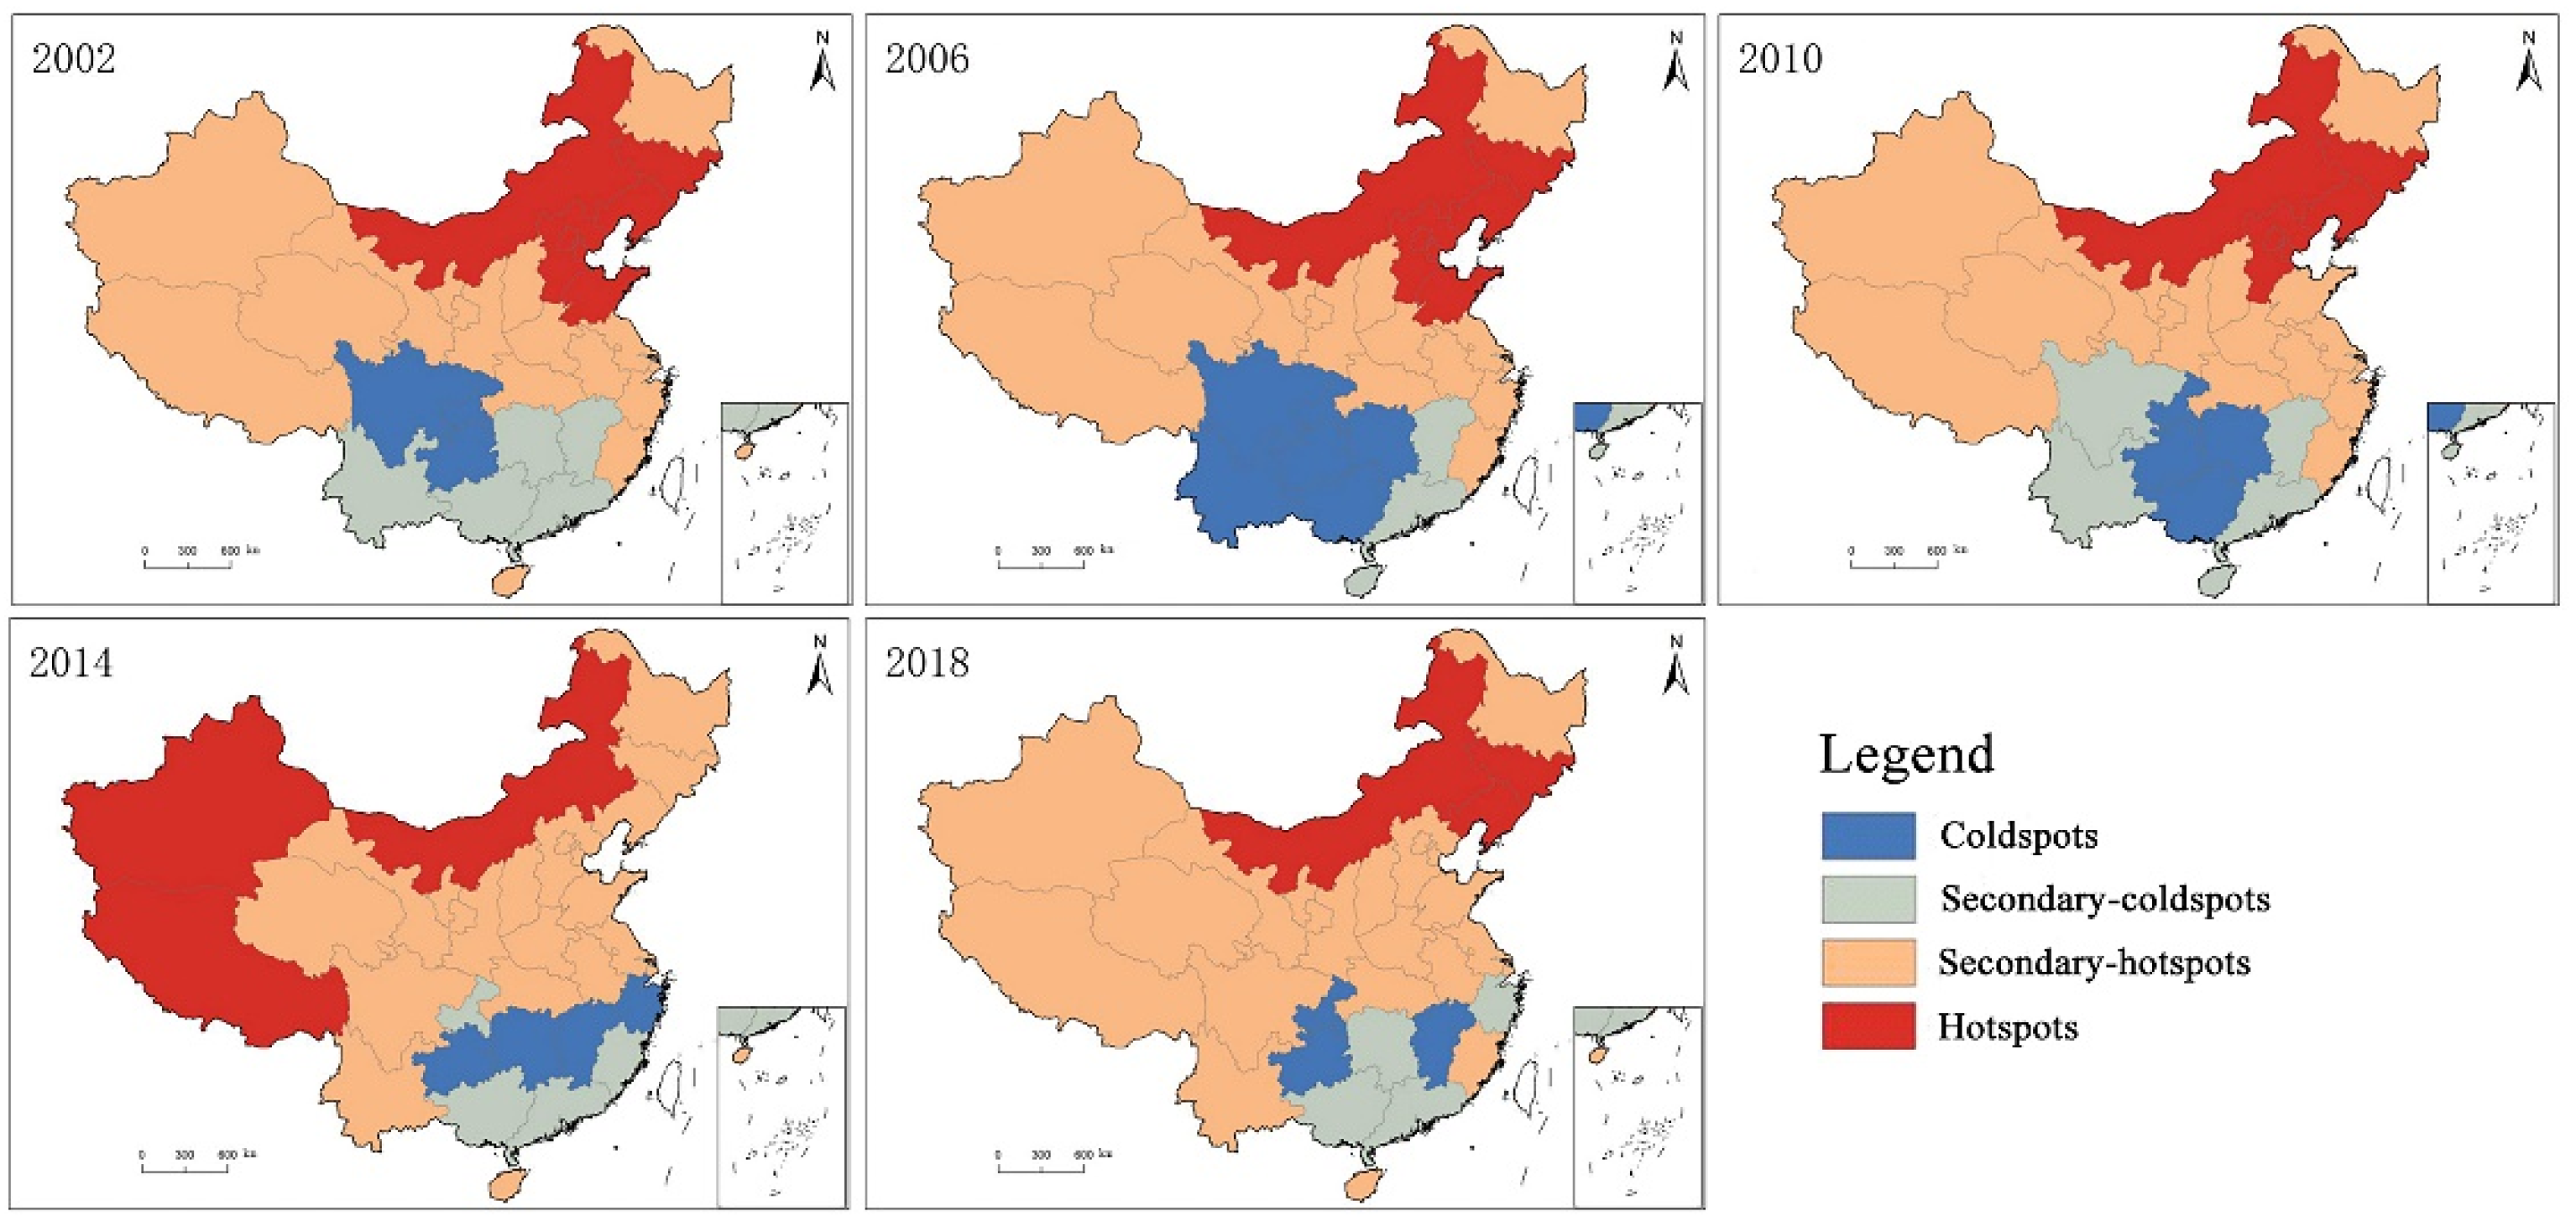
4.2. A Spatial Pattern Analysis of Citizens’ Health Levels
4.3. An Analysis of the Influencing Factors that Affect Citizens’ Health Levels
5. Conclusions
Supplementary Materials
Author Contributions
Funding
Acknowledgments
Conflicts of Interest
References
- McCartney, G.; Popham, F.; Mcmaster, R.; Cumbers, A. Defining health and health inequalities. Public Health 2019, 172, 22–30. [Google Scholar] [CrossRef] [PubMed]
- Cai, D.Y. Explanatory Theories of Health Inequalities and Their Implications. Med. Philos. 2019, 40, 40–43. (In Chinese) [Google Scholar]
- Sun, M.; Lu, X.S. Air Pollution, SES and Residents’ Health Inequality-Micro Evidence Based on CGSS. Popul. J. 2019, 41, 103–112. (In Chinese) [Google Scholar]
- Smyth, F. Medical geography: Understanding health inequalities. Prog. Hum. Geogr. 2008, 32, 119–127. [Google Scholar] [CrossRef]
- Mackenbach, J.P.; Valverde, J.R.; Artnik, B. Trends in health inequalities in 27 European countries. Proc. Natl. Acad. Sci. USA 2018, 115, 6440–6445. [Google Scholar] [CrossRef]
- Lucinda, C.; Diego, F.; Juan, M.; Joan, B. Inequalities in global health inequalities research: A 50-year bibliometric analysis (1966–2015). PLoS ONE 2018, 13, 1–22. [Google Scholar]
- Braveman, P. Health disparities and health equity: Concepts and measurement. Ann. Rev. Public Health 2006, 27, 167–194. [Google Scholar] [CrossRef]
- Kirby, R.S. Geography of health inequalities in the developed world: Views from Britain and North America. Prof. Geogr. 2005, 57, 615–617. [Google Scholar] [CrossRef]
- DeMarchis, E.H.; Doekhie, K.; Willard-Grace, R.; Olayiwola, J.N. The Impact of the Patient-Centered Medical Home on Health Care Disparities: Exploring Stakeholder Perspectives on Current Standards and Future Directions. Popul. Health Manag. 2019, 22, 99–107. [Google Scholar] [CrossRef]
- Johnson, M.; Mcpheron, H.; Dolin, R.; Doherty, J.; Green, L. Making the Case for Addressing Health Disparities: What Drives Providers and Payers? Health Equity 2018, 2, 74–81. [Google Scholar] [CrossRef]
- Zhao, X.Y.; Wang, W.J.; Wan, W.Y. Regional inequalities of residents’ health level in China: 2003–2013. Acta Geogr. Sin. 2018, 28, 741–758. [Google Scholar]
- Yu, C.H.; Hou, Y.Y. The concept and thinking for “One Health”. J. Public Health Prev. Med. 2018, 29, 1–5. (In Chinese) [Google Scholar]
- WHO. 10 Facts on Health Inequities and Their Causes. Available online: https://www.who.int/features/factfiles/health_inequities/en/ (accessed on 6 March 2019).
- Grossman, M. On the Concept of Health Capital and the Demand for Health. J. Polit. Econ. 1972, 80, 223–255. [Google Scholar] [CrossRef]
- Vladeck, B.C. Equity, access, and the costs of health services. Med. Care 1981, 19, 69–80. [Google Scholar] [CrossRef]
- Grand, J.L. An international comparison of distributions of ages-at-death. J. Urol. 1989, 183, 68–75. [Google Scholar]
- Townsend, P. Inequity and the health service. Lancet 1974, 303, 1179–1190. [Google Scholar] [CrossRef]
- Smith, D.B.; Kaluzny, A.D. Inequality in Health Care Programs: A Note on Some Structural Factors Affecting Health Care Behavior. Med. Care 1974, 12, 860–870. [Google Scholar] [CrossRef]
- Macintyre, S. The black report and beyond what are the issues? Soc. Sci. Med. 1997, 44, 723–745. [Google Scholar] [CrossRef]
- Perrin, J.M.; Valvona, J. Does increased physician supply affect quality of care? Health Aff. 1986, 5, 63–72. [Google Scholar] [CrossRef][Green Version]
- Ityavyar, D.A. Health services inequalities in Nigeria. Soc. Sci. Med. 1988, 27, 1223–1235. [Google Scholar] [CrossRef]
- Murray, C.J.; Salomon, J.A.; Mathers, C.D. A critical examination of summary measures of population health. Bull. World Health Organ. 2000, 78, 981–994. [Google Scholar] [PubMed]
- Willems, S.; Maeseneer, J.D. Tackling social inequalities in health. Eur. J. Gen. Pract. 2009, 9, 38–39. [Google Scholar] [CrossRef][Green Version]
- Skaftun, E.K.; Verguet, S.; Norheim, O.F.; Johansson, K.A. Geographic health inequalities in Norway: A Gini analysis of cross-county differences in mortality from 1980 to 2014. Int. J. Equity Health 2018, 64, 2–8. [Google Scholar] [CrossRef] [PubMed]
- Brunello, G.; Fort, M.; Schneeweis, N. The causal effect of education on health: What is the role of health behaviors? Health Econ. 2016, 25, 313–336. [Google Scholar] [CrossRef] [PubMed]
- Gallardo, K.; Varas, L.; Gallardo, M. Inequality of Opportunity in Health: Evidence from Chile. Rev. Saude Publica 2017, 51, 110. [Google Scholar] [CrossRef] [PubMed]
- Addison, M.; Kaner, E.; Johnstone, P. Equal North: How can we reduce health inequalities in the North of England? A prioritization exercise with researchers, policymakers and practitioners. J. Public Health 2019, 41, 652–664. [Google Scholar] [CrossRef] [PubMed]
- Brown, A.F.; Ma, G.X.; Miranda, J. Structural Interventions to Reduce and Eliminate Health Disparities. Am. J. Public Health 2019, 109, 72–78. [Google Scholar] [CrossRef]
- Yin, D.M.; Hu, S.L.; Chen, X.M.; Wei, Y. A research on the equity in health service of poor area in China. Chin. Health Econ. 1999, 3, 7–10. (In Chinese) [Google Scholar]
- Zhu, W.; Tian, Q.F.; Zhu, H.B. Studying on equity in rural health service in Henan province. Health Econ. Res. 2001, 1, 27–29. (In Chinese) [Google Scholar]
- Xie, E. Income-related Inequality of Health and Health Care Utilization. Econ. Res. J. 2009, 2, 92–105. (In Chinese) [Google Scholar] [CrossRef]
- Li, L.Q.; Xu, R. Analysis of regional differences in Health level of Chinese residents. Health Econ. Res. 2015, 1, 14–20. (In Chinese) [Google Scholar]
- Yang, Z.; Ding, Q.Y.; Zhou, Q.Y. Multidimensional Measurement of National Health Level and its Spatial and Temporal Difference Characteristics in China: Taking 31 Provincial Units as Example. Northwest Popul. J. 2018, 3, 82–90. (In Chinese) [Google Scholar]
- Huang, Y.J. National Health Level and Regional Gap under the Background of “Healthy China” Index. Sci. Dev. 2019, 123, 71–81. (In Chinese) [Google Scholar]
- Dai, J.; Wang, W.Y.; Li, X.H.; Li, W. Analysis of Basic Health Resources Arrangement and It’s Inclusive Growth in Yunnan province from 2008 to 2014. Med. Soc. 2017, 1, 12–14. (In Chinese) [Google Scholar]
- Wang, X.J.Z.; Huang, R.Q. Study on the health status of residents in ethnic areas and its influencing factors. Geogr. Res. 2019, 30, 206–208. (In Chinese) [Google Scholar]
- Gong, S.S.; Chen, Y. Temporal-spatial relationship between health resources and residents’ health in Southern China. Geogr. Res. 2020, 39, 115–128. (In Chinese) [Google Scholar]
- Liu, C.P.; Wang, L.J. A Study of the Impact of Socioeconomic Status on the Health of the Elderly. Chin. J. Popul. Sci. 2017, 5, 40–50. (In Chinese) [Google Scholar]
- Zhao, L.G.; Deng, X.J.; Wang, X.Y. Socioeconomic Status, Environmental Sanitation Facilities and Health of Rural Residents. Probl. Agric. Econ. 2018, 7, 96–107. (In Chinese) [Google Scholar]
- Li, X.; Zhao, X.D. How does Education Affect the Health Level of the Elderly in China? J. Financ. Econ. 2020, 46, 139–153. (In Chinese) [Google Scholar]
- Yu, C.H.; Feng, T.C. Outlook the goal of China Health-related SDG 2030. J. Public Health Prev. Med. 2018, 29, 1–6. (In Chinese) [Google Scholar]
- Roemer, J.E.; Trannoy, A. Equality of Opportunity: Theory and Measurement. J. Econ. Lit. 2016, 54, 1288–1332. [Google Scholar] [CrossRef]
- Chen, H.S.; Liu, Y.; Li, Z.G.; Xue, D.S. Urbanization, economic development and health: Evidence from China’s labor-force dynamic survey. Int. J. Equity Health 2017, 16, 207. [Google Scholar] [CrossRef] [PubMed]
- Carrieri, V.; Jones, A.M. Inequality of Opportunity in Health: A Decomposition-based Approach. Health Econ. 2018, 27, 1981–1995. [Google Scholar] [CrossRef] [PubMed]
- Berloffa, G.; Giunti, S. Remittances and healthcare expenditure: Human capital investment or responses to shocks? Evidence from Peru. Rev. Dev. Econ. 2019, 23, 1540–1561. [Google Scholar] [CrossRef]
- Zhao, G.X.; Cao, X.M.; Ma, C. Accounting for Horizontal Inequity in the Delivery of Health Care in China: A Framework for Measurement and Decomposition. Int. Rev. Econ. Financ. 2020, 66, 13–24. [Google Scholar] [CrossRef]
- Liu, K.H.; Tong, J.D. Does export expansion affect health in China?—An extended analysis based on Grossman model. Syst. Eng. Theory Pract. 2019, 39, 2451–2465. (In Chinese) [Google Scholar]
- Romaire, M.A.; Alva, M.L.; Witman, A.E.; Acquah, J.K. Impact of Financial Incentives on Service Use, Spending, and Health in Medicaid. Am. J. Prev. Med. 2018, 55, 875–886. [Google Scholar] [CrossRef]
- Gu, H.J.; Cao, Y.X.; Elahi, E.; Jja, S.K. Human health damages related to air pollution in China. Environ. Sci. Pollut. Res. 2019, 26, 13115–13125. [Google Scholar] [CrossRef]
- Duan, S.G.; Yang, X.Y.; Cen, X.Y. A Comprehensive Evaluation of Regional Integrated Development of Production and City based on Entropy Method: Example as Xinjiang Uygur Autonomous Region. J. Urban Stud. 2018, 39, 28–33. (In Chinese) [Google Scholar]
- Qian, H.Y.; Elahi, B.A.; Tian, X.Y.; Sun, S.; Wu, P.; Wang, Y.B. Evaluating drivers and flow patterns of inter-provincial grain virtual water trade in China. Sci. Total Environ. 2020, 732, 139251. [Google Scholar] [CrossRef]
- Ma, H.T.; Xu, X.F. High-Quality Development Assessment and Spatial Heterogeneity of Urban Agglomeration in the Yellow River Basin. Econ. Geogr. 2020, 40, 11–18. (In Chinese) [Google Scholar]
- Wang, B.; Liu, J. Comprehensive Evaluation and Analysis of Maritime Soft Power Based on the Entropy Weight Method (EWM). J. Phys. Conf. Ser. 2019, 1168, 032108. [Google Scholar] [CrossRef]
- Lian, X.; Morimoto, T. Spatial Analysis of Social Vulnerability to Floods Based on the MOVE Framework and Information Entropy Method: Case Study of Katsushika Ward, Tokyo. Sustainability 2019, 11, 529. [Google Scholar]
- Chen, M.X.; Lu, D.D.; Zhang, H. Comprehensive Evaluation and the Driving Factors of China’s Urbanization. Acta Geogr. Sin. 2009, 64, 387–398. (In Chinese) [Google Scholar]
- Zhang, W.M. Evaluation of Urban Sustainable Development Based on Entropy. J. Xiamen Univ. Arts Soc. Sci. 2004, 162, 109–115. (In Chinese) [Google Scholar]
- Perera, E.N.C.; Jayawardana, D.T.; Jayasinghe, P.; Ranagalage, M. Landslide vulnerability assessment based on entropy method: A case study from Kegalle district, Sri Lanka. Model. Earth Syst. Environ. 2019, 24, 1635–1649. [Google Scholar] [CrossRef]
- Jiang, X.Y.; Sheng, H.Q.; Li, X.; Ma, G.F.; Qiu, L.J.; Ma, A.N. Analysis on the Spatial Distribution of Income and Expenditure of Medical and Health Institutions in China. Chin. Health Econ. 2019, 38, 33–36. (In Chinese) [Google Scholar]
- Hu, X.Y.; Zhang, Z.L.; Chen, X.P.; Wang, Y.J. Geographic detection of spatial-temporal difference and its influencing factors on county economic development: A case study of Gansu province. Geogr. Res. 2019, 38, 772–783. (In Chinese) [Google Scholar]
- Si, H.P.; Niu, X.K.; Li, W.L.; Li, Y.L.; Sun, C.X. Analysis of Influencing Factors for Family Farm Management Scale Based on Stepwise Regression. Ecol. Econ. 2019, 35, 119–123. (In Chinese) [Google Scholar]
- Yang, Z.; Liu, H.M.; Wang, X.X. Spatio-temporal variations of population health distribution in China and its influencing factors. World Reg. Stud. 2017, 26, 161–168. (In Chinese) [Google Scholar]
- Hou, J.P. Demonstration research of China citizen’s health fairness influence factor. Spec. Zone Econ. 2006, 10, 26–28. (In Chinese) [Google Scholar]
- Wang, X.X. The Spatio-Temporal Change of Population Health Distribution and Its Influencing Factors in China. Master’s Thesis, Central China Normal University, Wuhan, China, 2017. (In Chinese). [Google Scholar]
- Xing, H.P. An empirical study on the influencing factors of residents’ health level in China. Mod. Bus. Trade Ind. 2020, 41, 72–73. (In Chinese) [Google Scholar]
- Nie, W.; Cai, P.P. Social Quality Influencing Residents’ Health. Chongqing Soc. Sci. 2020, 2, 129–140. (In Chinese) [Google Scholar]
- Yao, Q.; Zhang, Y.G.; Xu, L. Factors Affect Chinese Health—Related Quality of Life and the Effectiveness of Healthcare Reforms. Mark. Demogr. Anal. 2018, 24, 85–95. (In Chinese) [Google Scholar]


| Target Layer | Criteria Layer | Index Layer | SDGs Sources | Index Attributes |
|---|---|---|---|---|
| Health levels of Chinese citizens | Health status | Life expectancy per capita | + | |
| Population mortality | SDGs 3.4, 3.6 | − | ||
| Maternal mortality rate | SDGs 3.1 | − | ||
| Perinatal mortality | SDGs 3.2 | − | ||
| Statutory reporting of the incidence of infectious diseases in category A & B | SDGs 3.3 | − | ||
| Health literacy levels of citizens | + | |||
| Health environment | Safe water popularizing rate | SDGs 6.1 | + | |
| Rural sanitary toilet popularizing rate | SDGs 6.2 | + | ||
| The number of days when the air quality reaches or is better than type II | SDGs 11.6 | + | ||
| Landscaping ratio | SDGs 11.7 | + | ||
| Health services and guarantees | Hospitals per 10,000 people | SDGs 3.8 | + | |
| Health technicians per 1000 people | SDGs 3.8 | + | ||
| Number of beds in medical and health institutions per 1000 people | SDGs 3.8 | + | ||
| Total health expenditure as a percentage of GDP | SDGs 3.8 | + |
| Target Layer | Criteria Layer | Index Layer | A Brief Description of Each Index |
|---|---|---|---|
| Influencing factors that affect health levels of Chinese citizens | Economy | GDP per capita | X1 |
| Engel coefficient | X2 | ||
| Urban–rural income ratio | X3 | ||
| Society | Average years of education | X4 | |
| Urbanization rate | X5 | ||
| Family size | X6 | ||
| Environment | Wastewater discharge | X7 | |
| Solid waste discharge | X8 | ||
| Exhaust emission | X9 |
| Province | 2002 | 2003 | 2004 | 2005 | 2006 | 2007 | 2008 | 2009 | 2010 | 2012 | 2013 | 2014 | 2015 | 2016 | 2017 | 2018 |
|---|---|---|---|---|---|---|---|---|---|---|---|---|---|---|---|---|
| Beijing | 0.79 | 0.83 | 0.82 | 0.81 | 0.76 | 0.8 | 0.81 | 0.8 | 0.84 | 0.81 | 0.82 | 0.77 | 0.74 | 0.7 | 0.74 | 0.77 |
| Tianjin | 0.65 | 0.66 | 0.68 | 0.64 | 0.59 | 0.61 | 0.57 | 0.51 | 0.54 | 0.46 | 0.45 | 0.39 | 0.42 | 0.41 | 0.46 | 0.46 |
| Hebei | 0.44 | 0.45 | 0.48 | 0.43 | 0.37 | 0.42 | 0.41 | 0.4 | 0.44 | 0.45 | 0.35 | 0.37 | 0.39 | 0.35 | 0.39 | 0.41 |
| Shanxi | 0.44 | 0.43 | 0.45 | 0.45 | 0.42 | 0.48 | 0.51 | 0.49 | 0.56 | 0.58 | 0.5 | 0.5 | 0.52 | 0.51 | 0.5 | 0.47 |
| Inner Mongolia | 0.43 | 0.43 | 0.43 | 0.44 | 0.4 | 0.4 | 0.36 | 0.36 | 0.35 | 0.48 | 0.45 | 0.47 | 0.49 | 0.49 | 0.52 | 0.49 |
| Liaoning | 0.54 | 0.58 | 0.61 | 0.57 | 0.59 | 0.59 | 0.53 | 0.54 | 0.51 | 0.5 | 0.49 | 0.49 | 0.45 | 0.47 | 0.51 | 0.52 |
| Jilin | 0.51 | 0.48 | 0.5 | 0.51 | 0.46 | 0.48 | 0.48 | 0.45 | 0.43 | 0.51 | 0.47 | 0.44 | 0.45 | 0.48 | 0.43 | 0.46 |
| Heilongjiang | 0.54 | 0.53 | 0.53 | 0.51 | 0.48 | 0.47 | 0.46 | 0.46 | 0.47 | 0.54 | 0.49 | 0.51 | 0.47 | 0.48 | 0.51 | 0.47 |
| Shanghai | 0.68 | 0.69 | 0.68 | 0.67 | 0.69 | 0.68 | 0.64 | 0.67 | 0.73 | 0.61 | 0.63 | 0.57 | 0.54 | 0.56 | 0.58 | 0.57 |
| Jiangsu | 0.43 | 0.45 | 0.46 | 0.44 | 0.38 | 0.42 | 0.4 | 0.39 | 0.41 | 0.39 | 0.41 | 0.4 | 0.39 | 0.41 | 0.44 | 0.48 |
| Zhejiang | 0.48 | 0.48 | 0.54 | 0.52 | 0.39 | 0.49 | 0.45 | 0.51 | 0.51 | 0.53 | 0.5 | 0.51 | 0.52 | 0.53 | 0.57 | 0.57 |
| Anhui | 0.46 | 0.46 | 0.48 | 0.43 | 0.44 | 0.43 | 0.28 | 0.31 | 0.39 | 0.47 | 0.42 | 0.45 | 0.4 | 0.4 | 0.42 | 0.43 |
| Fujian | 0.47 | 0.47 | 0.5 | 0.47 | 0.42 | 0.42 | 0.4 | 0.41 | 0.45 | 0.47 | 0.43 | 0.41 | 0.39 | 0.39 | 0.41 | 0.43 |
| Jiangxi | 0.39 | 0.39 | 0.4 | 0.41 | 0.43 | 0.44 | 0.42 | 0.43 | 0.41 | 0.48 | 0.4 | 0.39 | 0.36 | 0.38 | 0.41 | 0.44 |
| Shandong | 0.43 | 0.42 | 0.43 | 0.43 | 0.49 | 0.5 | 0.45 | 0.43 | 0.43 | 0.46 | 0.45 | 0.4 | 0.38 | 0.37 | 0.42 | 0.45 |
| Henan | 0.41 | 0.41 | 0.43 | 0.42 | 0.39 | 0.39 | 0.27 | 0.3 | 0.26 | 0.34 | 0.26 | 0.3 | 0.3 | 0.32 | 0.33 | 0.38 |
| Hubei | 0.41 | 0.41 | 0.43 | 0.43 | 0.46 | 0.46 | 0.41 | 0.41 | 0.4 | 0.45 | 0.43 | 0.4 | 0.45 | 0.4 | 0.44 | 0.41 |
| Hunan | 0.42 | 0.42 | 0.41 | 0.33 | 0.31 | 0.3 | 0.29 | 0.32 | 0.37 | 0.4 | 0.38 | 0.42 | 0.41 | 0.44 | 0.45 | 0.46 |
| Guangdong | 0.53 | 0.55 | 0.55 | 0.54 | 0.49 | 0.48 | 0.48 | 0.48 | 0.5 | 0.49 | 0.44 | 0.44 | 0.45 | 0.46 | 0.47 | 0.46 |
| Guangxi | 0.37 | 0.36 | 0.37 | 0.33 | 0.27 | 0.35 | 0.39 | 0.35 | 0.36 | 0.42 | 0.36 | 0.39 | 0.36 | 0.4 | 0.39 | 0.4 |
| Hainan | 0.55 | 0.57 | 0.55 | 0.52 | 0.53 | 0.46 | 0.47 | 0.45 | 0.42 | 0.54 | 0.46 | 0.47 | 0.45 | 0.46 | 0.46 | 0.45 |
| Chongqing | 0.35 | 0.33 | 0.35 | 0.33 | 0.3 | 0.38 | 0.33 | 0.32 | 0.34 | 0.45 | 0.39 | 0.41 | 0.42 | 0.43 | 0.44 | 0.46 |
| Sichuan | 0.41 | 0.43 | 0.45 | 0.41 | 0.34 | 0.38 | 0.31 | 0.32 | 0.33 | 0.47 | 0.39 | 0.47 | 0.44 | 0.49 | 0.51 | 0.53 |
| Guizhou | 0.3 | 0.32 | 0.27 | 0.27 | 0.25 | 0.25 | 0.3 | 0.29 | 0.31 | 0.41 | 0.35 | 0.42 | 0.43 | 0.47 | 0.5 | 0.47 |
| Yunnan | 0.36 | 0.38 | 0.44 | 0.42 | 0.39 | 0.48 | 0.45 | 0.43 | 0.43 | 0.48 | 0.44 | 0.47 | 0.45 | 0.48 | 0.51 | 0.48 |
| Tibet | 0.4 | 0.39 | 0.41 | 0.34 | 0.42 | 0.47 | 0.43 | 0.42 | 0.43 | 0.43 | 0.41 | 0.5 | 0.5 | 0.45 | 0.46 | 0.41 |
| Shannxi | 0.48 | 0.5 | 0.51 | 0.51 | 0.43 | 0.49 | 0.47 | 0.43 | 0.46 | 0.52 | 0.49 | 0.5 | 0.5 | 0.51 | 0.5 | 0.48 |
| Gansu | 0.34 | 0.36 | 0.35 | 0.33 | 0.29 | 0.33 | 0.33 | 0.27 | 0.31 | 0.44 | 0.38 | 0.43 | 0.43 | 0.42 | 0.45 | 0.39 |
| Qinghai | 0.45 | 0.48 | 0.49 | 0.48 | 0.44 | 0.47 | 0.42 | 0.35 | 0.41 | 0.48 | 0.46 | 0.52 | 0.52 | 0.51 | 0.55 | 0.47 |
| Ningxia | 0.41 | 0.43 | 0.44 | 0.46 | 0.48 | 0.52 | 0.53 | 0.52 | 0.51 | 0.56 | 0.53 | 0.6 | 0.55 | 0.56 | 0.57 | 0.53 |
| Xinjiang | 0.55 | 0.58 | 0.57 | 0.62 | 0.56 | 0.61 | 0.57 | 0.58 | 0.6 | 0.67 | 0.64 | 0.68 | 0.67 | 0.66 | 0.64 | 0.51 |
| Year | 2002 | 2006 | 2010 | 2014 | 2018 |
|---|---|---|---|---|---|
| Moran’s I | 0.487152 | 0.491435 | 0.479296 | 0.17159 | 0.295829 |
| Z | 7.257849 | 7.260378 | 7.263132 | 2.830804 | 5.466729 |
| Variable | Coefficient | Std. Error | T-Statistic | Prob. |
|---|---|---|---|---|
| C | 0.64419 | 0.06120 | 10.53 | 0.000 |
| X2 | −0.00166 | 0.00065 | −2.54 | 0.011 |
| X3 | −0.01788 | 0.00710 | −2.52 | 0.012 |
| X4 | 0.02494 | 0.00464 | 5.38 | 0.000 |
| X5 | 0.00258 | 0.00035 | 7.36 | 0.000 |
| X7 | −0.03693 | 0.00249 | −14.82 | 0.000 |
| R2 | Adjusted R2 | F-statistic | Prob(F-statistic) | |
| 0.5912 | 0.5873 | 150.70 | 0.000 |
© 2020 by the authors. Licensee MDPI, Basel, Switzerland. This article is an open access article distributed under the terms and conditions of the Creative Commons Attribution (CC BY) license (http://creativecommons.org/licenses/by/4.0/).
Share and Cite
Lu, C.; Jin, S.; Tang, X.; Lu, C.; Li, H.; Pang, J. Spatio-Temporal Comprehensive Measurements of Chinese Citizens’ Health Levels and Associated Influencing Factors. Healthcare 2020, 8, 231. https://doi.org/10.3390/healthcare8030231
Lu C, Jin S, Tang X, Lu C, Li H, Pang J. Spatio-Temporal Comprehensive Measurements of Chinese Citizens’ Health Levels and Associated Influencing Factors. Healthcare. 2020; 8(3):231. https://doi.org/10.3390/healthcare8030231
Chicago/Turabian StyleLu, Chenyu, Shulei Jin, Xianglong Tang, Chengpeng Lu, Hengji Li, and Jiaxing Pang. 2020. "Spatio-Temporal Comprehensive Measurements of Chinese Citizens’ Health Levels and Associated Influencing Factors" Healthcare 8, no. 3: 231. https://doi.org/10.3390/healthcare8030231
APA StyleLu, C., Jin, S., Tang, X., Lu, C., Li, H., & Pang, J. (2020). Spatio-Temporal Comprehensive Measurements of Chinese Citizens’ Health Levels and Associated Influencing Factors. Healthcare, 8(3), 231. https://doi.org/10.3390/healthcare8030231