Consistency of Medical Data Using Intelligent Neuron Faster R-CNN Algorithm for Smart Health Care Application


Abstract
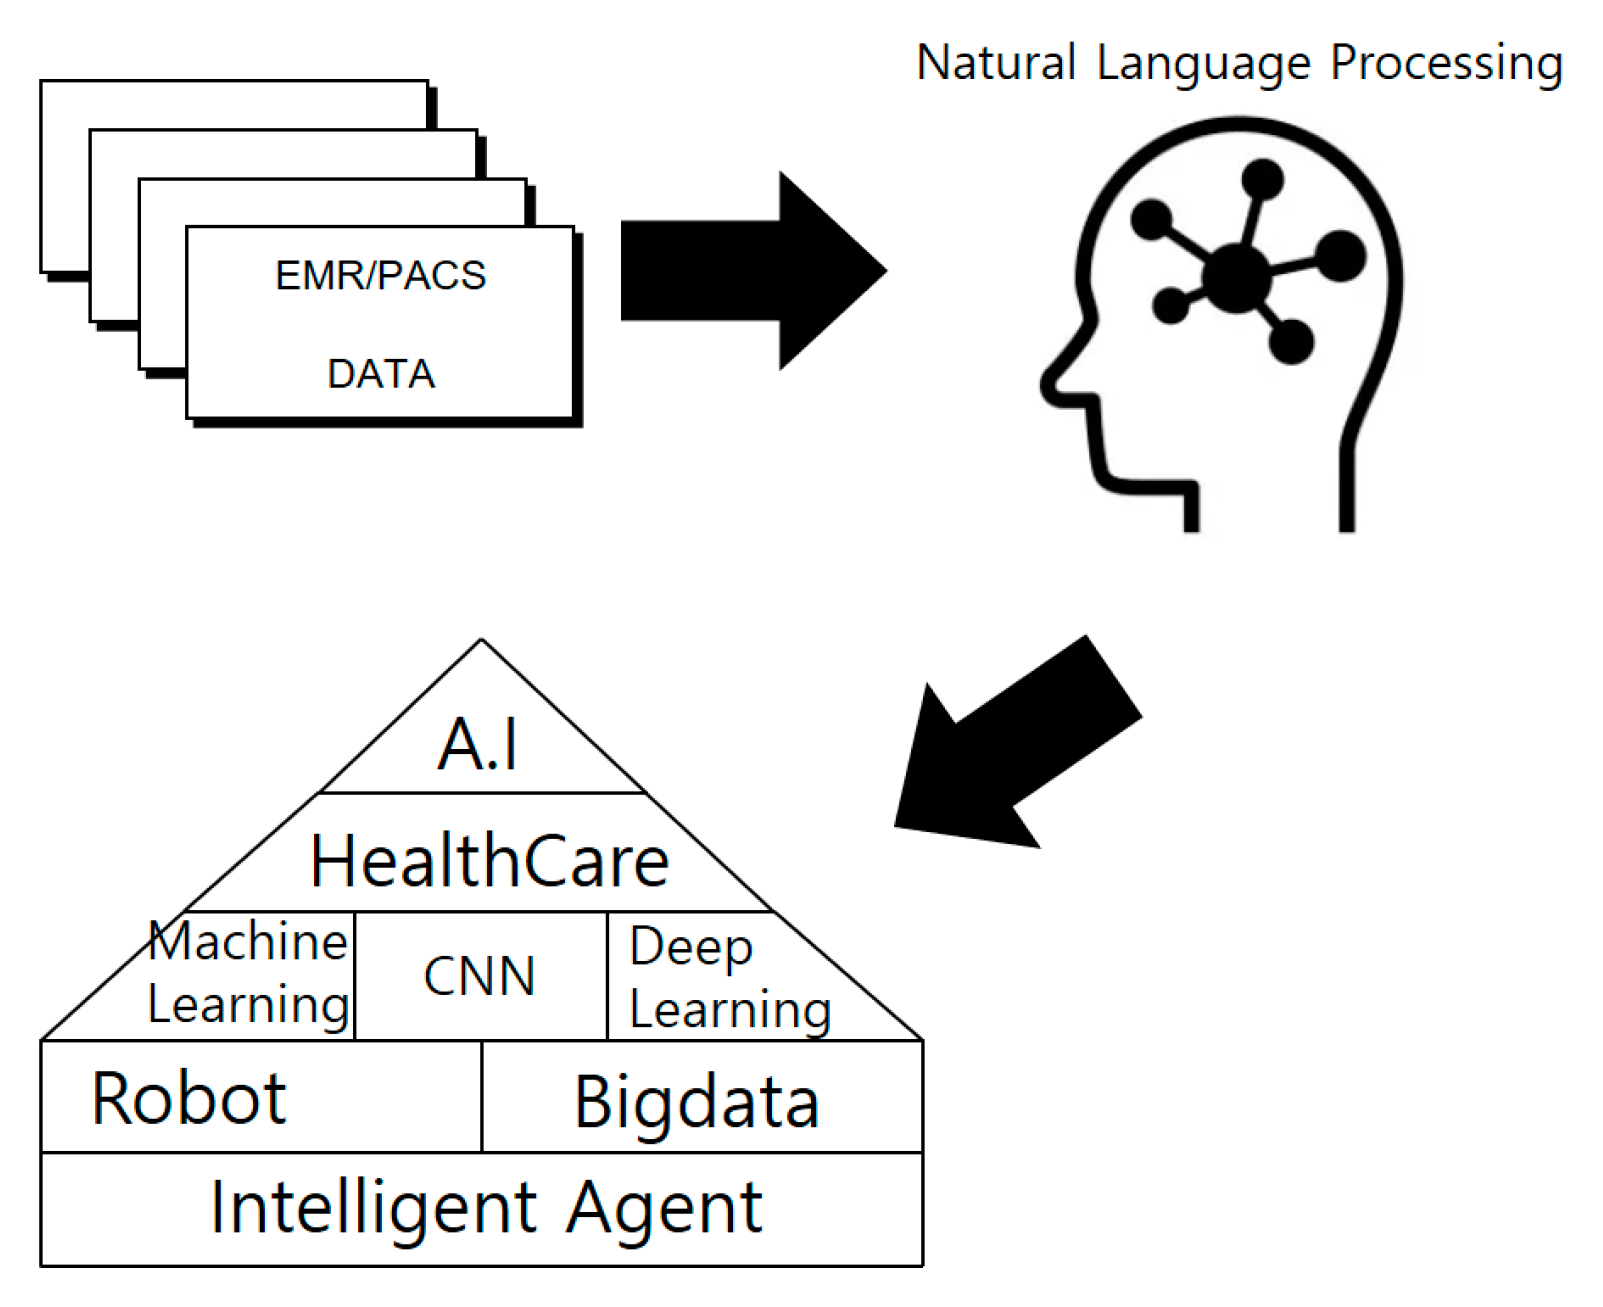
1. Introduction
2. Background Knowledge
2.1. Artificial Intelligence
2.1.1. Weak Artificial Intelligence
2.1.2. Strong Artificial Intelligence
2.2. Intelligent Agents
2.3. AI and Health Care
2.4. Smart Health Care
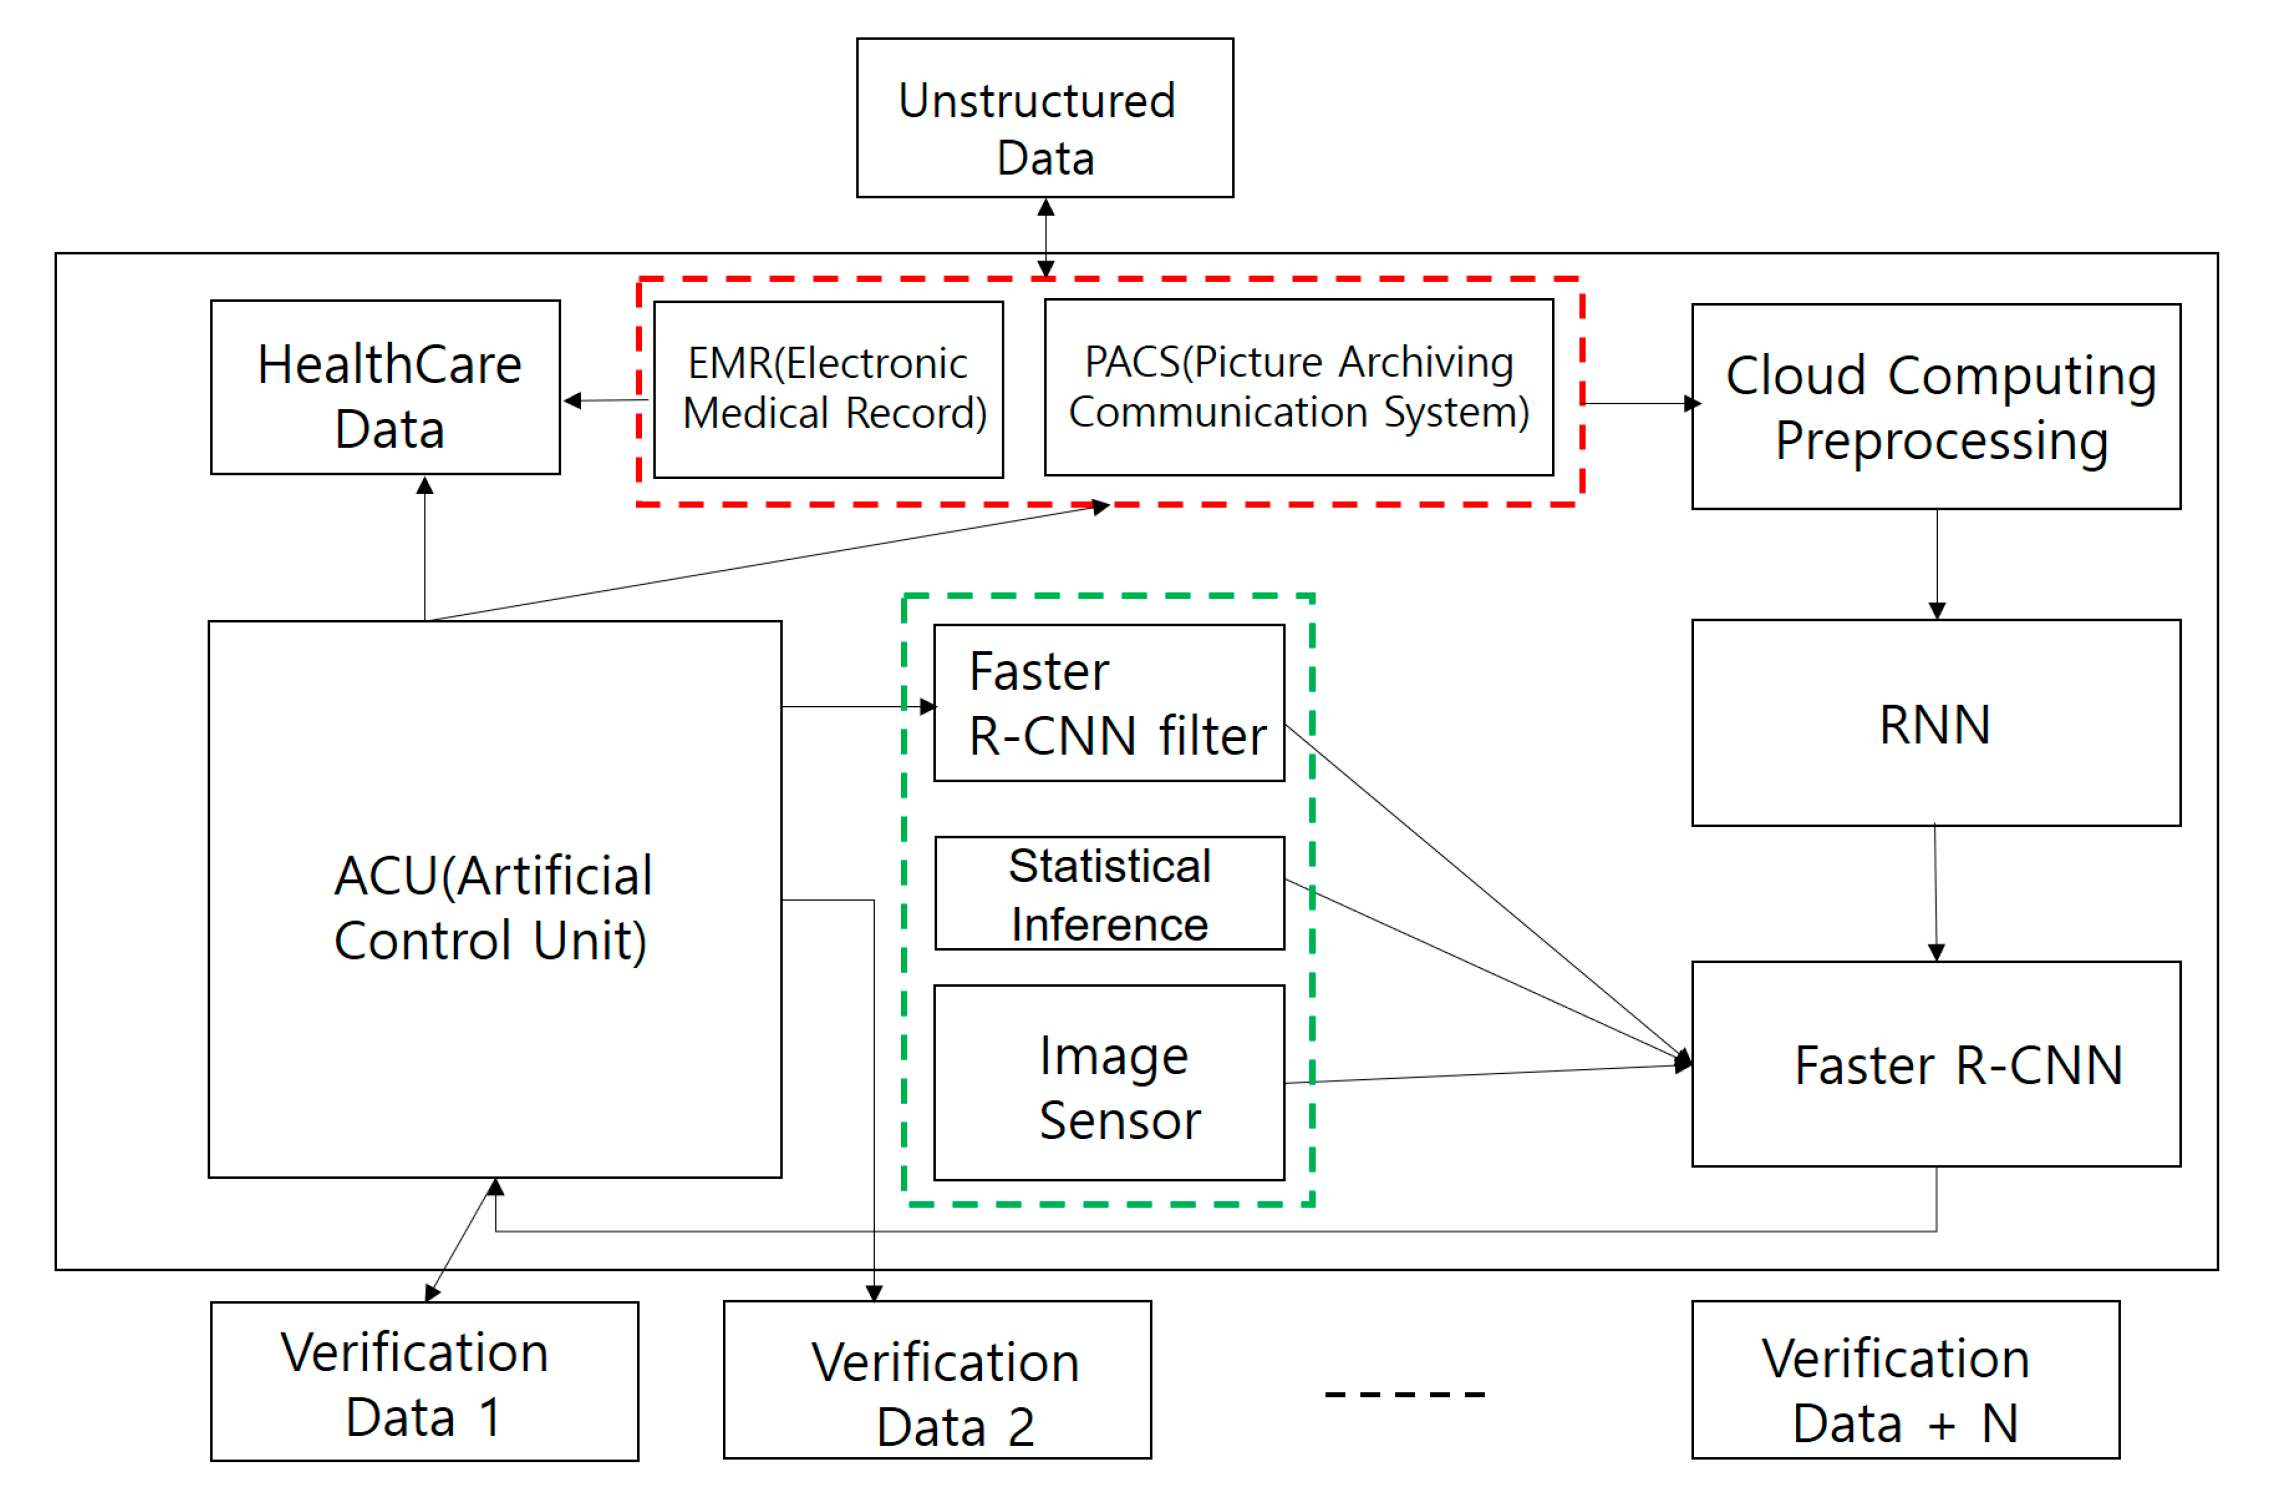
3. Smart Health Care Application Architecture with Intelligent Agent
3.1. Issue Raising
3.2. Research Methodology
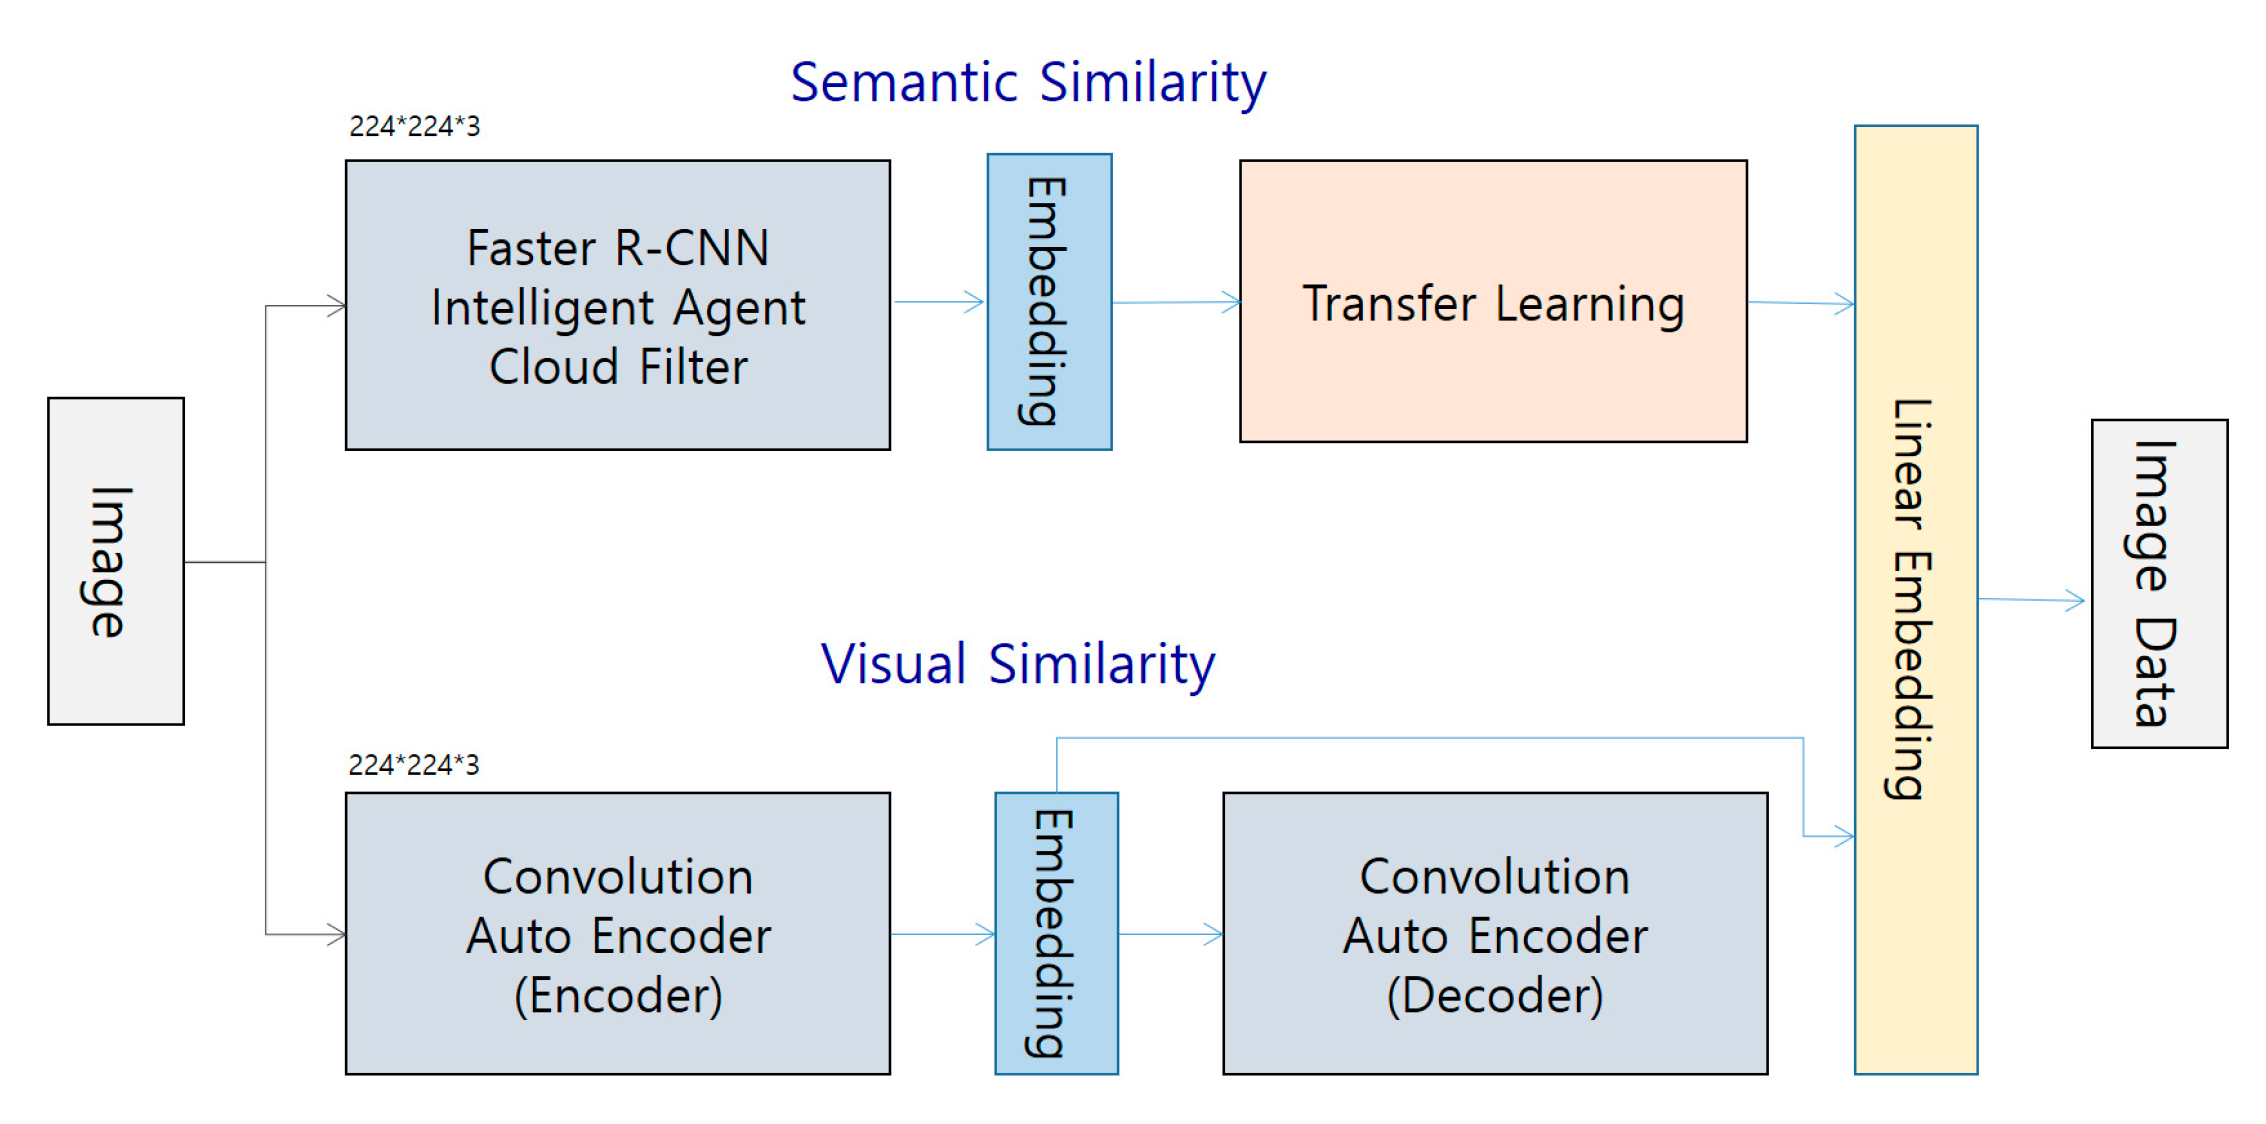
3.3. CNN intelligent Agent Cloud Architecture to Increase EMR Readings
3.4. Faster R-CNN Intelligent Agent Cloud Filter Architecture
- Total size: N (i.e., N × N × N × N × N)
- Filter size: F (i.e., F × F × F × F × F)
- Output size: k:=(N−F)/stride + 1 where k is an engineer.
- Total size: N
- Filter size: F
- Stride: s
- Padding size: p
- Consolidation layer size after padding: k = [(N+2p)−F]/s + 1
- K = N if and only if p = [(N−1)(N−1)s+(F−N)]/2
3.4.1. Faster R-CNN Algorithm Detection Technique
3.4.2. EMR (PACS) Image Detection Using the Faster R-CNN Algorithm
3.4.3. Faster R-CNN Intelligent Agent Cloud Filter Spatial Arrangement
3.4.4. Faster R-CNN Intelligent Agent Cloud Pooling Layer
- Determine two hyperparameters.
- F: Pooling filter (by size)
- S: Strikes
- Output W2 x H2 x D2 (pooling layer)
- W2, H2 = (W1, H2 − F)/2 + 1
- D2 = D1
3.4.5. Faster R-CNN Intelligent Agent Cloud Layer Pattern
3.5. Deep-rank Algorithm of Faster R-CNN
3.6. Time Variable of Faster R-CNN
3.7. Error Rate of Faster R-CNN
3.8. Design Patterns (State Pattern) of the Faster R-CNN Intelligent Agent Cloud Architecture
4. Experiments and Results
4.1. Experimental Environment
- -
- NVIDIA’s QuadroFX5800
- -
- QudroFX5800
- -
- NVIDIA SLI Multi-OS
- -
- Multiple Quadro GPUs
- -
- Workstations in virtualized environments (HP ML-500)
- -
- Booksim structure
- -
- Network environment internal network net
- -
- Network topology: Mesh
4.2. Comparison of Faster R-CNN Intelligent Agent Cloud Architecture with General EMR Performance
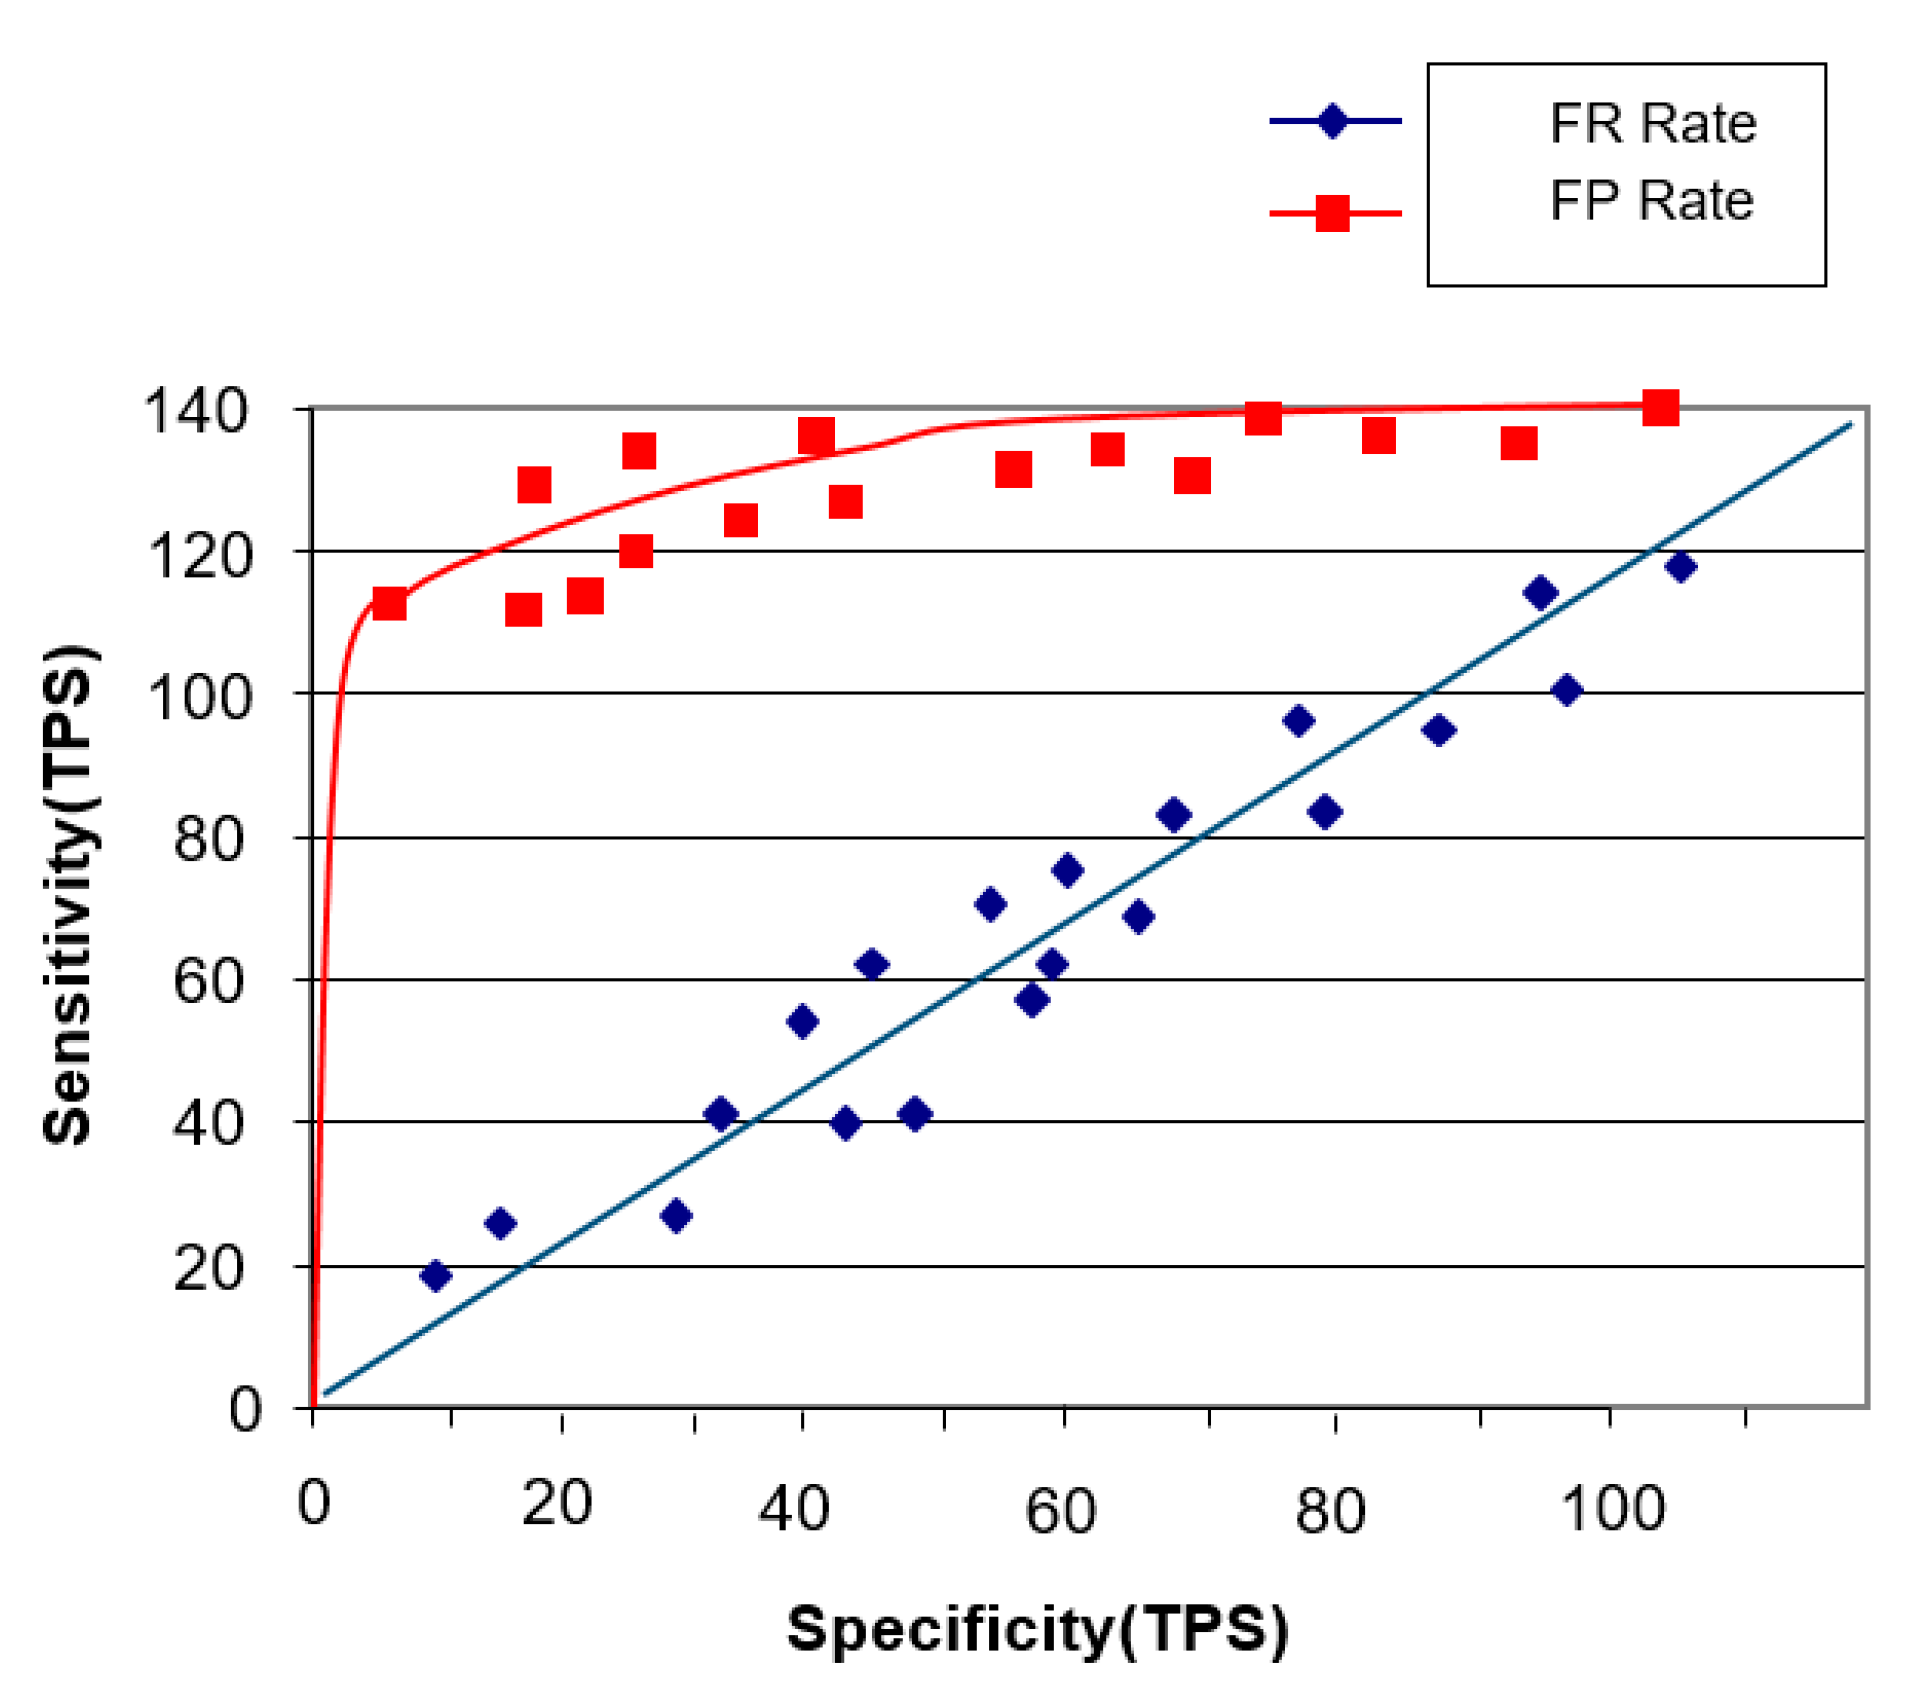
4.2.1. Sensitivity Performance Experiment
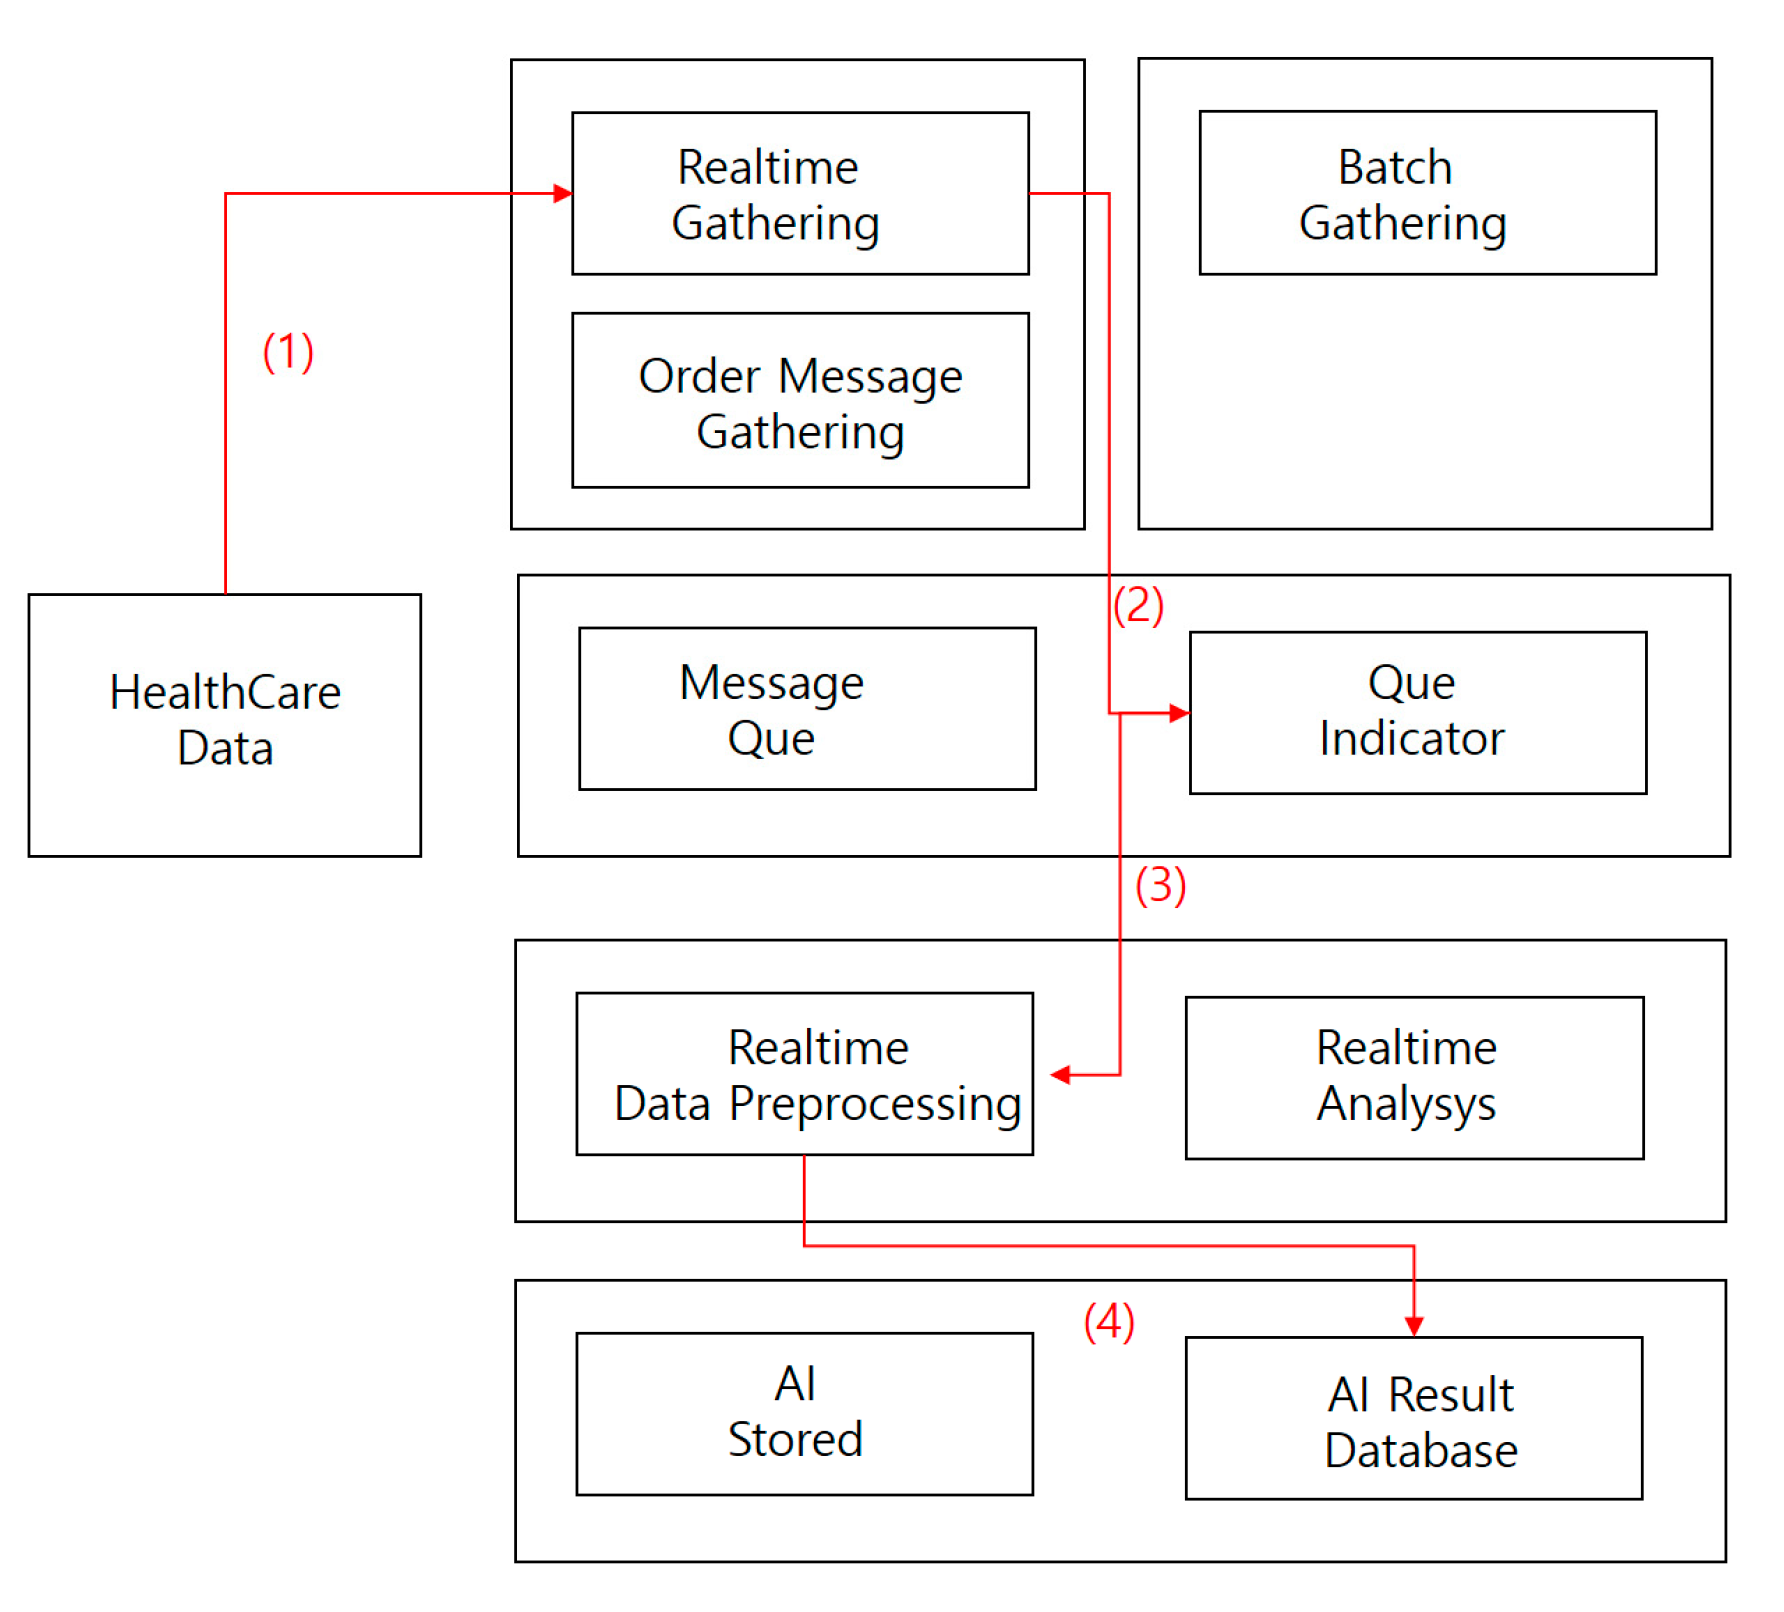
4.2.2. Image Staticity Performance Test
Image Staticity Performance Test Process
- (1)
- Collect medical imaging data in real time.
- (2)
- Store medical image data collected in real-time processing directly in a message queue.
- (3)
- Store collected data in a real-time preprocessor.
- (4)
- Save AI results database data.
Image Staticity Performance Test Condition
- -
- 1000 medical images (approximately 120,000 cases) were randomly extracted and 4 images (two target images and four comparative images) were compared.
- -
- 40% of the extracted images were labeled as negative images of two comparative images that were not similar to the target image and other comparative images were discarded as positive images by transforming some of the target images.
- -
- 50% of the extracted images were labeled as negative images, while other comparative images were discarded and partially modified to label positive images.
- -
- 20% of the extracted images had positive images of the two comparative images that were similar to the target image the rest were labeled as negative images.
- -
- If the target and comparison images could not be determined to be similar, four random images were extracted from the medical image (repeated until deemed similar).
- -
- 40% of the extracted images were positive images of two medical images compared to the target image, and the remaining images were labeled as negative images.
- -
- If it was not possible to judge that the target image was similar to the target image, the data set was constructed with the current target image.
- -
- Using the above method, 2000 data sets consisting of query images, positive images and negative images were generated by odd numbers of video data to complete the final verification data by combining the results in a majority vote.
Image Staticity Performance Test Simulation
Image Staticity Performance Test Result
5. Discussion
6. Conclusions
Author Contributions
Funding
Conflicts of Interest
Abbreviations
| EMR | Electronic Medical Record |
| PACS | Picture Archiving Communications System |
| OCS | Order Communication System |
| EHR | Electronic Health Record |
| MRI | Magnetic Resonance Imaging |
| ACU | Artificial control unit |
| AI | Artificial intelligence |
| ANN | Artificial neural network |
| CNN | Convolved convolutional neural network |
| DNN | deep neural network |
| DRN | Dural neural network |
| DRNN | deeply reliant neural network |
| EHR | Electric health record |
| FDA | Food and drug administration |
| IPFS | Interplanetary file system |
| ML | Machine learning |
| MRI | Magnetic resonance imaging |
| OCS | Order communication system) |
| OODBMS | Object database is a database management system |
| PACS | Picture archiving and communication system |
| R-CNN | Region-based convolved convolutional neural network |
| RNN | Rotating neural network |
References
- Doan, A.H.; Pedro, D.; Alon, Y.H. Reconciling schemas of disparate data sources: A machine-learning approach. In Proceedings of the 2001 ACM SIGMOD International Conference on Management of Data; ACM: New York, NY, USA, 2001. [Google Scholar]
- Kim, B.G.; Park, D.J. Novel target segmentation and tracking based on fuzzy membership distribution for vision-based target tracking system. Image Vis. Comput. 2006, 24, 1319–1331. [Google Scholar] [CrossRef]
- Silver, D.; Huang, A.; Maddison, C.J.; Guez, A.; Sifre, L.; Van Den Driessche, G.; Dieleman, S. Mastering the game of Go with deep neural networks and tree search. Nature 2016, 529, 484. [Google Scholar] [CrossRef]
- Chen, M.; Shiwen, M.; Yunhao, L. Big data: A survey. In Mobile Networks and Applications; Springer: Oxford, UK, 2014; Volume 19, pp. 171–209. [Google Scholar]
- Huh, J.H.; Seo, Y.S. Understanding Edge Computing: Engineering Evolution with Artificial Intelligence. IEEE Access 2019, 7, 164229–164245. [Google Scholar] [CrossRef]
- Jordan, M.I.; Mitchell, T.M. Machine learning: Trends, perspectives, and prospects. Science 2015, 349, 255–260. [Google Scholar] [CrossRef]
- Wang, M.; Lu, H.; Liu, S.; Zhu, Z. How to Mislead AI-assisted Network Automation in SD-IPoEONs: A Comparison Study of DRL- and GAN-based Approaches. J. Light. Technol. 2020. [Google Scholar] [CrossRef]
- DeepMind. Capture the Flag: The Emergence of Complex Cooperative Agents. Available online: https://deepmind.com/blog/capture-the-flag/ (accessed on 27 March 2020).
- Mnih, V.; Kavukcuoglu, K.; Silver, D.; Rusu, A.A.; Veness, J.; Bellemare, M.G.; Petersen, S. Human-level control through deep reinforcement learning. Nature 2015, 518, 529–533. [Google Scholar] [CrossRef]
- Silver, D.; Schrittwieser, J.; Simonyan, K.; Antonoglou, I.; Huang, A.; Guez, A.; Chen, Y. Mastering the game of go without human knowledge. Nature 2017, 550, 354–359. [Google Scholar] [CrossRef]
- DeepMind. AlphaGo Zero: Learning from the Scratch. Available online: https://deepmind.com/blog/alphago-zero-learning-scratch/ (accessed on 27 March 2020).
- Bengio, Y.; Courville, A.; Vincent, P. Representation learning: A review and new perspectives. IEEE Trans. Pattern Anal. Mach. Intell. 2013, 35, 1798–1828. [Google Scholar] [CrossRef]
- Wachsmuth, I.; Lenzen, M.; Knoblich, G. Embodied Communication in Humans and Machines; Oxford University Press: Oxford, UK, 2008. [Google Scholar]
- Picard Rosalind, W. Computer Learning of Subjectivity; ACM Computing Surveys; ACM: MIT, Cambridge, MA, USA, 1995; Volume 27, pp. 621–623. [Google Scholar]
- Darwin, C. The Expression of Emotions in Animals and Man; Murray: London, UK, 1872; p. 11. [Google Scholar]
- Eckman, J.; Meltzer, J.D.; Latane, B. Gregariousness in rats as a function of familiarity of environment. J. Personal. Soc. Psychol. 1969, 11, 107. [Google Scholar] [CrossRef]
- Sodhro, A.H.; Pirbhulal, S.; de Albuquerque, V.H.C. Artificial Intelligence-Driven Mechanism for Edge Computing-Based Industrial Applications. IEEE Trans. Ind. Inform. 2019, 15, 4235–4243. [Google Scholar] [CrossRef]
- Wang, Z.; Peterson, J.L.; Rea, C.; Humphreys, D. Special Issue on Machine Learning, Data Science, and Artificial Intelligence in Plasma Research. IEEE Trans. Plasma Sci. 2020, 48, 1–2. [Google Scholar] [CrossRef]
- Wang, Y.; Kwong, S.; Leung, H.; Lu, J.; Smith, M.H.; Trajkovic, L.; Tunstel, E.; Plataniotis, K.N.; Yen, G.G.; Kinsner, W. Brain-Inspired Systems: A Transdisciplinary Exploration on Cognitive Cybernetics, Humanity, and Systems Science Toward Autonomous Artificial Intelligence. IEEE Syst. ManCybern. Mag. 2020, 6, 6–13. [Google Scholar] [CrossRef]
- Watkins, T. Cosmology of Artificial Intelligence Project: Libraries, Makerspaces, Community and AI Literacy. AI Matters 2020, 4, 134–140. [Google Scholar] [CrossRef]
- Seo, Y.S.; Huh, J.H. Automatic emotion-based music classification for supporting intelligent IoT applications. Electronics 2019, 8, 164. [Google Scholar] [CrossRef]
- McCarthy, J.; Hayes, P.J. Some Philosophical Problems from the Standpoint of Artificial Intelligence; Elsevier: Amsterdam, The Netherlands, 1981; pp. 431–450. [Google Scholar]
- Watson, D.; Tellegen, A. Toward a consensual structure of mood. Psychol. Bull. 1985, 98, 219–235. [Google Scholar] [CrossRef]
- Tellegen, A.; Watson, D.; Clark, L.A. On the dimensional and hierarchical structure of affect. Psychol. Sci. 1999, 10, 297–303. [Google Scholar] [CrossRef]
- Patra, B.G.; Maitra, P.; Das, D.; Bandyopadhyay, S. Mediaeval 2015: Music emotion recognition based on feed-forward neural network. In Proceedings of the MediaEval 2015 Workshop, Wurzen, Germany, 14–15 September 2015; Volume 29. [Google Scholar]
- Tan, K.C.; Lee, L.H.; Ou, K. Artificial Intelligence Heuristics in Solving Vehicle Routing Problems with Time Window Constraints; Elsevier: London, UK, 2001; pp. 825–837. [Google Scholar]
- Chen, S.H.; Lee, Y.S.; Hsieh, W.C.; Wang, J.C. Music Emotion Recognition Using Deep Gaussian Process. In Proceedings of the 2015 Asia-Pacific Signal and Information Processing Association Annual Summit and Conference, Hong Kong, China, 16–19 December 2015; pp. 495–498. [Google Scholar]
- Bargaje, M. Emotion recognition and emotion based classification of audio using genetic algorithm an optimized approach. In Proceedings of the 2015 International Conference on Industrial Instrumentation and Control, Pune, India, 28–30 May 2015; pp. 562–567. [Google Scholar]
- Malik, M.; Adavanne, S.; Drossos, K.; Virtanen, T.; Ticha, D.; Jarina, R. Stacked convolutional and recurrent neural networks for music emotion recognition. In Proceedings of the 14th Sound and Music Computing Conference, Espoo, Finland, 5–8 July 2017; pp. 208–213. [Google Scholar]
- Dewi, K.C.; Harjoko, A. Kid’s Song Classification Based on Mood Parameters Using K-Nearest Neighbor Classification Method and Self Organizing Map. In Proceedings of the 2010 International Conference on Distributed Frameworks for Multimedia Applications, Yogyakarta, Indonesia, 2–3 August 2010; Volume 34, pp. 1–5. [Google Scholar]
- Morimura, T.; Sugiyama, M.; Kashima, H.; Hachiya, H.; Tanaka, T. Parametric return density estimation for reinforcement learning. In Proceedings of the 26th Conference on Uncertainty in Artificial Intelligence, Catalina Island, CA, USA, 8–11 July 2010. [Google Scholar]
- Bellemare, M.G.; Dabney, W.; Munos, R. A distributional perspective on reinforcement learning. In International Conference on Machine Learning; Precup, D., The, Y.W., Eds.; PMLR: Sydney, Australia, 2017; pp. 449–458. [Google Scholar]
- Sutton, R.S.; Barto, A.G. Reinforcement Learning: An Introduction; MIT Press: Cambridge, MA, USA, 1998; Volume 1. [Google Scholar]
- Glimcher, P.W. Understanding dopamine and reinforcement learning: The dopamine reward prediction error hypothesis. Proc. Natl. Acad. Sci. USA 2011, 108, 15647–15654. [Google Scholar] [CrossRef]
- Watabe-Uchida, M.; Eshel, N.; Uchida, N. Neural circuitry of reward prediction error. Annu. Rev. Neurosci. 2017, 40, 373–394. [Google Scholar] [CrossRef]
- Dabney, W.; Kurth-Nelson, Z.; Uchida, N.; Starkweather, C.K.; Hassabis, D.; Munos, R.; Botvinick, M. A distributional code for value in dopamine-based reinforcement learning. Nature 2020, 577, 671–675. [Google Scholar] [CrossRef]
- Hayes, P.J. The Frame Problem and Related Problems in Artificial Intelligence; Elsevier: London, UK, 1981; pp. 223–230. [Google Scholar]
- Bahrammirzaee, A. A Comparative Survey of Artificial Intelligence Applications in Finance: Artificial Neural Networks, Expert System and Hybrid Intelligent Systems; Springer: New York, NY, USA, 2010; pp. 1165–1195. [Google Scholar]
- Zang, Y.; Zhang, F.; Di, C.; Zhu, D. Advances of Flexible Pressure Sensors Toward Artificial Intelligence and Health Care Applications; Royal Society of Chemistry: London, UK, 2015; pp. 140–156. [Google Scholar]
- Jha, S.; Topol, E.J. Adapting to artificial intelligence: Radiologists and pathologists as information specialists. Innov. Health Care Deliv. 2016, 316, 2353–2354. [Google Scholar] [CrossRef]
- Han, B.J.; Rho, S.; Dannenberg, R.B.; Hwang, E. SMERS: Music Emotion Recognition Using Support Vector Regression. In Proceedings of the ISMIR, Kobe, Japan, 26–30 October 2009; pp. 651–656. [Google Scholar]
- Vivar, A.L.; Castedo, A.T.; Orozco, A.L.S.; Villalba, L.J.G. An Analysis of Smart Contracts Security Threats Alongside Existing Solutions. Entropy 2020, 22, 23–34. [Google Scholar]
- Salunkhe, S.; Bhosale, S. Image Steganography with DCT and Image Steganalysis using CNN technique. In National Conference on Mathematics and It’s Applications in Technology; Veermata Jijabai Technological Institute: Mumbai, India, 2020; pp. 1–9. [Google Scholar]


| Items | Hardware | Software | Service |
|---|---|---|---|
| Purpose | Hardware systems such as robots during artificial intelligence research | Software technology key to the study of artificial intelligence | Personalized models found |
| Related research | Wearable devices, parts, devices, reagents, etc. | Providing medical health care content, communication network platform, medical information, exercise information, etc. | Genes, medical diagnosis services, genetic information |
| Speed Measurements | High | Middle | Slow |
| Robot systems for healthy strengthening | Personalized, integrated medical device services | Hardware and software mixed service required | |
| Middleware | None | Middleware required | Needed |
| Technical technology | Blood sugar, blood pressure, ECG, activity measurement, chemical analysis, body fat analysis, medical sensors, field testing devices, band-necked implants | WebnisApp, nutrition management app, personal health care app | Personal health examination services, personal health records management systems and health care services for the elderly |
| Sortation | Standard | Quantity | Relative Height |
|---|---|---|---|
| Development server | Xeon E5-2620 v4 2.1Ghz 32 vCPU (8 core 16 thread 4 CPU) 512 GB RAM SAS HDD 0.8 TB * 2, SAS HDD 1.2 T * 6, ATA SSD 0.8 TB * 6 | 4 | Windows Server NT |
| Middleware server | CORBA 3.0 | 1 | Linux Server (Redhat) |
| Operating server | Xeon E5-2620 v4 2.1Ghz 32 vCPU (8 core 16 thread 4 CPU) 512 GB RAM SAS HDD 0.8 TB * 2, SAS HDD 1.2 T * 6, ATA SSD 0.8 TB * 6 | 4 | Windows Server NT |
| GPGPU system | Multiple Quadro GPUs | 4 | Windows Server NT |
| Test Model | Modify Contents | Accuracy | F-Score |
|---|---|---|---|
| CovNet (Semantic)+ | transfer learning | 93.51% | 0.93472 |
| CovNet (Semantic) | transfer learning | 91.65% | 0.91234 |
| DenseNet201 | transfer learning | 87.45% | 0.89232 |
© 2020 by the authors. Licensee MDPI, Basel, Switzerland. This article is an open access article distributed under the terms and conditions of the Creative Commons Attribution (CC BY) license (http://creativecommons.org/licenses/by/4.0/).
Share and Cite
Kim, S.-K.; Huh, J.-H. Consistency of Medical Data Using Intelligent Neuron Faster R-CNN Algorithm for Smart Health Care Application. Healthcare 2020, 8, 185. https://doi.org/10.3390/healthcare8020185
Kim S-K, Huh J-H. Consistency of Medical Data Using Intelligent Neuron Faster R-CNN Algorithm for Smart Health Care Application. Healthcare. 2020; 8(2):185. https://doi.org/10.3390/healthcare8020185
Chicago/Turabian StyleKim, Seong-Kyu, and Jun-Ho Huh. 2020. "Consistency of Medical Data Using Intelligent Neuron Faster R-CNN Algorithm for Smart Health Care Application" Healthcare 8, no. 2: 185. https://doi.org/10.3390/healthcare8020185
APA StyleKim, S.-K., & Huh, J.-H. (2020). Consistency of Medical Data Using Intelligent Neuron Faster R-CNN Algorithm for Smart Health Care Application. Healthcare, 8(2), 185. https://doi.org/10.3390/healthcare8020185