Impact of Self-Reported Sitting Time and Transtheoretical Model Based on Exercise Behavior Change on Glycemic and Weight Control in Japanese Adults with Type 1 Diabetes: A Cross-Sectional Study


Abstract
:1. Introduction
2. Materials and Methods
2.1. Study Design
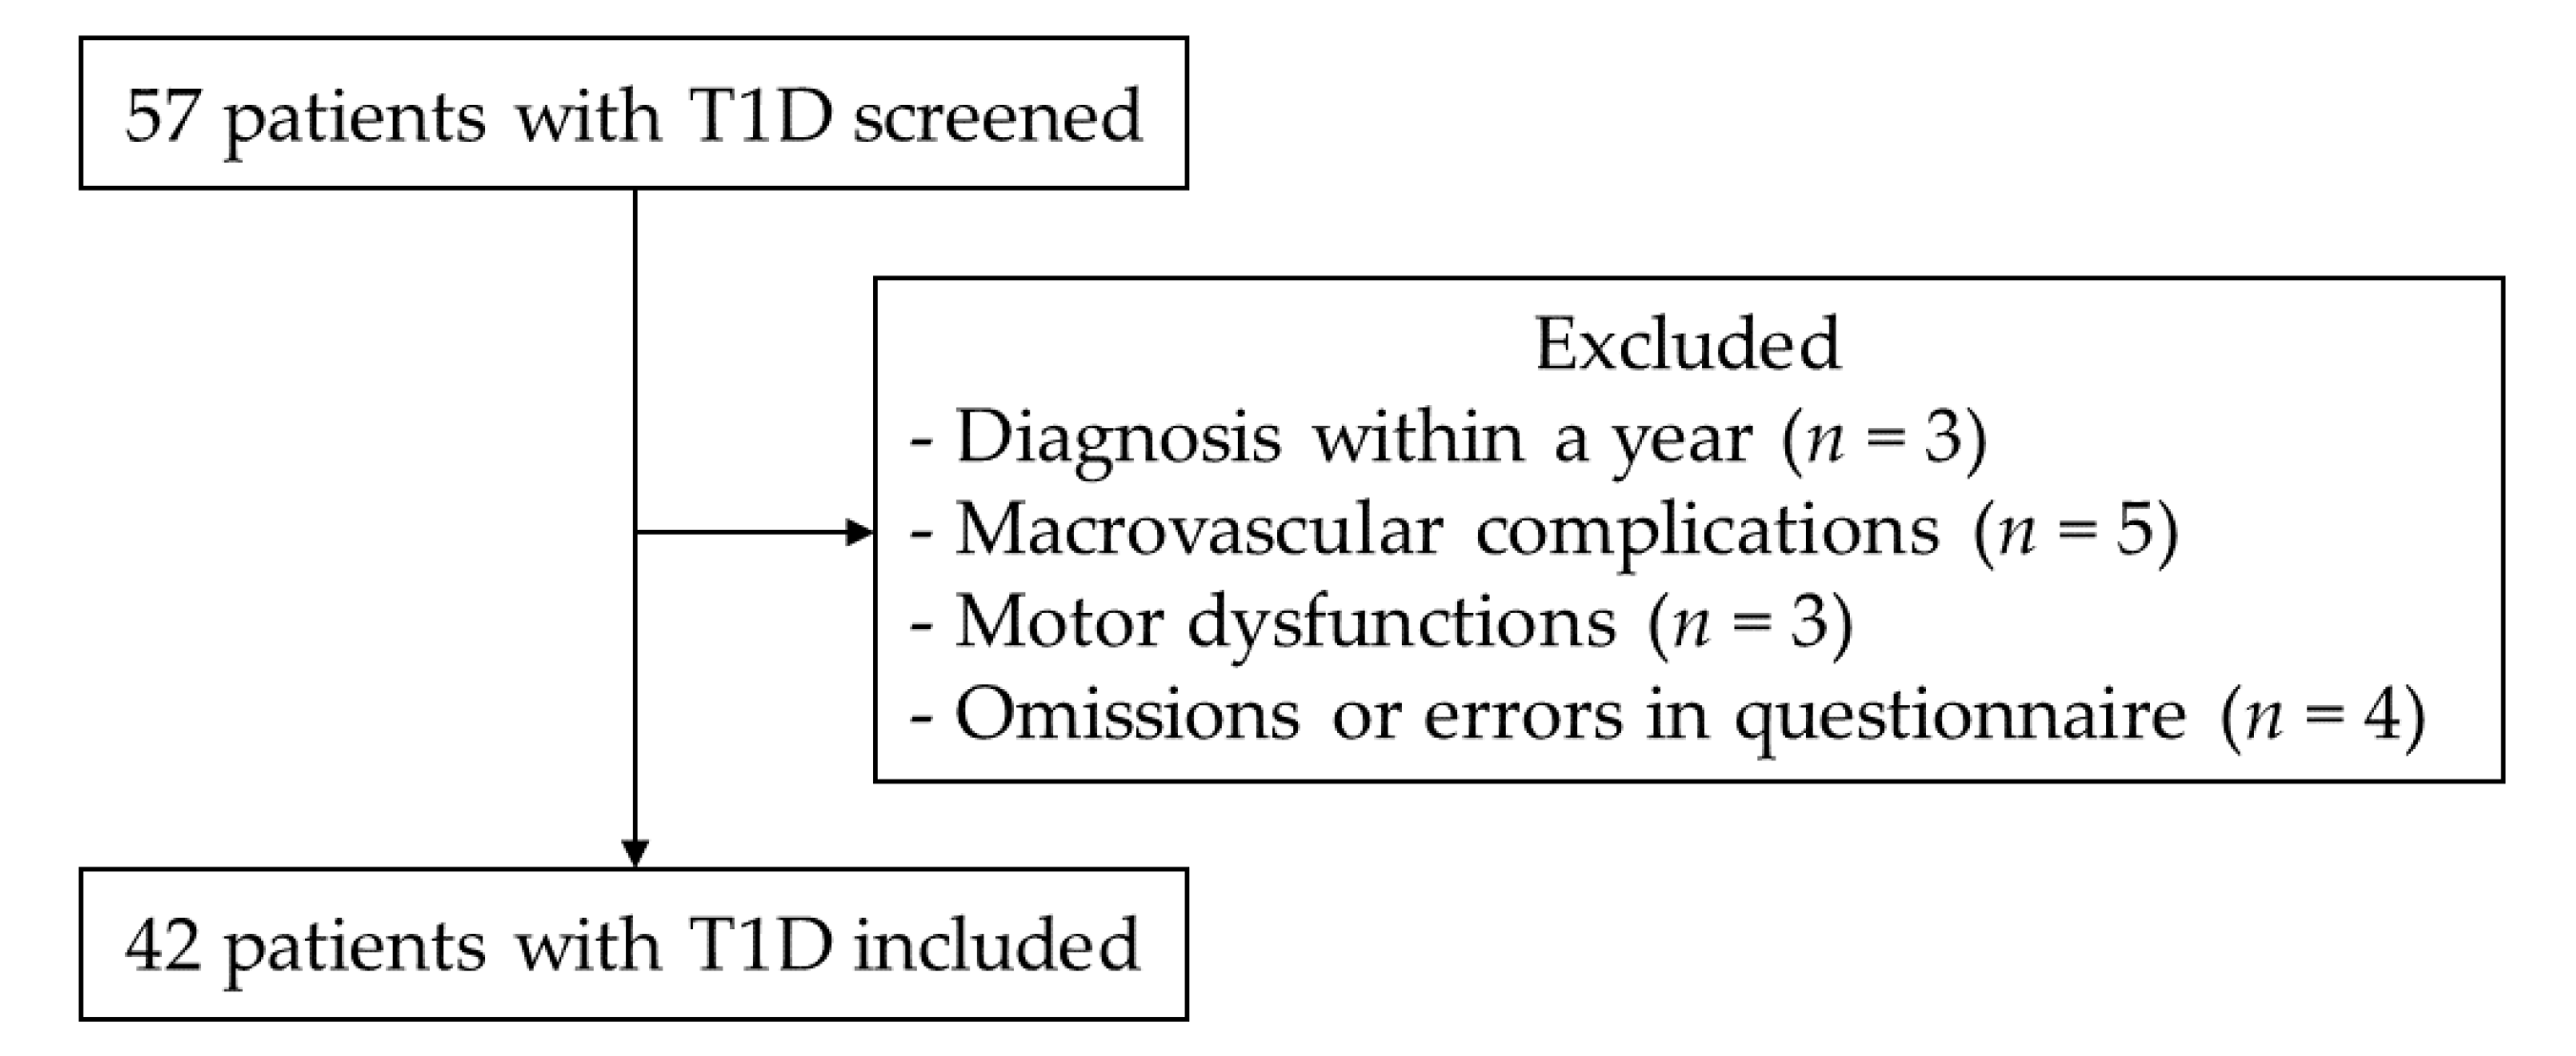
2.2. Participants
2.3. Measurements
2.4. Statistical Analysis
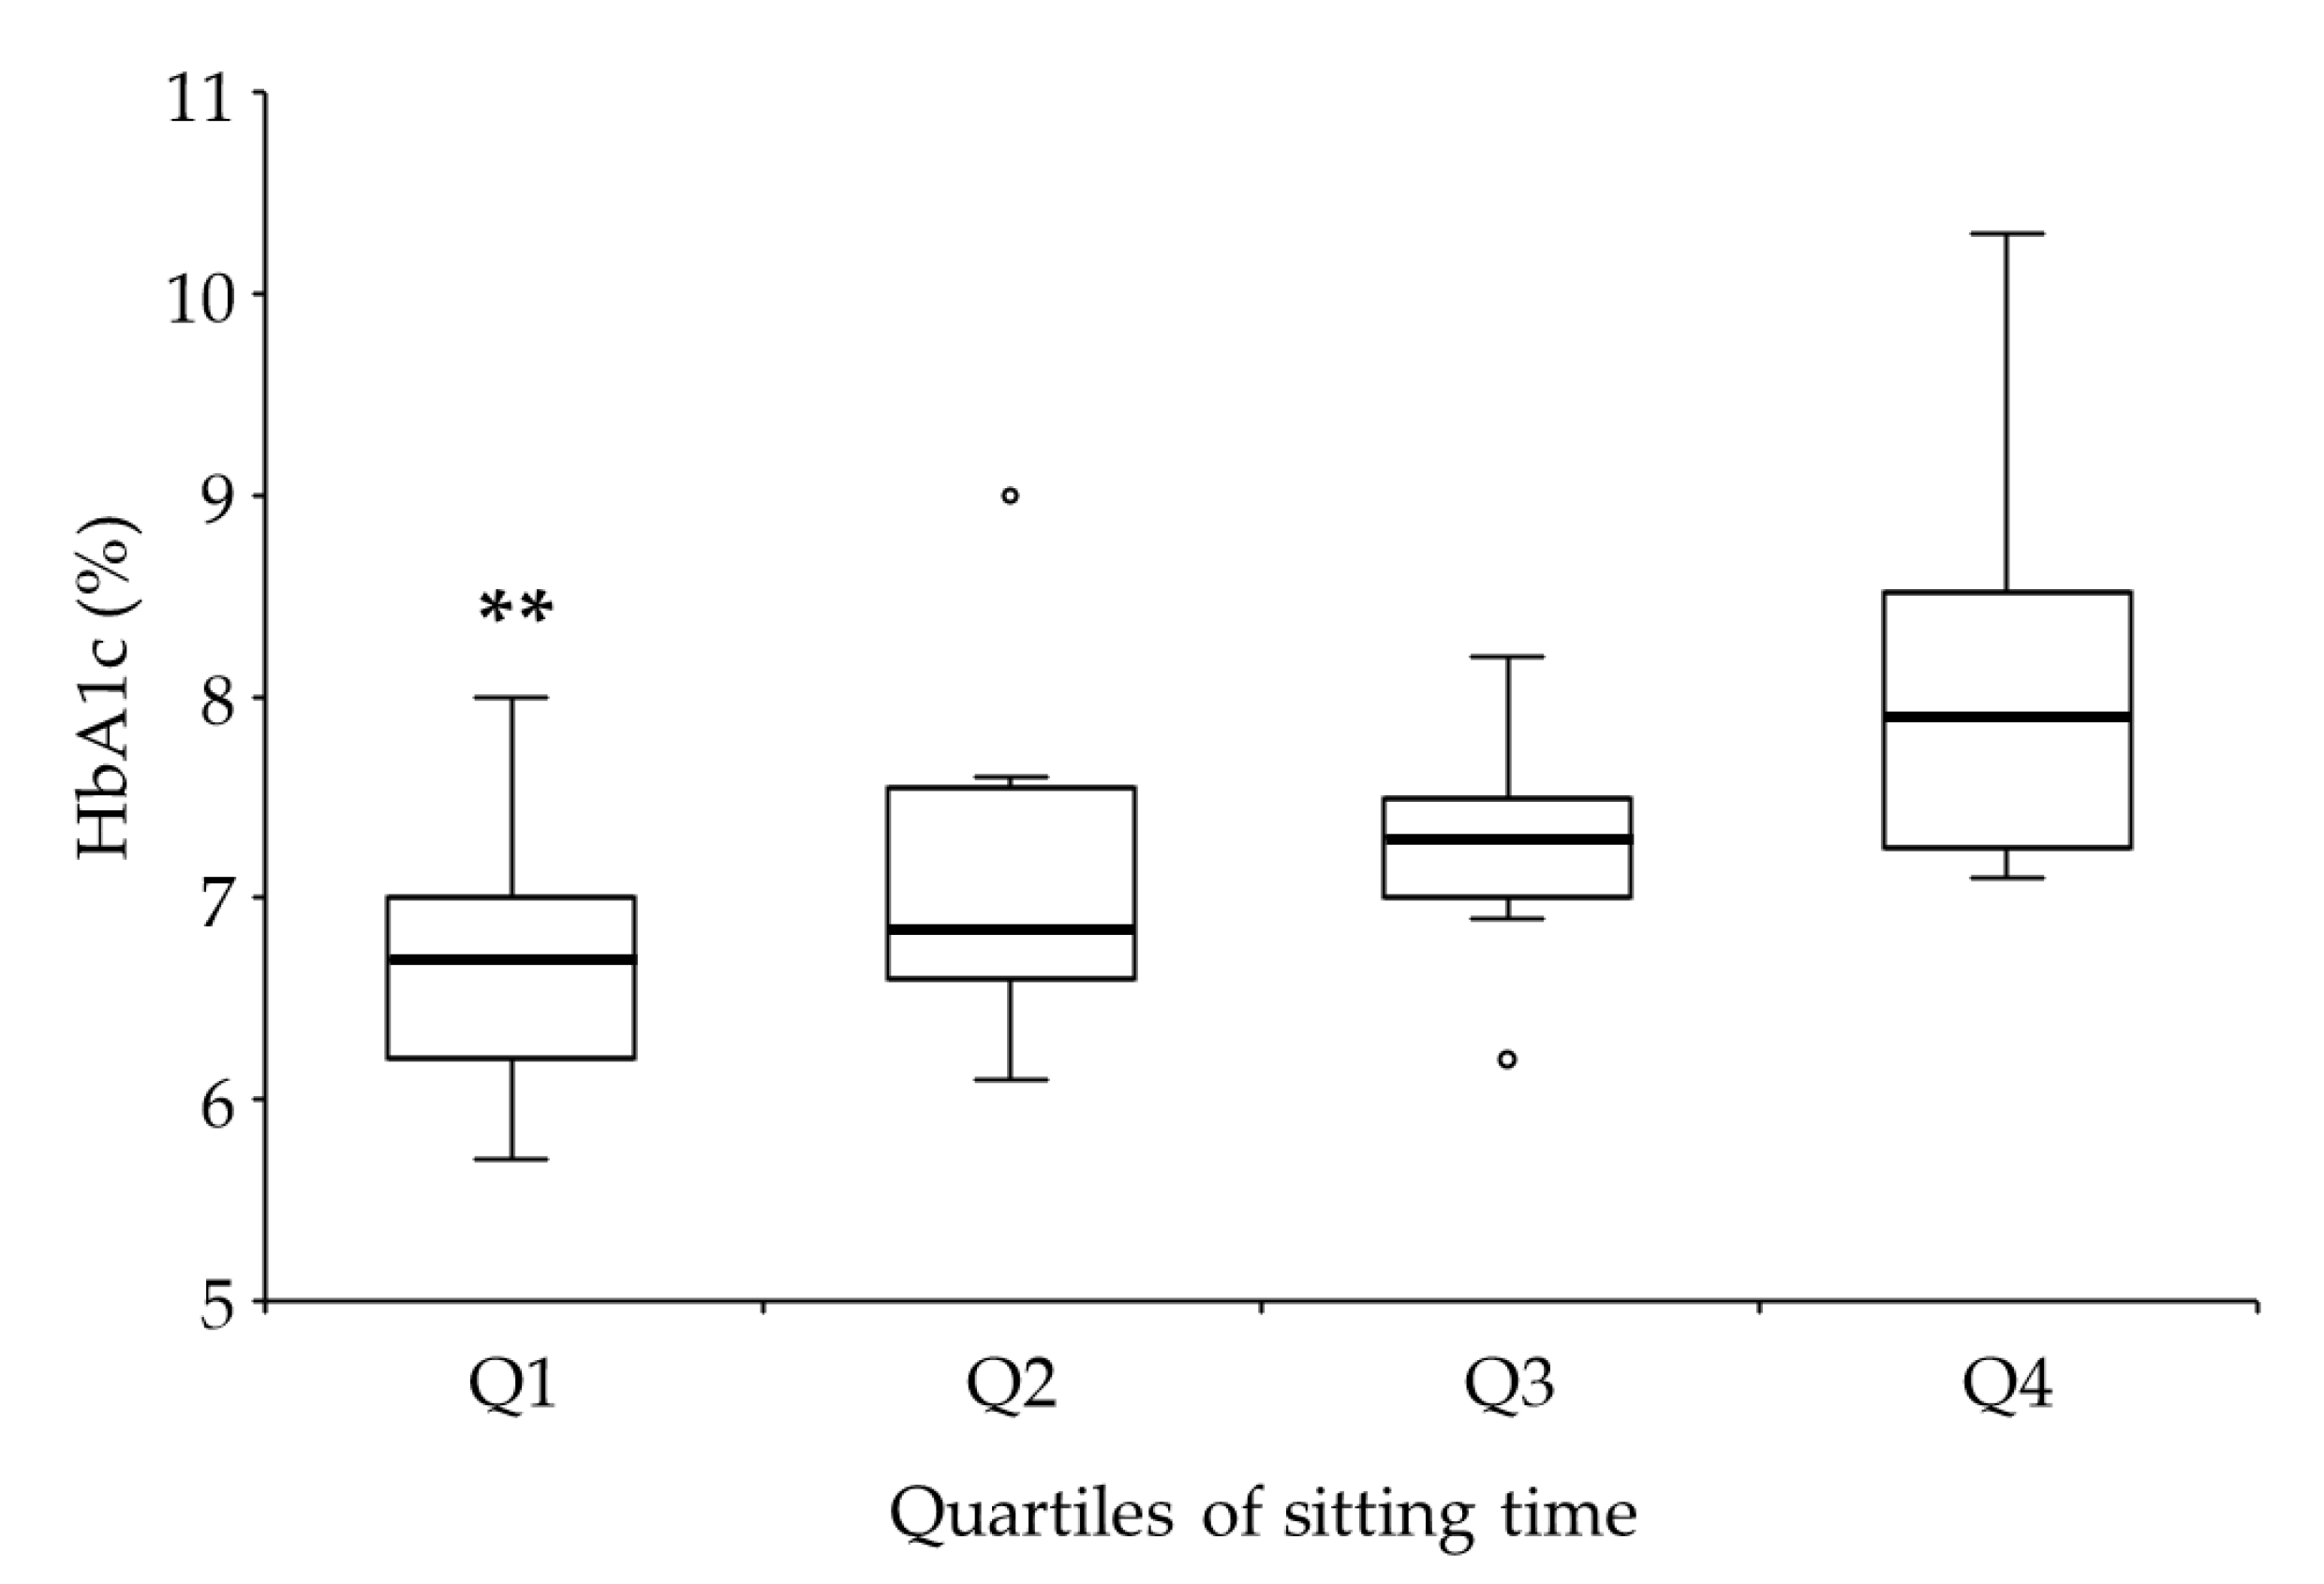
3. Results
4. Discussion
5. Conclusions
Author Contributions
Funding
Acknowledgments
Conflicts of Interest
References
- Craig, C.L.; Marshall, A.L.; Sjostrom, M.; Bauman, A.E.; Booth, M.L.; Ainsworth, B.E.; Pratt, M.; Ekelund, U.; Yngve, A.; Sallis, J.F.; et al. International physical activity questionnaire: 12-country reliability and validity. Med. Sci. Sports Exerc. 2003, 35, 1381–1395. [Google Scholar] [CrossRef] [PubMed] [Green Version]
- Booth, F.W.; Roberts, C.K.; Laye, M.J. Lack of exercise is a major cause of chronic diseases. Compr. Physiol. 2012, 2, 1143–1211. [Google Scholar] [CrossRef] [Green Version]
- Barone Gibbs, B.; Pettee Gabriel, K.; Reis, J.P.; Jakicic, J.M.; Carnethon, M.R.; Sternfeld, B. Cross-sectional and longitudinal associations between objectively measured sedentary time and metabolic disease: The Coronary Artery Risk Development in Young Adults (CARDIA) study. Diabetes Care 2015, 38, 1835–1843. [Google Scholar] [CrossRef] [Green Version]
- Van der Ploeg, H.P.; Chey, T.; Korda, R.J.; Banks, E.; Bauman, A. Sitting time and all-cause mortality risk in 222 497 Australian adults. Arch. Intern. Med. 2012, 172, 494–500. [Google Scholar] [CrossRef] [Green Version]
- Mikus, C.R.; Oberlin, D.J.; Libla, J.L.; Taylor, A.M.; Booth, F.W.; Thyfault, J.P. Lowering physical activity impairs glycemic control in healthy volunteers. Med. Sci. Sports Exerc. 2012, 44, 225–231. [Google Scholar] [CrossRef] [PubMed] [Green Version]
- Hu, F.B.; Leitzmann, M.F.; Stampfer, M.J.; Colditz, G.A.; Willett, W.C.; Rimm, E.B. Physical activity and television watching in relation to risk for type 2 diabetes mellitus in men. Arch. Intern. Med. 2001, 161, 1542–1548. [Google Scholar] [CrossRef] [PubMed]
- Sardinha, L.B.; Magalhaes, J.P.; Santos, D.A.; Judice, P.B. Sedentary Patterns, Physical Activity, and Cardiorespiratory Fitness in Association to Glycemic Control in Type 2 Diabetes Patients. Front. Physiol. 2017, 8, 262. [Google Scholar] [CrossRef] [PubMed] [Green Version]
- Bohn, B.; Herbst, A.; Pfeifer, M.; Krakow, D.; Zimny, S.; Kopp, F.; Melmer, A.; Steinacker, J.M.; Holl, R.W. Impact of Physical Activity on Glycemic Control and Prevalence of Cardiovascular Risk Factors in Adults With Type 1 Diabetes: A Cross-sectional Multicenter Study of 18,028 Patients. Diabetes Care 2015, 38, 1536–1543. [Google Scholar] [CrossRef] [Green Version]
- MacMillan, F.; Kirk, A.; Mutrie, N.; Matthews, L.; Robertson, K.; Saunders, D.H. A systematic review of physical activity and sedentary behavior intervention studies in youth with type 1 diabetes: Study characteristics, intervention design, and efficacy. Pediatr. Diabetes 2014, 15, 175–189. [Google Scholar] [CrossRef]
- Miculis, C.P.; De Campos, W.; da Silva Boguszweski, M.C. Correlation between glycemic control and physical activity level in adolescents and children with type 1 diabetes. J. Phys. Act. Health 2015, 12, 232–237. [Google Scholar] [CrossRef]
- Galler, A.; Lindau, M.; Ernert, A.; Thalemann, R.; Raile, K. Associations between media consumption habits, physical activity, socioeconomic status, and glycemic control in children, adolescents, and young adults with type 1 diabetes. Diabetes Care 2011, 34, 2356–2359. [Google Scholar] [CrossRef] [Green Version]
- Ligtenberg, P.C.; Blans, M.; Hoekstra, J.B.; van der Tweel, I.; Erkelens, D.W. No effect of long-term physical activity on the glycemic control in type 1 diabetes patients: A cross-sectional study. Neth. J. Med. 1999, 55, 59–63. [Google Scholar] [CrossRef]
- American Diabetes Association. 5. Facilitating Behavior Change and Well-being to Improve Health Outcomes: Standards of Medical Care in Diabetes-2020. Diabetes Care 2020, 43, S48–S65. [Google Scholar] [CrossRef] [PubMed] [Green Version]
- Morimoto, A.; Nishimura, R.; Tajima, N. Trends in the Epidemiology of Patients with Diabetes in Japan. JMAJ 2010, 53, 36–40. [Google Scholar]
- Shojaeian, A.; Mehri-Ghahfarrokhi, A. An overview of the Epidemiology of Type 1 Diabetes Mellitus. Int. J. Metab. Syndr. 2018, 2, 1–4. [Google Scholar]
- Snouffer, E. An inexplicable upsurge: The rise in type 1 diabetes. Diabetes Res. Clin. Pract. 2018, 137, 242–244. [Google Scholar] [CrossRef]
- Bandura, A.; Adams, N.E. Analysis of Self-Efficacy Theory of Behavioral Change. Cognit. Ther. Res. 1977, 1, 287–310. [Google Scholar] [CrossRef]
- Selcuk-Tosun, A.; Zincir, H. The effect of a transtheoretical model-based motivational interview on self-efficacy, metabolic control, and health behaviour in adults with type 2 diabetes mellitus: A randomized controlled trial. Int. J. Nurs. Pract. 2019, 25, e12742. [Google Scholar] [CrossRef]
- Wakui, S.; Shimomitsu, T.; Odagiri, Y.; Inoue, S.; Takamiya, T.; Ohya, Y. Relation of the stages of change for exercise behaviors, self-efficacy, decisional-balance, and diet-related psycho-behavioral factors in young Japanese women. J. Sports Med. Phys. Fit. 2002, 42, 224–232. [Google Scholar]
- Selcuk-Tosun, A.; Zincir, H. The Effect on Health Outcomes of Post-Intervention Transtheoretical Model-Based Motivational Interview in Adults with Type 2 Diabetes Mellitus: Follow up a Cross-Sectional Study. J. Caring Sci. 2019, 8, 1–8. [Google Scholar] [CrossRef]
- Tseng, H.M.; Liao, S.F.; Wen, Y.P.; Chuang, Y.J. Stages of change concept of the transtheoretical model for healthy eating links health literacy and diabetes knowledge to glycemic control in people with type 2 diabetes. Prim. Care Diabetes 2017, 11, 29–36. [Google Scholar] [CrossRef] [PubMed]
- Van Poppel, M.N.; Chinapaw, M.J.; Mokkink, L.B.; van Mechelen, W.; Terwee, C.B. Physical activity questionnaires for adults: A systematic review of measurement properties. Sports Med. 2010, 40, 565–600. [Google Scholar] [CrossRef]
- Murano, I.; Asakawa, Y.; Mizukami, M.; Takihara, J. Examination of the Validity of the Japanese Version of the IPA Questionnaire for the Evaluation of the Physical Activity of Diabetes Patients (in Japanese). Rigakuryoho Kagaku 2013, 28, 101–104. [Google Scholar] [CrossRef] [Green Version]
- Prochaska, J.O.; DiClemente, C.C. Stages and processes of self-change of smoking: Toward an integrative model of change. J. Consult. Clin. Psychol. 1983, 51, 390–395. [Google Scholar] [CrossRef] [PubMed]
- Oka, K. Reliability and validity of the stages of change for exercise behavior scale among middle-aged adults. Jpn. J. Health Promot. 2003, 5, 15–22. [Google Scholar]
- Oka, K.; Takenaka, K.; Miyazaki, Y. Assessing the stages of change for exercise behavior among young adults: The relationship with self-reported physical activity and exercise behavior. Jpn. Health Psychol. 2000, 8, 17–23. [Google Scholar]
- Araki, E.; Haneda, M.; Kasuga, M.; Nishikawa, T.; Kondo, T.; Ueki, K.; Kadowaki, T. New glycemic targets for patients with diabetes from the Japan Diabetes Society. J. Diabetes Investig. 2017, 8, 123–125. [Google Scholar] [CrossRef] [Green Version]
- Li, J.; Chattopadhyay, K.; Xu, M.; Chen, Y.; Hu, F.; Chu, J.; Li, L. Glycaemic control in type 2 diabetes patients and its predictors: A retrospective database study at a tertiary care diabetes centre in Ningbo, China. BMJ Open 2018, 8, e019697. [Google Scholar] [CrossRef]
- Dempsey, P.C.; Larsen, R.N.; Sethi, P.; Sacre, J.W.; Straznicky, N.E.; Cohen, N.D.; Cerin, E.; Lambert, G.W.; Owen, N.; Kingwell, B.A.; et al. Benefits for Type 2 Diabetes of Interrupting Prolonged Sitting With Brief Bouts of Light Walking or Simple Resistance Activities. Diabetes Care 2016, 39, 964–972. [Google Scholar] [CrossRef] [Green Version]
- Dunstan, D.W.; Kingwell, B.A.; Larsen, R.; Healy, G.N.; Cerin, E.; Hamilton, M.T.; Shaw, J.E.; Bertovic, D.A.; Zimmet, P.Z.; Salmon, J.; et al. Breaking up prolonged sitting reduces postprandial glucose and insulin responses. Diabetes Care 2012, 35, 976–983. [Google Scholar] [CrossRef] [PubMed] [Green Version]
- Peddie, M.C.; Bone, J.L.; Rehrer, N.J.; Skeaff, C.M.; Gray, A.R.; Perry, T.L. Breaking prolonged sitting reduces postprandial glycemia in healthy, normal-weight adults: A randomized crossover trial. Am. J. Clin. Nutr. 2013, 98, 358–366. [Google Scholar] [CrossRef] [Green Version]
- Hamilton, M.T.; Hamilton, D.G.; Zderic, T.W. Role of low energy expenditure and sitting in obesity, metabolic syndrome, type 2 diabetes, and cardiovascular disease. Diabetes 2007, 56, 2655–2667. [Google Scholar] [CrossRef] [PubMed] [Green Version]
- Basu, R.; Johnson, M.L.; Kudva, Y.C.; Basu, A. Exercise, hypoglycemia, and type 1 diabetes. Diabetes Technol. Ther. 2014, 16, 331–337. [Google Scholar] [CrossRef] [PubMed]
- Colberg, S.R.; Sigal, R.J.; Yardley, J.E.; Riddell, M.C.; Dunstan, D.W.; Dempsey, P.C.; Horton, E.S.; Castorino, K.; Tate, D.F. Physical Activity/Exercise and Diabetes: A Position Statement of the American Diabetes Association. Diabetes Care 2016, 39, 2065–2079. [Google Scholar] [CrossRef] [PubMed] [Green Version]
- Chimen, M.; Kennedy, A.; Nirantharakumar, K.; Pang, T.T.; Andrews, R.; Narendran, P. What are the health benefits of physical activity in type 1 diabetes mellitus? A literature review. Diabetologia 2012, 55, 542–551. [Google Scholar] [CrossRef] [PubMed] [Green Version]
- Balducci, S.; Sacchetti, M.; Orlando, G.; Salvi, L.; Pugliese, L.; Salerno, G.; D’Errico, V.; Iacobini, C.; Conti, F.G.; Zanuso, S.; et al. Correlates of muscle strength in diabetes: The study on the assessment of determinants of muscle and bone strength abnormalities in diabetes (SAMBA). Nutr. Metab. Cardiovasc. Dis. 2014, 24, 18–26. [Google Scholar] [CrossRef]
- Bauman, A.; Ainsworth, B.E.; Sallis, J.F.; Hagstromer, M.; Craig, C.L.; Bull, F.C.; Pratt, M.; Venugopal, K.; Chau, J.; Sjostrom, M.; et al. The descriptive epidemiology of sitting. A 20-country comparison using the International Physical Activity Questionnaire (IPAQ). Am. J. Prev. Med. 2011, 41, 228–235. [Google Scholar] [CrossRef]
- Nakanishi, S.; Hirukawa, H.; Shimoda, M.; Tatsumi, F.; Kohara, K.; Obata, A.; Okauchi, S.; Katakura, Y.; Sanada, J.; Fushimi, Y.; et al. Impact of physical activity and sedentary time on glycated hemoglobin levels and body composition: Cross-sectional study using outpatient clinical data of Japanese patients with type 2 diabetes. J. Diabetes Investig. 2019. [Google Scholar] [CrossRef] [Green Version]
- American Diabetes Association. 6. Glycemic Targets: Standards of Medical Care in Diabetes-2020. Diabetes Care 2020, 43, S66–S76. [Google Scholar] [CrossRef]
- Cleland, C.; Ferguson, S.; Ellis, G.; Hunter, R.F. Validity of the International Physical Activity Questionnaire (IPAQ) for assessing moderate-to-vigorous physical activity and sedentary behaviour of older adults in the United Kingdom. BMC Med. Res. Methodol. 2018, 18, 176. [Google Scholar] [CrossRef] [PubMed] [Green Version]
- Brazeau, A.S.; Rabasa-Lhoret, R.; Strychar, I.; Mircescu, H. Barriers to physical activity among patients with type 1 diabetes. Diabetes Care 2008, 31, 2108–2109. [Google Scholar] [CrossRef] [Green Version]
- Lascar, N.; Kennedy, A.; Hancock, B.; Jenkins, D.; Andrews, R.C.; Greenfield, S.; Narendran, P. Attitudes and barriers to exercise in adults with type 1 diabetes (T1DM) and how best to address them: A qualitative study. PLoS ONE 2014, 9, e108019. [Google Scholar] [CrossRef] [PubMed] [Green Version]
- Yardley, J.; Mollard, R.; MacIntosh, A.; MacMillan, F.; Wicklow, B.; Berard, L.; Hurd, C.; Marks, S.; McGavock, J. Vigorous intensity exercise for glycemic control in patients with type 1 diabetes. Can. J. Diabetes 2013, 37, 427–432. [Google Scholar] [CrossRef]
- Yardley, J.E.; Kenny, G.P.; Perkins, B.A.; Riddell, M.C.; Balaa, N.; Malcolm, J.; Boulay, P.; Khandwala, F.; Sigal, R.J. Resistance versus aerobic exercise: Acute effects on glycemia in type 1 diabetes. Diabetes Care 2013, 36, 537–542. [Google Scholar] [CrossRef] [Green Version]
- Colberg, S.R.; Laan, R.; Dassau, E.; Kerr, D. Physical activity and type 1 diabetes: Time for a rewire? J. Diabetes Sci. Technol. 2015, 9, 609–618. [Google Scholar] [CrossRef] [PubMed] [Green Version]
- Spencer, L.; Adams, T.B.; Malone, S.; Roy, L.; Yost, E. Applying the transtheoretical model to exercise: A systematic and comprehensive review of the literature. Health Promot. Pract. 2006, 7, 428–443. [Google Scholar] [CrossRef] [PubMed]
- Tappy, L.; Binnert, C.; Schneiter, P. Energy expenditure, physical activity and body-weight control. Proc. Nutr. Soc. 2003, 62, 663–666. [Google Scholar] [CrossRef] [PubMed] [Green Version]
- Holmen, H.; Wahl, A.; Torbjornsen, A.; Jenum, A.K.; Smastuen, M.C.; Ribu, L. Stages of change for physical activity and dietary habits in persons with type 2 diabetes included in a mobile health intervention: The Norwegian study in RENEWING HEALTH. BMJ Open Diabetes Res. Care 2016, 4, e000193. [Google Scholar] [CrossRef] [Green Version]
- Chau, J.Y.; Grunseit, A.C.; Chey, T.; Stamatakis, E.; Brown, W.J.; Matthews, C.E.; Bauman, A.E.; van der Ploeg, H.P. Daily sitting time and all-cause mortality: A meta-analysis. PLoS ONE 2013, 8, e80000. [Google Scholar] [CrossRef] [Green Version]
- Ekelund, U.; Steene-Johannessen, J.; Brown, W.J.; Fagerland, M.W.; Owen, N.; Powell, K.E.; Bauman, A.; Lee, I.M.; Lancet Physical Activity Series 2 Executive Committe; Lancet Sedentary Behaviour Working Group. Does physical activity attenuate, or even eliminate, the detrimental association of sitting time with mortality? A harmonised meta-analysis of data from more than 1 million men and women. Lancet 2016, 388, 1302–1310. [Google Scholar] [CrossRef] [Green Version]
- Suliga, E.; Ciesla, E.; Rebak, D.; Koziel, D.; Gluszek, S. Relationship between Sitting Time, Physical Activity, and Metabolic Syndrome among Adults Depending on Body Mass Index (BMI). Med. Sci. Monit. 2018, 24, 7633–7645. [Google Scholar] [CrossRef] [PubMed]
- Virtuoso Junior, J.S.; Roza, L.B.; Tribess, S.; Meneguci, J.; Mendes, E.L.; Pegorari, M.S.; Dias, F.A.; Dos Santos Tavares, D.M.; Sasaki, J.E. Time Spent Sitting Is Associated with Changes in Biomarkers of Frailty in Hospitalized Older Adults: A Cross Sectional Study. Front. Physiol. 2017, 8, 505. [Google Scholar] [CrossRef] [Green Version]
- Hashemzadeh, M.; Rahimi, A.; Zare-Farashbandi, F.; Alavi-Naeini, A.M.; Daei, A. Transtheoretical Model of Health Behavioral Change: A Systematic Review. Iran. J. Nurs. Midwifery Res. 2019, 24, 83–90. [Google Scholar] [CrossRef]
- Columb, M.; Atkinson, M. Statistical analysis: Sample size and power estimations. BJA Educ. 2015, 16, 159–161. [Google Scholar] [CrossRef] [Green Version]
- Waden, J.; Forsblom, C.; Thorn, L.M.; Saraheimo, M.; Rosengard-Barlund, M.; Heikkila, O.; Lakka, T.A.; Tikkanen, H.; Groop, P.H.; FinnDiane Study Group. Physical activity and diabetes complications in patients with type 1 diabetes: The Finnish Diabetic Nephropathy (FinnDiane) Study. Diabetes Care 2008, 31, 230–232. [Google Scholar] [CrossRef] [PubMed] [Green Version]
- Prince, S.A.; Cardilli, L.; Reed, J.L.; Saunders, T.J.; Kite, C.; Douillette, K.; Fournier, K.; Buckley, J.P. A comparison of self-reported and device measured sedentary behaviour in adults: A systematic review and meta-analysis. Int. J. Behav. Nutr. Phys. Act. 2020, 17, 31. [Google Scholar] [CrossRef]


| Variables | Values |
|---|---|
| Male/Female (frequency) (percentage) | 14/28 (33.3/66.7) |
| Age (years) | 44.0 (33.3–56.8) |
| Duration of T1D (years) | 11.0 (3.1–18.8) |
| BMI (kg/m2) | 22.1 (20.9–23.2) |
| HbA1c (%) | 7.2 (6.7–7.8) |
| Sitting time (hours/day) | 6.0 (4.6–8.0) |
| Use of CSII (frequency) (percentage) | 11 (26.2) |
| Cigarette smoking (frequency) (percentage) | 10 (23.8) |
| Alcohol drinking (frequency) (percentage) | 18 (42.9) |
| Use of car (frequency) (percentage) | 21 (50.0) |
| Employed (frequency) (percentage) | 26 (61.9) |
| Living with family (frequency) (percentage) | 30 (71.4) |
| TTM based on exercise behavior change (frequency) (percentage) | |
| Precontemplation | 18 (42.9) |
| Contemplation | 3 (7.1) |
| Preparation | 6 (14.3) |
| Action | 1 (2.4) |
| Maintenance | 14 (33.3) |
| Variables | HbA1c | BMI | ||||
|---|---|---|---|---|---|---|
| r | p-Value | Power | r | p-Value | Power | |
| Gender | –0.20 | 0.21 | 0.25 | 0.14 | 0.39 | 0.14 |
| Age | 0.35 | 0.02 * | 0.64 | 0.23 | 0.14 | 0.31 |
| Duration of T1D | 0.22 | 0.16 | 0.29 | 0.39 | 0.01 * | 0.74 |
| BMI | 0.20 | 0.20 | 0.25 | - | - | - |
| HbA1c | - | - | - | 0.20 | 0.20 | 0.25 |
| Sitting time | 0.60 | <0.01 ** | 0.99 | <0.01 | 0.99 | 0.05 |
| Use of CSII | –0.30 | 0.05 | 0.50 | –0.07 | 0.65 | 0.07 |
| Cigarette smoking | –0.23 | 0.15 | 0.31 | 0.10 | 0.54 | 0.10 |
| Alcohol drinking | –0.27 | 0.08 | 0.42 | 0.03 | 0.83 | 0.05 |
| Use of car | –0.03 | 0.87 | 0.05 | –0.06 | 0.73 | 0.07 |
| Employed | –0.19 | 0.22 | 0.23 | 0.09 | 0.56 | 0.09 |
| Living with family | –0.27 | 0.08 | 0.42 | –0.06 | 0.72 | 0.07 |
| TTM | –0.26 | 0.09 | 0.39 | –0.40 | <0.01 ** | 0.76 |
| Variables | HbA1c | p-Value | Effect Size (r, Cramer’s V) | Power | |
|---|---|---|---|---|---|
| ≤7% (n = 16) | >7% (n = 26) | ||||
| Male/Female (frequency) (percentage) | 7/9 (43.8/56.2) | 7/19 (26.9/73.1) | 0.32 | 0.12 | 0.11 |
| Age (years) | 38.5 (33.8–47.5) | 45.5 (33.8–61.8) | 0.22 | 0.50 | 0.32 |
| Duration of T1D (years) | 6.0 (2.0–18.3) | 13.0 (5.5–18.8) | 0.17 | 0.22 | 0.10 |
| BMI (kg/m2) | 21.4 (20.0–23.0) | 22.8 (21.1–23.5) | 0.09 | 0.63 | 0.48 |
| Sitting time (hours/day) | 4.0 (3.0–5.5) | 7.3 (6.0–8.0) | <0.01 ** | 1.56 | 0.97 |
| Use of CSII (frequency) (percentage) | 6 (37.5) | 5 (19.2) | 0.28 | 0.15 | 0.15 |
| Cigarette smoking (frequency) (percentage) | 5 (31.3) | 5 (19.2) | 0.47 | 0.08 | 0.06 |
| Alcohol drinking (frequency) (percentage) | 9 (56.3) | 9 (34.6) | 0.21 | 0.16 | 0.17 |
| Use of car (frequency) (percentage) | 8 (50.0) | 13 (50.0) | 1.00 | 0.00 | 0.00 |
| Employed (frequency) (percentage) | 10 (62.5) | 16 (61.5) | 1.00 | 0.00 | 0.00 |
| Living with family (frequency) (percentage) | 13 (81.3) | 17 (65.4) | 0.32 | 0.12 | 0.08 |
| TTM based on exercise behavior change (frequency) (percentage) | 0.04 * | 0.46 | 0.69 | ||
| Precontemplation | 4 (25.0) | 14 (53.8) | |||
| Contemplation | 0 (0.0) | 3 (11.5) | |||
| Preparation | 3 (18.8) | 3 (11.5) | |||
| Action | 0 (0.0) | 1 (3.8) | |||
| Maintenance | 9 (56.3) | 5 (19.2) | |||
| Variables | Odds Ratio | 95% CI | p-Value | VIF |
|---|---|---|---|---|
| BMI (per 1-kg/m2 increase) | 1.52 | 0.86–2.69 | 0.15 | 1.18 |
| Sitting time (per 1-hour increase) | 3.53 | 1.54–8.11 | <0.01 ** | 1.55 |
| TTM based on exercise behavior change (per 1-stage increase) | 0.52 | 0.27–1.01 | 0.07 | 1.43 |
© 2020 by the authors. Licensee MDPI, Basel, Switzerland. This article is an open access article distributed under the terms and conditions of the Creative Commons Attribution (CC BY) license (http://creativecommons.org/licenses/by/4.0/).
Share and Cite
Honda, H.; Igaki, M.; Tanaka, S.-i.; Ono, K.; Hirota, Y. Impact of Self-Reported Sitting Time and Transtheoretical Model Based on Exercise Behavior Change on Glycemic and Weight Control in Japanese Adults with Type 1 Diabetes: A Cross-Sectional Study. Healthcare 2020, 8, 105. https://doi.org/10.3390/healthcare8020105
Honda H, Igaki M, Tanaka S-i, Ono K, Hirota Y. Impact of Self-Reported Sitting Time and Transtheoretical Model Based on Exercise Behavior Change on Glycemic and Weight Control in Japanese Adults with Type 1 Diabetes: A Cross-Sectional Study. Healthcare. 2020; 8(2):105. https://doi.org/10.3390/healthcare8020105
Chicago/Turabian StyleHonda, Hiroto, Makoto Igaki, Shin-ichiro Tanaka, Kumiko Ono, and Yushi Hirota. 2020. "Impact of Self-Reported Sitting Time and Transtheoretical Model Based on Exercise Behavior Change on Glycemic and Weight Control in Japanese Adults with Type 1 Diabetes: A Cross-Sectional Study" Healthcare 8, no. 2: 105. https://doi.org/10.3390/healthcare8020105
APA StyleHonda, H., Igaki, M., Tanaka, S.-i., Ono, K., & Hirota, Y. (2020). Impact of Self-Reported Sitting Time and Transtheoretical Model Based on Exercise Behavior Change on Glycemic and Weight Control in Japanese Adults with Type 1 Diabetes: A Cross-Sectional Study. Healthcare, 8(2), 105. https://doi.org/10.3390/healthcare8020105