Rescuing Suboptimal Patient-Reported Outcome Instrument Data in Clinical Trials: A New Strategy


Abstract
1. Introduction
2. Materials and Methods
2.1. Patients
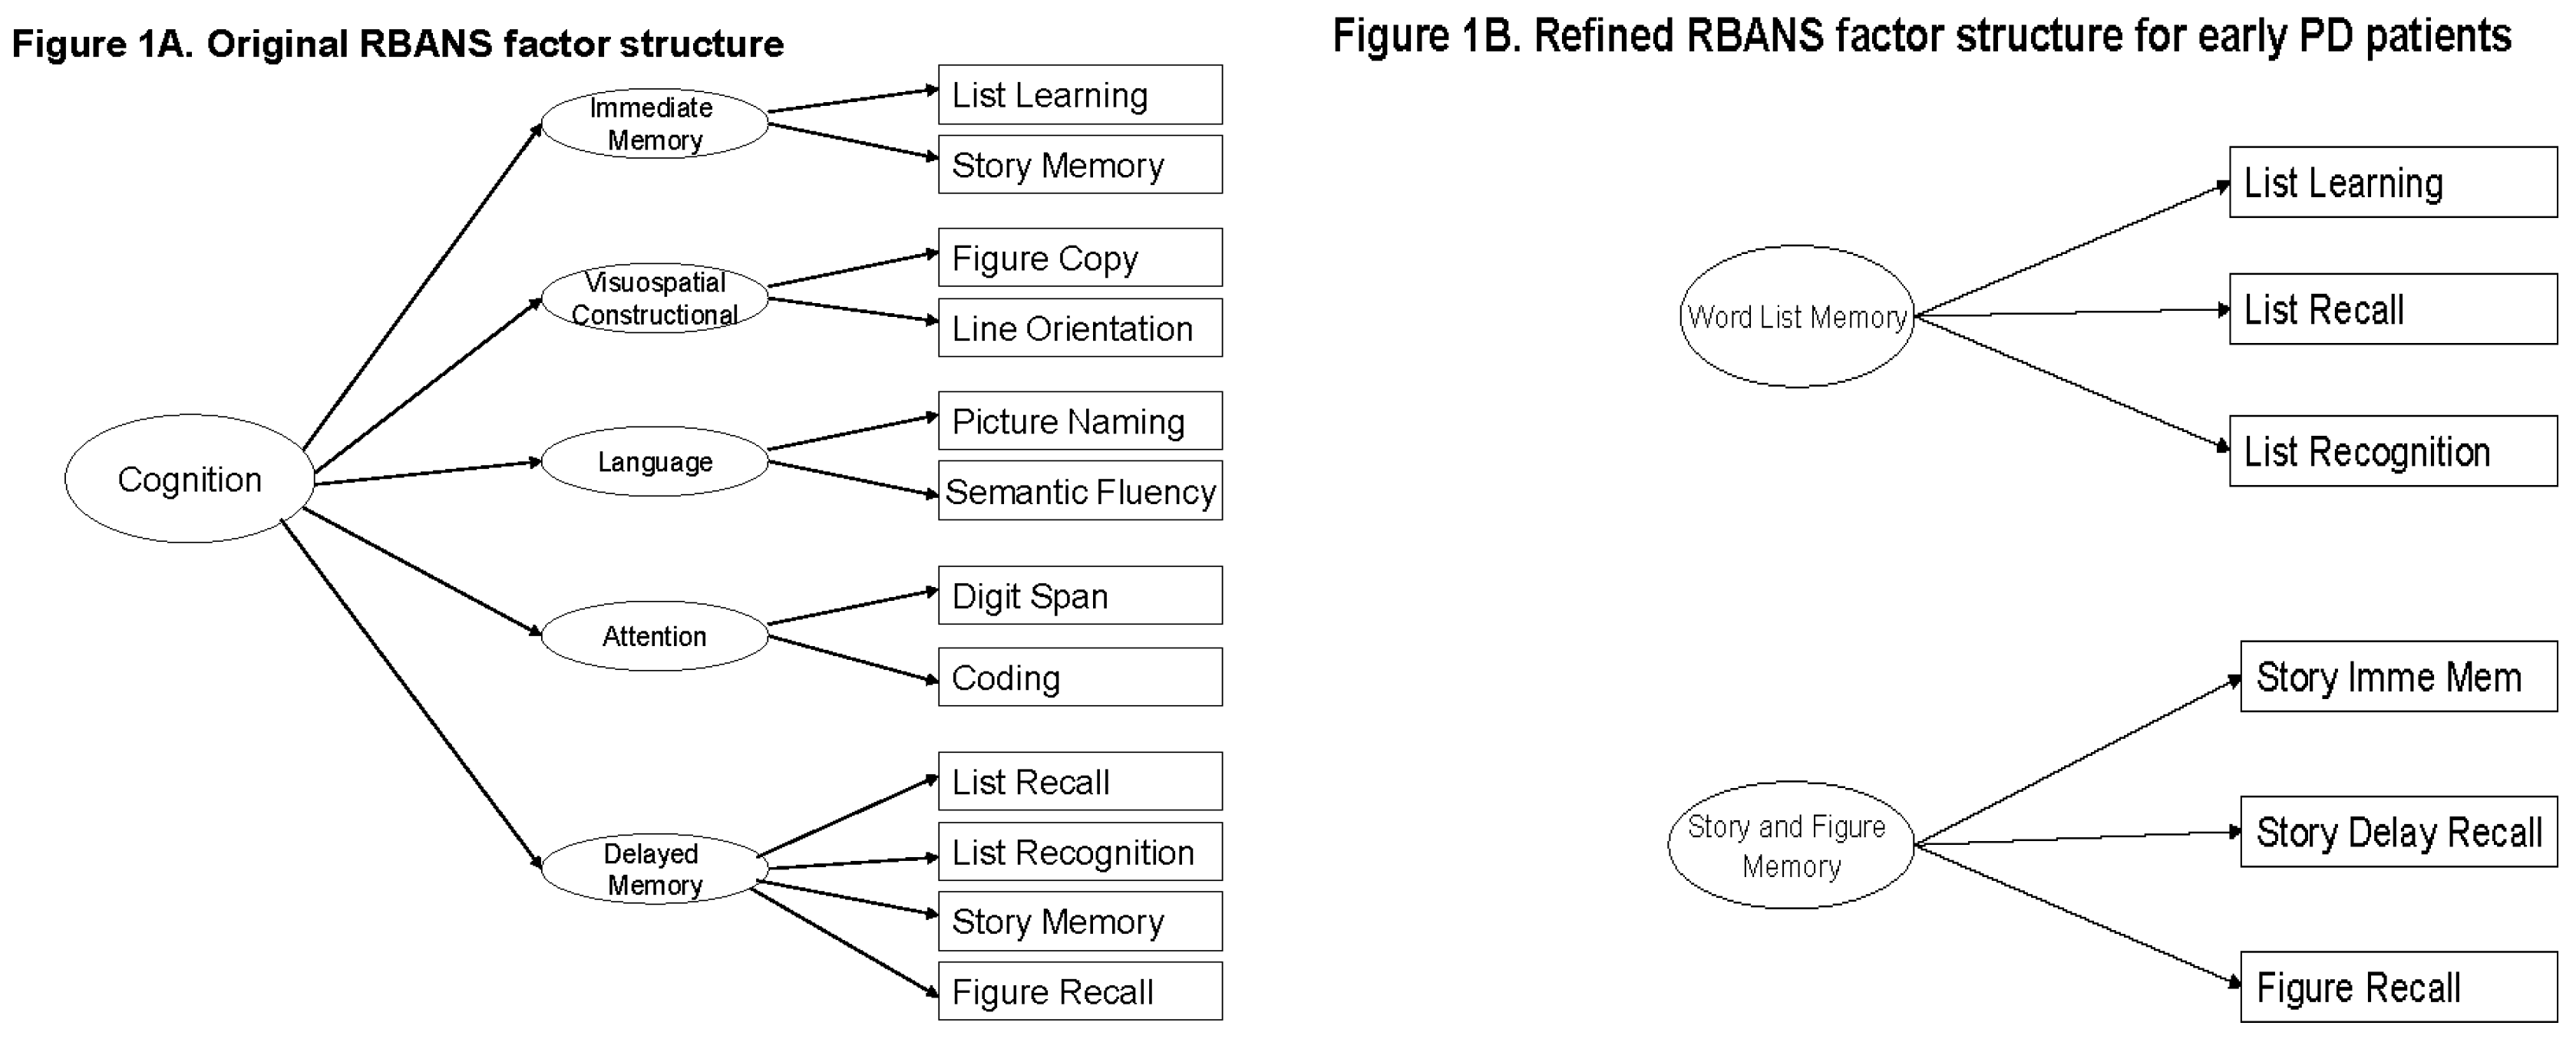
2.2. The RBANS
2.3. Statistical Analysis
3. Results
4. Discussion
5. Conclusions
Acknowledgments
Author Contributions
Conflicts of Interest
References
- Teresi, J.A.; Fleishman, J.A. Differential item functioning and health assessment. Qual. Life Res. 2007, 16 (Suppl. 1), 33–42. [Google Scholar] [CrossRef] [PubMed]
- Randolph, C.; Tierney, M.C.; Mohr, E.; Chase, T.N. The Repeatable Battery for the Assessment of Neuropsychological Status (RBANS): Preliminary Clinical Validity. J. Clin. Exp. Neuropsychol. 1998, 20, 310–319. [Google Scholar] [CrossRef] [PubMed]
- NINDS NET-PD Investigators. A randomized, double-blind, futility clinical trial of creatine and minocycline in early Parkinson disease. Neurology 2006, 66, 664–671. [Google Scholar]
- NINDS NET-PD Investigators. A randomized clinical trial of coenzyme Q10 and GPI-1485 in early Parkinson disease. Neurology 2007, 68, 20–28. [Google Scholar]
- Xu, Y.; Lu, Z. Assessment and treatment of cognitive dysfunction in schizophrenia patient. World Clin. Drugs 2016, 37, 8–12. [Google Scholar]
- Nakatsu, D.; Fukuhara, T.; Chaytor, N.S.; Phatak, V.S.; Avellino, A.M. Repeatable Battery for the Assessment of Neuropsychological Status (RBANS) as a Cognitive Evaluation Tool for Patients with Normal Pressure Hydrocephalus. Neurol. Med. Chir. 2016, 56, 51–61. [Google Scholar] [CrossRef] [PubMed][Green Version]
- Costaggiu, D.; Ortu, F.; Pinna, E.; Serchisu, L.; di Martino, M.L.; Manconi, P.E.; Mandas, A. RBANS: A valid tool for cognitive assessment of HIV-infected people on cART. G. Gerontol. 2015, 63, 268–273. [Google Scholar]
- Carlozzi, N.E.; Horner, M.D.; Yang, C.; Tilley, B.C. Factor Analysis of the Repeatable Battery for the Assessment of Neuropsychological Status. Appl. Neuropsychol. 2008, 15, 274–279. [Google Scholar] [CrossRef] [PubMed]
- Duff, K.; Langbehn, D.R.; Schoenberg, M.R.; Moser, D.J.; Baade, L.E.; Mold, J.; Scott, J.G.; Adams, R.L. Examining the Repeatable Battery for the Assessment of Neuropsychological Status: Factor Analytic Studies in an Elderly Sample. Am. J. Geriatr. Psychiatry 2006, 14, 976–979. [Google Scholar] [CrossRef] [PubMed]
- Garcia, C.; Leahy, B.; Corradi, K.; Forchetti, C. Component Structure of the Repeatable Battery for the Assessment of Neuropsychological Status in Dementia. Arch. Clin. Neuropsychol. 2008, 23, 63–72. [Google Scholar] [CrossRef] [PubMed]
- Torrence, N.D.; John, S.E.; Gavett, B.E.; O’Bryant, S.E. An Empirical Comparison of Competing Factor Structures for the Repeatable Battery for the Assessment of Neuropsychological Status: A Project Frontier Study. Arch. Clin. Neuropsychol. 2016, 31, 88–96. [Google Scholar] [CrossRef] [PubMed]
- Vogt, E.M.; Prichett, G.D.; Hoelzle, J.B. Invariant Two-Component Structure of the Repeatable Battery for the Assessment of Neuropsychological Status (RBANS). Appl. Neuropsychol. Adult 2017, 24, 50–64. [Google Scholar] [CrossRef] [PubMed]
- Yang, C.; Garrett-Mayer, E.; Schneider, J.S.; Gollomp, S.M.; Tilley, B.C. Repeatable battery for assessment of neuropsychological status in early Parkinson’s disease. Mov. Disord. 2009, 24, 1453–1460. [Google Scholar] [CrossRef] [PubMed]
- Wilde, M. The validity of the repeatable battery of neuropsychological status in acute stroke. Clin. Neuropsychol. 2006, 20, 702–715. [Google Scholar] [CrossRef] [PubMed]
- Yang, C.; Schneider, J.; Tilley, B. Fix the left side of an equation: How to rescue positive findings from a clinical trial that used scales if they were wrong?—Illustration with an example. In Proceedings of the 35th Annual Meeting of the Society for Clinical Trials (SCT), Philadelphia, PA, USA, 18–21 May 2014. [Google Scholar]
- Faul, F.; Erdfelder, E.; Lang, A.-G.; Buchner, A. G*Power 3: A flexible statistical power analysis program for the social, behavioral, and biomedical sciences. Behav. Res. Methods 2007, 39, 175–191. [Google Scholar] [CrossRef] [PubMed]
- Faul, F.; Erdfelder, E.; Buchner, A.; Lang, A.G. Statistical power analyses using G*Power 3.1: Tests for correlation and regression analyses. Behav. Res. Methods 2009, 41, 1149–1160. [Google Scholar] [CrossRef] [PubMed]
- Jankovic, J.; McDermott, M.; Carter, J.; Gauthier, S.; Goetz, C.; Golbe, L.; Huber, S.; Koller, W.; Olanow, C.; Shoulson, I.; Stern, M. Variable expression of Parkinson’s disease: A base-line analysis of the DAT ATOP cohort. Neurology 1990, 40, 1529–1534. [Google Scholar] [CrossRef] [PubMed]
- Cohen, J. Statistical power analysis. Curr. Dir. Psychol. Sci. 1992, 1, 98–101. [Google Scholar] [CrossRef]
- Piantadosi, S. Clinical Trials: A Methodologic Perspective, 3th ed.; John Wiley & Sons: Hoboken, NJ, USA, 2017. [Google Scholar]
- Nuzzo, R. Scientific method: Statistical errors. Nature 2014, 506, 150–152. [Google Scholar] [CrossRef] [PubMed]
- Ronald, L.W.; Lazar, N.A. The ASA’s Statement on p-Values: Context, Process, and Purpose. Am. Stat. 2016, 70, 129–133. [Google Scholar] [CrossRef]
- Zumbo, B.D. Validity: Foundational Issues and Statistical Methodology. Handb. Stat. 2006, 26, 45–79. [Google Scholar]
- Haag, D.G.; Peres, K.G.; Balasubramanian, M.; Brennan, D.S. Oral Conditions and Health-Related Quality of Life: A Systematic Review. J. Dent. Res. 2017, 96, 864–874. [Google Scholar] [CrossRef] [PubMed]
- Zumbo, B.D.; Chan, E.K.H. (Eds.) Validity and Validation in Social, Behavioral, and Health Sciences; Social Indicators Research Series; Springer: New York, NY, USA, 2014. [Google Scholar]
- American Academy of Clinical Neuropsychology (AACN). AACN practice guidelines for neuropsychological assessment and consultation. Clin. Neuropsychol. 2007, 21, 209–231. [Google Scholar]
- American Educational Research Association (AERA); American Psychological Association (APA); National Council on Measurement in Education (NCME). Standards for Educational and Psychological Testing; AERA: Washington, DC, USA, 2014. [Google Scholar]


| FS1 (n = 151) | 1. Creatine (n = 46) | 2. Minocycline (n = 52) | 3. Placebo (n = 53) | p-Value | |
| Age | Mean ± SD | 61.0 ± 10.8 | 64.1 ± 10.5 | 60.7 ± 9.7 | 0.11 |
| Education | Mean ± SD | 15.4 ± 3.5 | 15.0 ± 2.9 | 15.2 ± 2.9 | 0.95 |
| Gender | Male | 32 (69.6%) | 28 (53.9%) | 34 (64.2%) | 0.26 |
| Female | 14 (30.4%) | 24 (46.1%) | 19 (35.8%) | ||
| Race | White | 43 (93.5%) | 51 (98.1%) | 49 (92.5%) | 0.44 |
| Others * | 3 (6.5%) | 1 (1.9%) | 4 (7.5%) | ||
| Ethnicity | Not Hispanic or Latino | 45 (97.8%) | 51 (98.1%) | 51 (96.2%) | 0.99 |
| Others † | 1 (2.2%) | 1 (1.9%) | 2 (3.8%) | ||
| UPDRS Total Score (Parts I–III) | Mean ± SD | 22.8 ± 8.9 | 23.7 ± 9.2 | 23.0 ± 10.3 | 0.78 |
| Schwab and England Activities of Daily Living scale | Mean ± SD | 92.9 ± 5.1 | 92.5 ± 6.4 | 94.5 ± 4.6 | 0.17 |
| Tremor Dominant ‡ | Yes | 21 (45.7%) | 25 (48.1%) | 33 (62.3%) | 0.19 |
| No | 25 (54.3%) | 27 (51.9%) | 20 (37.7%) | ||
| Hoehn and Yahr Staging | 0 | 0 | 0 | 0 | 0.46 |
| 1 | 27 (58.7%) | 24 (46.1%) | 27 (50.9%) | ||
| 2 | 19 (41.3%) | 28 (53.9%) | 26 (49.1%) | ||
| 3 | 0 | 0 | 0 | ||
| FS-TOO (n = 152) | 1. CoQ10 (n = 50) | 2. Minocycline (n = 50) | 3. Placebo (n = 52) | p-Value | |
| Age | Mean ± SD | 61.1 ± 9.2 | 61.4 ± 10.9 | 61.4 ± 9.2 | 0.90 |
| Education | Mean ± SD | 15.6 ± 3.2 | 15.4 ± 3.0 | 15.4 ± 2.7 | 0.97 |
| Gender | Male | 31 (62.0%) | 32 (64.0%) | 38 (73.1%) | 0.45 |
| Female | 19 (38.0%) | 18 (36.0%) | 14 (26.9%) | ||
| Race | White | 47 (94.0%) | 49 (98.0%) | 47 (90.4%) | 0.30 |
| Others * | 3 (6.0%) | 1 (2.0%) | 5 (9.6%) | ||
| Ethnicity | Not Hispanic or Latino | 50 (100.0%) | 48 (96.0%) | 52 (100.0%) | 0.21 |
| Others † | 0 | 2 (4.0%) | 0 | ||
| UPDRS Total Score (Parts I–III) | Mean ± SD | 22.0 ± 9.6 | 20.8 ± 8.8 | 22.2 ± 9.1 | 0.67 |
| Schwab and England Activities of Daily Living scale | Mean ± SD | 92.9 ± 5.7 | 93.8 ± 4.4 | 93.1 ± 4.9 | 0.78 |
| Tremor Dominant ‡ | Yes | 26 (52.0%) | 31 (62.0%) | 27 (51.9%) | 0.50 |
| No | 24 (48.0%) | 19 (38.0%) | 25 (48.1%) | ||
| Hoehn and Yahr Staging | 0 | 1 (2.0%) | 0 | 0 | 0.96 |
| 1 | 27 (54.0%) | 28 (56.0%) | 30 (57.7%) | ||
| 2 | 21 (42.0%) | 22 (44.0%) | 22 (42.3%) | ||
| 3 | 1 (2.0%) | 0 | 0 |
| FS1 (n = 151) | RBANS Scores | Creatine (n = 46) | Minocycline (n = 52) | Placebo (n = 53) | p-Value | ||||
| Mean | SD | Mean | SD | Mean | SD | ||||
| Original | IM | 5.93 | 12.79 | 4.63 | 12.18 | 3.77 | 11.95 | 0.86 | |
| VC | −2.91 | 14.43 | −7.29 | 18.37 | −2.28 | 17.39 | 0.34 | ||
| La | −1.22 | 10.52 | −2.94 | 9.33 | 0.53 | 9.34 | 0.09 | ||
| Att | 0.63 | 13.17 | −1.38 | 14.43 | −0.94 | 12.48 | 0.87 | ||
| DM | 2.09 | 13.49 | −0.52 | 11.45 | −2.28 | 14.28 | 0.26 | ||
| Total | 1.39 | 9.77 | −2.81 | 10.04 | −0.94 | 9.81 | 0.14 | ||
| Refined | WLM | 3.00 | 5.52 | 0.75 | 5.55 | 1.25 | 5.95 | 0.15 | |
| SFM | 1.11 | 7.91 | 0.87 | 7.36 | 0.11 | 6.25 | 0.95 | ||
| FS-TOO (n = 152) | RBANS Score | CoQ10 (n = 50) | GPI1485 (n = 50) | Placebo (n = 52) | p-Value | ||||
| Mean | SD | Mean | SD | Mean | SD | ||||
| Original | IM | 0.60 | 10.24 | 0.18 | 10.41 | 0.19 | 14.98 | 0.82 | |
| VC | −0.96 | 14.45 | −5.72 | 16.90 | −1.94 | 14.76 | 0.50 | ||
| La | 1.44 | 9.55 | −0.16 | 8.11 | −1.60 | 8.38 | 0.13 | ||
| Att | −0.02 | 13.09 | 0.02 | 12.90 | 1.65 | 13.69 | 0.71 | ||
| DM | 4.78 | 14.23 | 1.18 | 20.24 | 0.37 | 14.63 | 0.51 | ||
| Total | 2.14 | 9.82 | −1.16 | 10.43 | −0.52 | 10.87 | 0.24 | ||
| Refined | WLM | 0.10 | 4.71 | 0.60 | 4.92 | 0.52 | 6.12 | 0.80 | |
| SFM | 1.52 | 5.66 | −0.12 | 6.86 | −0.83 | 5.36 | 0.13 | ||
© 2018 by the authors. Licensee MDPI, Basel, Switzerland. This article is an open access article distributed under the terms and conditions of the Creative Commons Attribution (CC BY) license (http://creativecommons.org/licenses/by/4.0/).
Share and Cite
Yang, C.; Vrana, K.E. Rescuing Suboptimal Patient-Reported Outcome Instrument Data in Clinical Trials: A New Strategy. Healthcare 2018, 6, 27. https://doi.org/10.3390/healthcare6010027
Yang C, Vrana KE. Rescuing Suboptimal Patient-Reported Outcome Instrument Data in Clinical Trials: A New Strategy. Healthcare. 2018; 6(1):27. https://doi.org/10.3390/healthcare6010027
Chicago/Turabian StyleYang, Chengwu, and Kent E. Vrana. 2018. "Rescuing Suboptimal Patient-Reported Outcome Instrument Data in Clinical Trials: A New Strategy" Healthcare 6, no. 1: 27. https://doi.org/10.3390/healthcare6010027
APA StyleYang, C., & Vrana, K. E. (2018). Rescuing Suboptimal Patient-Reported Outcome Instrument Data in Clinical Trials: A New Strategy. Healthcare, 6(1), 27. https://doi.org/10.3390/healthcare6010027