


Correlations Between Gender, Age, and Occupational Factors on the Work Ability Index Among Healthcare Professionals

 , , , , , and
Abstract
:1. Introduction
1.1. Population Aging
1.2. Effect of Aging
1.3. Aging and Work
- The sensory-perceptive system, responsible for receiving information from the environment through the senses.
- The cognitive system, which processes sensory input and interacts with memory.
- The motor system, which executes actions based on cognitive decisions.
1.4. Work Ability Index
- Subjective estimation of present work ability compared with the lifetime best (1–10 points);
- Subjective work ability in relation to both physical and mental demands of the work (2–10 points);
- Number of diagnosed diseases (1–6 points);
- Subjective estimation of work impairment due to disease (1–6 points);
- Sickness absence during past year (1–6 points);
- Own prognosis of work ability after two years (1–7 points);
- Psychological resources (enjoying daily tasks, activity and life spirit, optimistic about the future) (1–4 points).
1.5. WAI and Non-Modifiable Variables (Gender and Age)
Scope and Research Question
2. Materials and Methods
2.1. Design of the Study
2.2. Population of the Study
Inclusion and Exclusion Criteria
- Being a healthcare professional (nurses, physicians, healthcare technicians, and midwives) employed at the facility under study.
- Undergoing mandatory occupational health surveillance.
- Providing informed consent in accordance with Law 675/1996.
- Workers not belonging to healthcare categories (e.g., administrative staff not involved in clinical activities and non-healthcare support personnel).
- Individuals who did not provide informed consent.
- Individuals not subject to mandatory occupational health surveillance during the study period.
2.3. Data Collection Tools
2.4. Statistical Analysis
3. Results
4. Discussion
5. Conclusions
Limits
Author Contributions
Funding
Institutional Review Board Statement
Informed Consent Statement
Data Availability Statement
Conflicts of Interest
References
- Ilmarinen, J. The Work Ability Index (WAI). Occup. Med. 2007, 57, 160. [Google Scholar] [CrossRef]
- Tuomi, K.; Ilmarinen, J.; Jahkola, A.; Katajarinne, L.; Tulkki, A. Work Ability Index, 2nd ed.; Finnish Institute of Occupational Health: Helsinki, Finland, 1998. [Google Scholar]
- El Fassi, M.; Bocquet, V.; Majery, N.; Lair, M.L.; Couffignal, S.; Mairiaux, P. Work ability assessment in a worker population: Comparison and determinants of Work Ability Index and Work Ability score. BMC Public Health 2013, 13, 305. [Google Scholar] [CrossRef]
- Robson, W.B.P. Aging Populations and the Workforce: Challenges for Employers; British-North American Committee: Washington, DC, USA, 2001. [Google Scholar]
- U.S. Department of Health and Human Services. Physical Activity Guidelines for Americans Midcourse Report: Implementation Strategies for Older Adults; U.S. Department of Health and Human Services: Washington, DC, USA, 2023.
- de Souto Barreto, P.; Rolland, Y.; Vellas, B.; Maltais, M. Association of long-term exercise training with risk of falls, fractures, hospitalizations, and mortality in older adults: A systematic review and meta-analysis. JAMA Intern. Med. 2018, 179, 394–405. [Google Scholar] [CrossRef]
- Jin, H.; Zhou, J.; Zhang, J.; Fu, Y. Factors influencing healthcare workers’ performance before and after the coronavirus disease 2019 pandemic: A bibliometric analysis with supplementary comparative analysis. Work 2024, 79, 1175–1194. [Google Scholar] [CrossRef]
- Kymäläinen, H.; Hujala, T.; Häggström, C.; Malinen, J. Workability and productivity among CTL machine operators—Associations with sleep, fitness, and shift work. Int. J. For. Eng. 2023, 34, 426–438. [Google Scholar]
- Danneskiold-Samsøe, B.; Bartels, E.M.; Bülow, P.M.; Lund, H.; Stockmarr, A.; Holm, C.C.; Wätjen, I.; Appleyard, M.; Bliddal, H. Isokinetic and isometric muscle strength in a healthy population with special reference to age and gender. Acta Physiol. 2009, 197 (Suppl. 673), 1–68. [Google Scholar] [CrossRef]
- World Health Organization. Decade of Healthy Ageing: Plan of Action. 2020. Available online: https://www.who.int/initiatives/decade-of-healthy-ageing (accessed on 9 March 2025).
- Report from the Commission to the European Parliament, the Council, the European Economic and Social Committee Ante Committee of the Regions on the Impact of Demographic Change. 2020. Available online: https://eur-lex.europa.eu/legal-content/EN/TXT/PDF/?uri=CELEX:52020DC0241 (accessed on 8 March 2025).
- ISTAT Istituto Nazionale di Statistica. Invecchiamento Attivo e Condizioni di Vita Degli Anziani in Italia. 2020. Available online: https://www.istat.it/it/archivio/246504 (accessed on 8 March 2025).
- ISTAT Istituto Nazionale di Statistica. Ricostruzione della Popolazione, Rilevazione della Popolazione per Sesso età e Stato Civile, Previsioni Demografiche Base 1.1.2021. 2021. Available online: https://www.istat.it/it/files/2022/09/REPORT-PREVISIONI-DEMOGRAFICHE-2021.pdf (accessed on 9 March 2025).
- Ilmarinen, J.E. Aging workers. Occup. Environ. Med. 2001, 58, 546–552. [Google Scholar] [CrossRef]
- Justice, J.N.; Gregory, H.; Tchkonia, T.; LeBrasseur, N.K.; Kirkland, J.L.; Kritchevsky, S.B.; Nicklas, B.J. Cellular Senescence Biomarker p16INK4a+ Cell Burden in Thigh Adipose is Associated With Poor Physical Function in Older Women. J. Gerontol. Ser. A 2018, 73, 939–945. [Google Scholar] [CrossRef]
- Lakatta, E.G.; Levy, D. Arterial and cardiac aging: Major shareholders in cardiovascular disease enterprises: Part I: Aging arteries: A “set up” for vascular disease. Circulation 2003, 107, 139–146. [Google Scholar] [CrossRef]
- Antelmi, I.; de Paula, R.S.; Shinzato, A.R.; Peres, C.A.; Mansur, A.J.; Grupi, C.J. Influence of age, gender, body mass index, and functional capacity on heart rate variability in a cohort of subjects without heart disease. Am. J. Cardiol. 2004, 93, 381–385. [Google Scholar] [CrossRef]
- Sharma, G.; Goodwin, J. Effect of aging on respiratory system physiology and immunology. Clin. Interv. Aging 2006, 1, 253–260. [Google Scholar] [CrossRef]
- Lowery, E.M.; Brubaker, A.L.; Kuhlmann, E.; Kovacs, E.J. The aging lung. Clin. Interv. Aging 2013, 8, 1489–1496. [Google Scholar] [CrossRef] [PubMed]
- Bonomini, F.; Rodella, L.F.; Rezzani, R. Metabolic syndrome, aging and involvement of oxidative stress. Aging Dis. 2015, 6, 109–120. [Google Scholar] [CrossRef]
- Park, D.C.; Bischof, G.N. The aging mind: Neuroplasticity in response to cognitive training. Dialogues Clin. Neurosci. 2013, 15, 109–119. [Google Scholar] [CrossRef] [PubMed]
- Toossi, M. Labor Force Projections to 2024: The Labor Force is Growing, But Slowly. In Monthly Labor Review; U.S. Bureau of Labor Statistics: Washington, DC, USA, 2015. [Google Scholar]
- Alkjaer, T.; Pilegaard, M.; Bakke, M.; Jensen, B.R. Effect of aging on performance, muscle activation and perceived stress during mentally demanding computer tasks. Scand. J. Work Environ. Health. 2005, 31, 152–159. [Google Scholar] [CrossRef]
- De Lange, A.H.; Taris, T.W.; Jansen, P.G.W.; Smulders, P.; Houtman, I.L.D.; Kompier, M.A.J. Age as a factor in the relation between work and mental health: Results from the longitudinal TAS study. In Occupational Health Psychology: European Perspectives on Research, Education and Practice; Houdmont, J., McIntyre, S., Eds.; ISMAI Publications: Guimarães, Portugal, 2006; pp. 21–45. [Google Scholar]
- Wong, C.M.; Tetrick, L.E. Job Crafting: Older Workers’ Mechanism for Maintaining Person-Job Fit. Front. Psychol. 2017, 8, 1548. [Google Scholar] [CrossRef]
- Merkel, S.; Ruokolainen, M.; Holman, D. Challenges and practices in promoting (ageing) employees working career in the health care sector—Case studies from Germany, Finland and the UK. BMC Health Serv. Res. 2019, 19, 918. [Google Scholar] [CrossRef]
- Ilmarinen, J.; Tuomi, K.; Klockars, M. Changes in the work ability of active employees over an 11-year period. Scand. J. Work Environ. Health. 1997, 23 (Suppl. 1), 49–57. [Google Scholar]
- Roelen, C.A.; Heymans, M.W.; Twisk, J.W.; van der Klink, J.J.; Groothoff, J.W.; van Rhenen, W. Work Ability Index as tool to identify workers at risk of premature work exit. J. Occup. Rehabil. 2014, 24, 747–754. [Google Scholar] [CrossRef]
- Reeuwijk, K.G.; Robroek, S.J.; Niessen, M.A.; Kraaijenhagen, R.A.; Vergouwe, Y.; Burdorf, A. The Prognostic Value of the Work Ability Index for Sickness Absence among Office Workers. PLoS ONE 2015, 10, e0126969. [Google Scholar] [CrossRef]
- Martinez, M.C.; Latorre Mdo, R.; Fischer, F.M. Validity and reliability of the Brazilian version of the Work Ability Index questionnaire. Rev. Saude Publica. 2009, 43, 525–532. [Google Scholar] [CrossRef] [PubMed]
- Rothmore, P.; Gray, J. Using the Work Ability Index to identify workplace hazards. Work 2019, 62, 251–259. [Google Scholar] [CrossRef]
- Abbasi, M.; Zakerian, A.; Kolahdouzi, M.; Mehri, A.; Akbarzadeh, A.; Ebrahimi, M.H. Relationship between Work Ability Index and Cognitive Failure among Nurses. Electron. Physician 2016, 8, 2136–2143. [Google Scholar] [CrossRef]
- Carel, R.S.; Zusman, M.; Karakis, I. Work Ability Index in Israeli hospital nurses: Applicability of the adapted questionnaire. Exp. Aging Res. 2013, 39, 579–590. [Google Scholar] [CrossRef] [PubMed]
- Camerino, D.; Conway, P.M.; Van der Heijden, B.I.J.M.; Estryn-Behar, M.; Consonni, D.; Gould, D.; Hasselhorn, H.; the NEXT-Study Group. Low-perceived work ability, ageing and intention to leave nursing: A comparison among 10 European countries. J. Adv. Nurs. 2006, 56, 542–552. [Google Scholar] [CrossRef]
- Magnavita, N.; Meraglia, I.; Viti, G.; Borghese, L. The Work Ability Index (WAI) in the Healthcare Sector: A Cross-Sectional/Retrospective Assessment of the Questionnaire. Int. J. Environ. Res. Public Health 2024, 21, 349. [Google Scholar] [CrossRef]
- Ronchese, F.; Ricci, F.; Peccolo, G.; Persechino, B.; Rondinone, B.M.; Buresti, G.; Negro, C.; Bovenzi, M.; Miani, A. Relation of the work ability index to fitness for work in healthcare and public employees in a region of Northeastern Italy. Int. Arch. Occup. Environ. Health 2023, 96, 1203–1210. [Google Scholar] [CrossRef] [PubMed]
- Pranjic, N.; Gonzales, J.M.G.; Cvejanov-Kezunović, L. Perceived Work Ability Index of Public Service Employees in Rela-tion to Ageing and Gender: A Comparison in Three European Countries. Slov. J. Public Health 2019, 58, 179–188. [Google Scholar] [CrossRef]
- Padula, R.S.; da Silva Valente Ldo, S.; de Moraes, M.V.; Chiavegato, L.D.; Cabral, C.M. Gender and age do not influence the ability to work. Work 2012, 41 (Suppl. 1), 4330–4332. [Google Scholar] [CrossRef]
- La Torre, G.; Grima, D.; Romano, F.; Polimeni, A. Perceived work ability and work-family conflict in healthcare workers: An observational study in a teaching hospital in Italy. J. Occup. Health 2021, 63, e12271. [Google Scholar] [CrossRef]
- Lin, S.; Wang, Z.; Wang, M. Work ability of workers in western China: Reference data. Occup. Med. 2006, 56, 89–93. [Google Scholar] [CrossRef]
- Nilsson, K.; Hydbom, A.R.; Rylander, L. Factors influencing the decision to extend working life or retire. Scand. J. Work Environ. Health 2011, 37, 473–480. [Google Scholar] [CrossRef] [PubMed]
- Monteiro, M.S.; Ilmarinen, J.; Corrâa Filho, H.R. Work ability of workers in different age groups in a public health institution in Brazil. Int. J. Occup. Saf. Ergon. 2006, 12, 417–427. [Google Scholar] [CrossRef] [PubMed]
- Rostamabadi, A.; Zamanian, Z.; Sedaghat, Z. Factors associated with work ability index (WAI) among intensive care units’ (ICUs’) nurses. J. Occup. Health 2017, 59, 147–155. [Google Scholar] [CrossRef]
- Linaker, C.H.; D’Angelo, S.; Syddall, H.E.; Harris, E.C.; Cooper, C.; Walker-Bone, K. Body Mass Index (BMI) and Work Ability in Older Workers: Results from the Health and Employment after Fifty (HEAF) Prospective Cohort Study. Int. J. Environ. Res. Public Health 2020, 17, 1647. [Google Scholar] [CrossRef]


| Variables | n | % |
|---|---|---|
| Gender | ||
| Women | 1248 | 67.6 |
| Men | 599 | 32.4 |
| Age group (yrs.) | ||
| <55 | 1373 | 74.3 |
| ≥55 | 474 | 25.7 |
| Profession | ||
| Administrative personnel | 207 | 11.2 |
| Nurses/HCWs/midwives | 882 | 47.8 |
| Physicians | 544 | 29.5 |
| Technicians | 214 | 11.6 |
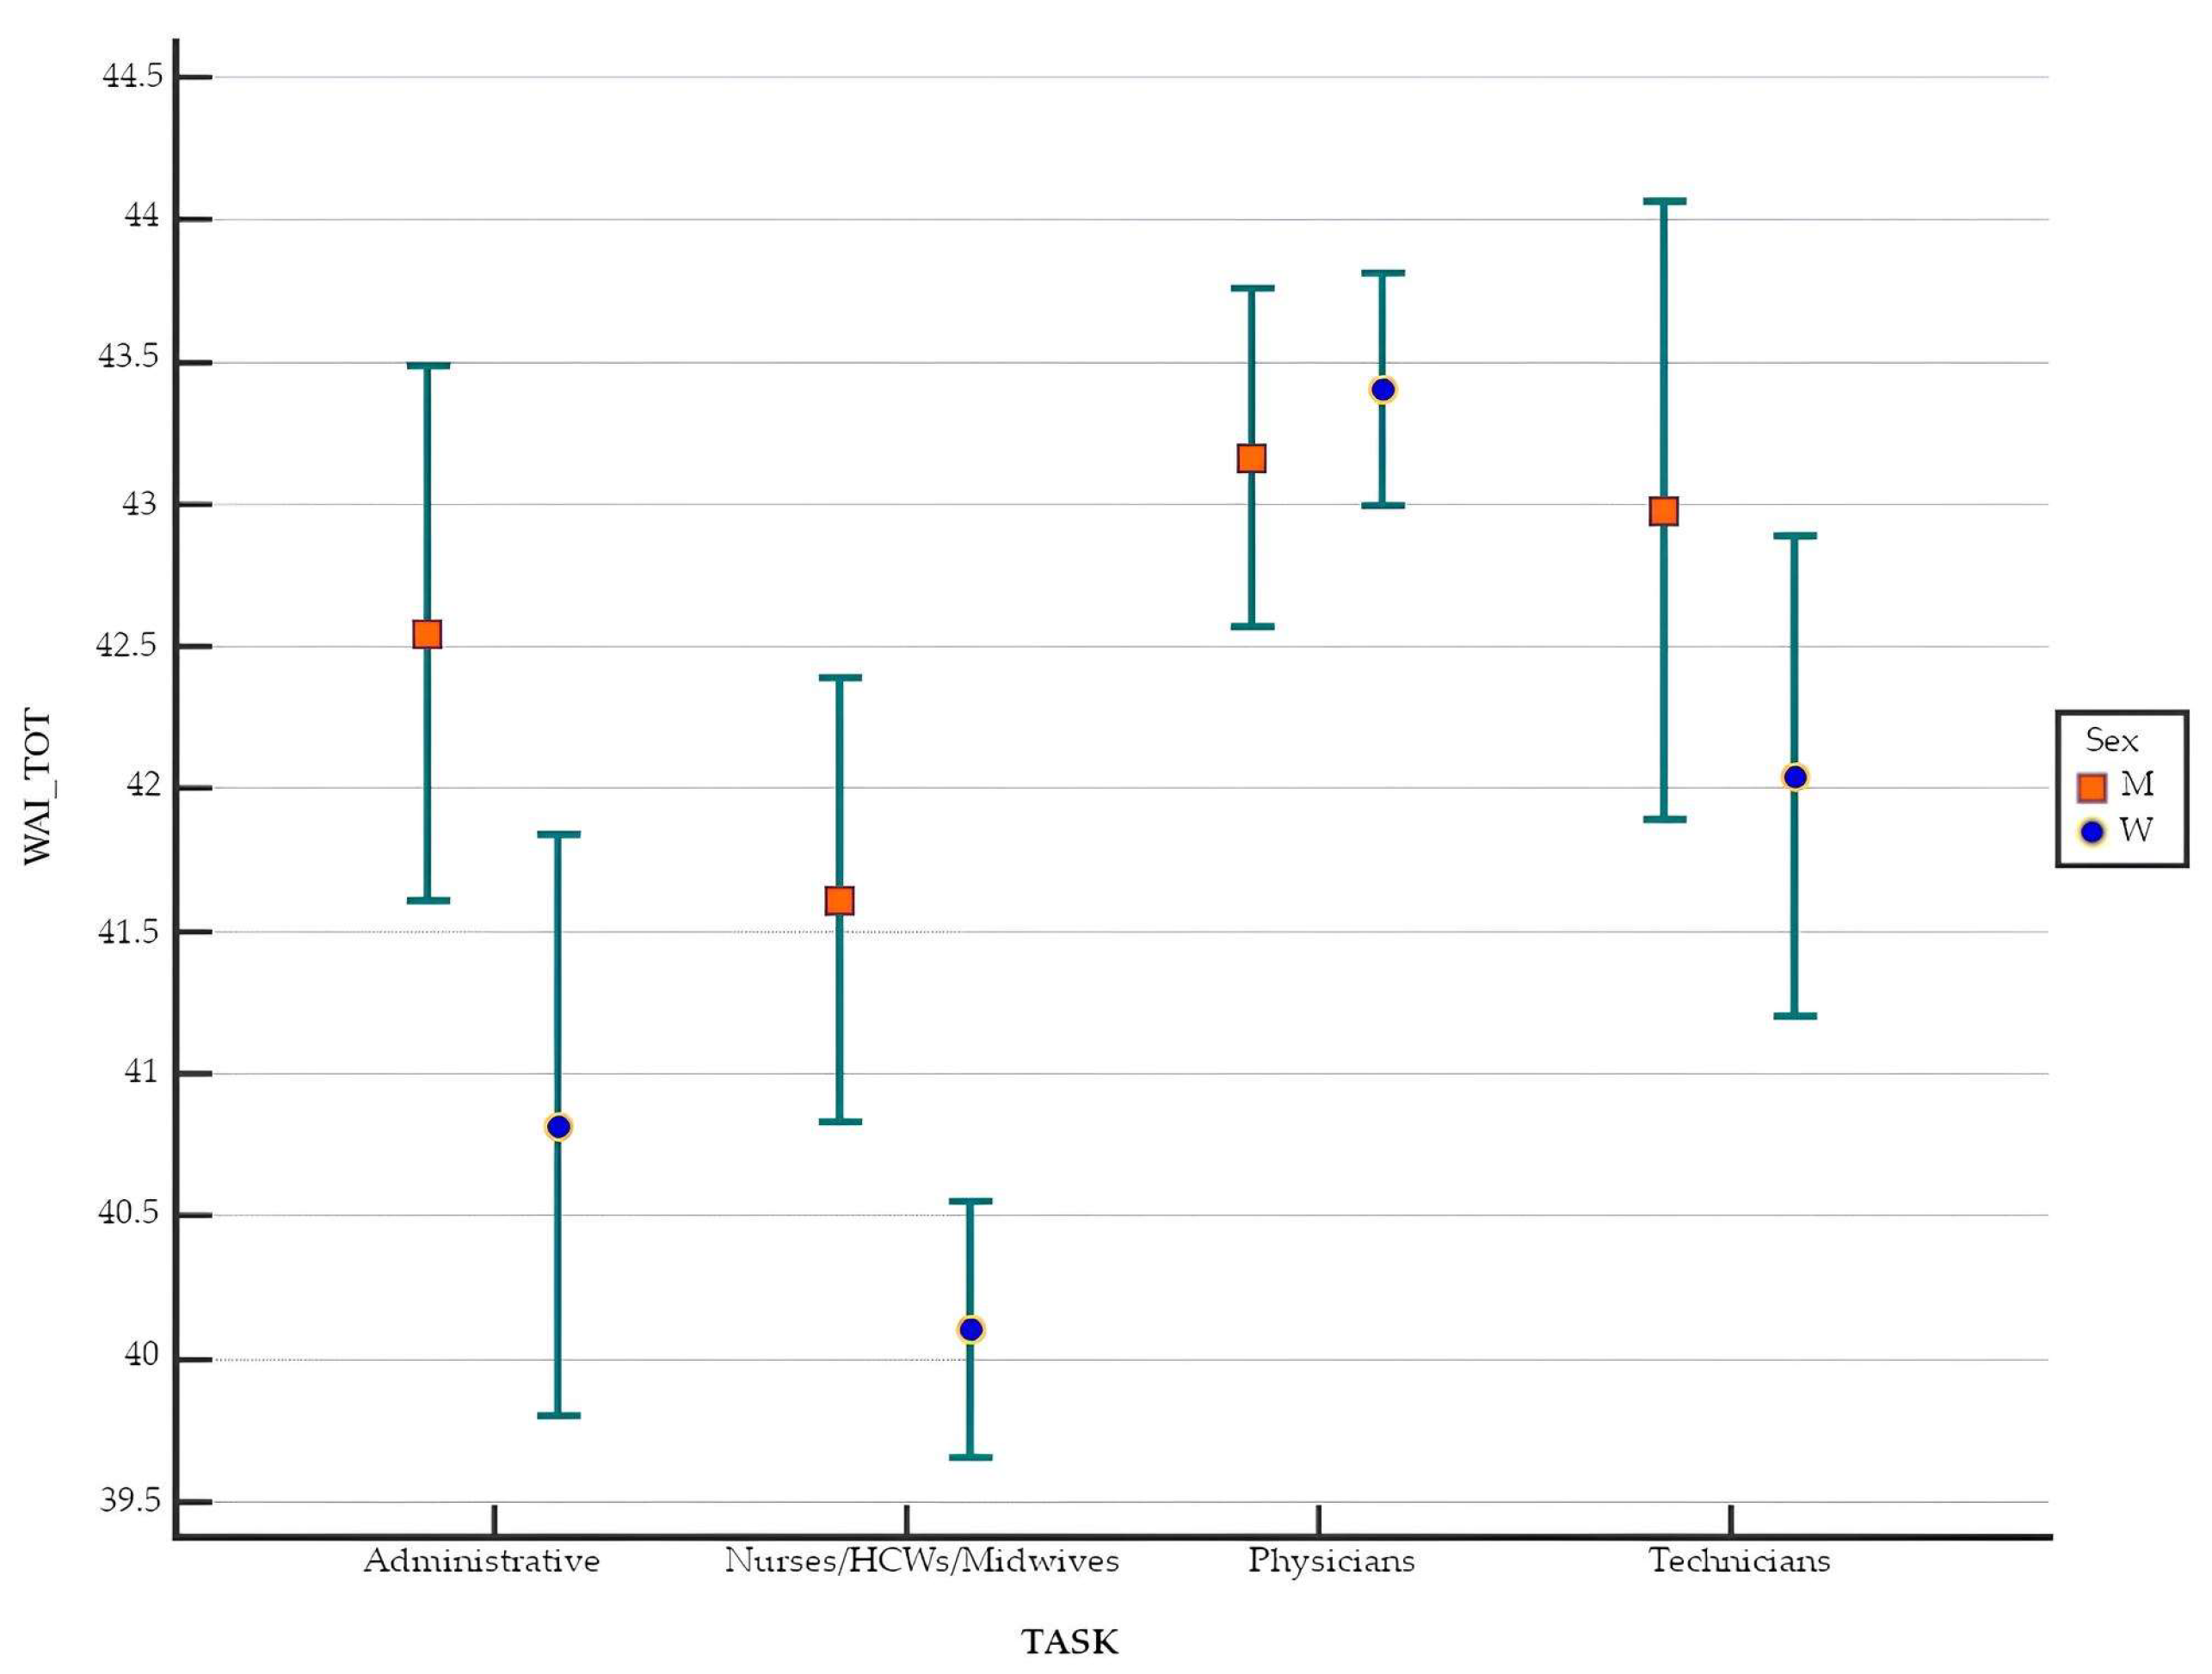
| Gender | Class of Age | |||||||||
|---|---|---|---|---|---|---|---|---|---|---|
| M | F | p | <55 Y.O. | ≥55 Y.O. | p | |||||
| Median | IQR | Median | IQR | Median | IQR | Median | IQR | |||
| WAI | 43.50 | 5.50 | 42.00 | 7.00 | <0.001 a | 43.00 | 5.50 | 40.00 | 7.50 | <0.001 a |
| W1—Current work ability compared to highest work ability ever | 8.00 | 2.00 | 8.00 | 1.00 | 0.168 a | 8.00 | 2.00 | 8.00 | 2.00 | 0.529 a |
| W2—Work ability in relation to the demands of the job | 9.00 | 2.00 | 9.00 | 2.00 | 0.002 a | 9.00 | 2.00 | 9.00 | 2.00 | 0.193 a |
| W3—Number of current diseases diagnosed by a physician | 5.00 | 4.00 | 5.00 | 5.00 | <0.001 a | 5.00 | 3.00 | 3.00 | 4.00 | <0.001 a |
| W4—Estimated work impairment due to diseases | N | % | N | % | p | N | % | N | % | p |
| In my opinion I am entirely unable to work. | 2 | 0.3% | 2 | 0.2% | 0.002 b | 1 | 0.1% | 3 | 0.6% | <0.001 b |
| Because of my condition. I feel I am able to do only part time work | 0 | 0.0% | 13 | 1.0% | 4 | 0.3% | 9 | 1.9% | ||
| I must often slow down my work pace or change my work methods. | 11 | 1.8% | 35 | 2.8% | 24 | 1.7% | 22 | 4.6% | ||
| I must sometimes slow down my work pace or change my work methods | 30 | 5.0% | 76 | 6.1% | 59 | 4.3% | 47 | 9.9% | ||
| I am able to do my job. but it causes some symptoms. | 63 | 10.6% | 194 | 15.5% | 146 | 10.6% | 111 | 23.4% | ||
| There is no hindrance | 490 | 82.2% | 928 | 74.4% | 1138 | 82.9% | 282 | 59.5% | ||
| W5—Sick leave during the past 12 months | N | % | N | % | p | N | % | N | % | p |
| 100–354 days | 7 | 1.2% | 15 | 1.2% | 0.087 b | 11 | 0.8% | 11 | 2.3% | <0.001 b |
| 25–99 days | 27 | 4.5% | 81 | 6.5% | 62 | 4.5% | 46 | 9.7% | ||
| 10–24 days | 65 | 10.9% | 154 | 12.4% | 156 | 11.4% | 63 | 13.3% | ||
| Max 9 days | 123 | 20.6% | 291 | 23.4% | 305 | 22.3% | 109 | 23.0% | ||
| None | 374 | 62.8% | 704 | 56.5% | 835 | 61.0% | 245 | 51.7% | ||
| W6—Personal prognosis of work ability 2 years from now | N | % | N | % | p | N | % | N | % | p |
| Unlikely | 16 | 2.7% | 36 | 2.9% | 0.017 b | 30 | 2.2% | 22 | 4.7% | <0.001 b |
| Not certain | 33 | 5.5% | 122 | 9.8% | 84 | 6.1% | 71 | 15.0% | ||
| Relatively certain | 548 | 91.8% | 1089 | 87.3% | 1259 | 91.7% | 380 | 80.3% | ||
| W7—Mental capacities | Median | IQR | Median | IQR | p | Median | IQR | Median | IQR | p |
| Mental capacities | 4.00 | 1.00 | 4.00 | 1.00 | <0.001 a | 4.00 | 1.00 | 4.00 | 1.00 | 0.002 a |
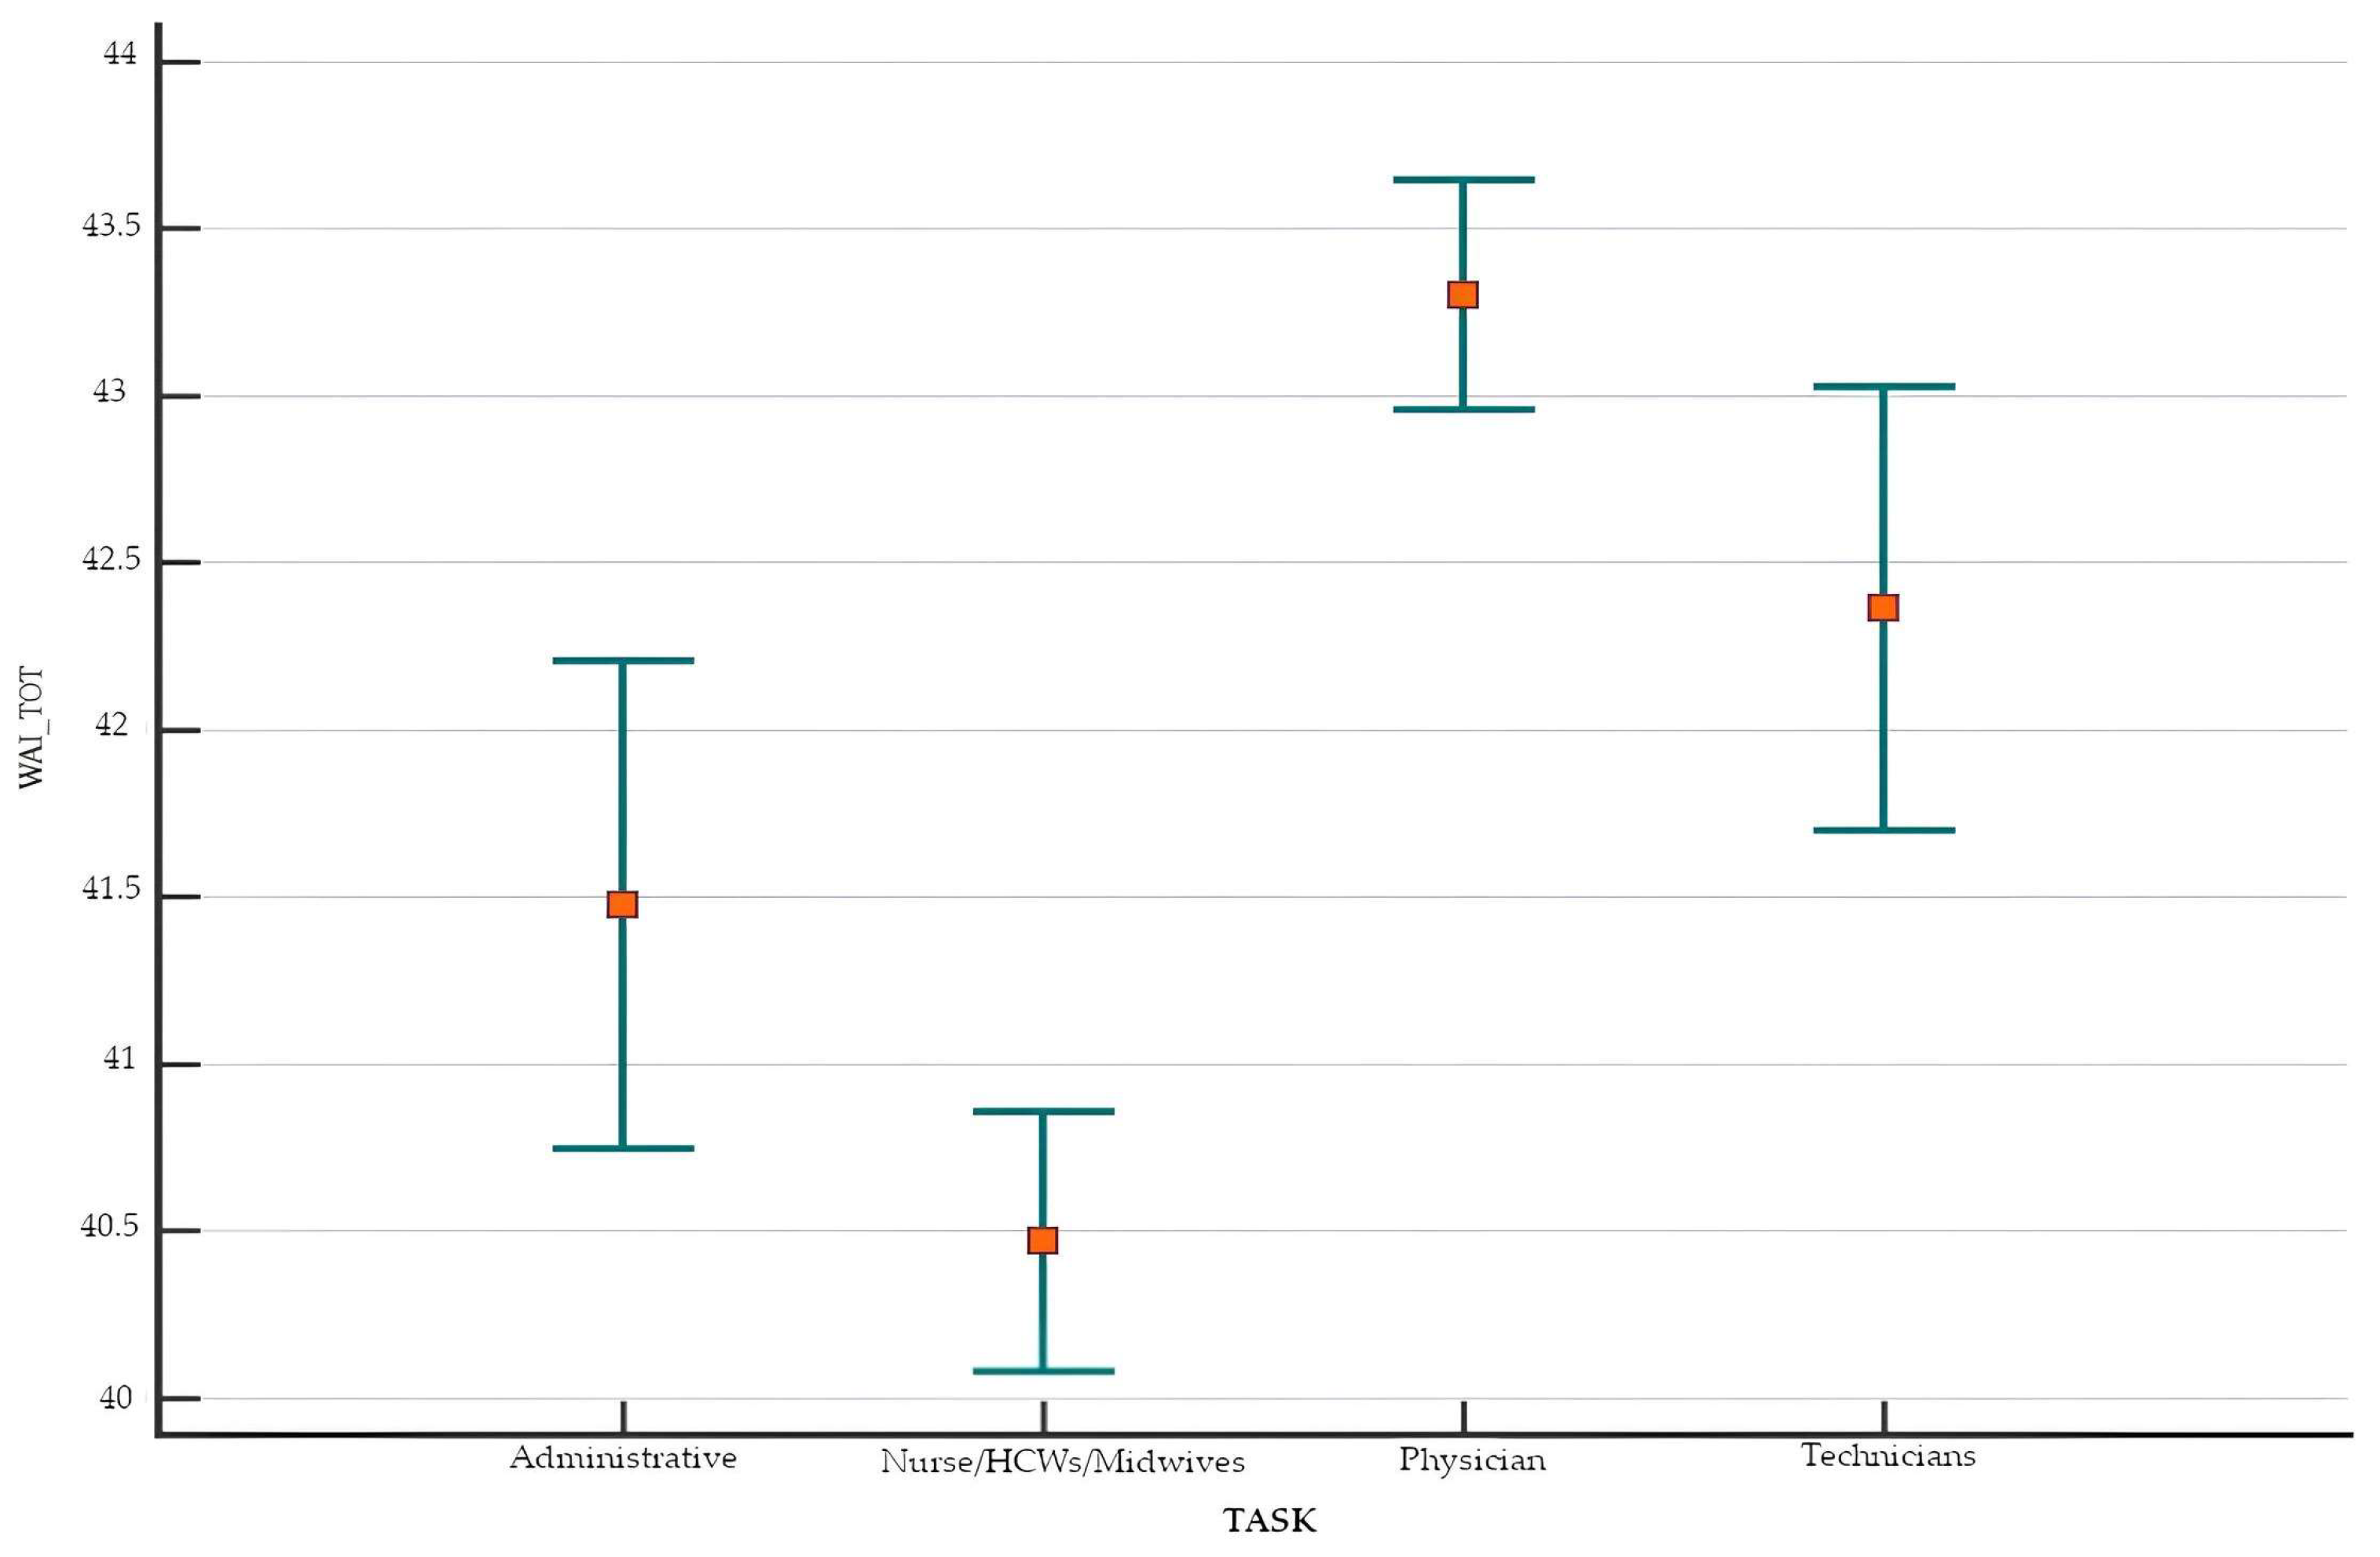
| Profession 1: | Profession 2: | Profession 3: | Profession 4: | p | |||||
|---|---|---|---|---|---|---|---|---|---|
| Administrative | Nurses/HCWs/ Midwives | Physicians | Technicians | ||||||
| Median | IQR | Median | IQR | Median | IQR | Median | IQR | ||
| WAI | 42.50 | 6.00 | 42.00 | 6.75 | 44.00 | 5.00 | 44.00 | 6.00 | <0.001 a |
| W1—Current work ability compared to highest work ability ever | 9.00 | 2.00 | 8.00 | 2.00 | 8.00 | 3.00 | 9.00 | 2.00 | <0.001 a |
| W2—Work ability in relation to the demands of the job | 9.50 | 2.00 | 9.00 | 2.00 | 9.00 | 2.00 | 9.00 | 2.00 | <0.001 a |
| W3—Number of current diseases diagnosed by a physician | 4.00 | 3.00 | 4.00 | 5.00 | 5.00 | 3.00 | 5.00 | 4.00 | <0.001 a |
| W4—Estimated work impairment due to diseases | N | % | N | % | N | % | N | % | p |
| In my opinion I am entirely unable to work. | 0 | 0.0% | 2 | 0.2% | 0 | 0.0% | 2 | 0.9% | <0.001 b |
| Because of my condition. I feel I am able to do only part time work | 1 | 0.5% | 11 | 1.2% | 0 | 0.0% | 1 | 0.5% | |
| I must often slow down my work pace or change my work methods. | 6 | 2.9% | 34 | 3.9% | 2 | 0.4% | 4 | 1.9% | |
| I must sometimes slow down my work pace or change my work methods | 14 | 6.8% | 70 | 7.9% | 12 | 2.2% | 10 | 4.7% | |
| I am able to do my job. but it causes some symptoms. | 32 | 15.5% | 153 | 17.4% | 50 | 9.2% | 22 | 10.3% | |
| There is no hindrance | 154 | 74.4% | 611 | 69.4% | 480 | 88.2% | 175 | 81.8% | |
| W5—Sick leave during the past 12 months | N | % | N | % | N | % | N | % | p |
| 100–354 days | 4 | 1.9% | 13 | 1.5% | 1 | 0.2% | 4 | 1.9% | <0.001 b |
| 25–99 days | 18 | 8.7% | 59 | 6.7% | 16 | 2.9% | 15 | 7.1% | |
| 10–24 days | 21 | 10.1% | 134 | 15.2% | 42 | 7.7% | 22 | 10.4% | |
| Max 9 days | 44 | 21.3% | 238 | 27.0% | 85 | 15.6% | 47 | 22.2% | |
| None | 120 | 58.0% | 436 | 49.5% | 400 | 73.5% | 124 | 58.5% | |
| W6—Personal prognosis of work ability 2 years from now | N | % | N | % | N | % | N | % | p |
| Unlikely | 5 | 2.4% | 37 | 4.2% | 7 | 1.3% | 3 | 1.4% | <0.001 b |
| Not certain | 11 | 5.3% | 110 | 12.5% | 20 | 3.7% | 15 | 7.0% | |
| Relatively certain | 190 | 92.2% | 735 | 83.3% | 517 | 95.0% | 196 | 91.6% | |
| W7—Mental capacities | Median | IQR | Median | IQR | Median | IQR | Median | IQR | p |
| Mental capacities | 4.00 | 1.00 | 4.00 | 1.00 | 4.00 | 1.00 | 4.00 | 1.00 | 0.001 a |
Disclaimer/Publisher’s Note: The statements, opinions and data contained in all publications are solely those of the individual author(s) and contributor(s) and not of MDPI and/or the editor(s). MDPI and/or the editor(s) disclaim responsibility for any injury to people or property resulting from any ideas, methods, instructions or products referred to in the content. |
© 2025 by the authors. Licensee MDPI, Basel, Switzerland. This article is an open access article distributed under the terms and conditions of the Creative Commons Attribution (CC BY) license (https://creativecommons.org/licenses/by/4.0/).
Share and Cite
Paneni, V.; Gambelunghe, C.; Tomassini, L.; Buresti, G.; Rondinone, B.M.; Persechino, B.; Fruttini, D.; dell’Omo, M.; Pucci, C.; Gambelunghe, A. Correlations Between Gender, Age, and Occupational Factors on the Work Ability Index Among Healthcare Professionals. Healthcare 2025, 13, 702. https://doi.org/10.3390/healthcare13070702
Paneni V, Gambelunghe C, Tomassini L, Buresti G, Rondinone BM, Persechino B, Fruttini D, dell’Omo M, Pucci C, Gambelunghe A. Correlations Between Gender, Age, and Occupational Factors on the Work Ability Index Among Healthcare Professionals. Healthcare. 2025; 13(7):702. https://doi.org/10.3390/healthcare13070702
Chicago/Turabian StylePaneni, Valerio, Cristiana Gambelunghe, Luca Tomassini, Giuliana Buresti, Bruna Maria Rondinone, Benedetta Persechino, Daniela Fruttini, Marco dell’Omo, Chiara Pucci, and Angela Gambelunghe. 2025. "Correlations Between Gender, Age, and Occupational Factors on the Work Ability Index Among Healthcare Professionals" Healthcare 13, no. 7: 702. https://doi.org/10.3390/healthcare13070702
APA StylePaneni, V., Gambelunghe, C., Tomassini, L., Buresti, G., Rondinone, B. M., Persechino, B., Fruttini, D., dell’Omo, M., Pucci, C., & Gambelunghe, A. (2025). Correlations Between Gender, Age, and Occupational Factors on the Work Ability Index Among Healthcare Professionals. Healthcare, 13(7), 702. https://doi.org/10.3390/healthcare13070702