
New Drug Expenditure by Therapeutic Area in South Korea: International Comparison and Policy Implications


Abstract
1. Introduction
2. Methods
2.1. Study Design and Objectives
2.2. Data Sources
- IQVIA MIDAS Global Database: Offers detailed information on pharmaceutical sales, including expenditures and volumes, for South Korea and comparator countries [9]. Access to this database was granted through a third-party access (TPA) agreement with the Korea Research-based Pharmaceutical Industry Association (KRPIA). This facilitated data collection on pharmaceutical expenditures within public reimbursement schemes across OECD and A8 countries. To ensure data reliability, the IQVIA MIDAS dataset was cross-validated against domestic sources. This verification process involved checking the consistency of analyzed NCE lists, the study period, and therapeutic group classifications (ATC Class I–III). The comparison of MIDAS-derived expenditures with South Korea’s National Health Insurance statistics demonstrated concordance rates of 96.8% for total pharmaceutical expenditures and 94.8% for NCE-specific expenditures, supporting the validity of cross-country comparisons.
- WHO Global Burden of Disease (GBD) data: Provides metrics on DALYs and mortality rates, categorized by disease groups and geographies, to facilitate the assessment of healthcare needs across various conditions [10].
- South Korean national health insurance data: Contains extensive records of reimbursed pharmaceutical expenditures and ATC classification codes, accessed via the Health Insurance Review and Assessment Service (HIRA) and the National Health Insurance Service (NHIS) [11].
- ○
- Total Pharmaceutical Expenditures: Data were sourced from publicly accessible platforms, including the “Annual Reports on Drug Expenditure Claims” by HIRA and statistical overviews provided by the Korean Statistical Information Service (KOSIS). These datasets underwent cross-validation with IQVIA MIDAS data to confirm their accuracy, achieving a concordance rate exceeding 95% between domestic and international datasets [12].
- ○
- New Chemical Entities (NCEs): The compilation of reimbursed NCEs was obtained from the Ministry of Food and Drug Safety (MFDS) approval logs and the Ministry of Health and Welfare (MoHW) reimbursement notifications [13]. Expenditure data on NCEs were initially acquired through collaboration with the Korea Research-based Pharmaceutical Industry Association (KRPIA) and subsequently validated against data from the IQVIA MIDAS database, ensuring reliability and accuracy.
- ○
- Public Data References: The annual reports on drug expenditure claims from the Health Insurance Review and Assessment Service (HIRA) [14], the statistical yearbook from the National Health Insurance Service (NHIS) [15], the National Statistics Database from the Korean Statistical Information Service (KOSIS) [16], the approval records for pharmaceuticals from the Ministry of Food and Drug Safety (MFDS) [17], and the reimbursement notifications from the Ministry of Health and Welfare (MoHW) [18].
2.3. Study Scope
- Geographic Scope: South Korea, 25 OECD countries (excluding South Korea), and 8 high-income A8 countries, including Canada, France, Germany, Italy, Japan, Switzerland, the United Kingdom, and the United States.
- Analysis Period: The analysis covered data from 2007 to 2022, specifically focusing on the latest six years (2017–2022) to highlight contemporary trends and patterns.
- Study Population: The study population comprised all NCEs introduced into public reimbursement schemes during the analysis period, identified based on ATC classifications and regulatory approvals of novel active substances.
2.4. Analytical Framework
- Therapeutic Categorization: NCEs were categorized according to the WHO ATC system, facilitating consistent comparisons across various countries and therapeutic domains [20].
- Key Metrics: Pharmaceutical expenditures were analyzed as a proportion of total healthcare spending and assessed with disease burden metrics such as DALYs and mortality rates [21]. To ensure consistency, all expenditure values were reported in USD (equal to KRW 1352, based on the exchange rate in the first half of 2024).
- Comparative Analysis: To provide a comprehensive analysis, two complementary approaches were applied: (1) Descriptive statistics were used to illustrate overall expenditure trends in total pharmaceutical spending [11] and NCE expenditures, and (2) Statistical hypothesis testing was performed to assess the significance of observed differences in NCE expenditure distributions across comparator groups.
2.5. Statistical Methods
- Welch’s t-test: To evaluate the statistical significance of differences in NCE expenditure proportions between South Korea and the OECD average.
- Welch’s ANOVA: To analyze variations in NCE expenditure across reimbursement categories, subject to data availability constraints.
3. Result
3.1. Overview of Analyzed Pharmaceuticals
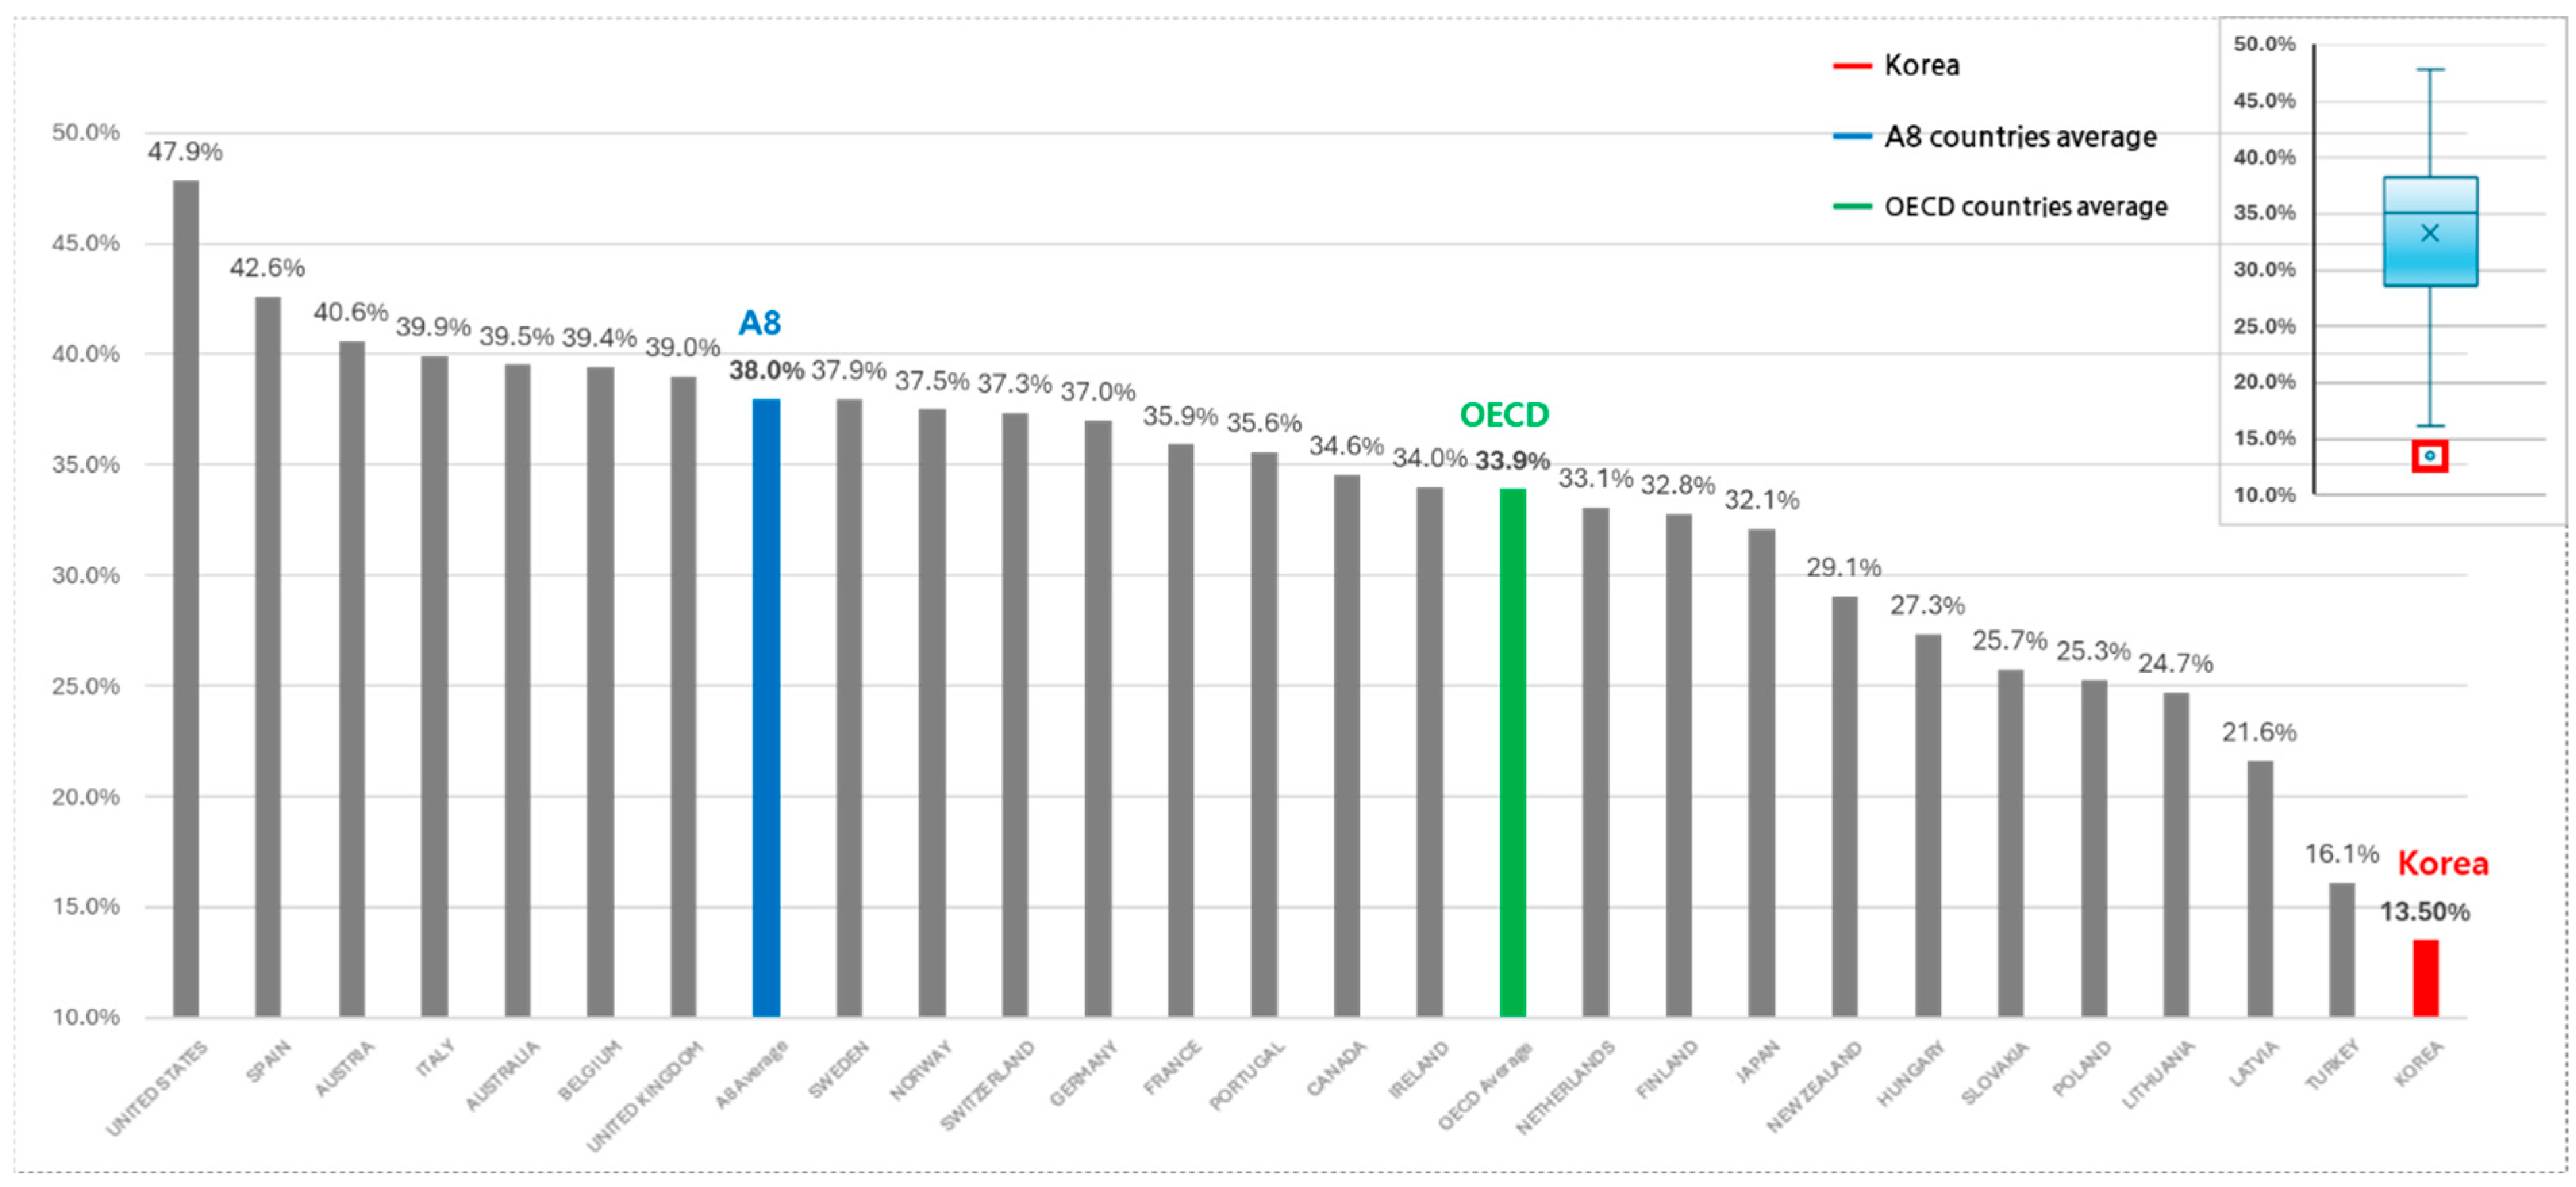
3.2. Total Pharmaceutical Expenditures and NCE Spending
3.3. WHO Burden of Disease (GBD) Analysis
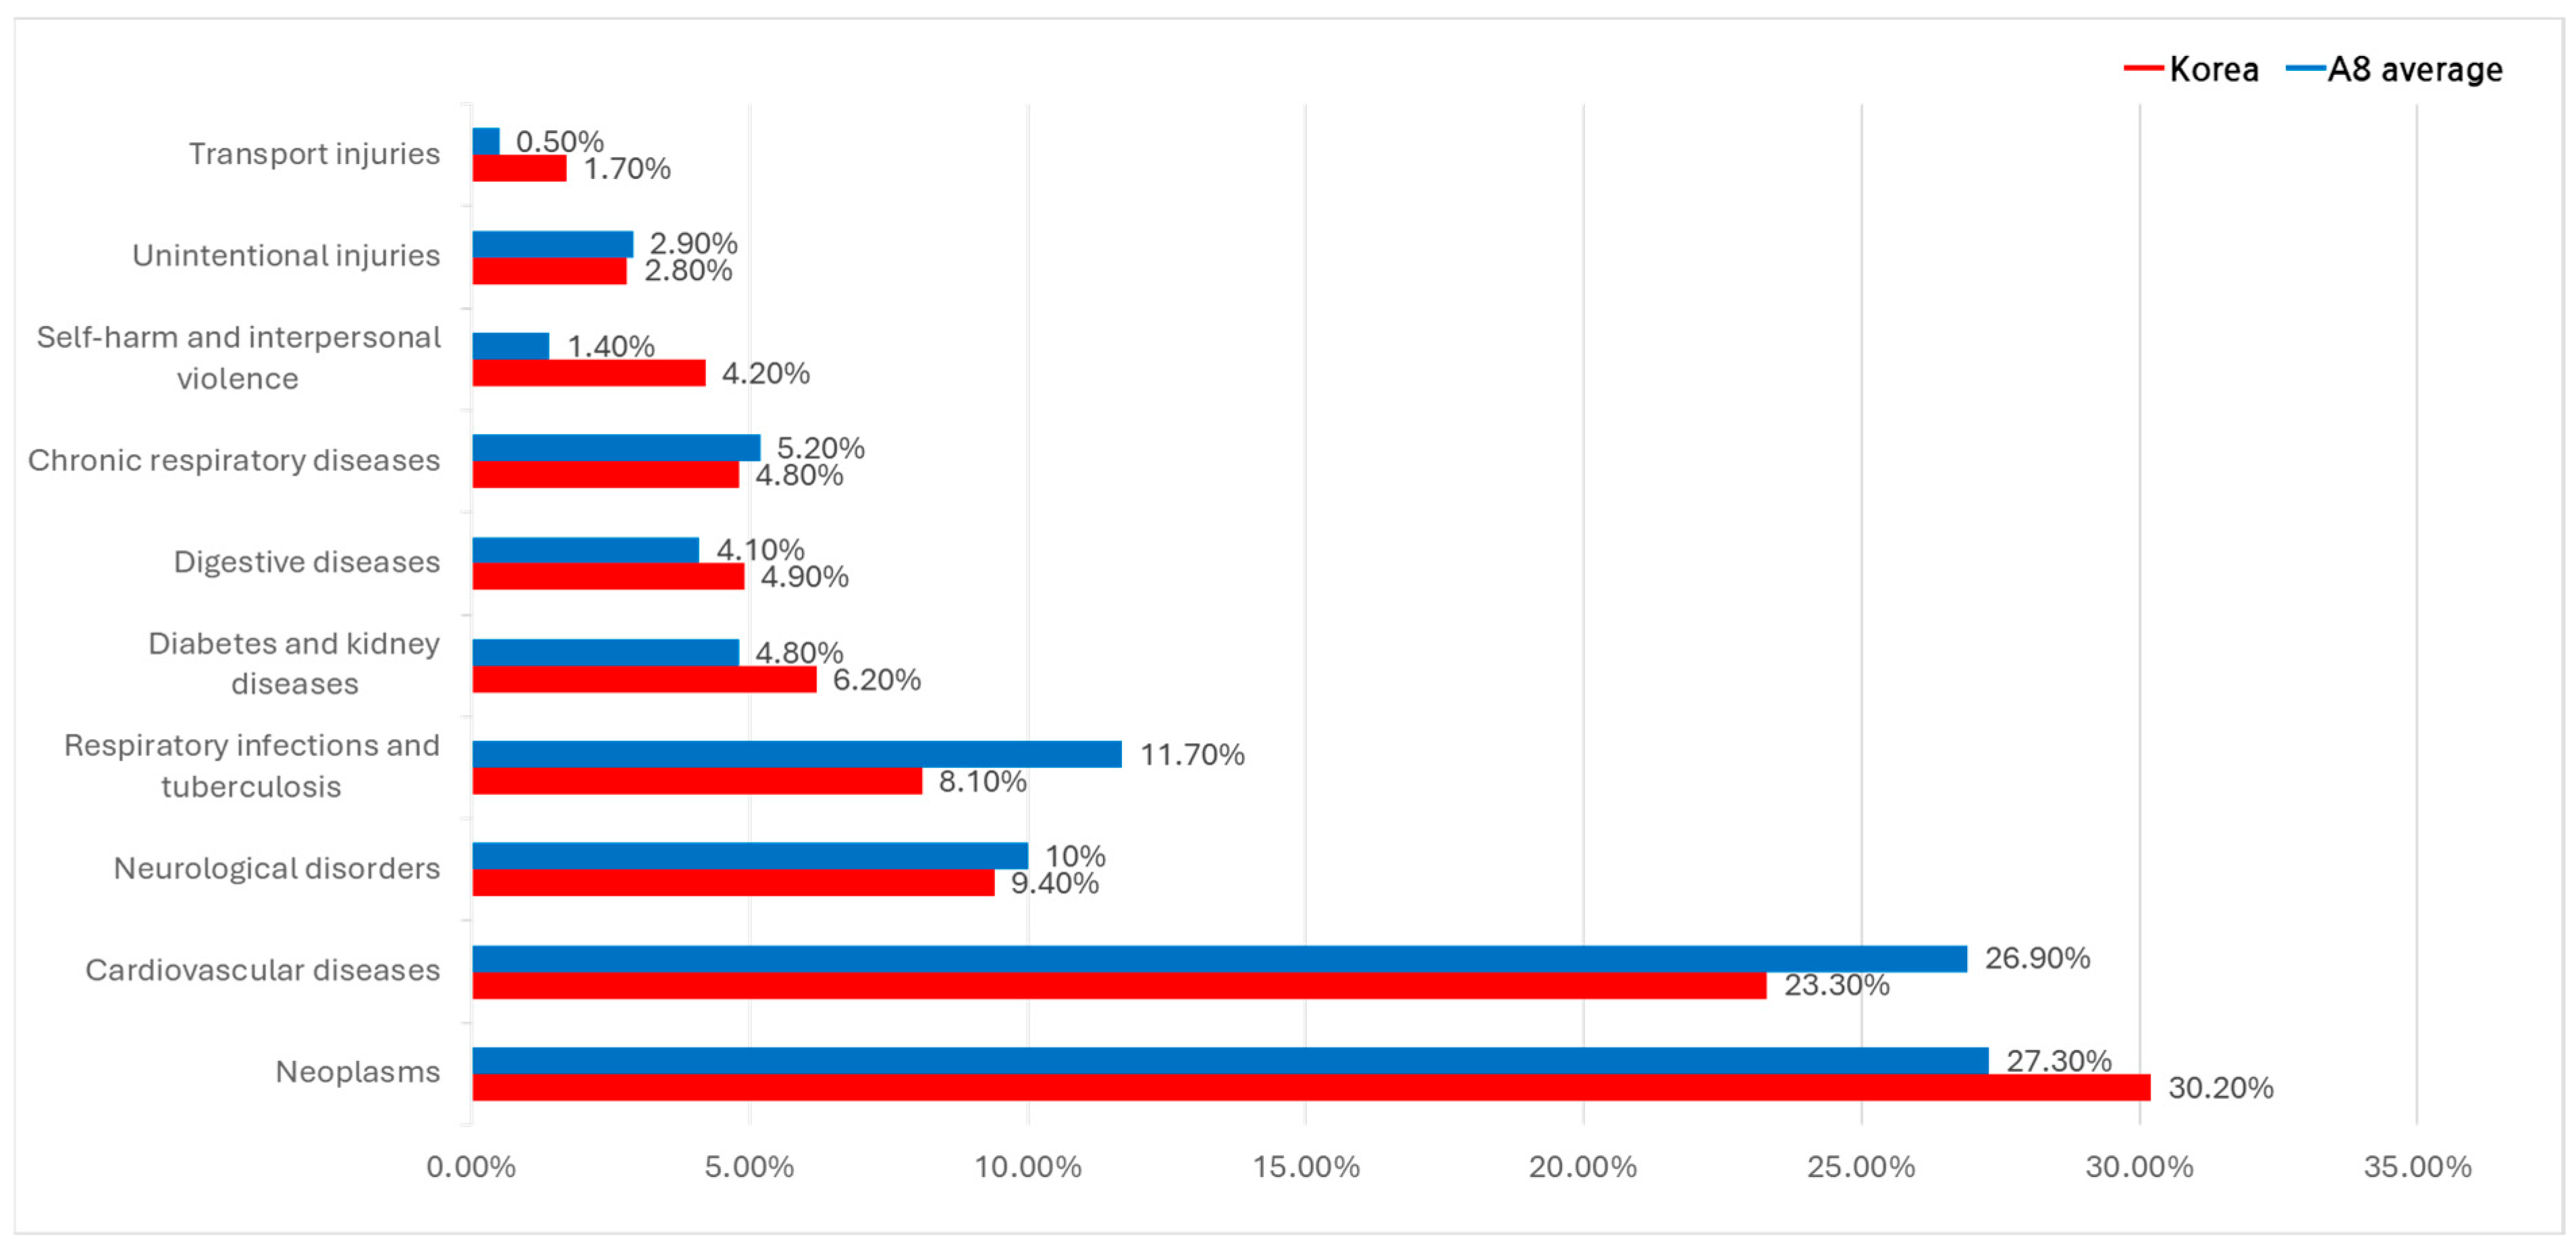
3.3.1. Major Causes of Death (Deaths Variable)
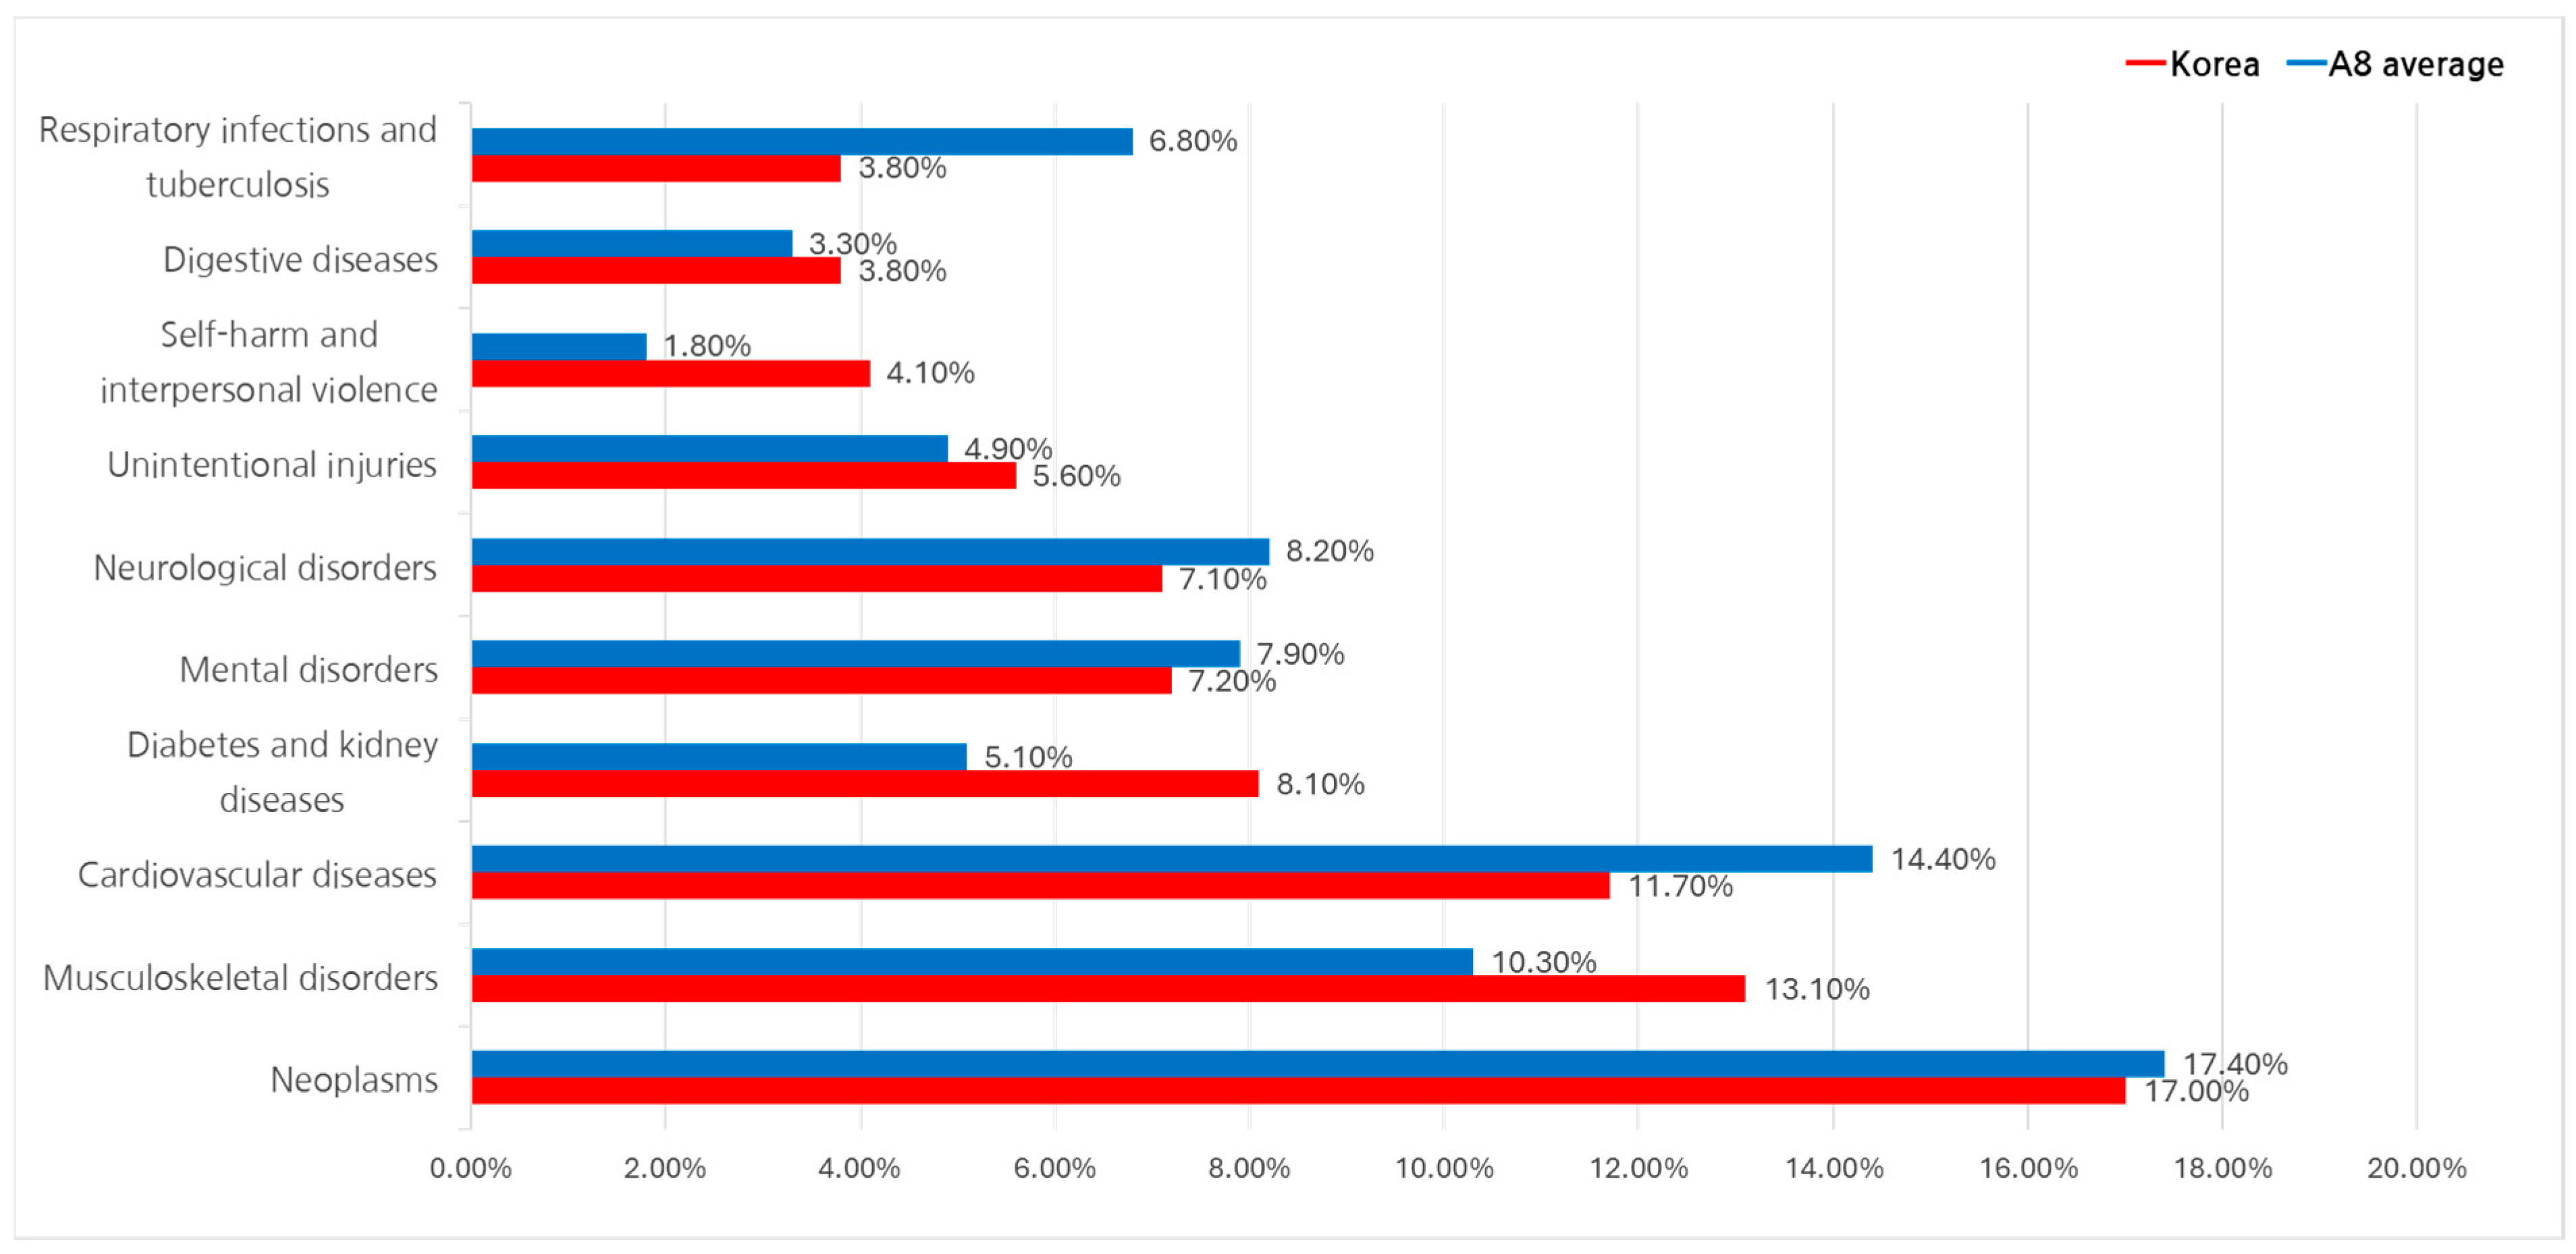
3.3.2. Disability-Adjusted Life Year (DALY) Analysis
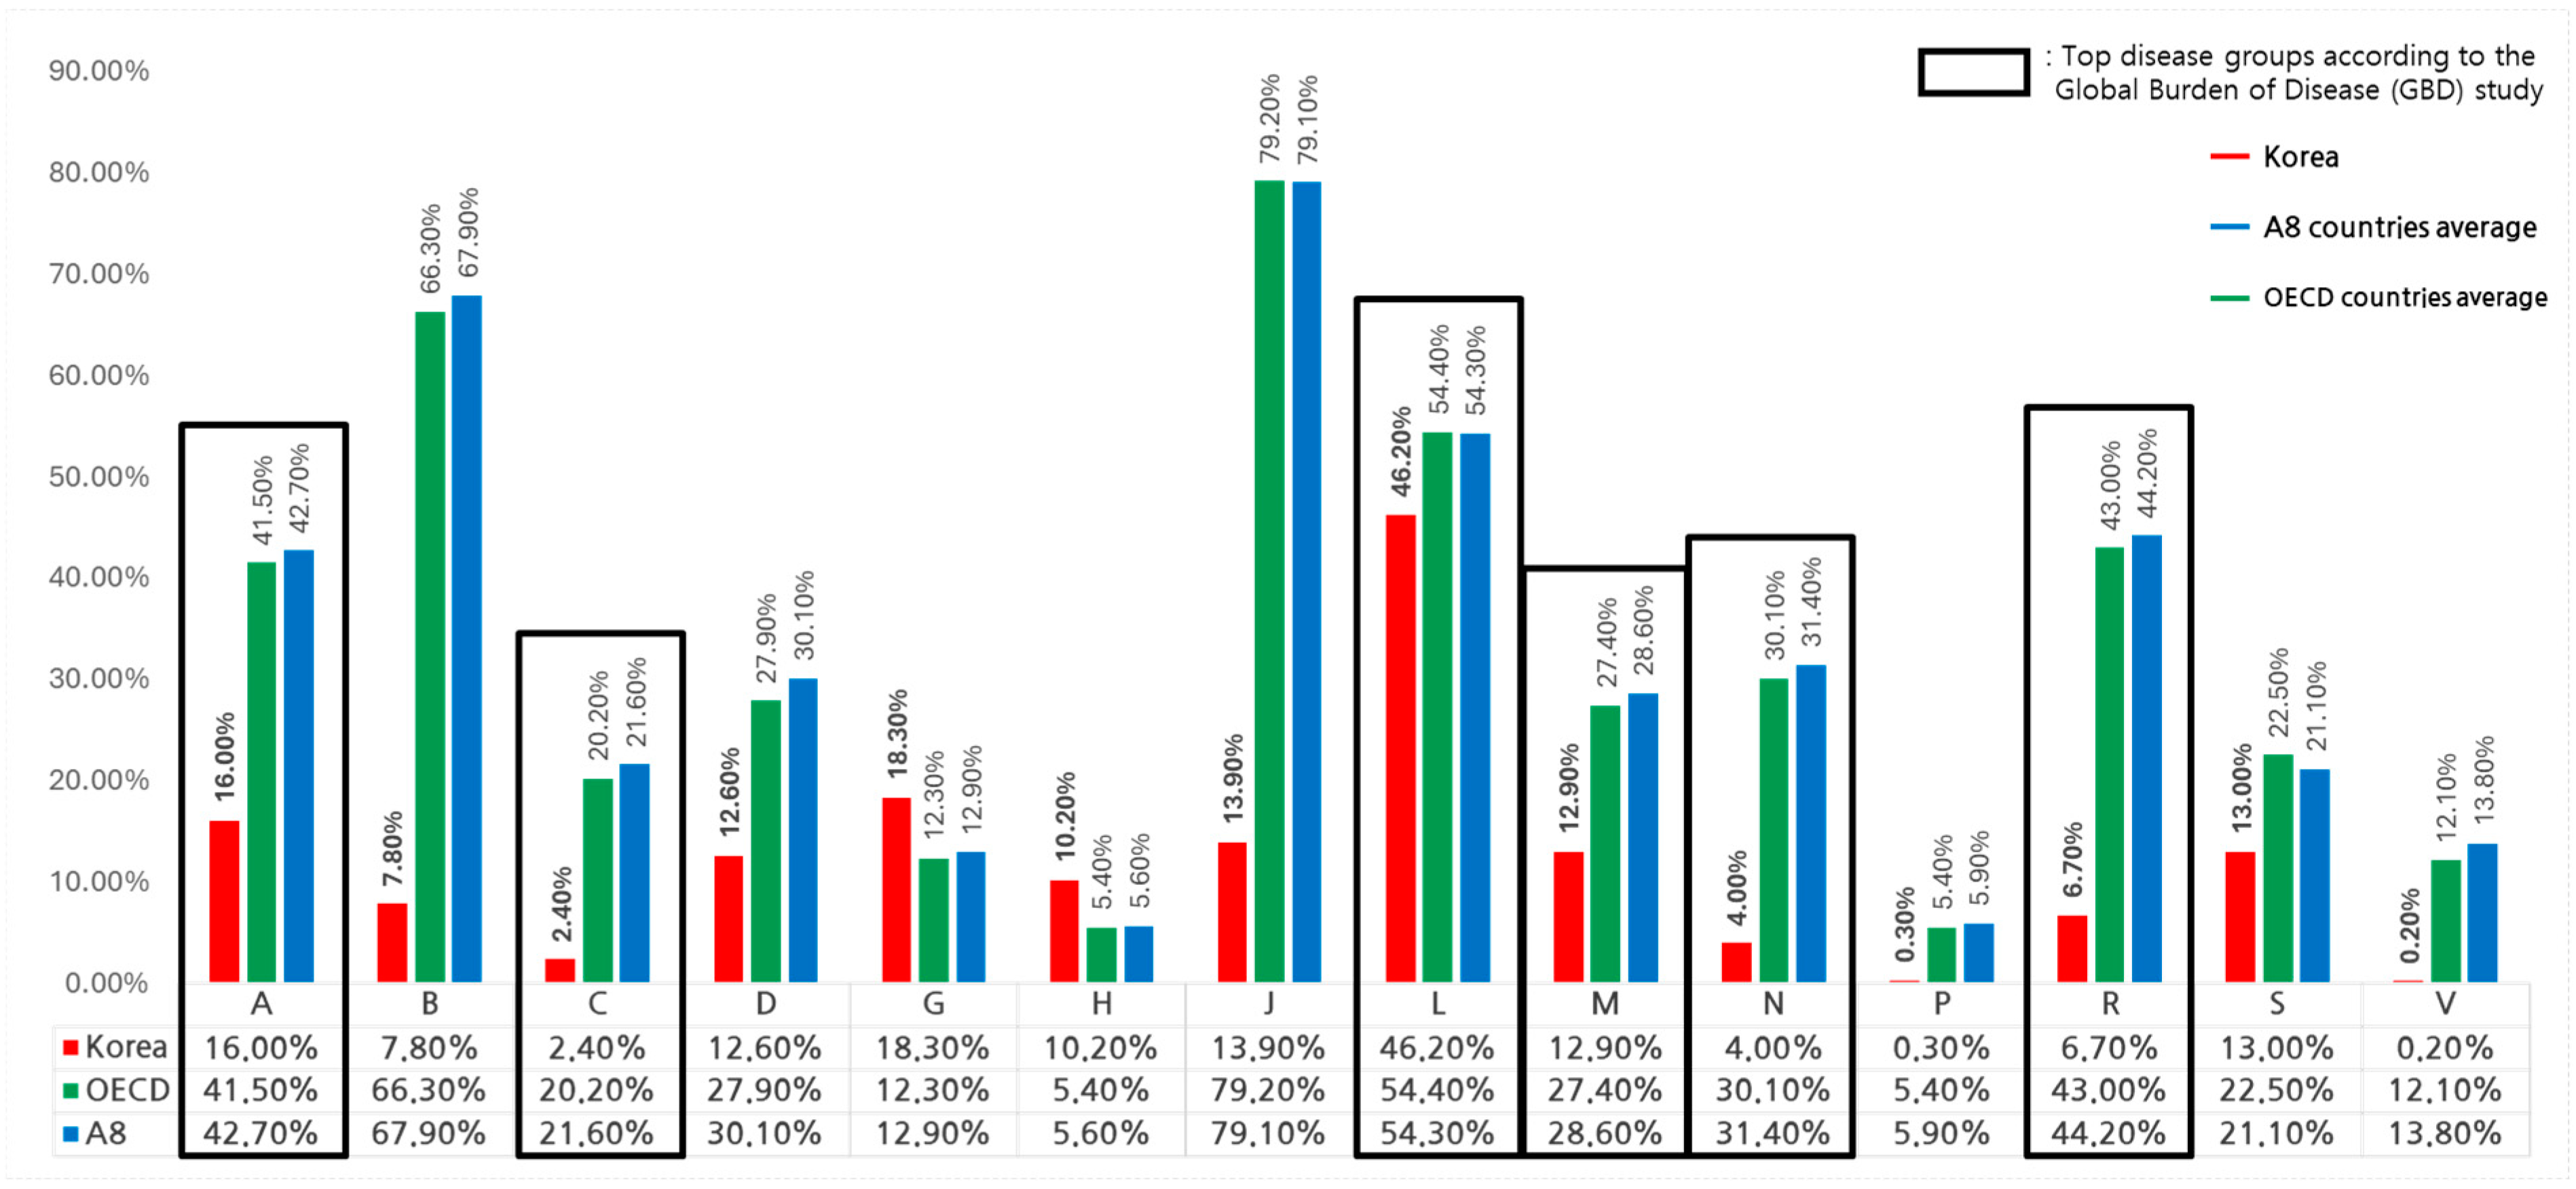
3.4. Therapeutic Area-Specific NCE Expenditures
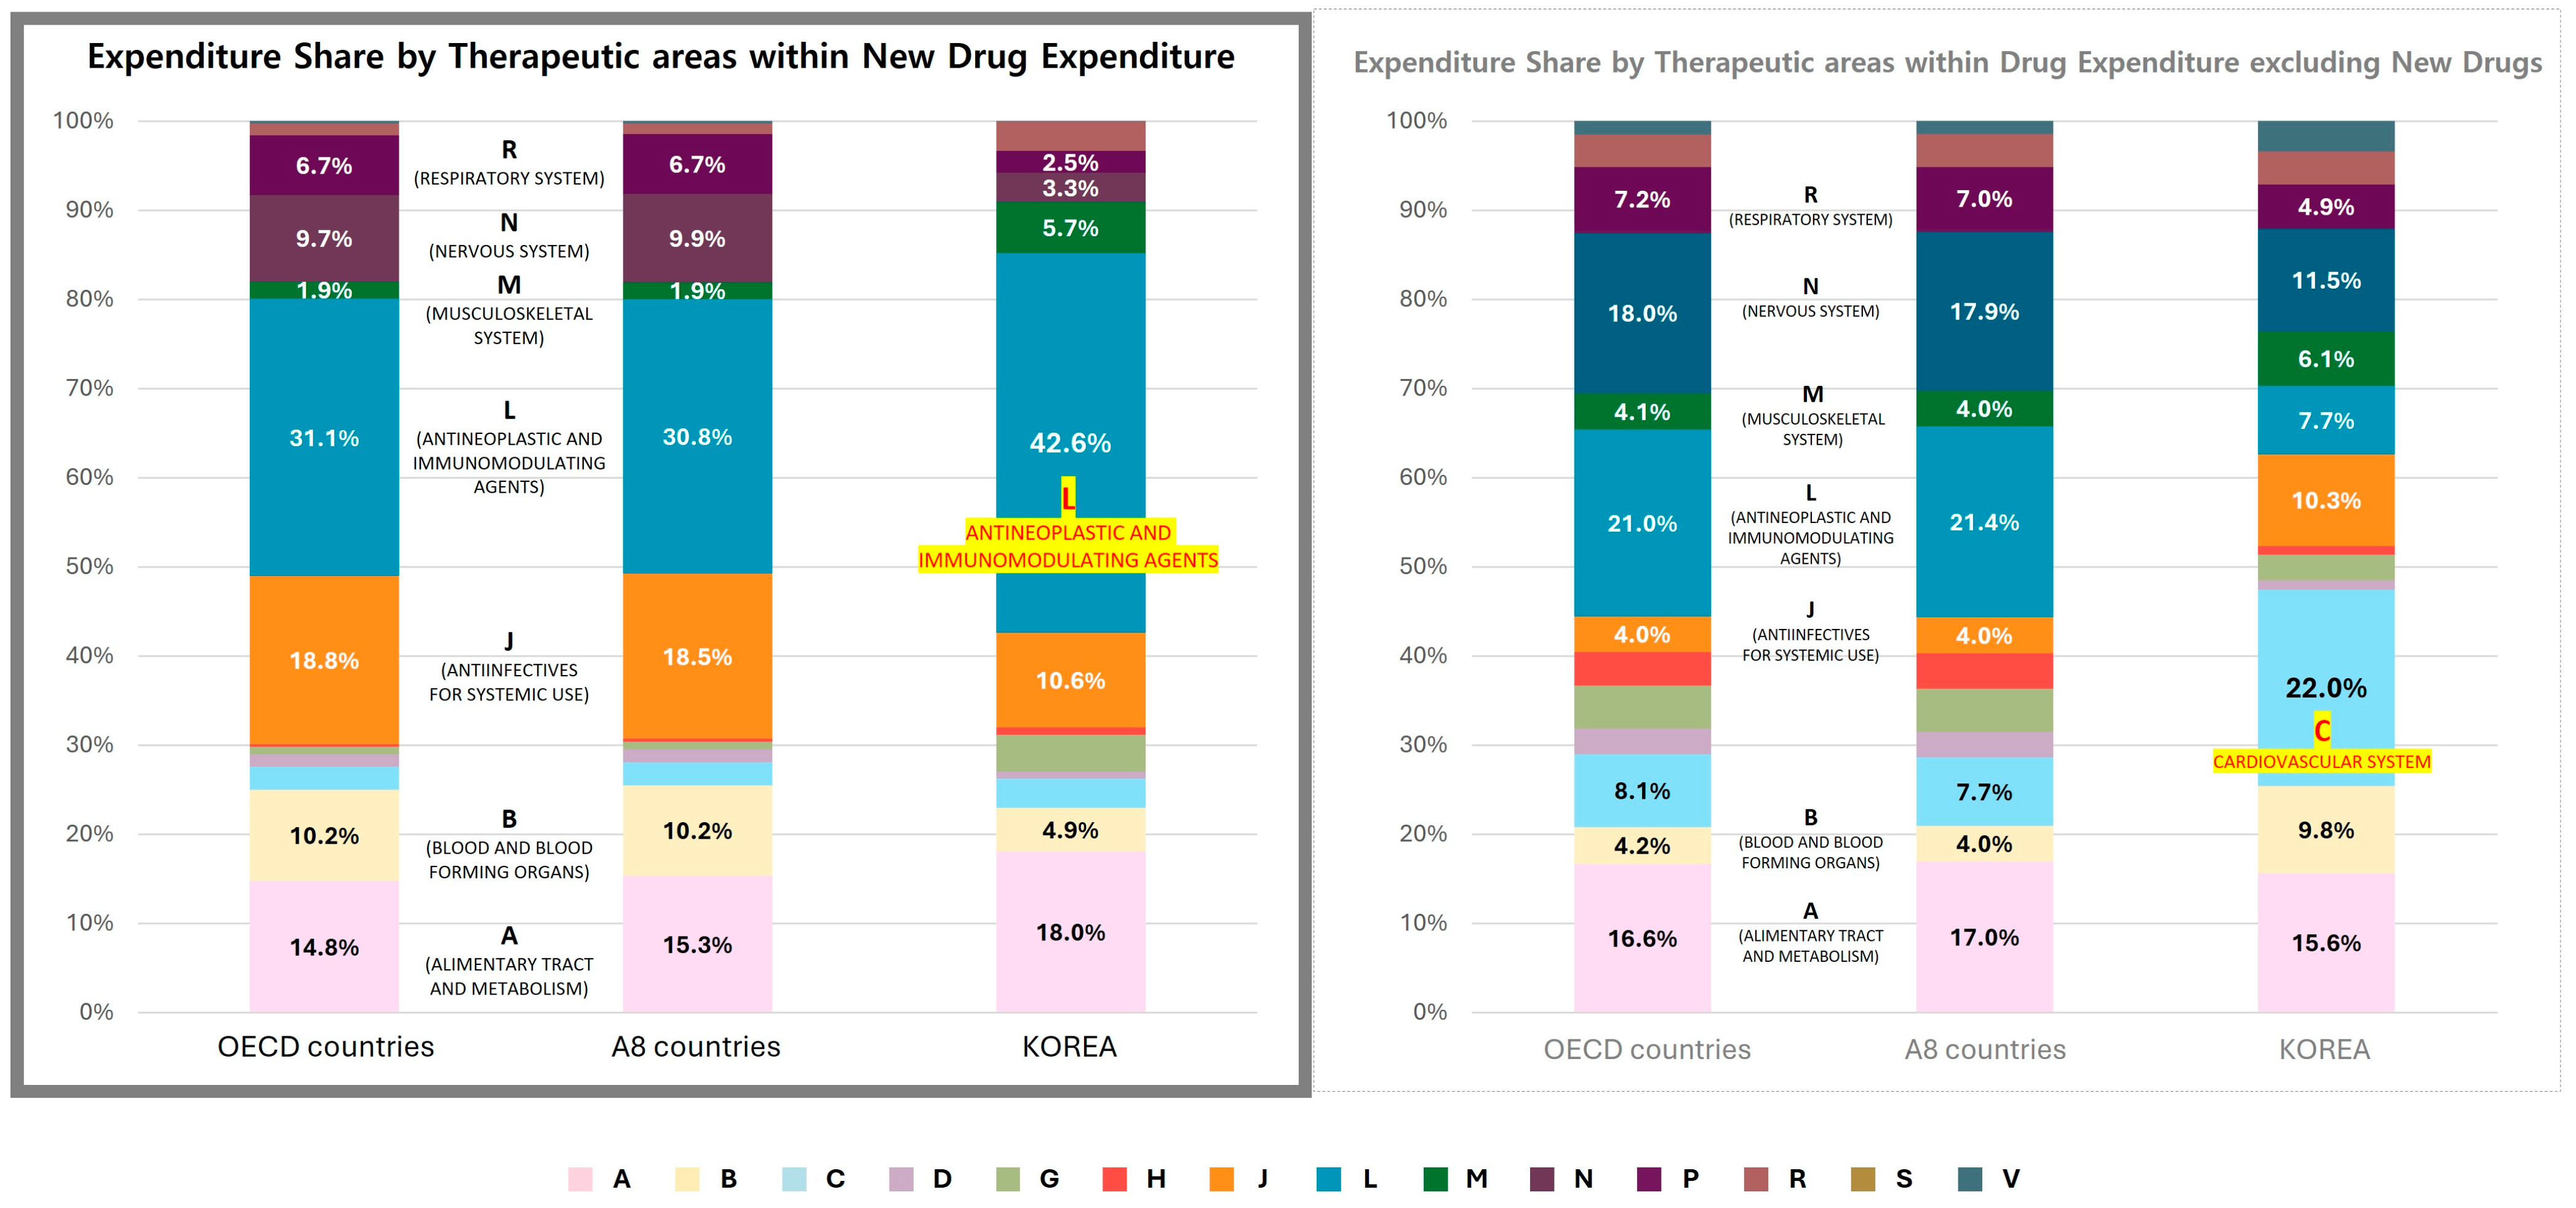
3.4.1. Comparative Analysis of NCE and Non-NCE Expenditures by Therapeutic Area
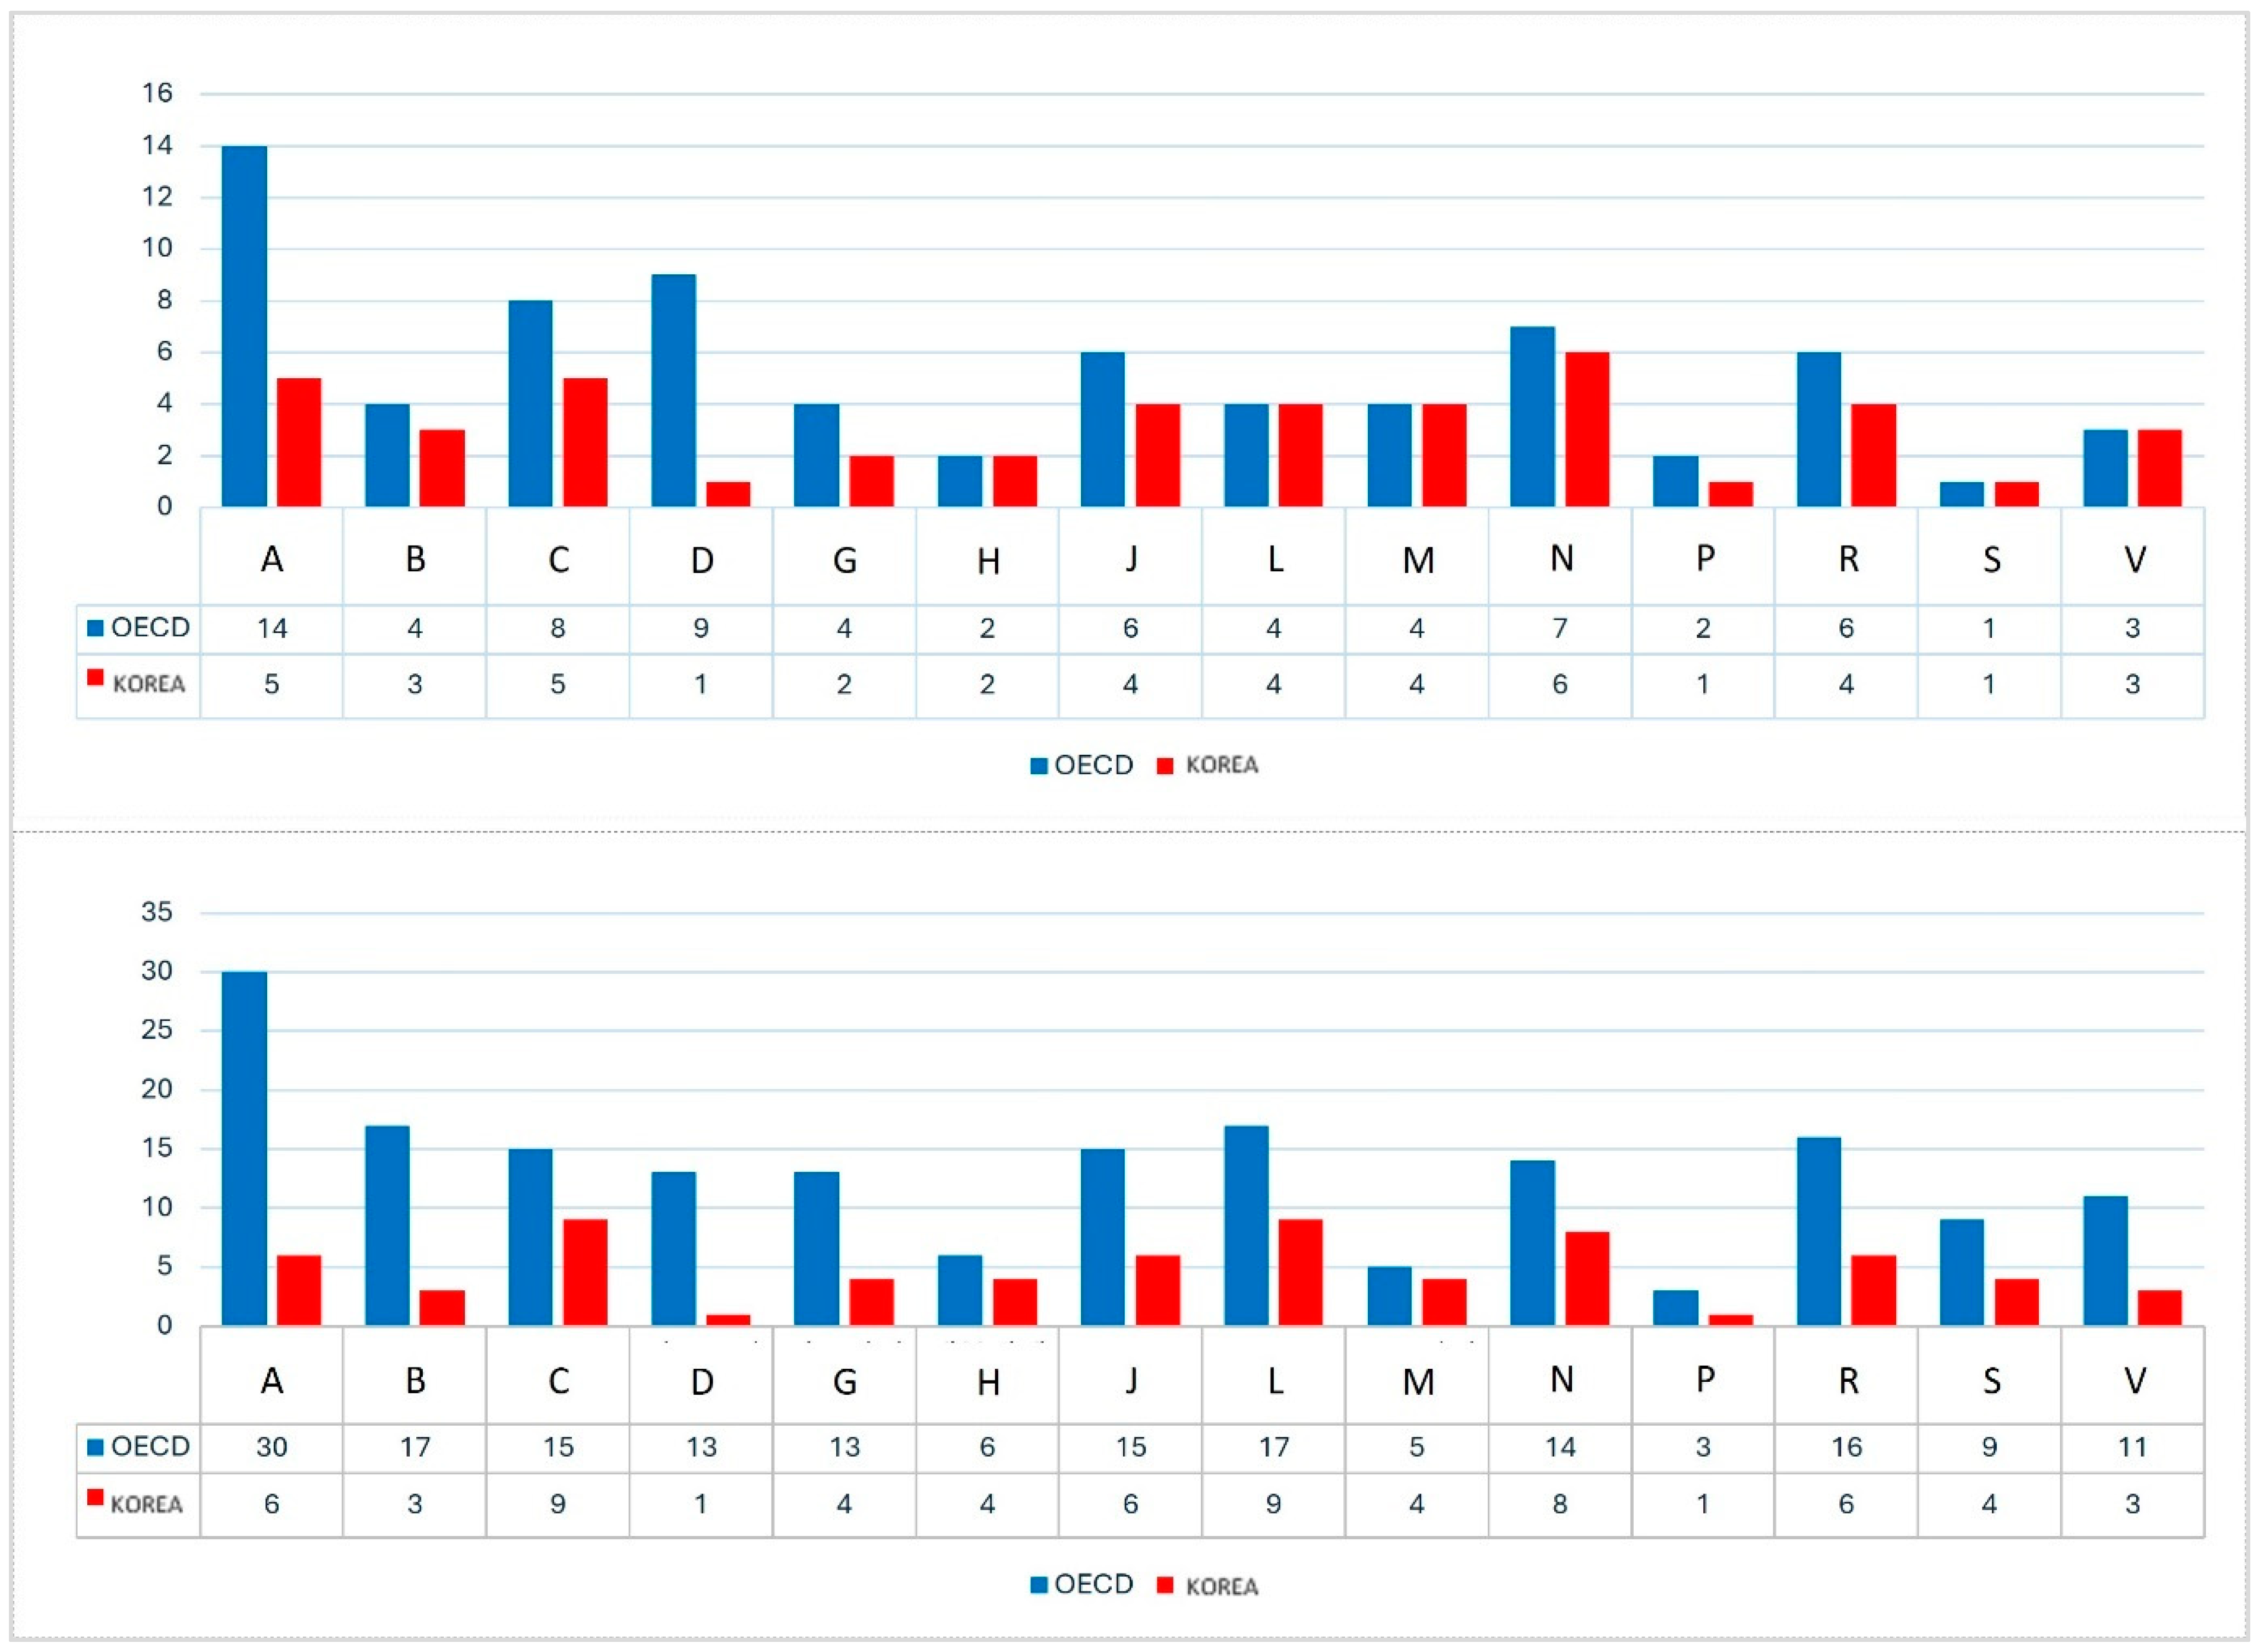
3.4.2. New Drug Listing and Distribution by Efficacy Group and Drug Class
3.4.3. ATC Level 2 (Efficacy Group) Analysis
- In South Korea, the top 10 efficacy groups accounted for 84.5% of total NCE expenditures, with antineoplastic agents (L01, 32.2%), antidiabetic drugs (A10, 12.8%), antiviral drugs (J05, 9.8%), and immunosuppressants (L04, 9.5%) leading in expenditure (Appendix A Table A1).
- In OECD countries, the top 10 groups represented 81.5% of total NCE expenditures, with antineoplastic agents (L01, 19.2%), antiviral drugs (J05, 18.4%), antidiabetic drugs (A10, 11.5%), and immunosuppressants (L04, 10.0%) ranking highest (Appendix A Table A2).
- While both regions prioritized oncology, antivirals, and diabetes drugs, OECD countries demonstrated greater diversification in drug approval across more therapeutic areas.
3.4.4. ATC Level 3 (Pharmacological Class) Analysis
- In South Korea, the top 10 drug classes comprised 77.9% of total NCE expenditures, with protein kinase inhibitors (L01F, 15.8%), oral glucose-lowering drugs (A10B, 13.8%), and direct-acting antivirals (J05A, 9.8%) leading the list (Appendix A Table A1).
- OECD countries exhibited a more diverse spread, with antivirals for hepatitis (J5C, 11.9%), immune checkpoint inhibitors (L1G, 10.1%), and other antineoplastic agents (L1H, 6.9%) ranking highest (Appendix A Table A2).
- While South Korea showed high concentration in oncology, diabetes, and antivirals, OECD countries allocated NCE expenditures more evenly across a broader range of drug classes.
3.5. NCE Classification and Therapeutic Area Expenditures
4. Discussion
4.1. Cancer Expenditure Trends
4.2. Underfunding of Chronic Diseases
4.3. International Policy Considerations and Potential Adaptations
4.3.1. Expansion of Risk-Sharing and Managed Entry Agreements
- Risk-sharing agreements (RSA) and managed entry agreements (MEA) are widely implemented in OECD countries to enhance access to high-cost drugs while managing financial risks [27].
- Germany and Italy use performance-based RSA models, where reimbursement is tied to demonstrated clinical effectiveness and real-world patient outcomes.
- South Korea’s RSA framework is primarily focused on oncology; broadening its application to cardiovascular and neurological diseases could improve accessibility while maintaining budget control.
4.3.2. Refinement of Drug Pricing and Value-Based Assessments
- Some OECD countries, including Japan, France, and Germany, apply tiered pricing systems based on clinical benefit and innovation level [28].
- Japan considers market size, innovation level, and clinical benefit when determining drug prices, while France’s ASMR-based system classifies drugs into five reimbursement categories to differentiate funding levels.
- South Korea could adopt differential pricing strategies to ensure funding reflects therapeutic impact and long-term health outcomes.
4.3.3. Funding Programs for High-Cost and Rare Disease Therapies
- Countries such as France (ATU), Germany (NUB), and the UK (CDF) have implemented dedicated funding pathways for rare diseases and high-cost treatments [29].
- South Korea could develop specialized reimbursement funds to ensure timely access to high-cost therapies while maintaining budget sustainability.
4.3.4. Adaptive Pricing for Multi-Indication Drugs
- Germany, France, Italy, and Switzerland use indication-based pricing (IBP) to adjust drug costs based on real-world utilization across different indications [30].
- This approach ensures cost-effectiveness across multiple disease areas and prevents excessive spending on low-value indications.
- South Korea could assess the feasibility of IBP, particularly for oncology and immunotherapy drugs, where therapeutic impact varies across patient subgroups.
4.4. Limitations
5. Conclusions
Author Contributions
Funding
Institutional Review Board Statement
Informed Consent Statement
Data Availability Statement
Conflicts of Interest
Appendix A

| ATC Code | ATC Definition | New Drug Expenditure (USD, Mil.) | Share of New Drugs in Total Expenditure | |
|---|---|---|---|---|
| ATC level 2 | L01 | Antineoplastic agents | 3780 | 32.2% |
| A10 | Antidiabetic drugs | 1503 | 12.8% | |
| J05 | Antiviral drugs | 1145 | 9.8% | |
| L04 | Immunosuppressants | 1112 | 9.5% | |
| B01 | Antithrombotic agents | 586 | 5.0% | |
| G04 | Urologicals | 409 | 3.5% | |
| A02 | Drugs for acid-related disorders | 405 | 3.5% | |
| S01 | Ophthalmologicals | 401 | 3.4% | |
| M05 | Drugs for bone diseases | 320 | 2.7% | |
| C09 | Agents acting on the renin–angiotensin system | 249 | 2.1% | |
| Other 35 ATC Level 2 Groups | 1815 | 15.7% | ||
| Total | 11,723 | 100% | ||
| ATC level 3 | L01F | Protein kinase inhibitors | 1855 | 15.8% |
| L01E | Blood glucose-lowering drugs, excluding insulins | 1613 | 13.8% | |
| A10B | Blood glucose-lowering drugs, excluding insulins | 1374 | 11.7% | |
| J05A | Direct acting antivirals | 1145 | 9.8% | |
| L04A | Immunosuppressants | 1112 | 9.5% | |
| B01A | Antithrombotic agents | 586 | 5.0% | |
| A02B | Peptic ulcer and gastro-oesophageal reflux disease | 405 | 3.5% | |
| G04B | Drugs used in benign prostatic hyperplasia | 376 | 3.2% | |
| S01L | Ophthalmologicals, antineovascularisation agents | 345 | 2.9% | |
| M05B | Drugs Affecting bone structure and mineralization | 320 | 2.7% | |
| Other 58 ATC Level 3 Groups | 2594 | 22.1% | ||
| Total | 11,723 | 100% | ||
| ATC Code | ATC Definition | New Drug Expenditure (USD, Bil.) | Share of New Drugs in Total Expenditure | |
|---|---|---|---|---|
| ATC level 2 | L01 | Antineoplastic agents | 424 | 19.2% |
| J05 | Antiviral drugs | 407 | 18.4% | |
| A10 | Antidiabetic drugs | 255 | 11.5% | |
| L04 | Immunosuppressants | 221 | 10.0% | |
| B01 | Antithrombotic agents | 171 | 7.8% | |
| N07 | Other nervous system drugs | 89 | 4.0% | |
| R03 | Drugs for respiratory diseases | 82 | 3.7% | |
| R07 | Other respiratory system drugs | 66 | 3.0% | |
| N05 | Psycholeptics | 45 | 2.0% | |
| L02 | Endocrine system drugs | 40 | 1.8% | |
| Other 67 ATC Level 2 Groups | 408 | 18.5% | ||
| Total | 2209 | 100% | ||
| ATC level 3 | J5C | Antivirals for hepatitis | 263 | 11.9% |
| L1G | Immune checkpoint inhibitors | 222 | 10.1% | |
| L1H | Other antineoplastic agents | 152 | 6.9% | |
| B1F | Thrombolytics | 151 | 6.8% | |
| L4C | Selective immunosuppressants | 133 | 6.0% | |
| J5D | Antivirals for HIV | 133 | 6.0% | |
| A10S | Sodium–glucose co-transporter 2 (SGLT2) inhibitors | 124 | 5.6% | |
| A10P | Combination of oral blood glucose-lowering drugs | 83 | 3.8% | |
| N7A | Drugs used in addictive disorders | 63 | 2.9% | |
| L4X | Other immunosuppressants | 58 | 2.6% | |
| Other 174 ATC Level 3 Groups | 826 | 37.4% | ||
| Total | 2209 | 100% | ||
| Policy Type | Country | Key Features |
|---|---|---|
| Management of Therapeutic Outcomes and Financial Expenditure Uncertainty | Multiple Countries | Common policies include risk-sharing agreements (RSAs), patient access schemes, confidential commercial agreements, and managed access agreements. These models employ performance-based, financial-based, or mixed frameworks, as well as early reimbursement with post-evaluation mechanisms. |
| Refinement of Clinical/Therapeutic Value Assessment and Pricing Incentives | Japan | Drug evaluation considers multiple factors such as indication, market environment, innovation, utility, pediatric use, and priority introduction, incorporating various pricing incentives. |
| Switzerland | Innovative new drugs receive a price premium of up to 20% for a maximum of 15 years compared to existing drugs. | |
| France | The clinical utility of drugs is assessed through absolute therapeutic benefit (SMR) and relative improvement in benefit (ASMR), classified into five tiers. This affects reimbursement rates, fast-track approvals, and post-market price adjustments, including price reductions and rebates. | |
| Germany | Six-tiered evaluation system for innovative drugs, which influences pricing decisions. | |
| Italy | Drugs are categorized into three tiers based on their level of innovation, and this classification impacts price negotiations. | |
| Belgium | Drugs are assessed based on therapeutic value, with an additional benefit premium applied. | |
| Canada | A four-tier system evaluates therapeutic improvements, determining the maximum allowable price. | |
| Taiwan | A three-tier classification evaluates clinical value improvement, with special pricing mechanisms for innovative drugs and orphan drugs without alternatives. | |
| Dedicated Financial Support for Severe Disease Treatments and Patient Access Programs | France | Temporary use authorization (ATU) allows pre-approval use of drugs for severe and rare diseases. |
| Germany | New Technologies and Unmet Needs Fund (NUB) supports rare disease treatments, oncology drugs, and novel diagnostic/therapeutic methods. | |
| Italy | AIFA fund supports the reimbursement and research and development of orphan drugs. | |
| United Kingdom | Separate funds for non-recommended oncology drugs (CDF) and rare disease treatments (IMF) ensure patient access. | |
| Scotland | New Medicines Fund (NMF) provides financial support for rare, ultra-rare, and end-of-life treatments. | |
| Australia | Life-Saving Drugs Program (LSDP) supports high-cost treatments for life-threatening and rare diseases. | |
| Belgium | Special Solidarity Fund (SSF) provides separate financial support for high-cost drugs for severe diseases not covered by national health insurance. | |
| Canada | Special Access Program (SAP) grants access to unauthorized drugs for life-threatening and severe diseases. Some provinces have additional specialized programs: RDDCP (Alberta), OPDP (Ontario), and SDP. | |
| New Zealand | Compassionate Fund (CF) provides financial assistance for rare and difficult-to-treat diseases. | |
| Relaxation or Exemption of Economic Evaluation Criteria | United Kingdom | Highly Specialized Technology (HST) assessment raises the ICER threshold, considering drug characteristics, clinical utility, willingness to pay, and social demands. |
| Germany | Orphan drugs and treatments below a certain financial threshold are exempt from submitting a full cost–benefit report. | |
| Australia | Rule of Rescue allows reimbursement for essential drugs even if cost-effectiveness thresholds are not met. | |
| Diversification of Drug Payment Programs | United States | For high-cost drugs, pharmaceutical companies may split payments to insurers or allocate different insurance coverage per disease, spreading financial burdens. |
| Multi-Indication Drug Value Assessment and Pricing Adjustments | Germany | When a new indication is added, the G-BA sets a comparative group for each indication, evaluating additional benefits and target population size, leading to weighted average pricing based on usage. |
| France | The drug pricing committee sets a single weighted average price, considering clinical equivalence, expected usage, and therapeutic value for each indication. | |
| Italy | Managed entry agreements (MEAs) apply different rebate rates per indication, with mandatory patient registries for monitoring. | |
| Australia | Selective price adjustment (SPA) applies differentiated reimbursement rates for drugs demonstrating substantial benefits over alternatives in severe diseases and specific patient groups. | |
| United Kingdom | Clinical benefit and unmet needs for each indication determine separate reimbursement rates, primarily applied to targeted therapies and immuno-oncology drugs. | |
| Switzerland | Reimbursement codes are assigned per indication, enabling indication-based price adjustments and usage monitoring. | |
| Incentives for Innovative Drugs | Italy | The Innovative Drug Fund (IDF) provides a 10% price premium for selected drugs. |
| Specialized Reimbursement Programs | United States | The Specialty Pharmacy Program offers personalized services for rare disease treatments, requiring additional enrollment for coverage. |
References
- Tichy, E.M.; Hoffman, J.M.; Suda, K.J.; Rim, M.H.; Tadrous, M.; Cuellar, S.; Clark, J.S.; Ward, J.; Schumock, G.T. National trends in prescription drug expenditures and projections for 2022. Am. J. Health Syst. Pharm. 2022, 79, 1158–1172. [Google Scholar] [CrossRef]
- Tichy, E.M.; Hoffman, J.M.; Tadrous, M.; Rim, M.H.; Suda, K.J.; Cuellar, S.; Clark, J.S.; Newell, M.K.; Schumock, G.T. National trends in prescription drug expenditures and projections for 2023. Am. J. Health Syst. Pharm. 2023, 80, 899–913. [Google Scholar] [CrossRef] [PubMed]
- Linnér, L.; Eriksson, I.; Persson, M.; Wettermark, B. Forecasting drug utilization and expenditure: Ten years of experience in Stockholm. BMC Health Serv. Res. 2020, 20, 410. [Google Scholar] [CrossRef] [PubMed]
- Arinaminpathy, N.; Batra, D.; Maheshwari, N.; Swaroop, K.; Sharma, L.; Sachdeva, K.S.; Khaparde, S.; Rao, R.; Gupta, D.; Vader, B.; et al. Tuberculosis treatment in the private healthcare sector in India: An analysis of recent trends and volumes using drug sales data. BMC Infect. Dis. 2019, 19, 539. [Google Scholar] [CrossRef] [PubMed]
- Meyers, D.E.; Meyers, B.S.; Chisamore, T.M.; Wright, K.; Gyawali, B.; Prasad, V.; Sullivan, R.; Booth, C.M. Trends in drug revenue among major pharmaceutical companies: A 2010–2019 cohort study. Cancer 2022, 128, 311–316. [Google Scholar] [CrossRef] [PubMed]
- Park, J.; Moon, K.; Kim, D.S. Health Care Utilization and Anti-Cancer Drug Expenditure for Six Solid Cancers in Korea from 2007 to 2019. Front Oncol. 2022, 12, 862173. [Google Scholar] [CrossRef] [PubMed]
- Lee, H.; Park, D.; Kim, D.S. Determinants of Growth in Prescription Drug Spending Using 2010–2019 Health Insurance Claims Data. Front Pharmacol. 2021, 12, 681492. [Google Scholar] [CrossRef] [PubMed]
- Health Systems in Transition. United Kingdom health system review. Health Syst. Transit. 2015, 17, 1–125. Available online: https://eurohealthobservatory.who.int/publications/i/united-kingdom-health-system-review-2015 (accessed on 23 January 2025).
- IQVIA MIDAS® Global Database. Comprehensive Pharmaceutical Sales Data for South Korea and Comparator Countries. Available online: https://www.iqvia.com/solutions/commercialization/brand-strategy-and-management/market-measurement/midas (accessed on 24 January 2025).
- World Health Organization. Global Health Estimates: Life Expectancy and Leading Causes of Death and Disability. Available online: https://www.who.int/data/global-health-estimates (accessed on 24 January 2025).
- Health Insurance Review & Assessment Service (HIRA). Statistics. Available online: https://www.hira.or.kr/eng/main.do (accessed on 24 January 2025).
- Korean Statistical Information Service (KOSIS). Available online: https://kosis.kr/eng/ (accessed on 24 January 2025).
- Ministry of Food and Drug Safety (MFDS). Approval Process for Pharmaceuticals. Available online: https://www.mfds.go.kr/eng/wpge/m_17/de011008l001.do (accessed on 24 January 2025).
- Ministry of Health and Welfare (MoHW). Available online: https://www.mohw.go.kr/eng/ (accessed on 24 January 2025).
- World Health Organization. Anatomical Therapeutic Chemical (ATC) Classification System. Available online: https://www.who.int/tools/atc-ddd-toolkit/atc-classification (accessed on 24 January 2025).
- Organisation for Economic Co-operation and Development (OECD). Pharmaceutical Spending. Available online: https://www.oecd.org/health/pharmaceutical-spending.htm (accessed on 24 January 2025).
- Korea Research-based Pharmaceutical Industry Association (KRPIA). Available online: http://www.krpia.or.kr/eng/ (accessed on 24 January 2025).
- United Nations. Sustainable Development Goals: Good Health and Well-Being. Available online: https://www.un.org/sustainabledevelopment/health/ (accessed on 24 January 2025).
- World Health Organization. Regional Office for the Western Pacific. Health Systems Strengthening. Available online: https://www.who.int/data/gho/data/themes/topics/health-systems-strengthening (accessed on 24 January 2025).
- Organisation for Economic Co-Operation and Development (OECD). Health at a Glance 2023: OECD Indicators. Available online: https://www.oecd.org/health/health-at-a-glance/ (accessed on 24 January 2025).
- Ministry of Health and Welfare (MoHW). Pharmaceutical Policy Reports. Available online: https://www.mohw.go.kr/menu.es?mid=a20311000000 (accessed on 24 January 2025).
- Kostadinov, K.; Popova-Sotirova, I.; Marinova, Y.; Musurlieva, N.; Iskrov, G.; Stefanov, R. Availability and access to orphan drugs for rare cancers in Bulgaria: Analysis of delays and public expenditures. Cancers 2024, 16, 1489. [Google Scholar] [CrossRef] [PubMed]
- Voda, A.I.; Bostan, I. Public health care financing and the costs of cancer care: A cross-national analysis. Cancers 2018, 10, 117. [Google Scholar] [CrossRef] [PubMed]
- Galkina Cleary, E.; Jackson, M.J.; Zhou, E.W.; Ledley, F.D. Comparison of Research Spending on New Drug Approvals by the National Institutes of Health vs the Pharmaceutical Industry, 2010–2019. JAMA Health Forum. 2023, 4, e230511. [Google Scholar] [CrossRef] [PubMed]
- Branning, G.; Vater, M. Healthcare Spending: Plenty of Blame to Go Around. Am. Health Drug Benefits 2016, 9, 445–447. [Google Scholar] [PubMed]
- Rodwin, M.A. How the United Kingdom Controls Pharmaceutical Prices and Spending: Learning from Its Experience. Int. J. Health Serv. 2021, 51, 229–237. [Google Scholar] [CrossRef] [PubMed]
- Kakkar, A.K. Pharmaceutical price regulation and its impact on drug innovation: Mitigating the trade-offs. Expert Opin. Ther. Pat. 2021, 31, 189–192. [Google Scholar] [CrossRef] [PubMed]
- Schuhmacher, A.; Hinder, M.; von Stegmann Und Stein, A.; Hartl, D.; Gassmann, O. Analysis of pharma R&D productivity—A new perspective needed. Drug Discov. Today 2023, 28, 103726. [Google Scholar] [CrossRef] [PubMed]
- Ciulla, M.; Marinelli, L.; Di Biase, G.; Cacciatore, I.; Santoleri, F.; Costantini, A.; Dimmito, M.P.; Di Stefano, A. Healthcare Systems across Europe and the US: The Managed Entry Agreements Experience. Healthcare 2023, 11, 447. [Google Scholar] [CrossRef] [PubMed]
- Vokinger, K.N. Do Managed Entry Agreements Contribute to Lower Pharmaceutical Spending? JAMA Health Forum. 2023, 4, e234610. [Google Scholar] [CrossRef] [PubMed]
| Category | Country | 2017–2019 | 2020–2022 | CAGR | Total | |||||||
|---|---|---|---|---|---|---|---|---|---|---|---|---|
| 2017 | 2018 | 2019 | Subtotal | 2020 | 2021 | 2022 | Subtotal | |||||
| Total Pharma Exp. (USD, Bil.) | Korea | 12 | 13 | 14 | 40 | 15 | 16 | 17 | 48 | 7.3% | 87 | |
| OECD | 734,560 | 771,040 | 810,224 | 2,315,825 | 849,471 | 915,501 | 1,000,201 | 2,765,173 | 6.4% | 5,080,998 | ||
| Total NCE Exp. (USD, Bil.) | Korea | 1.2 | 1.5 | 1.8 | 4.5 | 2.1 | 2.4 | 2.7 | 7.2 | 17.8% | 12 | |
| OECD | 215,792 | 267,280 | 322,427 | 805,499 | 385,632 | 461,158 | 557,487 | 1,404,276 | 20.9% | 2,209,775 | ||
| NCE/Pharma Exp. (%) | Korea | 10.0% | 11.4% | 12.6% | 11.4% | 14.0% | 15.3% | 16.0% | 15.2% | 9.8% | 13.5% | |
| OECD | Mean | 23.5% | 28.4% | 31.8% | 28.1% | 34.6% | 38.2% | 42.6% | 38.7% | 13.1% | 33.9% | |
| SD | 6.4% | 7.2% | 6.8% | 6.5% | 7.4% | 8.3% | 9.0% | 8.2% | 3.6% | 7.1% | ||
| p-value † | 0.055 | 0.049 | 0.041 | 0.045 | 0.042 | 0.042 | 0.039 | 0.041 | 0.125 | 0.04 | ||
| Healthcare Exp. (USD, Bil.) | Korea | 48 | 54 | 59 | 161 | 60 | 65 | 73 | 198 | 8.7% | 359 | |
| Pharma/Health Exp. (%) | 25.1% | 24.6% | 24.1% | 24.6% | 24.7% | 24.2% | 23.5% | 24.1% | −1.3% | 24.3% | ||
| NCE/Health Exp. (%) | 2.5% | 2.8% | 3.0% | 2.8% | 3.5% | 3.7% | 3.8% | 3.6% | 8.4% | 3.3% | ||
| ATC Code ‡ | Korea | OECD | Korea | OECD | ||||
|---|---|---|---|---|---|---|---|---|
| Pharma Exp. (USD, Bil.) | NCE Exp. (USD, Bil.) | Pharma Exp. (USD, Bil.) | NCE Exp. (USD, Bil.) | NCE Share (%) | NCE Share (%) | |||
| Mean | SD | p-Value † | ||||||
| A | 13 | 2.2 | 785 | 326 | 16.0% | 41.5% | 7.6% | 0.035 |
| B | 8.0 | 0.6 | 341 | 226 | 7.8% | 66.3% | 10.0% | 0.02 |
| C | 17 | 0.4 | 281 | 57 | 2.4% | 20.2% | 6.0% | 0.039 |
| D | 0.8 | 0.1 | 111 | 31 | 12.6% | 27.9% | 9.6% | 0.073 |
| G | 2.6 | 0.5 | 151 | 19 | 18.3% | 12.3% | 7.1% | 0.135 |
| H | 0.7 | 0.1 | 112 | 6.1 | 10.2% | 5.4% | 2.4% | 0.058 |
| J | 8.7 | 1.2 | 526 | 416 | 13.9% | 79.2% | 17.3% | 0.031 |
| L | 11 | 5.0 | 1266 | 688 | 46.2% | 54.4% | 4.0% | 0.057 |
| M | 5.1 | 0.7 | 154 | 42 | 12.9% | 27.4% | 5.4% | 0.043 |
| N | 8.7 | 0.3 | 710 | 214 | 4.0% | 30.1% | 7.1% | 0.032 |
| P | 0.04 | 0.0001 | 6.5 | 0.3 | 0.3% | 5.4% | 2.7% | 0.061 |
| R | 3.8 | 0.3 | 347 | 149 | 6.7% | 43.0% | 14.7% | 0.047 |
| S | 3.1 | 0.4 | 129 | 29 | 13.0% | 22.5% | 12.0% | 0.144 |
| V | 2.5 | 0.0 | 48 | 5.9 | 0.2% | 12.1% | 6.4% | 0.062 |
| Total | 87 | 12 | 5081 | 2210 | 13.5% | 33.9% | 7.1% | 0.04 |
| Category | Economic Evaluation Performed | Economic Evaluation Exempt | Below Avg. Weighted Price | Clinically Essential Drugs | Total |
|---|---|---|---|---|---|
| NCE Count | 74 | 32 | 160 | 10 | 276 |
| Share in NCE Count (%) | 26.8% | 11.6% | 58.0% | 3.6% | 100% |
| NCE Exp. (USD, Mil.) | 4868 | 547 | 6053 | 255 | 11,723 |
| Share in NCE Exp. (%) | 41.5% | 4.7% | 51.6% | 2.2% | 100% |
| Share in Total Pharma Exp. (%) | 5.6% | 0.6% | 6.9% | 0.3% | 13.50% |
| ATC Code ‡ | Economic Evaluation Performed (USD, Mil.) | Economic Evaluation Exempt (USD, Mil.) | Below Avg. Weighted Price (USD, Mil.) | Clinically Essential Drugs (USD, Mil.) | p-Value † | ||||||||||||
|---|---|---|---|---|---|---|---|---|---|---|---|---|---|---|---|---|---|
| N | Sum | Mean | SD | N | Sum | Mean | SD | N | Sum | Mean | SD | N | Sum | Mean | SD | ||
| A | 7 | 633 | 9.3 | 11 | 3 | 58 | 3.9 | 4.0 | 28 | 1421 | 8.4 | 14 | 4 | 47 | 1.8 | 2.9 | 0.01 |
| B | 6 | 202 | 3.1 | 2.8 | 1 | 24 | 4.0 | 1.6 | 5 | 380 | 8.6 | 10 | 1 | 16 | 1.2 | 1.2 | <0.001 |
| C | 4 | 61 | 1.7 | 1.7 | - | - | - | 10 | 339 | 2.8 | 4.8 | - | - | - | 0.039 | ||
| D | 1 | 107 | 36 | 18 | - | - | - | - | - | - | - | - | - | N/A | |||
| G | 1 | 119 | 4.9 | 3.4 | - | - | - | 6 | 350 | 5.3 | 10 | - | - | - | 0.074 | ||
| H | 1 | 36 | 6.0 | 1.0 | - | - | - | 5 | 39 | 0.9 | 1.3 | - | - | - | <0.001 | ||
| J | 7 | 212 | 5.0 | 12 | 1 | 0.6 | 0.6 | - | 25 | 1001 | 8.9 | 21 | - | - | - | 0.858 | |
| L | 34 | 2771 | 9.4 | 15 | 22 | 333 | 3.0 | 4 | 40 | 1731 | 5.1 | 8.7 | 2 | 179 | 8.5 | 9.2 | 0.001 |
| M | 1 | 294 | 49 | 38 | 2 | 124 | 18 | 11 | 8 | 237 | 5.8 | 5.8 | - | - | - | <0.001 | |
| N | 5 | 81 | 1.0 | 1.1 | 1 | 6 | 1.1 | 0.6 | 16 | 250 | 1.6 | 2.2 | 2 | 13 | 0.8 | 1.5 | 0.057 |
| P | - | - | - | - | - | - | 1 | 0.1 | 0.0 | 0.0 | - | - | - | N/A | |||
| R | 2 | 4.9 | 0.5 | 0.4 | - | - | - | 10 | 250 | 3.1 | 4.2 | - | - | - | <0.001 | ||
| S | 4 | 345 | 14 | 20 | - | - | - | 5 | 56 | 2.0 | 2.1 | - | - | - | 0.003 | ||
| V | 1 | 3.4 | 1.1 | 0.5 | 2 | 1.5 | 0.3 | 0.6 | 1 | 0.04 | 0.04 | - | 1 | - | - | - | <0.001 |
| Total | 74 | 4868 | 7.3 | 14 | 32 | 547 | 3.6 | 5.6 | 160 | 6053 | 5.0 | 11 | 10 | 255 | 3.3 | 6.0 | 0.107 |
| Category | RSA Inclusion | Orphan Drug Designation | Total | ||
|---|---|---|---|---|---|
| RSA Included | RSA Excluded | Orphan Drugs | Non-Orphan Drugs | ||
| NCE Count | 59 | 217 | 91 | 185 | 276 |
| Share in NCE Count (%) | 21.40% | 78.60% | 33.00% | 67.00% | 100% |
| NCE Exp. (USD, Mil.) | 4504 | 11,346 | 2890 | 12,960 | 15,850 |
| Share in NCE Exp. (%) | 28.4% | 71.6% | 18.2% | 81.8% | 100% |
| Share in Total Pharma Exp. (%) | 3.8% | 9.6% | 2.5% | 11.0% | 13.5% |
| ATC Code ‡ | RSA Inclusion (USD, Mil.) | Orphan Drug Designation (USD, Mil.) | p-Value † | ||||||||||||||
|---|---|---|---|---|---|---|---|---|---|---|---|---|---|---|---|---|---|
| RSA Included | RSA Excluded | Orphan Drugs | Non-Orphan Drugs | ||||||||||||||
| N | Sum | Mean | SD | N | Sum | Mean | SD | N | Sum | Mean | SD | N | Sum | Mean | SD | ||
| A | 3 | 58 | 3.9 | 4.0 | 39 | 2101 | 8.0 | 13 | 14 | 219 | 2.8 | 4.4 | 28 | 1941 | 10 | 14 | 0.015 |
| B | 2 | 31 | 1.5 | 1.9 | 11 | 591 | 5.5 | 7.4 | 7 | 76 | 1.2 | 1.4 | 6 | 546 | 8.0 | 8.3 | <0.001 |
| C | - | - | - | 14 | 399 | 2.6 | 4.3 | 4 | 34 | 1.2 | 0.8 | 10 | 365 | 2.9 | 4.7 | 0.006 | |
| D | 1 | 107 | 36 | 18 | - | - | - | - | - | - | 1 | 107 | 36 | 18 | 0.052 | ||
| G | - | - | - | 7 | 469 | 5.2 | 8.7 | - | - | - | 7 | 469 | 5.2 | 8.7 | 0.763 | ||
| H | - | - | - | 6 | 76 | 1.6 | 2.1 | 3 | 10 | 0.4 | 0.7 | 3 | 66 | 2.6 | 2.3 | 0.001 | |
| J | 1 | 0.6 | 0.6 | - | 32 | 1212 | 7.9 | 19 | 4 | 49 | 2.4 | 2.7 | 29 | 1163 | 8.7 | 21 | 0.011 |
| L | 47 | 3004 | 9.1 | 15 | 51 | 2010 | 4.6 | 7.0 | 49 | 1586 | 5 | 11 | 49 | 3428 | 7.7 | 12 | 0.739 |
| M | 2 | 124 | 18 | 11 | 9 | 531 | 11 | 20 | 3 | 143 | 12 | 11 | 8 | 512 | 12 | 21 | 0.145 |
| N | 1 | 6 | 1.1 | 0.6 | 23 | 344 | 1.3 | 1.9 | 4 | 19 | 0.8 | 1.3 | 20 | 330 | 1.4 | 1.9 | 0.089 |
| P | - | - | - | 1 | 0.1 | 0.02 | 0.02 | - | - | - | 1 | 0 | 0.02 | 0.02 | 0.937 | ||
| R | - | - | - | 12 | 255 | 2.8 | 4.0 | - | - | 12 | 255 | 2.8 | 4.0 | 0.324 | |||
| S | - | - | - | 9 | 401 | 7.7 | 15 | - | - | - | 9 | 401 | 7.7 | 15 | 0.259 | ||
| V | 2 | 1.5 | 0.3 | 0.6 | 3 | 3 | 0.9 | 0.7 | 3 | 1.5 | 0.3 | 0.6 | 2 | 3 | 0.9 | 0.7 | <0.001 |
| Total | 59 | 3331 | 8.6 | 15 | 217 | 8392 | 4.9 | 10.3 | 91 | 2137 | 3.7 | 8.5 | 185 | 9586 | 6.3 | 12 | 0.006 |
Disclaimer/Publisher’s Note: The statements, opinions and data contained in all publications are solely those of the individual author(s) and contributor(s) and not of MDPI and/or the editor(s). MDPI and/or the editor(s) disclaim responsibility for any injury to people or property resulting from any ideas, methods, instructions or products referred to in the content. |
© 2025 by the authors. Licensee MDPI, Basel, Switzerland. This article is an open access article distributed under the terms and conditions of the Creative Commons Attribution (CC BY) license (https://creativecommons.org/licenses/by/4.0/).
Share and Cite
Yu, S.-R.; Choi, S. New Drug Expenditure by Therapeutic Area in South Korea: International Comparison and Policy Implications. Healthcare 2025, 13, 468. https://doi.org/10.3390/healthcare13050468
Yu S-R, Choi S. New Drug Expenditure by Therapeutic Area in South Korea: International Comparison and Policy Implications. Healthcare. 2025; 13(5):468. https://doi.org/10.3390/healthcare13050468
Chicago/Turabian StyleYu, Seung-Rae, and Sooyoung Choi. 2025. "New Drug Expenditure by Therapeutic Area in South Korea: International Comparison and Policy Implications" Healthcare 13, no. 5: 468. https://doi.org/10.3390/healthcare13050468
APA StyleYu, S.-R., & Choi, S. (2025). New Drug Expenditure by Therapeutic Area in South Korea: International Comparison and Policy Implications. Healthcare, 13(5), 468. https://doi.org/10.3390/healthcare13050468