Abstract
Background/Objectives: Korean medicine healthcare (KMHC), a form of traditional medicine including acupuncture and herbal medicine, is widely utilized by patients with intervertebral disc disease (IVDD). With the increasing use of real-world evidence (RWE) in the medical field, this study aims to derive RWE on KMHC utilization and its associated factors in patients with IVDD. Methods: Data from 495 individuals who received outpatient healthcare for IVDD regardless of the purpose such as treatment, examination, rehabilitation, monitoring, or prescription were analyzed using the 2022 Korea Health Panel Survey (KHPS). Multinomial logistic regression analyses were performed to identify factors associated with healthcare use for IVDD. Regression models were constructed by sequentially adding predisposing, enabling, and need factors following Andersen’s behavioral model. All statistical analyses accounted for the complex survey design of the KHPS using survey sampling weights. Results: Individuals aged 45–59 years were less likely to use both KMHC and conventional medicine healthcare (CMHC) for IVDD compared to those aged 19–44 years (adjusted odds ratio [95% confidence interval], 0.28 [0.09, 0.89]). People with disabilities showed lower utilization of both KMHC and CMHC for IVDD compared to those without disabilities (0.27 [0.09, 0.81]). Individuals who were employed (2.37 [1.06, 5.3]) or perceived their health status as fair (3.05 [1.17, 8]) or poor/very poor (6.13 [2.04, 18.45]) were more inclined to use both KMHC and CMHC for IVDD. Individuals who engaged in regular physical activities (2.65 [1.19, 5.9]) or had shoulder joint diseases (3.71 [1.22, 11.29]) or other spine-related diseases (2.63 [1.16, 5.96]) were more inclined to use KMHC-only for IVDD. Conclusions: This study identified significant demographic and health-related factors influencing KMHC utilization for IVDD. These findings emphasize the need for tailored healthcare policies regarding KMHC for IVDD for effective resource distribution.
1. Introduction
Intervertebral disc disease (IVDD) is a leading cause of disability globally, with its prevalence increasing with an aging population [1]. In developed countries, it affects approximately 5% of the population annually, leading to a significant socioeconomic burden worldwide [2,3]. The most common forms of IVDD are degenerative disc disease (DDD) and prolapsed intervertebral disc, with primary symptoms including back, neck, and radicular pain [1]. However, some DDDs are asymptomatic, and magnetic resonance imaging (MRI) has shown disc abnormalities in up to 80% of asymptomatic individuals, suggesting that the true prevalence of IVDD is estimated to be significantly higher [4]. Conventional medicine healthcare (CMHC) strategies for managing IVDD vary depending on the disease type and severity. They can be broadly divided into conservative treatments—such as medication, physiotherapy, and epidural injections—and surgical treatments [1,4]. In particular, the number of outpatients receiving CMHC for dorsalgia, a major symptom of IVDD in South Korea, was 5,732,221 in 2023, ranking 8th in frequency among all conditions [5]. However, many patients do not respond to conservative treatment, while surgical treatment has limitations such as higher recurrence and revision rates, lack of long-term effectiveness, and complication risk [4,6,7,8].
Korean medicine healthcare (KMHC), such as herbal medicine and acupuncture, corresponding to traditional East Asian medicine treatment, has been actively employed in treating IVDD. In the clinical medical field in Korea, studies show that dorsalgia—a major symptom of IVDD—is the most common symptom receiving KMHC [5]. Additionally, a pilot project is set to provide health insurance coverage for herbal decoction for lumbar disc herniation, one of the IVDDs, from April 2024 to December 2026 [5,9]. Several clinical studies show the effectiveness of KMHC in treating IVDD [10,11,12]. Furthermore, KMHC has demonstrated benefits in patients who failed back surgery, with significant improvements in pain management and physical function, and satisfaction was also high [13].
Real-world evidence (RWE) refers to clinical evidence regarding the usage, benefits, or risks of a medical product derived from analysis of real-world data, such as electronic health records, insurance claims, or national health surveys [14]. The use of RWE is rapidly increasing in the medical field in recent times, and it is being used in various approaches such as drug development, medical policy decision-making, and treatment outcome analysis [15]. Analyzing RWE related to healthcare utilization offers accurate insights into treatment effectiveness based on routine clinical practice by including diverse patient populations that are often excluded from clinical trials. This approach enhances the generalizability of findings. Additionally, patient preferences and trends can be identified using big data-based healthcare utilization status. This insight can inform evidence-based decision-making by policymakers on resource allocation and healthcare utilization guidelines.
However, to our knowledge, although KMHC is actively used in patients with IVDD owing to limitations in CMHC and patient preferences [5,9], real-world data on its usage status and factors have not been analyzed. Although a previous study [9] examined KMHC utilization using the 2017 Korean Medicine Utilization and Herbal Medicine Consumption Survey data targeting 5000 Korean citizens, the analysis was limited to reporting simple utilization rates according to the presence or absence of several musculoskeletal diseases. That study did not examine factors associated with KMHC use and did not specifically focus on the population with IVDD, limiting insights into this patient group. Therefore, this study aims to derive RWE on the current status and factors associated with KMHC use in patients with IVDD.
2. Materials and Methods
2.1. Data Source and Study Participants
In this study, data from the 2022 Korea Health Panel Survey (KHPS) conducted by the Korea Institute for Health and Social Affairs and the National Health Insurance Service were used. The KHPS is an annual nationwide panel survey that collects data on healthcare utilization, healthcare costs, demographic characteristics, social and economic characteristics, health status, and health behavior. Data collection was conducted using the Computer Assisted Personal Interviewing method, involving a face-to-face interview where the researcher visited target households and conducted the survey using a laptop while administering the questionnaire. To ensure national representativeness, the KHPS sample was selected using a stratified two-stage cluster sampling method. KHPS data are anonymized and publicly available on the official website (https://www.khp.re.kr, accessed on 10 June 2024). This study received a protocol review exemption, which was approved by the Institutional Review Board of the Korea Institute of Oriental Medicine (IRB No. I-2403/003-004).
Data from the 2022 Korea Health Panel Survey (KHPS) were used for this study. Participants were included if they were adults (≥19 years) who received outpatient care for IVDD within the past year for any purpose such as treatment, examination, rehabilitation, monitoring, or prescription. Among the 13,799 respondents in the 2022 KHPS, 10,931 adults aged 19 years or older were initially selected. Of these, 536 participants who had made outpatient visits for IVDD within the past year were initially identified. After excluding 41 participants with missing values in the survey data, the final sample included 495 participants, comprising 84 KMHC-only users, 106 both KMHC and CMHC users, and 305 CMHC-only users (Figure 1).
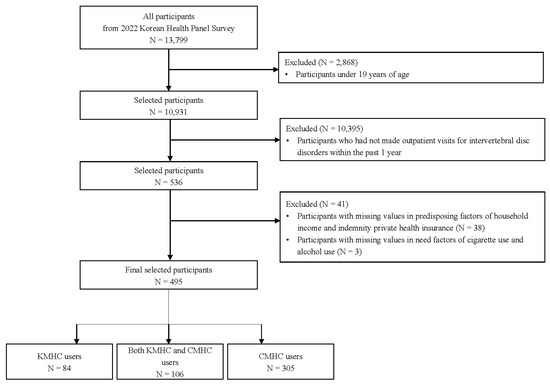
Figure 1.
Flow chart of study sample selection. CMHC, conventional medicine healthcare; KMHC, Korean medicine healthcare.
2.2. Outcome and Explanatory Variables
The primary outcome was whether individuals had utilized KMHC for IVDD in an outpatient visit within the past 1 year. This was classified into three categories, namely KMHC-only, both KMHC and CMHC, and CMHC-only uses. The participants were asked to report their healthcare utilization history over the past year and provide receipts for these visits. The researchers then reviewed the healthcare usage records and receipts.
The explanatory variables for KMHC use for outpatient visits for IVDD were determined using Andersen’s behavioral model of health service use [16,17,18,19]. These variables were classified into three categories, namely predisposing, enabling, and need factors, following their theoretical framework. Predisposing, enabling, and need factors refer to individual characteristics before using health services, the ability of the individual to access health services, and the perceived and assessed health status, respectively [20,21,22,23]. Predisposing factors included sex, age, region, education level, and marital status. Enabling factors included the number of household members, household income, private indemnity health insurance, and employment status. Need factors included disability (as registered with the Korean Ministry of Health and Welfare), perceived health status, perceived stress, depressed mood, regular physical activities, alcohol consumption, cigarette use, body mass index, presence of arthritis, shoulder joint diseases, and other spine-related diseases, and the number of chronic diseases. The number of chronic diseases was categorized according to the number of the following diseases: hypertension, diabetes mellitus, liver disease, malignant neoplasm, cardio-cerebrovascular disease, chronic lower respiratory disease, thyroid dysfunction, dementia, and chronic renal failure.
2.3. Statistical Analysis
All statistical analyses utilized survey sampling weights to account for the complex survey design of the KHPS, ensuring that estimates are representative of the target population, the Korean populace. All statistical analyses were conducted using R version 4.4.1 (R Foundation for Statistical Computing, Vienna, Austria) and the complex samples procedure in IBM SPSS Statistics for Windows, version 29.0 (IBM Corp., Armonk, NY, USA). For data management, transformation, and visualization, we additionally utilized several R packages such as base R, haven, stringr, dplyr, tidyr, magrittr, purrr, ggplot2, and scales. All statistical analyses were two-tailed, and statistical significance was defined as p < 0.05. The same significance threshold was applied consistently across all analyses and tables.
To compare differences in general characteristics among healthcare user groups for IVDD, Rao-Scott Chi-square tests were employed for complex survey design. Results were summarized as unweighted frequencies and weighted column proportions. To identify factors associated with healthcare utilization for IVDD, multinomial logistic regression analyses were conducted using sampling weights as the outcome was classified into three categories: KMHC-only use, both KMHC and CMHC use, and CMHC-only use [24]. First, crude analyses were conducted using multinomial logistic regression with an individual explanatory variable. Three models were then constructed using multinomial logistic regression with combined explanatory variables by sequentially adding predisposing, enabling, and need factors. The results were presented as odds ratios with 95% confidence intervals. To assess differences in healthcare services among healthcare user groups for IVDD, Rao-Scott Chi-square tests and general linear model analyses were used for categorical and continuous variables, respectively. The results were summarized as unweighted frequencies with weighted column proportions for categorical variables and as means with standard errors for continuous variables.
3. Results
3.1. General Characteristics of Users of Healthcare for Intervertebral Disc Disease
In total, 495 individuals participated in this study, including 188 men and 307 women. Significant differences were observed among the three healthcare user groups—KMHC-only, both KMHC and CMHC, and CMHC-only users—in age, region, regular physical activities, shoulder joint diseases, and other spine-related diseases. The proportion of individuals aged 45–59 years was the highest among CMHC-only users (weighted proportion: 47.1%), whereas the proportion of individuals aged 60–74 years was the highest among both KMHC and CMHC users (33.66%) and KMHC-only users (28.95%). The proportion of residents in Daejeon/Sejong/Chungcheong was the lowest among CMHC-only users (8.79%) and KMHC-only users (14.18%), while the proportion of residents in Gwangju/Jeolla/Jeju was the lowest in both KMHC and CMHC users (15.6%). The proportion of individuals engaging in regular physical activities was higher in KMHC-only users (63.49%) and both KMHC and CMHC users (61%) than in CMHC-only users (46.84%). The proportion of individuals with shoulder joint diseases was lower in both KMHC and CMHC users (3.75%) and CMHC-only users (4.13%) than in KMHC-only users (15.1%). The proportion of individuals with other spine-related diseases was lower in both KMHC and CMHC users (10.3%) and CMHC-only users (14.24%) than in KMHC-only users (30.2%) (Table 1).

Table 1.
General characteristics of healthcare user groups with outpatient visits for intervertebral disc disease.
3.2. Factors Associated with Healthcare Use for Intervertebral Disc Disease
In crude analyses, significant associations were observed between individual explanatory variables and healthcare use for IVDD. Both KMHC and CMHC use relative to CMHC-only use was observed to be significantly associated with age (45–59, crude odds ratio [95% confidence interval], 0.4 [0.16, 0.96]), disability (0.32 [0.11, 0.9]), and perceived health status (Poor/Very poor, 2.93 [1.16, 7.41]). KMHC-only use relative to CMHC-only use was identified to be significantly associated with region (Gwangju/Jeolla/Jeju, 3.48 [1.57, 7.7]), marital status (Widowed/Divorced/Separated/Never married, 2.25 [1.1, 4.59]), number of household members (4 or more, 0.32 [0.13, 0.82]), regular physical activities (1.97 [1.01, 3.84]), shoulder joint diseases (4.13 [1.56, 10.94]), and other spine-related diseases (2.61 [1.25, 5.44]). There were some changes in the variables associated with healthcare use for IVDD after adjusting sequentially for predisposing, enabling, and need factors. In adjusted model 1, adjusted for combined explanatory variables of predisposing factors, age (45–59, adjusted odds ratio [95% confidence interval], 0.33 [0.12, 0.93]), and education level (Middle/High school, 2.21 [1.03, 4.73]) were significantly associated with both KMHC and CMHC use relative to that of CMHC-only use, while the region (Gwangju/Jeolla/Jeju, 3.72 [1.57, 8.77]) was associated with KMHC-only use relative to that of CMHC-only use. In adjusted model 2, adjusted for combined explanatory variables of predisposing and enabling factors, both KMHC and CMHC use relative to CMHC-only use was observed to be significantly associated with age (45–59, 0.33 [0.12, 0.91]), while KMHC-only use relative to CMHC-only use was observed to be significantly associated with age (75 or older, 4.74 [1.11, 20.19]) and region (Gwangju/Jeolla/Jeju, 5.37 [2.13, 13.5]) (Table S1).
In a fully adjusted model for combined explanatory variables of predisposing, enabling, and need factors, both KMHC and CMHC uses relative to CMHC-only uses were significantly associated with age, region, employment status, disability, and perceived health status. Individuals aged 45–59 years were less inclined to use both KMHC and CMHC for IVDD compared to those aged 19–44 years (0.28 [0.09, 0.89]). Residents in Daejeon/Sejong/Chungcheong (2.5 [1.04, 6.02]) and Gwangju/Jeolla/Jeju (2.95 [1.23, 7.09]) were more inclined to use both KMHC and CMHC in IVDD compared to residents in Seoul/Incheon/Gyeonggi/Gangwon. The employed had a higher tendency to use both KMHC and CMHC for IVDD compared to unpaid family workers or the unemployed (2.37 [1.06, 5.3]). People with disabilities were less inclined to use both KMHC and CMHC for IVDD compared to those without disabilities (0.27 [0.09, 0.81]). Individuals who perceived their health status as fair (3.05 [1.17, 8]) or poor/very poor (6.13 [2.04, 18.45]) were more inclined to use both KMHC and CMHC for IVDD compared to those who perceived their health status as very good/good. KMHC-only use relative to CMHC-only use was significantly associated with the region, regular physical activities, shoulder joint diseases, and other spine-related diseases. Residents in Gwangju/Jeolla/Jeju exhibited a higher tendency to use KMHC-only for IVDD compared to those who live in Seoul/Incheon/Gyeonggi/Gangwon (4.61 [1.67, 12.75]). Individuals who engaged in regular physical activities were more inclined to use KMHC-only for IVDD compared to those who did not engage in regular physical activities (2.65 [1.19, 5.9]). Individuals who were suffering from musculoskeletal disorders, including shoulder joint diseases (3.71 [1.22, 11.29]) and other spine-related diseases (2.63 [1.16, 5.96]) exhibited a higher tendency to use KMHC-only for IVDD compared to individuals without these conditions (Table 2 and Figure 2).
Table 2.
Factors associated with healthcare use in outpatient visits for intervertebral disc disease.
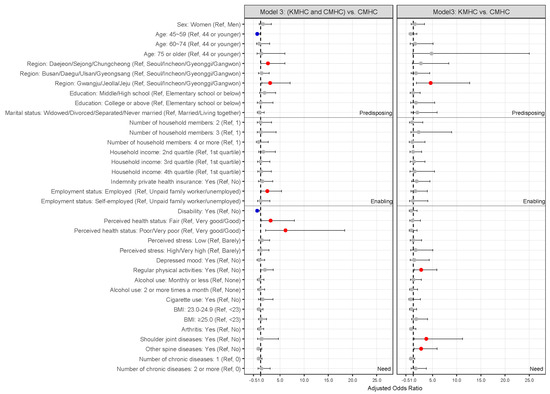
Figure 2.
Odds ratios plot with 95% confidence intervals for factors associated with healthcare use for IVDD in fully adjusted model. Red dots indicate statistically significant positive associations (odds ratio > 1), blue dots indicate statistically significant negative associations (odds ratio < 1), and gray dots indicate non-significant associations. BMI, body mass index; CMHC, conventional medicine healthcare; KMHC, Korean medicine healthcare; IVDD, intervertebral disc disease.
3.3. Healthcare Services for Patients with Intervertebral Disc Disease
Among KMHC services for IVDD, the most commonly performed treatment was acupuncture (92.81%), followed by physical therapy (90.54%), cupping therapy (27.46%), pharmacopuncture (27.35%), herbal decoction (13.94%), and chuna manual therapy (13.74%). In KMHC-only users, acupuncture (91.93%) was the most prevalent treatment, followed by physical (84.79%) and cupping therapies (30%). In both KMHC and CMHC users, physical therapy (93.85%) was the most commonly used, followed by acupuncture (93.32%) and pharmacopuncture (31.61%). No statistically significant differences were observed between both KMHC and CMHC users and KMHC-only users in Korean medicine healthcare services, copayment per visit, or annual number of healthcare uses for IVDD (Table 3).
Table 3.
Korean medicine healthcare services for KHMC-only users and both KMHC and CMHC users.
Among CMHC services for IVDD, the most commonly used healthcare service was physical therapy (66.41%), followed by high-cost imaging tests (26.48%), manual therapy (14.42%), and intravenous injections (9.98%). In both KMHC and CMHC users, physical therapy (78.51%) was the most frequently used, followed by high-cost imaging tests (40.27%) and intravenous injections (17.23%). In CMHC-only users, physical therapy (62.41%) was the most prevalent treatment, followed by high-cost imaging tests (21.92%) and manual therapy (16.38%). Significant differences in CMHC services (high-cost imaging tests, intravenous injections, and physical therapy) were observed between both KMHC and CMHC users and CMHC-only users. Conversely, no significant differences were observed in copayment per visit or the annual number of healthcare uses for IVDD (Table 4).
Table 4.
Conventional medicine healthcare services for CMHC-only users and both KMHC and CMHC users.
4. Discussion
This study aimed to derive RWE on the utilization of KMHC among patients with IIVDD and to identify the factors influencing KMHC use. Using nationally representative data from the 2022 KHPS, 495 patients who received outpatient medical care for IVDD within the past 1 year were analyzed. We found that employment status, perceived health, physical activity, and comorbid musculoskeletal conditions were key determinants of KMHC utilization. While a previous study shows the factors affecting KMHC use in patients with musculoskeletal disorders, the study was conducted in 2009 and analyzed overall musculoskeletal disorders rather than specific diseases [25]. Consequently, its current applicability has limitations.
According to Andersen’s theoretical framework, the sequential input of predisposing, enabling, and need factors in healthcare utilization models reflects their temporal order [20]. An individual’s use of medical services is based on basic predisposition factors, with additional enabling factors increasing the likelihood of use, and ultimately, need factors that lead to healthcare utilization [20]. By constructing models sequentially, the independent and step-by-step influence of each factor can be identified [20,26]. Additionally, the complex mechanisms of medical service utilization can be better understood by observing changes in significant variables across models [20,26]. In our study, education level was significantly associated with both KMHC and CMHC use relative to CMHC-only use in adjusted model 1. However, it was not significant in adjusted model 2 with additional enabling factors, suggesting that the effect of education level operates through enabling factors such as income or insurance. Variables that remain significant in the final model can be prioritized for policy intervention.
In fully adjusted model, among the predisposing factors influencing KMHC use in patients with IVDD, individuals aged 45–59 years were less inclined to use both KMHC and CMHC relative to CMHC-only compared to those aged 19–44 years. This may reflect a greater health consciousness among younger adults than among middle-aged adults and thus attempting more active and diverse treatments such as using both KMHC and CMHC [27,28]. These findings suggest that targeted awareness campaigns for middle-aged adults may help promote more informed and diversified healthcare choices among this group. Additionally, while no statistically significant difference was observed, patients with IVDD aged ≥75 years were more inclined to use KMHC-only compared to those aged 19–44 years. This observation may be explained by the presence of musculoskeletal conditions (e.g., osteoarthritis, disc-related disease, and back pain) as common reasons for KMHC use among older patients [29]. However, our study is meaningful in that it showed that age-related trends can be observed even when controlling for other chronic diseases in IVDD patients. Moreover, individuals > 75 years old may prefer KMHC—a non-surgical and relatively safe treatment option—owing to concerns about surgical treatment risks and medication-related adverse events [30,31]. Additionally, patients with IVDD residing in Daejeon/Sejong/Chungcheong were more inclined to use both KMHC and CMHC compared to those in Seoul/Incheon/Gyeonggi/Gangwon, and patients residing in Gwangju/Jeolla/Jeju tended to use KMHC-only or both KMHC and CMHC compared to those in Seoul/Incheon/Gyeonggi/Gangwon. The regional pattern observed in this study contrasts with earlier nationwide findings that reported greater KHMC use in Seoul [32]. This discrepancy may be explained by improved accessibility to Korean medicine services in regional areas, higher cultural preference for traditional medicine among older populations, and recent policy initiatives by local governments expanding support for KMHC. However, in that study [32], the results were analyzed regardless of disease, whereas, in this study, patients with IVDD were targeted, suggesting that regional preferences for KMHC may vary by region based on the disease of the patient.
As an enabling factor, employed patients with IVDD tended to use both KMHC and CMHC relative to CMHC-only more, compared to unpaid family workers or unemployed patients. This may be attributed to the increased medical costs as treatment types increased in both KMHC and CMHC users [33]. In this study, our findings indicated that the annual copayment of medical expenses for KMHC and CMHC utilization for IVDD was higher among both KMHC and CMHC users than among KMHC-only and CMHC-only users.
As a need factor, patients with IVDD with disabilities registered under the Korean Ministry of Health and Welfare—such as physical disability, developmental disability, and epilepsy—were less inclined to use both KMHC and CMHC relative to CMHC-only compared to those without disabilities. For patients with severe disabilities, engaging in normal economic activities might be challenging, while the cost of treating the disabilities might be significantly high [34]. Additionally, since they are already on a lot of medication and receiving treatment for their disability, receiving additional treatment for IVDD might be financially and physically burdensome. Providing targeted subsidies for disabled patients may help reduce financial barriers and encourage appropriate KMHC use. Patients with poorer perceived health status were more likely to use both KMHC and CMHC than CMHC only. This finding is consistent with previous research showing that individuals who perceive their health as poor tend to seek more active or diverse treatment options due to greater concern about their health [35]. Conversely, those already using both healthcare systems may perceive their health as poorer because of persistent or chronic symptoms. Therefore, potential reverse causality should be considered when interpreting these associations. Patients who engaged in regular physical activity were more inclined to use KMHC-only rather than CMHC-only for IVDD compared to patients who did not. Furthermore, patients who are concerned about their health and manage it via regular exercise might prefer KMHC. Patients with IVDD with shoulder joint or other spinal-related diseases such as spinal stenosis were more inclined to use KMHC-only relative to CMHC-only compared to those patients without such diseases. The KMHC—including acupuncture and herbal medicine—is actively employed globally in treating musculoskeletal disorders [36]. In Korea, musculoskeletal disorders remain a major disease condition that often causes visits to Korean medicine clinics [5,9]. Additionally, satisfaction with KMHC use for patients with musculoskeletal disorders is reported to be high [9,13].
No statistically significant differences were observed in the treatment contents and the annual number of healthcare uses of KMHC between KMHC-only users and those using both KMHC and CMHC. Both KMHC and CMHC users utilized conventional treatments more, including high-cost imaging tests such as MRI and computed tomography, intravenous injections, and physical therapy—compared to CMHC-only users. Additionally, although statistically insignificant, both KMHC and CMHC users tended to have higher copayments per visit for KMHC and CMHC, respectively, compared to those of KMHC-only and CMHC-only users. The higher medical expenses for KMHC among both KMHC and CMHC users might be attributed to the increased use of herbal decoction and pharmacopuncture, which are not covered by health insurance. Additionally, both KMHC and CMHC users utilized more high-cost imaging equipment compared to CMHC-only users, suggesting that the severity of IVDD might have been higher in both KMHC and CMHC users, necessitating more aggressive treatment. However, caution is needed in interpretation since the KHPS did not investigate the severity of IVDD and no information was provided on the amount of contribution of the insurer.
A key limitation of this study is that, as this study analyzed cross-sectional data from a single year, causal relationships cannot be inferred, and the associations identified could be bidirectional. Second, the KHPS dataset lacks detailed clinical information such as MRI grades, pain scales (e.g., Visual Analogue Scale scores), and disease duration, which may confound the observed associations. While we analyzed comorbid spine-related diseases and the use of high-cost imaging tests (MRI, CT), these cannot be considered adequate proxies for IVDD severity. Future studies incorporating objective clinical indicators of IVDD are warranted to better clarify these associations. Third, to prevent missing data related to medical use, patients were required to fill out a health household account book regarding their medical use. Additionally, various data, such as receipts for medical expenses and year-end settlements, were collected. However, it was challenging to determine the total medical expenses due to the absence of responses regarding the insurance burden for a significant number of patients. Future studies should analyze medical cost components such as patients’ copayments and insurance burden in detail to provide data with policy implications, thereby enhancing the applicability of the findings.
Nonetheless, given the high preference and widespread use of KMHC for IVDD [5,9,13], this study holds significance as the first to analyze RWE using nationwide representative sample data from Korea. The application of RWE in the medical field has recently expanded rapidly, supporting drug development, policy decisions, and treatment outcome analysis [15]. In Korea, dorsalgia, a primary symptom of IVDD, is among the most commonly treated symptoms with KMHC. However, patients with musculoskeletal disorders have expressed concerns about the expensive cost of KMHC [5,9]. Therefore, health insurance coverage for chuna manual therapy was extended to musculoskeletal diseases in 2019 in Korea. Furthermore, a pilot project is currently underway to expand health insurance coverage for herbal decoctions for lumbar disc herniation, reflecting public demand [9]. As health insurance coverage for KMHC in IVDD expands, the findings of this study can help policymakers make decisions related to the fair distribution of health insurance finances in the future. Additionally, the utilization status and factors of KMHC in patients with IVDD identified in this study can be utilized as variables and subgroup analysis plans when planning future clinical studies on IVDD.
In future studies, integrating longitudinal KHPS data or clinical registries would enable trend analyses and causal inference regarding KMHC utilization for IVDD. Moreover, combining KHPS data with other data sources, such as hospital registries or clinical databases, could facilitate the inclusion of objective indicators (e.g., MRI findings or pain scores), thereby improving the accuracy of disease severity assessment. Future research could include cost-effectiveness comparisons between KMHC and CMHC interventions and incorporate expected treatment durations to better contextualize clinical effectiveness. Establishing standardized KMHC protocols, including acupuncture frequency, session duration, and herbal formula components, would further enhance the reproducibility and practical applicability of the findings. Furthermore, extending this research to international contexts such as China or the United States—where traditional and complementary medicine utilization patterns differ [37,38]—could offer valuable comparative insights into policy integration and patient behavior.
5. Conclusions
The study identified significant demographic and health-related factors influencing the use of KMHC for IVDD. Specifically, individuals who were employed, had poorer perceived health, or had additional musculoskeletal conditions (e.g., shoulder or other spine diseases) were more likely to choose KMHC. These results provide insight into patient behavior and may help guide more effective healthcare planning and resource allocation for KMHC. Future research should employ longitudinal designs to clarify causal relationships and further evaluate the benefits of KHMC.
Supplementary Materials
The following supporting information can be downloaded at: https://www.mdpi.com/article/10.3390/healthcare13212661/s1, Table S1: Factors associated with healthcare use in outpatient visits for intervertebral disc disease using predisposing and enabling factors.
Author Contributions
Conceptualization, B.L. and M.H.Y.; methodology, B.L. and M.H.Y.; formal analysis, M.H.Y.; writing—original draft preparation, B.L. and M.H.Y.; writing—review and editing, B.L., J.-S.J. and M.H.Y.; funding acquisition, J.-S.J. All authors have read and agreed to the published version of the manuscript.
Funding
This research was supported by a grant from the Korea Health Technology R&D Project through the Korea Health Industry Development Institute (KHIDI), funded by the Ministry of Health & Welfare, Republic of Korea (grant number: RS-2021-KH110758). The funding source does not have any influence on the interpretation or publication of the study results.
Institutional Review Board Statement
Ethical review and approval were waived for this study, which received a protocol review exemption approved by the Institutional Review Board of the Korea Institute of Oriental Medicine (IRB No. I-2403/003-004, from 19 March 2024), due to the use of publicly available anonymized data from the Korea Health Panel Survey.
Informed Consent Statement
Patient consent was waived because the study was conducted using publicly available anonymized data from the Korea Health Panel Survey.
Data Availability Statement
The data presented in this study are openly available in Korea Health Panel Survey (KHPS) at https://www.khp.re.kr:444/web/data/board/dataDownload.do?pageIndex=1&bbsid=107&keyField=&key=, accessed on 10 June 2024.
Conflicts of Interest
The authors declare no conflicts of interest.
Abbreviations
The following abbreviations are used in this manuscript:
| CMHC | Conventional medicine healthcare |
| DDD | Degenerative disc disease |
| IVDD | Intervertebral disc disease |
| KHPS | Korea Health Panel Survey |
| KMHC | Korean medicine healthcare |
| MRI | Magnetic resonance imaging |
| RWE | Real-world evidence |
References
- Wu, P.H.; Kim, H.S.; Jang, I.T. Intervertebral Disc Diseases PART 2: A Review of the Current Diagnostic and Treatment Strategies for Intervertebral Disc Disease. Int. J. Mol. Sci. 2020, 21, 2135. [Google Scholar] [CrossRef]
- MedlinePlus. Bethesda (MD): National Library of Medicine (US). Intervertebral Disc Disease. Available online: https://medlineplus.gov/genetics/condition/intervertebral-disc-disease/ (accessed on 13 November 2024).
- Katz, J.N. Lumbar disc disorders and low-back pain: Socioeconomic factors and consequences. J. Bone Joint Surg. Am. 2006, 88 (Suppl. 2), 21–24. [Google Scholar] [CrossRef]
- Donnally, C.J., III.; Hanna, A.; Varacallo, M. Lumbar Degenerative Disk Disease. In StatPearls; StatPearls Publishing: Treasure Island, FL, USA, 2024. Available online: https://www.ncbi.nlm.nih.gov/books/NBK448134/ (accessed on 19 November 2024).
- HIRA Bigdata Open Portal. Statistics of Frequent Diseases. Available online: https://opendata.hira.or.kr/op/opc/olapHifrqSickInfoTab1.do (accessed on 13 November 2024).
- Medical Advisory Secretariat. Artificial discs for lumbar and cervical degenerative disc disease-update: An evidence-based analysis. Ont. Health Technol. Assess. Ser. 2006, 6, 1–98. [Google Scholar]
- Zhao, X.M.; Chen, A.F.; Lou, X.X.; Zhang, Y.G. Comparison of Three Common Intervertebral Disc Discectomies in the Treatment of Lumbar Disc Herniation: A Systematic Review and Meta-Analysis Based on Multiple Data. J. Clin. Med. 2022, 11, 6604. [Google Scholar] [CrossRef]
- Gugliotta, M.; da Costa, B.R.; Dabis, E.; Theiler, R.; Jüni, P.; Reichenbach, S.; Landolt, H.; Hasler, P. Surgical versus conservative treatment for lumbar disc herniation: A prospective cohort study. BMJ Open 2016, 6, e012938. [Google Scholar] [CrossRef] [PubMed]
- Sung, A.D.; Choi, S.Y.; Park, M.; Sung, S.-H. A Study on the Characteristics of the Awareness and Satisfication Level of Musculoskeletal Patients and Non-Musculoskeletal Patients that Use Korean Medical Institutions. J. Soc. Prev. Korean Med. 2020, 24, 27–38. [Google Scholar]
- Park, Y.; Goo, B.; Lee, S.; Baek, Y.; Nam, S.; Kim, D.; Jo, D.; Kim, K.; Kim, S.; Seo, B. Integrative treatment package for degenerative disc disease in the lumbar spine: A retrospective case series. Eur. J. Integr. Med. 2018, 19, 10–16. [Google Scholar] [CrossRef]
- Lee, N.W.; Lee, J.; Yun, J.M.; Kim, S.; Chung, W.S. Integrative Medicine Focusing on Ultrasound-Guided High-Dose Shinbaro 2 Pharmacopuncture for Acute Herniated Intervertebral Discs: A Case Report. Healthcare 2024, 12, 1620. [Google Scholar] [CrossRef]
- Lim, K.-T.; Hwang, E.-H.; Cho, J.-H.; Jung, J.-Y.; Kim, K.-W.; Ha, I.-H.; Kim, M.-r.; Nam, K.; Lee, A.M.h.; Lee, J.-H.; et al. Comparative effectiveness of Chuna manual therapy versus conventional usual care for non-acute low back pain: A pilot randomized controlled trial. Trials 2019, 20, 216. [Google Scholar] [CrossRef]
- Park, J.H.; Choi, K.E.; Kim, S.G.; Chu, H.Y.; Lee, S.W.; Kim, T.J.; Cho, H.W.; Kim, S.D.; Park, K.S.; Lee, Y.J.; et al. Long-Term Follow-Up of Inpatients with Failed Back Surgery Syndrome Who Received Integrative Korean Medicine Treatment: A Retrospective Analysis and Questionnaire Survey Study. J. Clin. Med. 2021, 10, 1703. [Google Scholar] [CrossRef]
- Sherman, R.E.; Anderson, S.A.; Dal Pan, G.J.; Gray, G.W.; Gross, T.; Hunter, N.L.; LaVange, L.; Marinac-Dabic, D.; Marks, P.W.; Robb, M.A.; et al. Real-World Evidence—What Is It and What Can It Tell Us? N. Engl. J. Med. 2016, 375, 2293–2297. [Google Scholar] [CrossRef]
- Burns, L.; Le Roux, N.; Kalesnik-Orszulak, R.; Christian, J.; Dudinak, J.; Rockhold, F.; Khozin, S.; O’Donnell, J. Real-world evidence for regulatory decision-making: Updated guidance from around the world. Front. Med. 2023, 10, 1236462. [Google Scholar] [CrossRef]
- Andersen, R.M. Revisiting the behavioral model and access to medical care: Does it matter? J. Health Soc. Behav. 1995, 36, 1–10. [Google Scholar] [CrossRef]
- Gelberg, L.; Andersen, R.M.; Leake, B.D. The Behavioral Model for Vulnerable Populations: Application to medical care use and outcomes for homeless people. Health Serv. Res. 2000, 34, 1273–1302. [Google Scholar] [PubMed]
- Andersen, R.M. National health surveys and the behavioral model of health services use. Med. Care 2008, 46, 647–653. [Google Scholar] [CrossRef] [PubMed]
- Andersen, R.M.; Davidson, P.L.; Baumeister, S.E. Improving access to care. In Changing the U.S. Health Care System: Key Issues in Health Services Policy and Management, 4th ed.; Kominski, G.F., Ed.; Jossey-Bass: San Francisco, CA, USA, 2013. [Google Scholar]
- Andersen, R.; Newman, J.F. Societal and individual determinants of medical care utilization in the United States. Milbank Mem. Fund. Q. Health Soc. 1973, 51, 95–124. [Google Scholar] [CrossRef] [PubMed]
- Aday, L.A.; Andersen, R. A framework for the study of access to medical care. Health Serv. Res. 1974, 9, 208–220. [Google Scholar]
- Wan, T.T.; Yates, A.S. Prediction of dental services utilization: A multivariate approach. Inquiry 1975, 12, 143–156. [Google Scholar]
- Chern, J.Y.; Wan, T.T.; Begun, J.W. A structural equation modeling approach to examining the predictive power of determinants of individuals’ health expenditures. J. Med. Syst. 2002, 26, 323–336. [Google Scholar] [CrossRef]
- El-Habil, A.M. An application on multinomial logistic regression model. Pak. J. Stat. Oper. Res. 2012, 8, 271–291. [Google Scholar] [CrossRef]
- Wang, B.R.; Choi, I.Y.; Kim, K.J.; Kwon, Y.D. Use of traditional Korean medicine by patients with musculoskeletal disorders. PLoS ONE 2013, 8, e63209. [Google Scholar] [CrossRef]
- Krzyż, E.Z.; Antunez Martinez, O.F.; Lin, H.R. Uses of Andersen health services utilization framework to determine healthcare utilization for mental health among migrants-a scoping review. Front. Public Health 2023, 11, 1284784. [Google Scholar] [CrossRef]
- Collier Villaume, S.; Chen, S.; Adam, E.K. Age Disparities in Prevalence of Anxiety and Depression Among US Adults During the COVID-19 Pandemic. JAMA Netw. Open 2023, 6, e2345073. [Google Scholar] [CrossRef]
- Laryionava, K.; Heußner, P.; Hiddemann, W.; Winkler, E.C. “Rather one more chemo than one less…”: Oncologists and Oncology Nurses’ Reasons for Aggressive Treatment of Young Adults with Advanced Cancer. Oncologist 2018, 23, 256–262. [Google Scholar] [CrossRef]
- Sung, A.D.; Baik, Y.S.; Jang, S.; Park, J.K.; Sung, H.K.; Lee, J.Y.; Shin, B.C.; Choi, S.Y.; Sung, S.H. Utilization of Traditional Korean Medicine Services by the Older Population: A Cross-Sectional Study. Healthcare 2022, 10, 1444. [Google Scholar] [CrossRef] [PubMed]
- Turrentine, F.E.; Wang, H.; Simpson, V.B.; Jones, R.S. Surgical risk factors, morbidity, and mortality in elderly patients. J. Am. Coll. Surg. 2006, 203, 865–877. [Google Scholar] [CrossRef] [PubMed]
- Zazzara, M.B.; Palmer, K.; Vetrano, D.L.; Carfì, A.; Onder, G. Adverse drug reactions in older adults: A narrative review of the literature. Eur. Geriatr. Med. 2021, 12, 463–473. [Google Scholar] [CrossRef] [PubMed]
- Jung, B.; Kim, J.; Ha, I.H.; Lee, J. Factors affecting utilisation of traditional Korean medical services by privately insured persons: A retrospective study using Korean Health Panel Survey (KHPS). BMJ Open 2020, 10, e033159. [Google Scholar] [CrossRef]
- Jang, H.-J.; Hong, S.-M.; Park, Y.-S.; Nam, D.-W.; Lim, D.-I.; Lee, J.-D.; Lee, Y.-H.; Lim, S. Economic evaluation of Eastern, Western and collaborative treatments for patients with frozen shoulder pain. J. Korean Med. 2007, 28, 72–86. [Google Scholar]
- Shin, J. Determinants of unmet healthcare needs among the community-dwelling Korean adults with disabilities: A case of the national health insurance beneficiaries. Health Soc. Welf. Rev. 2013, 33, 549–577. [Google Scholar] [CrossRef]
- Yim, M.H.; Lee, B. Factors affecting the use of herbal medicines for weight loss in overweight and obese adolescents. Front. Pediatr. 2023, 11, 1166786. [Google Scholar] [CrossRef]
- Bhoi, D.; Jain, D.; Garg, R.; Iyengar, K.P.; Hoda, W.; Vaishya, R.; Jain, V.K. Complementary and Alternative Modalities (CAM) for pain management in musculoskeletal diseases (MSDs). J. Clin. Orthop. Trauma 2021, 18, 171–180. [Google Scholar] [CrossRef] [PubMed]
- Chen, F.P.; Chen, T.J.; Kung, Y.Y.; Chen, Y.C.; Chou, L.F.; Chen, F.J.; Hwang, S.J. Use frequency of traditional Chinese medicine in Taiwan. BMC Health Serv. Res. 2007, 7, 26. [Google Scholar] [CrossRef] [PubMed]
- Clarke, T.C.; Black, L.I.; Stussman, B.J.; Barnes, P.M.; Nahin, R.L. Trends in the use of complementary health approaches among adults: United States, 2002–2012. Natl. Health Stat. Rep. 2015, 79, 1–16. [Google Scholar]


Disclaimer/Publisher’s Note: The statements, opinions and data contained in all publications are solely those of the individual author(s) and contributor(s) and not of MDPI and/or the editor(s). MDPI and/or the editor(s) disclaim responsibility for any injury to people or property resulting from any ideas, methods, instructions or products referred to in the content. |
© 2025 by the authors. Licensee MDPI, Basel, Switzerland. This article is an open access article distributed under the terms and conditions of the Creative Commons Attribution (CC BY) license (https://creativecommons.org/licenses/by/4.0/).