Abstract
Background/Objectives: The longitudinal associations between different modalities of sedentary behaviors (SBs) and sedentary patterns (SPs) with metabolic syndrome (MetS) in children and adolescents are unclear. We aimed to analyze the cross-sectional and longitudinal (2-year follow-up) association between SB and SP with the MetS score in Spanish children and adolescents. Methods: 76 children (34 females) and 186 adolescents (94 females) were included for SB analyses, and 175 children (82 females) and 188 adolescents (95 females) for SP. Children and adolescents were aged 6–11.9 years and 12–17.9 years, respectively. SB were assessed by a self-reported questionnaire and SP were determined by accelerometry. The MetS score was computed from the waist circumference, systolic blood pressure, triglycerides, high-density lipoprotein cholesterol, and glucose levels. Different linear regression models were implemented to examine cross-sectional, longitudinal, and change associations of SB and SP with MetS. Results: Total daily SB, educative daily SB, and mean SB were longitudinal and inversely associated with MetS (β = −0.001, all p < 0.05) in male adolescents, while other daily SB was longitudinal and inversely associated with MetS (β = −0.002, all p < 0.05) in female adolescents. Changes in screen and other daily SB were directly associated with MetS in female adolescents (β = 0.001 to 0.002, all p < 0.05). In contrast, changes in educative daily SB were inversely associated with MetS in female adolescents (β = −0.001, all p < 0.05). Conclusions: Few associations between SB modalities and the MetS score were found, mainly in adolescents and often in unexpected directions. In male adolescents, total and educative daily SB were negatively associated with MetS. In female adolescents, other daily SB and changes in educative daily SB showed negative associations, while changes in screen-based and other daily SB were positively associated with MetS. No associations were found between SP and MetS. Given the low evidence available to date, more longitudinal studies analyzing SB and SP simultaneously are needed to reach solid conclusions.
1. Introduction
Cardiovascular diseases (CVD) have persisted as the principal cause of mortality for more than three decades, representing nearly one-third of all deaths worldwide, with an estimated 20.5 million fatalities reported in 2021 [1]. Although CVD predominantly manifests after the fifth decade of life [2], its antecedents can already be identified during childhood [3]. Notably, CVD risk factors established in childhood and adolescence tend to persist into adulthood [4,5].
In this regard, the well-known metabolic syndrome (MetS) is defined as a cluster of risk factors for CVD and type 2 diabetes mellitus that occur together more often than by chance, strongly increasing the likelihood of developing CVD [6]. According to the International Diabetes Federation (IDF), MetS is defined by the presence of central obesity (waist circumference with ethnicity-specific values) plus any two of the following four factors: raised triglycerides (≥150 mg/dL or specific treatment), reduced high-density lipoprotein cholesterol (HDL-c; <40 mg/dL in men, <50 mg/dL in women or specific treatment), raised blood pressure (systolic ≥130 mmHg or diastolic ≥85 mmHg or treatment of previously diagnosed hypertension), and raised fasting plasma glucose (≥100 mg/dL or previously diagnosed type 2 diabetes) [7]. Recent evidence indicates that the prevalence of MetS is rising globally in tandem with increasing rates of obesity and sedentary behaviors, underlining its growing public health significance [8].
Several attempts have been made to define MetS in the pediatric population. However, the relatively low prevalence of CVD at these stages makes it difficult to define a discrete composite score of cardiovascular risk variables with sufficient capacity to predict future CVD [9]. Given this, various researchers have proposed the use of a continuous score that integrates multiple CVD risk factors into a single composite index, commonly referred to as the MetS score [10]. In this regard, a recent meta-analysis reported that the continuous MetS score represents a moderately accurate and cost-effective tool for predicting the risk of MetS in both young and adult populations [11]. Depending on the diagnostic criteria used, the prevalence of MetS cases among Spanish adolescents ranged from 5.5% to 14.9% in boys and from 3.4% to 32.6% in girls [12].
Sedentary behaviors (SB) have a fundamental role in the cardiovascular health of children and adolescents [13]. SB refers to any waking behavior characterized by an energy expenditure ≤ 1.5 metabolic equivalents, typically while in a sitting, reclining, or lying posture. Operationally, SB includes activities such as television viewing, computer use, or other screen-based entertainment performed while seated [14]. Beyond the total amount of sedentary time (ST), SB can also be characterized by modalities, which refer to the specific types of sedentary activities performed.
When analyzing SB modalities among the youth, most studies have focused on screen-based behaviors (i.e., TV viewing, video game and/or computer use). For instance, Carson et al. [15] reported that self-reported TV viewing and total screen time were unfavorably associated with body composition, clustered cardiometabolic risk, and behavioral conduct, with stronger evidence for television viewing than for other SB. Similarly, van Ekris et al. [16], concluded that childhood SB, especially screen time, was prospectively related to higher adiposity and unfavorable lipid and insulin profiles. Biddle et al. [17] further emphasized a likely causal relationship between sedentary screen behaviors and adiposity in youth, highlighting that the associations are more consistent and stronger for screen-based ST compared with total ST. In this line, SB, particularly screen-based activities, are highly prevalent among European youth. In the HELENA study, about one third of adolescents exceeded the recommended ≤2 h per day of screen time based solely on TV viewing during weekdays, and this prevalence increased to around 60% during weekends [18]. In Spain, findings from the ANIBES study confirmed this trend, showing that 48.4% of children and adolescents spent more than 2 h per day in front of a screen on average across the week, with 49.3% exceeding this threshold during weekdays and 84% during weekends [19]. However, screen time is only one SB modality, and there are a range of other modalities to consider, such as educative SB (i.e., reading or doing homework), social SB (i.e., listening to music or sitting and talking), or other SB (i.e., sitting doing nothing or motorized transport) [20]. Considering the full range of SB modalities provides a more complete picture of the lifestyle framework in relation to health-related variables [17]. Moreover, the majority of existing studies have explored the relationship between SB and MetS using cross-sectional designs [13], while evidence derived from longitudinal analyses remains limited.
Beyond ST and SB modalities, evidence from cross-sectional research indicates that sedentary patterns (SP), the manner in which ST accumulates (i.e., in blocks [bouts] of ≥10 min, ≥20 min, etc.), may play an important role in the associations with health measures, since shorter periods of ST appear to favor a healthier cardiometabolic profile [21,22]. In European children, ST tends to accumulate in short bouts (2–5 min) with fewer prolonged bouts (≥10 min), which are relatively uncommon [23]. To date, there is a limited number of longitudinal studies that examine ST using alternative grouping methods [24,25], and the duration of these studies is usually less than 2 years [26]. This lack of long-term evidence highlights the need for further research to clarify the role of ST and its patterns in youth cardiometabolic health. In addition, since previous studies have consistently reported sex- and age-related differences in SB and ST, stratifying analyses by these subgroups is warranted to provide a more accurate understanding of their associations with MetS [27,28,29].
The aims of the current study were (i) to analyze the cross-sectional and longitudinal associations between SB and SP with MetS risk in children and adolescents; (ii) to analyze associations between changes in SB and SP with MetS risk in children and adolescents.
2. Materials and Methods
2.1. Study Design and Population
The participants took part in the UP&DOWN study [30]. In brief, this 2-year longitudinal study aimed to assess the impact of physical activity (PA), SB, and health-related physical fitness on health indicators in Spanish youth. Schools were recruited through initial contact with headmasters and physical education teachers, followed by information sessions with parents and students. All students enrolled in 1st and 4th grades (6–7 and 9–10 years) in Cádiz and in 7th and 10th grades (12–13 and 15–16 years) in Madrid were invited to participate. Eligibility criteria included being apparently healthy, attending the participating schools, and having no physical disability or health condition that limited participation in PA.
The overall UP&DOWN cohort included 2264 participants (1226 children [580 girls] and 1038 adolescents [502 girls]). According to the Spanish Institute of National Statistics, the sample represents approximately 50% of schoolchildren in Cádiz and 5% of adolescents in Madrid. A random one-fourth of the cohort was invited to provide blood samples. The final baseline subsample with complete data on SB, body composition, systolic blood pressure (SBP), and blood biomarkers consisted of 104 children (45 girls) and 229 adolescents (110 girls). For SP, the corresponding baseline subsample comprised 229 children (106 girls) and 229 adolescents (110 girls).
Participants were followed for 2 years, with baseline data collected between September 2011 and June 2012 and follow-up data between September 2013 and June 2014. Only participants with complete baseline and follow-up data were included in the longitudinal analyses. After accounting for dropouts, the final analytical sample comprised 76 children (34 girls) and 186 adolescents (94 girls) for SB analyses (dropout rates of 26.9% and 18.8% in children and adolescents, respectively) and 175 children (82 girls) and 188 adolescents (95 girls) for SP analyses (dropout rates of 23.6% and 17.9%, respectively). Participants who withdrew from the study did so voluntarily. A descriptive comparison of baseline characteristics between participants who remained in the study and those who withdrew revealed no statistically significant differences in cardiometabolic, body composition, and PA variables. However, some differences were observed in sedentary behavior variables.
A diagrammatic representation of participant flow across study waves has been included (Figure 1). Written informed consent was provided by participants’ parents after being informed about the purposes of the study. The study protocol was accepted by the Ethics Committee of the Hospital Puerta del Hierro (Madrid, Spain), the Bioethics Committee of the National Spanish Research Council (Madrid, Spain) and the Committee for Research Involving Human Subjects of the University of Cádiz (Cádiz, Spain).
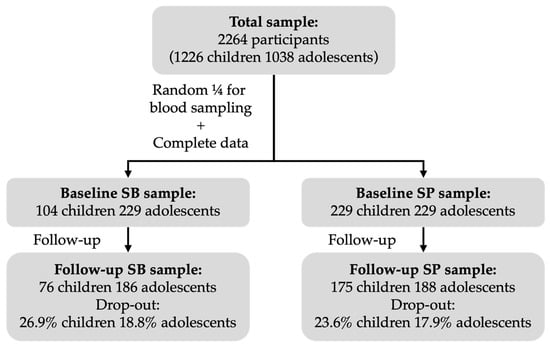
Figure 1.
Flow diagram of participants through the UP&DOWN study for SB and SP analyses.
2.2. Tanner Stage
Explicative drawings of breast and genital development for females and males, respectively, were given to all participants for self-classification in one of the five stages of pubertal development, according to Tanner & Whitehouse [31].
2.3. Blood Pressure
SBP was measured with a validated digital automatic blood pressure monitor (Omron M6; Omron Healthcare Co., Ltd., Kyoto, Japan) according to the standardized and valid International Protocol of the European Society of Hypertension [32]. Two measurements were taken 1 to 2 min apart. If the first two readings differed in >5 mmHg, an additional measurement was taken, and the farthest value was removed. The average value of the two measurements was selected.
2.4. Blood Sampling
In the morning, after an overnight fast, 13.5 mL of blood was drawn through the cubital vein of each participant. Once the blood was collected, it was immediately transported to standard laboratories in each city. About 3.5 mL of the blood sample was collected in ethylenediaminetetraacetic acid (EDTA) and analyzed to acquire hemogram data. The remaining blood was collected in dried gel and sodium citrate and centrifuged to remove serum and plasma. Finally, serum and plasma were frozen at −80 °C for future analyses. In the current study, enzymatic colorimetric methods (Olympus AU2700 Analyzer; Olympus UK Ltd., Watford, UK) were used to analyze serum lipid triglycerides, HDL-c, and glucose.
2.5. Body Composition
Weight and height were measured with an electronic scale (Type SECA 861; range, 0.05–130 kg; precision, 0.05 kg; Hamburg, Germany) and a telescopic stature-measuring instrument (Type SECA 225; range, 60–200 cm; precision, 1 mm; Hamburg, Germany), respectively. These measurements were conducted with participants dressed in lightweight clothing and without shoes. Body mass index (BMI) was calculated as weight/height squared (kg/m2). Waist circumference (WC) was measured at the level of the narrowest part of the torso using a non-elastic tape (SECA 200; range, 0 to 150 cm; precision, 1 mm; Hamburg, Germany).
2.6. Metabolic Syndrome
MetS score was created from the mean of the standardized values of each individual CVD risk factor (i.e., WC, SBP, triglycerides, HDL-c, and glucose) by age group (children and adolescents) and sex (males and females). This index has been previously used by the International Diabetes Federation to assess cardiovascular health in children and adolescents [33]. The standardized value for HDL-c was multiplied by (−1) since higher HDL-c levels represent lower CVD risk.
2.7. Sedentary Behaviors
Self-reported SB were assessed using the Youth Leisure-time Sedentary Behavior Questionnaire (YLSBQ) [34]. This questionnaire assesses the amount of time (min/day) spent in 12 sedentary activities during the past week. Weekdays and weekend days were measured separately. The SB included (1) watching TV/videos, (2) playing computer/video games, (3) internet surfing, (4) doing homework/studying with a computer, (5) doing homework/studying without a computer, (6) sitting and talking, (7) sitting while doing nothing, (8) talking or chatting on the telephone (i.e., SMS or WhatsApp), (9) reading for fun, (10) listening to music, (11) doing cognitive hobbies such as jigsaw and crossword puzzles, chess, or checkers, and (12) traveling on motorized transport. Participants were instructed to report only the most relevant activity when two or more activities are performed at the same time.
Response options for items 1–7 were 0 min, 30 min, 1 h, 1 h and a half, 2 h, 2 h and a half, 3 h, 4 h, and 5 h or more. Response options for items 8–12 were 0 min, 15 min, 30 min, 1 h, 1 h and a half, 2 h, and 2 h and a half or more. The items were completed separately for weekdays and weekend days, referring to the last week. The average time per day spent on each behavior and each composite category was calculated as follows: [(weekday time × 5) + (weekend time × 2)]/7. Following the study of Cabanas-Sánchez et al. [34], we grouped SB into four categories by the sum (in minutes) of the following activities: screen time (SB items 1, 2, and 3, listed above), educational time (items 4, 5, and 9), social time (items 6, 8, and 10), and other time (items 7, 11, and 12). To minimize the overreporting phenomenon, an adjustment to leisure time was applied prior to the analysis and has been previously described in detail [34]. The adequacy of this scale was demonstrated by Cabanas-Sánchez et al. [34] by founding a good test–retest reliability (Intraclass Correlation Coefficient [ICC] = 0.76; Pearson’s correlation [r] = 0.78) and a moderate level of validity when comparing with accelerometry (r = 0.36).
2.8. Sedentary Time and Sedentary Patterns
ST was measured by ActiGraph accelerometer models GT1M, GT3X, and GT3X+ (ActigraphTM, LLC, Pensacola, FL, USA) at each time point. The GT1M accelerometers collected data at 2 s epochs, and the GT3X and GT3X+ collected data at 30 Hz. Devices were randomly assigned to participants at both baseline and follow-up, regardless of the model. Previous studies have demonstrated that there is strong agreement among outputs from the three Actigraph models [35,36]. The participants wore the accelerometer on the lower back, fitted with an elastic belt, during waking hours for 7 consecutive days and were instructed to remove them for time spent in bed and water-based activities [37]. Data were reintegrated into 10 s epochs before analysis [38]. Non-wearing time was defined as a period of 60 min of 0 counts and an allowance for up to two consecutives minutes of <100 counts per minute (CPM), with the up/down stream of 30 mins of consecutive 0 counts for a period for the detection of artifact movements [39]. Data were downloaded and analyzed by using the ACTILIFE software (v.6.11.7 ActigraphTM, Pensacola, FL, USA). Inclusion criteria for the analyses were (1) at least 3 days of valid data (2) and a minimum of 8h of registration per day [38]. Total ST (min/day) was calculated based on the recommended vector magnitude cut point [40]: <100 CPM. A bout was defined as any continuous period of ST and the bout stopped when the counts for an epoch went above the cut point for ST [41]. A break was defined as an interruption in ST and reflected any 5 s epoch change from ST to light-intensity PA or moderate to vigorous PA (MVPA). Total ST expressed in min/day was retained for analyses.
SP were characterized by the accumulation of ST in sustained, unbroken bouts of ≥10, ≥20, ≥30, or ≥45 min. For the present analyses, the following variables were included: (i) the number of bouts per day of 10 (N10), 20 (N20), 30 (N30), or 45 (N45) min; (ii) the total time accumulated per day in bouts of ≥10 (T10), ≥20 (T20), ≥30 (T30), or ≥45 (T45) min. We used the manufacturer’s software (v.6.11.7 ActigraphTM, Pensacola, FL, USA) for data download, reduction, cleaning, and analyses.
2.9. Moderate to Vigorous Physical Activity
MVPA was also registered by accelerometer. Epoch values that were equivalent to 2296 CPM were considered to be minutes of MVPA [40].
2.10. Data Analyses
Significant interactions by sex (males and females) and age group (children and adolescents) in the studied associations were observed. Consequently, all analyses were performed differentiating by sex and age groups. All variables were checked for normality through visual inspection using histograms and Q–Q plots. Descriptive statistics are presented as mean ± standard deviation. T-tests were used to analyze the differences in the variables of interest between sex for both age groups at both time points.
To examine the cross-sectional association of SB and SP with MetS score, linear regression models were used, where SB variables (i.e., total daily sedentary behavior (DSB), screen DSB, educative DSB, social DSB, other DSB, total weekend sedentary behavior (WSB), screen WSB, educative WSB, social WSB, other WSB, and mean SB) and SP variables (i.e., ST, N10, N20, N30, N45, T10, T20, T30, and T45) at baseline were individually introduced as independent variables and MetS scores at baseline were individually introduced as a dependent variable, all analyses were controlled for age, educational center, and mother’s education level at baseline (model 1). Model 2 was model 1 + MVPA at baseline.
To study the longitudinal association between SB and SP variables and MetS scores, linear regression models were used, where SB and SP variables at baseline were individually introduced as independent variables and MetS scores at 2-year follow-ups as a dependent variable. In model 1, we adjusted by age, educational center, mother’s education level, and MetS scores at baseline. Model 2 was model 1 + MVPA at baseline.
To analyze whether changes in SB and SP variables were associated with future MetS scores, linear regression models were used, where the changes (follow-up value—baseline value) in total DSB, screen DSB, educative DSB, social DSB, other DSB, total WSB, screen WSB, educative WSB, social WSB, other WSB, mean SB, ST, N10, N20, N30, N45, T10, T20, T30, and T45 were individually introduced as independent variables, and MetS scores at 2-year follow-ups were individually introduced as a dependent variable. In model 1, we adjusted by age, educational center, mother’s education level, and MetS score at baseline, and model 2 was model 1 + MVPA at baseline. The same analyses were performed but changes in MetS scores were introduced as a dependent variable in order to test whether changes in SB and SP variables were associated with changes in MetS. Analyses were controlled for the same variables excluding MetS at baseline. Analyses were performed using the environment for statistical computing R [42], version 4.0.3 (R Foundation for Statistical Computing, Vienna, Austria). The significance was set at p < 0.05.
3. Results
Participant characteristics are shown in Table 1. Overall, at baseline, female children and adolescents showed higher levels of HDL cholesterol (all p < 0.05) compared to male children and adolescents, respectively. Female adolescents had lower values of SBP, weight, height, and WC and higher values of SP (all p < 0.05) than male adolescents. Regarding SB, female adolescents had lower values of screen time and higher values of educative time compared to male adolescents (all p < 0.05). At the follow-up, female children had higher values of SP, except N10, (all p < 0.05) than male children. In adolescents, females presented a lower Tanner stage, SBP, weight, height, WC, MVPA, and higher HDL-c compared to male adolescents (all p < 0.05). Overall, female adolescents showed a higher SP than male adolescents (i.e., N10, N20, N30, and N45), all p < 0.05. In terms of SB, female adolescents had lower values of screen time and higher values of educative and social time compared to male adolescents (all p < 0.05).

Table 1.
Baseline and 2 y follow-up characteristics of the study sample by age and sex.
Cross-sectional associations between SB and SP with MetS score at baseline are depicted in Table 2. Screen time in weekend days was negatively associated with MetS score in female children in model 1 and 2 (β = −0.001, all p < 0.05). N10 was positively associated with MetS score in female children in model 1 (β = 0.006, p = 0.029) but not in model 2 (β = 0.005, p = 0.053).
Table 2.
Cross-sectional association between sedentary behaviors and sedentary patterns with metabolic syndrome score in children and adolescents.
Table 3 shows the longitudinal associations between SB and SP variables at baseline and MetS scores at the 2-year follow-ups. Social weekend SB was negatively associated with the MetS score in male children only in model 1 (β = −0.002, p = 0.044). In male adolescents, the total daily SB, educative daily SB, and mean SB were negatively associated with the MetS score in models 1 and 2 (β = −0.001, all p < 0.05), while in female adolescents, other daily SB was negatively associated with the MetS score in both models (β = −0.002, all p < 0.05). No association was found between SP variables and the MetS score.
Table 3.
Longitudinal association between sedentary behavior and sedentary patterns with metabolic syndrome score in children and adolescents.
Supplementary Table S1 displays the changes in participant characteristics between the baseline and follow-up by age group and sex. Among children, females accumulated higher increases in sedentary bouts of ≥30 min compared to males (all p < 0.05). Among adolescents, females exhibited lower increases in SBP, weight, height, and WC but greater improvements in HDL cholesterol compared to males (all p < 0.05).
Table 4 shows the association between changes in SB and SP variables and the MetS score at follow-up. A slight decrease in screen and other daily SBs were positively associated with the MetS score in female adolescents in both models (β ranging from 0.001 to 0.002, all p < 0.05). In contrast, an increase in the educative daily SB was negatively associated with the MetS score in female adolescents in both models (β = −0.001, all p < 0.05). No association was found between SP variables and the MetS score.
Table 4.
Association between changes in sedentary behaviors and sedentary patterns with metabolic syndrome at 2-year follow-ups.
The associations between changes in SB and SP variables with changes in the MetS score are depicted in Supplementary Table S2. A slight decrease in screen and other daily SBs were positively associated with the MetS score in female adolescents in both models (β ranging from 0.001 to 0.002, all p < 0.05). On the contrary, an increase in educative daily SB was negatively associated with the MetS score in female adolescents in both models (β = −0.001, all p < 0.05). No association was found between SP variables and the MetS score.
4. Discussion
The main results of our study indicate that the association between SB and MetS in the pediatric population is scarce and, in some cases, contrary to expectations. Overall, we found no significant relationship between SP and MetS risk. Only some associations were observed when differentiating by sex and SB modalities. Our results showed that screen WSB was cross-sectional and negatively associated with the MetS score in female children. Total DSB, educative DSB, and mean SB were longitudinal and negatively associated with the MetS score in male adolescents, while other DSB was longitudinal and negatively associated with the MetS score in female adolescents. Changes in screen and other DSBs were positively associated with the MetS score in female adolescents. In contrast, changes in educative DSB were negatively associated with the MetS score in female adolescents.
When analyzing SB modalities, a negative association was found between screen WSB and the MetS score in female children at the cross-sectional level, although a positive association between these two variables was expected [13,43,44,45]. This outcome could be partly explained by the fact that the female children group in our sample spent the lowest time in screen WSB. At the longitudinal level, negative associations between educative DSB, total DSB, and the mean of SB with the MetS score were found in male adolescents, while in female adolescents, a negative association was shown between other DSB with the MetS score. When changes in SBs were analyzed, we found positive associations between a slight decrease in screen DSB and other DSB with the MetS score. In the literature, a longer screen time duration has been associated with higher MetS risk [13]. This result could be explained by the fact that longer screen time is closely associated with a worsening of dietary habits and lifestyle profiles among young people [46]. In contrast, negative longitudinal associations were observed between changes in educational DSB and the MetS score in adolescent females, suggesting that a reduction in educational DSB may be linked to an increase in cardiometabolic risk. In this regard, Stephens et al. [47] analyzed the role of education across a broad spectrum of educational levels (from primary school to doctoral degree), showing that higher education correlated with significantly better metabolic health compared to lower levels. This finding could indicate that the modality of SBs could affect the cardiovascular health of children and adolescents.
Our results did not show any associations between the total ST and MetS. Our findings contrast with traditional evidence linking sedentary lifestyles to poorer metabolic health in young people. Multiple cross-sectional studies have reported that greater exposure to SB (with total ST representing the overall duration in minutes) is associated with an increased risk of obesity and MetS from an early age [15,48]. A recent national study in China, with more than 17,000 participants aged 7 to 17, confirmed that children and adolescents with high levels of SB had a higher prevalence of abdominal obesity, dyslipidemia, and a significantly elevated risk of MetS [48]. Consistently, a Brazilian multicenter study reported that adolescents who spent more than 8 h a day sitting were twice as likely to have MetS compared to their less sedentary peers [49]. In that cohort, ST was positively related to central adiposity and an adverse lipid profile, while MVPA showed a positive association with improved insulin sensitivity [49]. This evidence reinforces the notion that prolonged ST contributes to an unfavorable metabolic profile in young people.
However, the literature also shows heterogeneous results, partly in line with our observations. A previous meta-analysis [50] found no independent association between total ST and MetS risk once MVPA levels were controlled for. This suggests that the apparent impact of ST may be mediated or confined to contexts of low PA. In active populations, sitting for long periods may not have such a marked effect on metabolic risk. In fact, in our study, the introduction of MVPA as a covariate eliminated the only initial association observed between sedentary bouts of ≥10 min and MetS. For its part, a recent longitudinal study also found that screen time, sleep, or PA did not have significant cross-sectional effects on cardiometabolic risk scores in children and adolescents [51]. In that study, the main predictor of future MetS risk was the participants’ baseline adiposity status. This may suggest that the impact of ST on metabolic health manifests primarily in the context of excess body weight, in line with previous findings [52].
Regarding SP, the way in which ST accumulates, our results are consistent with previous studies that also found no clear associations in young people [53]. One possible explanation is that most children and adolescents spontaneously interrupt their sedentary periods very frequently (i.e., they rarely remain seated for ≥30–60 continuous minutes) [54], so they do not reach thresholds of prolonged SB sufficient to trigger measurable metabolic effects. In line with this, our study observed only a limited number of bouts lasting ≥30 min, further reinforcing the notion that prolonged periods of SB are uncommon in this population. Additionally, the lack of significant associations with SP could also be partially explained by limited statistical power within certain subgroups, especially when stratifying by age and sex. The relatively low frequency of prolonged sedentary bouts may have reduced the variability needed to detect meaningful relationships, increasing the risk of type II error. Therefore, null findings should be interpreted with caution.
Overall, we found no evidence that SB modalities and total ST or SP are directly related to MetS risk in children and adolescents in our study. The observed associations were scarce, restricted to certain subgroups, and often contrary to the initially hypothesized direction. This suggests that the influence of SB on youth metabolic health may be more complex than anticipated and, to some extent, dependent on other variables, such as PA or adiposity, as suggested by our results and complemented by the previous literature.
Limitations and Strengths
Several limitations should be mentioned. First, given the observational nature of the study, causal inferences cannot be established. Second, sample loss may have introduced a potential selection bias, as participants who dropped out differed from those who remained in some indicators of sedentary behavior (i.e., greater daily and social ST and less weekly ST). This may limit the representativeness of the final sample and should be considered when interpreting the results. Third, the generalization of these results should be considered cautiously because we could not determine the influence of ethnicity and a country’s economic development on these associations, given that only urban and Caucasian Spanish youths participated in this study.
Furthermore, we acknowledge that multiple comparisons were conducted when evaluating different modalities and patterns of sedentary behavior. Although the models were adjusted for potential confounders (age, educational center, mother’s education level, and, additionally, MVPA time), these adjustments do not address the issue of multiplicity. Given the primarily exploratory and hypothesis-generating nature of the study, we chose not to apply formal corrections (i.e., Bonferroni/FDR) to avoid increasing the risk of type II errors and overlooking potentially relevant associations in pediatric populations. Therefore, the findings, particularly those with p-values close to the significance threshold, should be interpreted with caution, emphasizing the magnitude and consistency of the effects rather than isolated statistical significance, and require independent confirmation in external cohorts.
Finally, this study focused on SB modalities during leisure time and did not capture time spent in SB during school hours (i.e., screen time during recess) or whether two or more SBs were occurring simultaneously. Youth may engage in multiple SBs across multiple social media devices at the same time (i.e., smartphone use while watching TV); future studies could therefore include measures that capture multiple SBs simultaneously. Otherwise, the current research presents some strengths. The longitudinal design and the relatively large sample, which allowed us to conduct the analyses differentiating by sex and age groups, are major strengths of the present study. This stratification is particularly relevant given that previous research has consistently reported differences in SB and SP according to sex and age. For instance, females generally present a higher ST than males [27,28], while males tend to spend more time on screen-based activities [29]. In addition, ST seems to increase with age, with adolescents presenting higher ST levels [28]. Apart from this, the use of clustered MetS risk factors has been suggested as a good indicator of cardiovascular health compared with individual MetS risk factors [5]. Finally, we simultaneously analyzed SB and SP modalities, while most studies only analyze SB (focusing on screen time) [55] or SP (focusing on a single-bout duration, i.e., bouts > 10 min or bouts > 30 min of ST).
5. Conclusions
In conclusion, few cross-sectional and longitudinal associations between SB or SP and the MetS score were observed. These associations were mainly detected in adolescents and often in directions contrary to the initial hypotheses. Regarding changes over the two-year follow-up, positive associations with the MetS score were found for increases in screen-based and other daily SBs, whereas negative associations were observed for changes in educational SB, all restricted to female adolescents. No associations were detected for total ST or SP. Taken together, these findings highlight the need for future studies to clarify the mechanisms through which SB influences cardiometabolic health and to determine whether these effects depend on other features, such as PA or adiposity levels.
Supplementary Materials
The following supporting information can be downloaded at: https://www.mdpi.com/article/10.3390/healthcare13192544/s1. Table S1: Changes in characteristics of the study sample by age and sex (Follow-up—Baseline). Table S2: Association between changes in sedentary behaviors and sedentary patterns with changes in metabolic syndrome. Table S3: Definitions and abbreviations of study variables.
Author Contributions
Conceptualization: A.S.-D., A.P.-B., R.I.-G., O.L.V., A.M. and J.C.-P. Data curation: A.S.-D., A.P.-B., J.C.-C. and S.G.-M. Formal analysis: A.S.-D., A.P.-B. and J.C.-P. Funding acquisition: J.C.-C., A.M., O.L.V. and J.C.-P. Methodology: A.S.-D., A.P.-B., J.C.-C., R.I.-G., S.G.-M., O.L.V., A.M. and J.C.-P. Supervision: A.S.-D., A.P.-B., R.I.-G. and J.C.-P. Writing—original draft: A.S.-D. Writing—review and editing: A.P.-B., J.C.-C., R.I.-G., S.G.-M., O.L.V., A.M. and J.C.-P. All authors have read and agreed to the published version of the manuscript.
Funding
This study was supported by the DEP 2010–21662-C04–00 (DEP 2010–21662- C04–01: DEP 2010–21662-C04–02: DEP 2010–21662-C04–03: DEP 2010– 21662-C04–04) grant from the National Plan for Research, Development and Innovation (R + D + i) MICINN. RIG supported by grant for the Requalification of the Spanish University System (2021–2023) from the Spanish Ministry of Universities (RD 289/2021), funded by the European Union-NextGenerationEU.
Institutional Review Board Statement
The study was conducted according to the guidelines of the Declaration of Helsinki and approved by the Ethics Committee of the Hospital Puerta del Hierro (Madrid, Spain; approval date: September 2011), the Bioethics Committee of the National Spanish Research Council (Madrid, Spain; approval date: July 2012), and the Committee for Research Involving Human Subjects of the University of Cádiz (Cádiz, Spain; approval date: October 2011).
Informed Consent Statement
Informed consent was obtained from all subjects involved in the study.
Data Availability Statement
Data available on request due to restrictions.
Acknowledgments
We thank the participation of children and adolescents in this study, as well as parents and headmasters and teachers at the participating schools.
Conflicts of Interest
The authors declare no conflicts of interest.
References
- Lindstrom, M.; Decleene, N.; Dorsey, H.; Fuster, V.; Johnson, C.O.; Legrand, K.E.; Mensah, G.A.; Razo, C.; Stark, B.; Turco, V.; et al. Summary of Global Burden of Disease Study Methods. J. Am. Coll. Cardiol. 2022, 80, 2372–2425. [Google Scholar] [CrossRef]
- Lozano, R.; Naghavi, M.; Foreman, K.; Lim, S.; Shibuya, K.; Aboyans, V.; Abraham, J.; Adair, T.; Aggarwal, R.; Ahn, S.Y.; et al. Global and Regional Mortality from 235 Causes of Death for 20 Age Groups in 1990 and 2010: A Systematic Analysis for the Global Burden of Disease Study 2010. Lancet 2012, 380, 2095–2128. [Google Scholar] [CrossRef]
- Andersen, L.B.; Wedderkopp, N.; Hansen, H.S.; Cooper, A.R.; Froberg, K. Biological Cardiovascular Risk Factors Cluster in Danish Children and Adolescents: The European Youth Heart Study. Prev. Med. 2003, 37, 363–367. [Google Scholar] [CrossRef]
- Bugge, A.; El-Naaman, B.; Mcmurray, R.G.; Froberg, K.; Andersen, L.B. Tracking of Clustered Cardiovascular Disease Risk Factors from Childhood to Adolescence. Pediatr. Res. 2013, 73, 245–249. [Google Scholar] [CrossRef]
- Andersen, L.B.; Hasselstrøm, H.; Grønfeldt, V.; Hansen, S.E.; Karsten, F. The Relationship between Physical Fitness and Clustered Risk, and Tracking of Clustered Risk from Adolescence to Young Adulthood: Eight Years Follow-up in the Danish Youth and Sport Study. Int. J. Behav. Nutr. Phys. Act. 2004, 1, 4–7. [Google Scholar] [CrossRef] [PubMed]
- Alberti, K.G.M.M.; Eckel, R.H.; Grundy, S.M.; Zimmet, P.Z.; Cleeman, J.I.; Donato, K.A.; Fruchart, J.C.; James, W.P.T.; Loria, C.M.; Smith, S.C. Harmonizing the Metabolic Syndrome: A Joint Interim Statement of the International Diabetes Federation Task Force on Epidemiology and Prevention; National Heart, Lung, and Blood Institute; American Heart Association; World Heart Federation; International. Circulation 2009, 120, 1640–1645. [Google Scholar] [CrossRef] [PubMed]
- Alberti, K.G.M.M.; Zimmet, P.; Shaw, J. Metabolic Syndrome—A New World-Wide Definition. A Consensus Statement from the International Diabetes Federation. Diabet. Med. 2006, 23, 469–480. [Google Scholar] [CrossRef] [PubMed]
- Dhondge, R.H.; Agrawal, S.; Patil, R.; Kadu, A.; Kothari, M. A Comprehensive Review of Metabolic Syndrome and Its Role in Cardiovascular Disease and Type 2 Diabetes Mellitus: Mechanisms, Risk Factors, and Management. Cureus 2024, 16, e67428. [Google Scholar] [CrossRef]
- Magge, S.N.; Goodman, E.; Armstrong, S.C.; Daniels, S.; Corkins, M.; De Ferranti, S.; Golden, N.H.; Kim, J.H.; Schwarzenberg, S.J.; Assar, C.L.; et al. The Metabolic Syndrome in Children and Adolescents: Shifting the Focus to Cardiometabolic Risk Factor Clustering. Pediatrics 2017, 140, e20171603. [Google Scholar] [CrossRef]
- Eisenmann, J.C. On the Use of a Continuous Metabolic Syndrome Score in Pediatric Research. Cardiovasc. Diabetol. 2008, 7, 17. [Google Scholar] [CrossRef]
- Khazdouz, M.; Hasani, M.; Mehranfar, S.; Ejtahed, H.S.; Djalalinia, S.; Mahdavi Gorabi, A.; Esmaeili-Abdar, M.; Karbalahi Saleh, S.; Arzaghi, S.M.; Zahedi, H.; et al. Validity of Continuous Metabolic Syndrome Score for Predicting Metabolic Syndrome; a Systematic Review and Meta-Analysis. J. Diabetes Metab. Disord. 2021, 20, 497–510. [Google Scholar] [CrossRef] [PubMed]
- Fernández-Aparicio, Á.; Perona, J.S.; Schmidt-RioValle, J.; González-Jiménez, E. Concordance among Diagnostic Criteria for Metabolic Syndrome Is Inconsistent in Spanish Adolescents. Eur. J. Clin. Investig. 2021, 51, e13384. [Google Scholar] [CrossRef] [PubMed]
- Haapala, E.A.; Leppänen, M.H.; Lee, E.; Savonen, K.; Laukkanen, J.A.; Kähönen, M.; Brage, S.; Lakka, T.A. Accumulating Sedentary Time and Physical Activity From Childhood to Adolescence and Cardiac Function in Adolescence. J. Am. Heart Assoc. 2024, 13, e031837. [Google Scholar] [CrossRef]
- Tremblay, M.S.; Aubert, S.; Barnes, J.D.; Saunders, T.J.; Carson, V.; Latimer-Cheung, A.E.; Chastin, S.F.M.; Altenburg, T.M.; Chinapaw, M.J.M.; Aminian, S.; et al. Sedentary Behavior Research Network (SBRN)—Terminology Consensus Project Process and Outcome. Int. J. Behav. Nutr. Phys. Act. 2017, 14, 75. [Google Scholar] [CrossRef]
- Carson, V.; Hunter, S.; Kuzik, N.; Gray, C.E.; Poitras, V.J.; Chaput, J.P.; Saunders, T.J.; Katzmarzyk, P.T.; Okely, A.D.; Connor Gorber, S.; et al. Systematic Review of Sedentary Behaviour and Health Indicators in School-Aged Children and Youth: An Update. Appl. Physiol. Nutr. Metab. 2016, 41, S240–S265. [Google Scholar] [CrossRef]
- van Ekris, E.; Altenburg, T.M.; Singh, A.S.; Proper, K.I.; Heymans, M.W.; Chinapaw, M.J.M. An Evidence-Update on the Prospective Relationship between Childhood Sedentary Behaviour and Biomedical Health Indicators: A Systematic Review and Meta-Analysis. Obes. Rev. 2016, 17, 833–849. [Google Scholar] [CrossRef] [PubMed]
- Biddle, S.J.H.; García Bengoechea, E.; Wiesner, G. Sedentary Behaviour and Adiposity in Youth: A Systematic Review of Reviews and Analysis of Causality. Int. J. Behav. Nutr. Phys. Act. 2017, 14, 43. [Google Scholar] [CrossRef]
- Rey-López, J.P.; Vicente-Rodriguez, G.; Ortega, F.B.; Ruiz, J.R.; Martinez-Gómez, D.; De Henauw, S.; Manios, Y.; Molnar, D.; Polito, A.; Verloigne, M.; et al. Sedentary Patterns and Media Availability in European Adolescents: The HELENA Study. Prev. Med. 2010, 51, 50–55. [Google Scholar] [CrossRef]
- Mielgo-Ayuso, J.; Aparicio-Ugarriza, R.; Castillo, A.; Ruiz, E.; Avila, J.M.; Aranceta-Bartrina, J.; Gil, A.; Ortega, R.M.; Serra-Majem, L.; Varela-Moreiras, G.; et al. Sedentary Behavior among Spanish Children and Adolescents: Findings from the ANIBES Study. BMC Public Health 2017, 17, 94. [Google Scholar] [CrossRef]
- Sánchez-Oliva, D.; Leech, R.M.; Grao-Cruces, A.; Esteban-Cornejo, I.; Padilla-Moledo, C.; Veiga, O.L.; Cabanas-Sánchez, V.; Castro-Piñero, J. Does Modality Matter? A Latent Profile and Transition Analysis of Sedentary Behaviours among School-Aged Youth: The UP&DOWN Study: Profile Transitions of Sedentary Behaviours. J. Sports Sci. 2020, 38, 1062–1069. [Google Scholar] [CrossRef]
- Santos, D.A.; Magalhães, J.P.; Júdice, P.B.; Correia, I.R.; Minderico, C.S.; Ekelund, U.; Sardinha, L.B. Fitness Mediates Activity and Sedentary Patterns Associations with Adiposity in Youth. Med. Sci. Sports Exerc. 2019, 51, 323–329. [Google Scholar] [CrossRef]
- Bailey, D.P.; Charman, S.J.; Ploetz, T.; Savory, L.A.; Kerr, C.J. Associations between Prolonged Sedentary Time and Breaks in Sedentary Time with Cardiometabolic Risk in 10–14-Year-Old Children: The HAPPY Study. J. Sports Sci. 2017, 35, 2164–2171. [Google Scholar] [CrossRef]
- Verloigne, M.; Ridgers, N.D.; Chinapaw, M.; Altenburg, T.M.; Bere, E.; Van Lippevelde, W.; Cardon, G.; Brug, J.; De Bourdeaudhuij, I. Patterns of Objectively Measured Sedentary Time in 10- to 12-Year-Old Belgian Children: An Observational Study within the ENERGYproject. BMC Pediatr. 2017, 17, 147. [Google Scholar] [CrossRef]
- Chinapaw, M.; Klakk, H.; Møller, N.C.; Andersen, L.B.; Altenburg, T.; Wedderkopp, N. Total Volume versus Bouts: Prospective Relationship of Physical Activity and Sedentary Time with Cardiometabolic Risk in Children. Int. J. Obes. 2018, 42, 1733–1742. [Google Scholar] [CrossRef]
- Júdice, P.B.; Hetherington-Rauth, M.; Northstone, K.; Andersen, L.B.; Wedderkopp, N.; Ekelund, U.; Sardinha, L.B. Changes in Physical Activity and Sedentary Patterns on Cardiometabolic Outcomes in the Transition to Adolescence: International Children’s Accelerometry Database 2.0. J. Pediatr. 2020, 225, 166–173.e1. [Google Scholar] [CrossRef] [PubMed]
- Skrede, T.; Steene-Johannessen, J.; Anderssen, S.A.; Resaland, G.K.; Ekelund, U. The Prospective Association between Objectively Measured Sedentary Time, Moderate-to-Vigorous Physical Activity and Cardiometabolic Risk Factors in Youth: A Systematic Review and Meta-Analysis. Obes. Rev. 2019, 20, 55–74. [Google Scholar] [CrossRef] [PubMed]
- Grao-Cruces, A.; Sánchez-Oliva, D.; Padilla-Moledo, C.; Izquierdo-Gómez, R.; Cabanas-Sánchez, V.; Castro-Piñero, J. Changes in the School and Non-School Sedentary Time in Youth: The UP&DOWN Longitudinal Study. J. Sports Sci. 2020, 38, 780–786. [Google Scholar] [CrossRef] [PubMed]
- Brazo-Sayavera, J.; Aubert, S.; Barnes, J.D.; González, S.A.; Tremblay, M.S. Gender Differences in Physical Activity and Sedentary Behavior: Results from over 200,000 Latin-American Children and Adolescents. PLoS ONE 2021, 16, e0255353. [Google Scholar] [CrossRef]
- Botelho, G.; Ferrão, A.; Aguiar, M. Gender and Age Differences in Physical Activity and Sedentary Behaviour among Portuguese Adolescents. J. Phys. Educ. Sport 2013, 13, 184–194. [Google Scholar] [CrossRef]
- Castro-Piñero, J.; Carbonell-Baeza, A.; Martinez-Gomez, D.; Gómez-Martínez, S.; Cabanas-Sánchez, V.; Santiago, C.; Veses, A.M.; Bandrés, F.; Gonzalez-Galo, A.; Gomez-Gallego, F.; et al. Follow-up in Healthy Schoolchildren and in Adolescents with DOWN Syndrome: Psycho-Environmental and Genetic Determinants of Physical Activity and Its Impact on Fitness, Cardiovascular Diseases, Inflammatory Biomarkers and Mental Health; The UP&DOWN Study. BMC Public Health 2014, 14, 400. [Google Scholar] [CrossRef]
- Tanner, J.M.; Whitehouse, R.H. Clinical Longitudinal Standards for Height, Weight, Height Velocity, Weight Velocity, and Stages of Puberty. Arch. Dis. Child. 1976, 51, 170–179. [Google Scholar] [CrossRef]
- Topouchian, J.; El Assaad, M.; Orobinskaia, L.V.; El Feghali, R.N.; Asmar, R.G. Validation of Two Automatic Devices for Self-Measurement of Blood Pressure According to the International Protocol of the European Society of Hypertension: The Omron M6 (HEM-7001-E) and the Omron R7 (HEM 637-IT). Blood Press. Monit. 2006, 11, 165–171. [Google Scholar] [CrossRef]
- Zimmet, P.; Alberti, G.; Kaufman, F.; Tajima, N.; Silink, M.; Arslanian, S.; Wong, G.; Bennett, P.; Shaw, J.; Caprio, S. The Metabolic Syndrome in Children and Adolescents. Lancet 2007, 369, 2059–2061. [Google Scholar] [CrossRef] [PubMed]
- Cabanas-Sánchez, V.; Martínez-Gómez, D.; Esteban-Cornejo, I.; Castro-Piñero, J.; Conde-Caveda, J.; Veiga, Ó.L. Reliability and Validity of the Youth Leisure-Time Sedentary Behavior Questionnaire (YLSBQ). J. Sci. Med. Sport. 2018, 21, 69–74. [Google Scholar] [CrossRef] [PubMed]
- Vanhelst, J.; Mikulovic, J.; Bui-Xuan, G.; Dieu, O.; Blondeau, T.; Fardy, P.; Béghin, L. Comparison of Two ActiGraph Accelerometer Generations in the Assessment of Physical Activity in Free Living Conditions. BMC Res. Notes 2012, 5, 2–5. [Google Scholar] [CrossRef] [PubMed]
- Robusto, K.M.; Trost, S.G. Comparison of Three Generations of ActiGraphTM Activity Monitors in Children and Adolescents. J. Sports Sci. 2012, 30, 1429–1435. [Google Scholar] [CrossRef]
- Trost, S.G.; Mciver, K.L.; Pate, R.R. Conducting Accelerometer-Based Activity Assessments in Field-Based Research. Med. Sci. Sports Exerc. 2005, 37, 531–543. [Google Scholar] [CrossRef]
- Cain, K.L.; Sallis, J.F.; Conway, T.L.; Van Dyck, D.; Calhoon, L. Using Accelerometers in Youth Physical Activity Studies: A Review of Methods. J. Phys. Act. Health 2013, 10, 437–450. [Google Scholar] [CrossRef]
- Choi, L.; Liu, Z.; Matthews, C.E.; Buchowski, M.S. Validation of Accelerometer Wear and Nonwear Time Classification Algorithm. Med. Sci. Sports Exerc. 2011, 43, 357–364. [Google Scholar] [CrossRef]
- Evenson, K.R.; Catellier, D.J.; Gill, K.; Ondrak, K.S.; McMurray, R.G. Calibration of Two Objective Measures of Physical Activity for Children. J. Sports Sci. 2008, 26, 1557–1565. [Google Scholar] [CrossRef]
- Carson, V.; Stone, M.; Faulkner, G. Patterns of Sedentary Behavior and Weight Status among Children. Pediatr. Exerc. Sci. 2014, 26, 95–102. [Google Scholar] [CrossRef]
- R Core Team. R: A Language and Environment for Statistical Computing; R Foundation for Statistical Computing: Vienna, Austria, 2017. [Google Scholar]
- Grøntved, A.; Ried-Larsen, M.; Møller, N.C.; Kristensen, P.L.; Wedderkopp, N.; Froberg, K.; Hu, F.B.; Ekelund, U.; Andersen, L.B. Youth Screen-Time Behaviour Is Associated with Cardiovascular Risk in Young Adulthood: The European Youth Heart Study. Eur. J. Prev. Cardiol. 2014, 21, 49–56. [Google Scholar] [CrossRef]
- Khan, M.A.; Shah, S.M.; Shehab, A.; Ghosal, S.; Muhairi, S.J.; Al-Rifai, R.H.; Al Maskari, F.; Alkaabi, J.; Nauman, J. Screen Time and Metabolic Syndrome among Expatriate Adolescents in the United Arab Emirates. Diabetes Metab. Syndr. Clin. Res. Rev. 2019, 13, 2565–2569. [Google Scholar] [CrossRef]
- Mark, A.E.; Janssen, I. Relationship between Screen Time and Metabolic Syndrome in Adolescents. J. Public Health 2008, 30, 153–160. [Google Scholar] [CrossRef]
- Tambalis, K.D.; Panagiotakos, D.B.; Psarra, G.; Sidossis, L.S. Screen Time and Its Effect on Dietary Habits and Lifestyle among Schoolchildren. Cent. Eur. J. Public Health 2020, 28, 260–266. [Google Scholar] [CrossRef]
- Stephens, C.R.; Easton, J.F.; Robles-Cabrera, A.; Fossion, R.; de la Cruz, L.; Martínez-Tapia, R.; Barajas-Martínez, A.; Hernández-Chávez, A.; López-Rivera, J.A.; Rivera, A.L. The Impact of Education and Age on Metabolic Disorders. Front. Public Health 2020, 8, 180. [Google Scholar] [CrossRef] [PubMed]
- Cheng, X.; Guo, Q.; Ju, L.; Gong, W.; Wei, X.; Xu, X.; Zhao, L.; Fang, H. Association between Sedentary Behavior, Screen Time and Metabolic Syndrome among Chinese Children and Adolescents. BMC Public Health 2024, 24, 1715. [Google Scholar] [CrossRef] [PubMed]
- Silva, T.O.; Norde, M.M.; Vasques, A.C.; Zambom, M.P.; Antonio, M.A.R.d.G.M.; Rodrigues, A.M.D.B.; Geloneze, B. Association of Physical Activity and Sitting with Metabolic Syndrome and Hyperglycemic Clamp Parameters in Adolescents—BRAMS Pediatric Study. Front. Endocrinol. 2023, 14, 1191935. [Google Scholar] [CrossRef] [PubMed]
- Renninger, M.; Hansen, B.H.; Steene-Johannessen, J.; Kriemler, S.; Froberg, K.; Northstone, K.; Sardinha, L.; Anderssen, S.A.; Andersen, L.B.; Ekelund, U. Associations between Accelerometry Measured Physical Activity and Sedentary Time and the Metabolic Syndrome: A Meta-Analysis of More than 6000 Children and Adolescents. Pediatr. Obes. 2020, 15, e12578. [Google Scholar] [CrossRef]
- Sehn, A.P.; Silveira, J.F.d.C.; Brand, C.; Lemes, V.B.; Borfe, L.; Tornquist, L.; Pfeiffer, K.A.; Renner, J.D.P.; Andersen, L.B.; Burns, R.D.; et al. Screen Time, Sleep Duration, Leisure Physical Activity, Obesity, and Cardiometabolic Risk in Children and Adolescents: A Cross-Lagged 2-Year Study. BMC Cardiovasc. Disord. 2024, 24, 525. [Google Scholar] [CrossRef]
- Sánchez-Delgado, A.; Pérez-Bey, A.; Izquierdo-Gómez, R.; Jimenez-Iglesias, J.; Marcos, A.; Gómez-Martínez, S.; Girela-Rejón, M.J.; Veiga, O.L.; Castro-Piñero, J. Fitness, Body Composition, and Metabolic Risk Scores in Children and Adolescents: The UP&DOWN Study. Eur. J. Pediatr. 2023, 182, 669–687. [Google Scholar] [CrossRef]
- Wijndaele, K.; White, T.; Andersen, L.B.; Bugge, A.; Kolle, E.; Northstone, K.; Wedderkopp, N.; Ried-Larsen, M.; Kriemler, S.; Page, A.S.; et al. Substituting Prolonged Sedentary Time and Cardiovascular Risk in Children and Youth: A Meta-Analysis within the International Children’s Accelerometry Database (ICAD). Int. J. Behav. Nutr. Phys. Act. 2019, 16, 96. [Google Scholar] [CrossRef] [PubMed]
- Janssen, X.; Mann, K.D.; Basterfield, L.; Parkinson, K.N.; Pearce, M.S.; Reilly, J.K.; Adamson, A.J.; Reilly, J.J. Development of Sedentary Behavior across Childhood and Adolescence: Longitudinal Analysis of the Gateshead Millennium Study. Int. J. Behav. Nutr. Phys. Act. 2016, 13, 88. [Google Scholar] [CrossRef] [PubMed]
- De Oliveira, R.G.; Guedes, D.P. Physical Activity, Sedentary Behavior, Cardiorespiratory Fitness and Metabolic Syndrome in Adolescents: Systematic Review and Meta-Analysis of Observational Evidence. PLoS ONE 2016, 11, e0168503. [Google Scholar] [CrossRef]

Disclaimer/Publisher’s Note: The statements, opinions and data contained in all publications are solely those of the individual author(s) and contributor(s) and not of MDPI and/or the editor(s). MDPI and/or the editor(s) disclaim responsibility for any injury to people or property resulting from any ideas, methods, instructions or products referred to in the content. |
© 2025 by the authors. Licensee MDPI, Basel, Switzerland. This article is an open access article distributed under the terms and conditions of the Creative Commons Attribution (CC BY) license (https://creativecommons.org/licenses/by/4.0/).