5.2. Results of Newly Proposed Temporal Inception Perceptron Network for Diabetes Prediction
Compared to the performance of individual DL models, the results of the proposed blending model TIPNet are significantly higher on several metrics. The effectiveness of TIPNet’s blended architecture is supported by the results in
Table 7, which show that it outperforms individual models such as LSTM, InceptionNet, and MLP in terms of accuracy, F1-score, recall, and precision. TIPNet optimizes between a strong classifier, multiscale static feature processing, and temporal feature extraction by combining two base deep models.
In
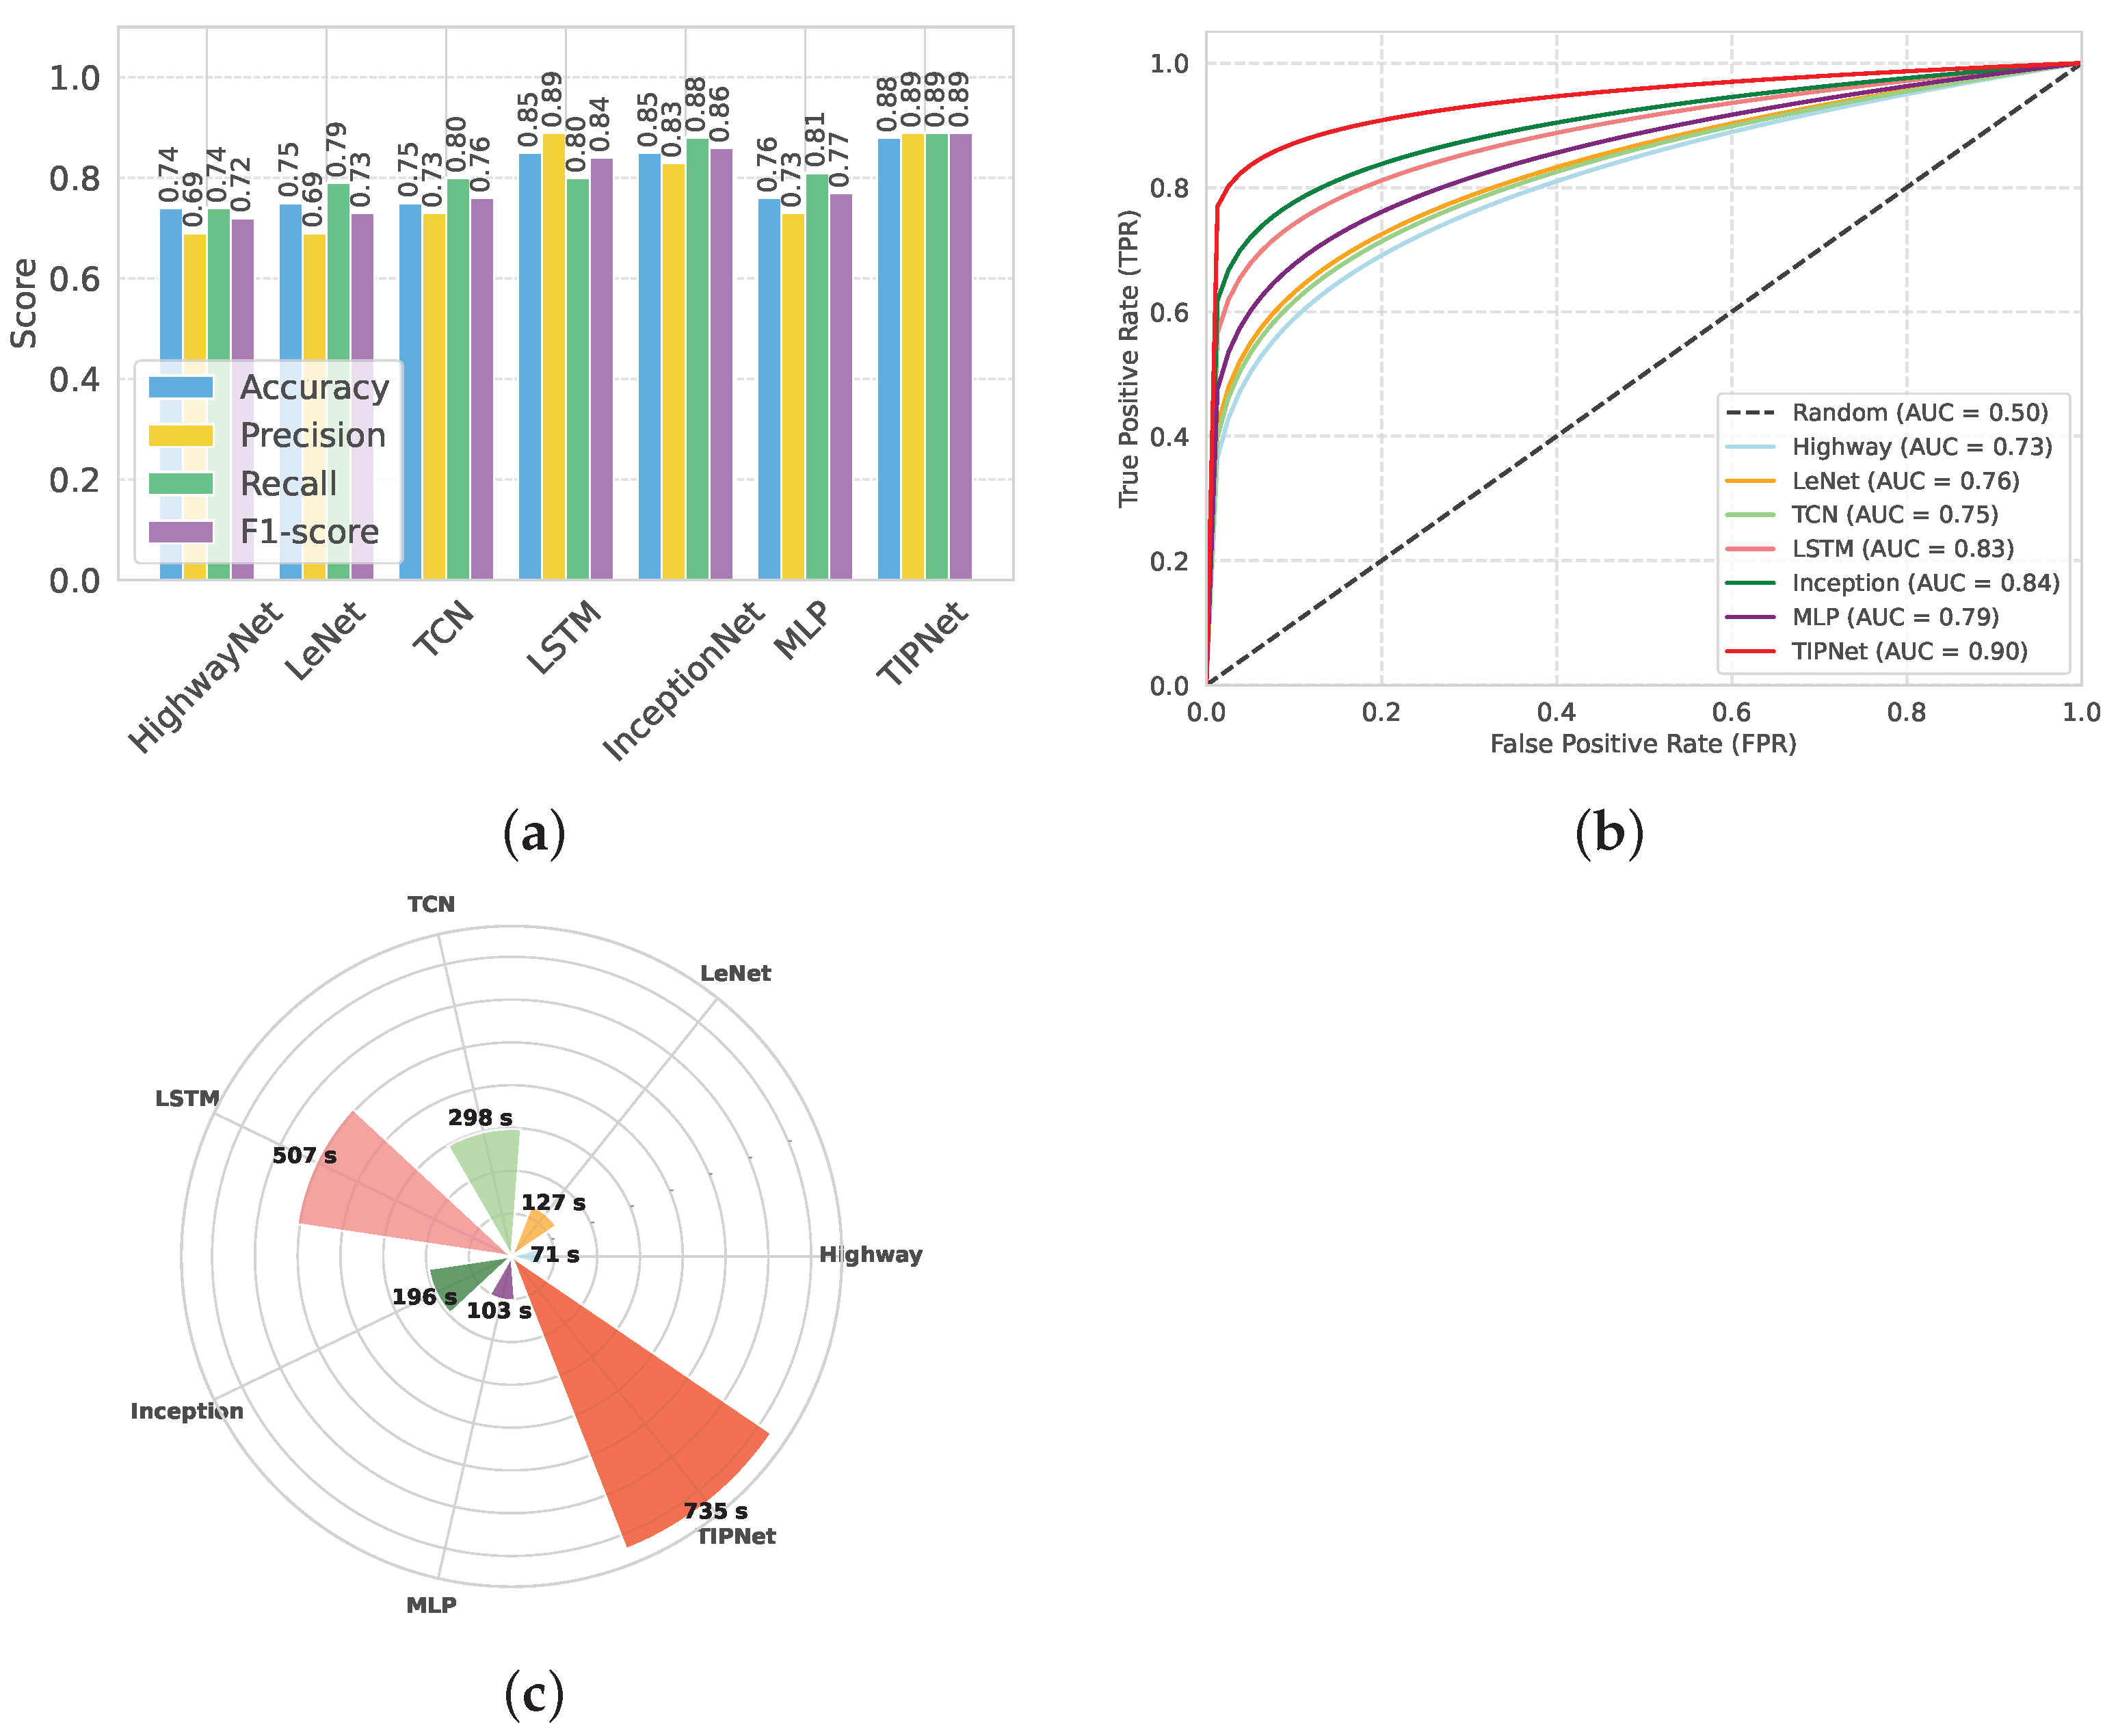
Figure 2, TIPNet’s high F1-score of 0.89 and overall accuracy of 0.88, as evidenced in
Figure 2a, demonstrate its superior ability to integrate sequential patterns and static feature relationships compared to individual models. Due to its limitations in processing static features like BMI and cholesterol levels, the standalone LSTM model only achieves 0.85 accuracy despite being adept at handling temporal dependencies. The InceptionNet model also performs well in multiscale static feature extraction with an accuracy of 0.85. However, it has trouble with temporal patterns. By combining the advantages of both models into a single framework, TIPNet fills these gaps and produces better predictive results. TIPNet also excels in precision, where it achieves 0.89 as compared to 0.83 for InceptionNet, 0.73 for MLP, and 0.83 for InceptionNet. This high precision highlights TIPNet’s ability to reduce FPs, which is crucial in medical diagnostics since overdiagnosis can result in needless treatments. TIPNet’s blending mechanism reduces ambiguity in the classification process by enabling LSTM to provide sequential insights, while InceptionNet captures static feature granularity.
On the other hand, HighwayNet, LeNet, and TCN perform worse on all important metrics and are unable to strike a balance between accuracy, recall, and precision. TIPNet’s 0.88 accuracy is significantly higher than HighwayNet’s 0.74 accuracy, with an F1-score of 0.72 as shown in
Table 7. HighwayNet’s main drawbacks are its basic architecture and lack of advanced convolutional or sequential processing capabilities needed to handle medical data; it is unable to capture complex feature interactions. LeNet, which was initially created for image recognition tasks, also has trouble generalizing to diverse tabular datasets; however, it does manage to achieve a slightly higher accuracy of 0.75, as shown in
Figure 2a. The LeNet is not the best solution for diabetes prediction due to its ineffective handling of sequential dependencies and restricted capacity to extract static features.
TCN performs worse than TIPNet despite being marginally better at managing temporal dependencies. TCN shows some ability to learn sequential patterns with an accuracy of 0.75, an F1-score of 0.76, and a recall of 0.80. However, when working with a combination of static and temporal features, its inflexible receptive fields and absence of dynamic feature weighting led to poor performance. Moreover, it takes 298 s to execute, which is a lot longer than HighwayNet and LeNet, and it does not improve prediction accuracy by the same amount. In contrast, the proposed TIPNet model effectively addresses the aforementioned shortcomings through its integrated architectural design. By combining temporal, interactional, and positional encoding mechanisms, TIPNet is capable of capturing both static and sequential patterns within medical tabular data. Unlike HighwayNet, TIPNet incorporates advanced feature extraction and sequential modeling components that enable it to identify complex inter-feature relationships. Compared to LeNet, TIPNet is tailored specifically for tabular healthcare data rather than visual tasks, allowing for better generalization and improved learning of static features. Additionally, TIPNet surpasses TCN by utilizing adaptive receptive fields and attention-based mechanisms to dynamically weigh features according to their relevance, thereby improving classification outcomes. The resulting performance, demonstrated by its superior accuracy, F1-score, and recall, along with reasonable execution time, confirms that TIPNet not only enhances predictive accuracy but also maintains computational efficiency. This holistic capability highlights TIPNet’s potential as a reliable solution for real-world medical prediction tasks.
Although the benchmark models LSTM, InceptionNet, and MLP show acceptable performance in predicting diabetes, each has specific drawbacks that limit their effectiveness. The LSTM model is good at learning time-based patterns, but takes a long time to run (507 s) and may struggle with learning long sequences due to gradient issues. InceptionNet runs faster (196 s) and performs better in terms of recall, but it was originally designed for image data and does not fully capture the combined effect of temporal and static features in medical datasets. The MLP model, on the other hand, performs the weakest, with an accuracy of 0.76 and an F1-score of 0.77, because it lacks the ability to learn complex patterns and does not account for time-related dependencies in the data. The TIPNet model overcomes these issues by combining temporal feature learning with inception-based deep feature extraction. As a result, it achieves the best performance across all key metrics, including an accuracy of 0.88, F1-score of 0.89, and AUC of 0.90. While TIPNet takes more time to run (735 s), its strong and balanced results in precision, recall, and overall performance clearly show that it is better suited for medical prediction tasks, especially when both static and time-related features are important.
The ability of each model to discriminate between diabetic and non-diabetic cases is illustrated in
Figure 2, as evidenced by the AUC-ROC results shown in
Figure 2b. The TIPNet Deep Model has the highest AUC of 0.90, indicating that complex temporal dependencies that are essential for diabetes prediction are well captured by its temporal inception architecture. While slightly lagging behind TIPNet, the InceptionNet and LSTM models demonstrate their capacity to model sequential data and feature hierarchies with robust AUC values of 0.84 and 0.83, respectively. With AUC values of 0.79, 0.76, and 0.75 for the MLP, LeNet, and TCN models, respectively, they perform moderately, which might suggest that they are not fully able to capture the complex nonlinear relationships found in the dataset. The superior performance of deep temporal and inception-based models in this specific application is highlighted by HighwayNets AUC of 0.73, which indicates that, although it offers a respectable degree of discrimination, it is less skilled at class differentiation when compared to the more sophisticated architectures.
TIPNet’s resilience in identifying diabetic cases is demonstrated by the recall, which measures the capacity to accurately identify TP cases. TIPNet, with a recall of 0.89, significantly outperforms MLP with 0.81 and LSTM with 0.78 recall. TIPNet’s balanced performance across key metrics is demonstrated by its F1-score, which outperforms LSTM, MLP, and InceptionNet due to its ability to balance recall and precision.
Figure 2c’s analysis of execution time reveals a significant trade-off. TIPNet’s enhanced accuracy and precision outweigh the computational resources it needs, even though it takes 629 s to execute compared to its base models. Because of its comparatively light structure, the LSTM model executes more quickly (375 s); however, its predictive accuracy is compromised. InceptionNet’s execution time of 522 s and MLP’s execution time of 103 s indicate its emphasis on static features but fall short of TIPNet’s flexibility. Because of this compromise, TIPNet is the best option for applications where diagnostic precision is more important than processing speed.
HighwayNet, LeNet, and TCN, in contrast, perform poorly on predictive metrics and show execution irregularities. At 71 s, HighwayNet is the fastest, but predictive reliability suffers as a result. LeNet’s performance gains of 127 s do not strike a balance between accuracy and computational time to justify its increased computation. TCN takes significantly longer than HighwayNet and LeNet (298 s), but it is still unable to match TIPNet in terms of performance (
Figure 2c). The plot shows the computational inefficiencies of these models when compared with TIPNet, which exhibits notably superior accuracy, precision, and overall prediction resilience while having a longer execution time.
Similarly,
Figure 3 presents a holistic comparison of TIPNet with a range of conventional DL models, revealing TIPNet’s clear superiority across all major evaluation metrics on the highly imbalanced DiaHealth dataset. As illustrated in
Figure 3a, TIPNet achieves the highest accuracy of 0.88, precision of 0.89, recall of 0.89, and F1-score of 0.89, significantly outperforming LSTM accuracy of 0.78, precision of 0.80, recall of 0.75, F1-score of 0.77, InceptionNet accuracy of 0.86, precision of 0.86, recall of 0.85, F1-score of 0.85, MLP accuracy of 0.77, precision of 0.77, recall of 0.76, F1-score of 0.76, and lightweight architectures such as HighwayNet accuracy of 0.73, precision of 0.74, recall of 0.72, F1-score of 0.73 and LeNet accuracy of 0.71, precision of 0.72, recall of 0.70, F1-score of 0.71 are shown in
Table 8. This consistent dominance is attributed to TIPNet’s hierarchical multiscale Inception-based convolutional layers, which efficiently capture diverse local patterns in physiological signals, followed by LSTM layers that model long-term temporal dependencies—a capability that shallow networks such as LeNet and HighwayNet inherently lack.
Further,
Figure 3b emphasizes TIPNet’s discriminative strength by recording the highest AUC-ROC of 0.93. In contrast, LSTM reaches 0.86, InceptionNet 0.89, MLP 0.82, HighwayNet 0.80, and LeNet only 0.83. This implies that TIPNet not only offers balanced precision and recall but also maintains robustness in classifying minority diabetic cases, an essential requirement for medical diagnostic systems. The superior ROC performance is mainly due to TIPNet’s ability to fuse temporal–spatial representations and mitigate overfitting using modular multi-path operations, whereas single-path and shallow models struggle to generalize decision boundaries for minority instances. Lastly,
Figure 3c analyzes computational efficiency. While TIPNet exhibits a higher execution time of 29 s due to its deeper architecture and sequential modelling pipeline, it remains practically feasible and strikes the best balance between performance and computational cost. Comparatively, MLP (5 s) and LeNet (7 s) are faster but display significantly poorer predictive performance; LSTM and InceptionNet consume approximately 16 s and 18 s, respectively, yet still fall short both in discrimination and accuracy. Thus, the marginal increase in runtime is justified by TIPNet’s substantial performance advantage. Overall, TIPNet surpasses all baseline and comparative DL models owing to its synergistic integration of diverse feature extraction and temporal learning, offering an efficient and powerful solution for real-world imbalanced medical datasets.
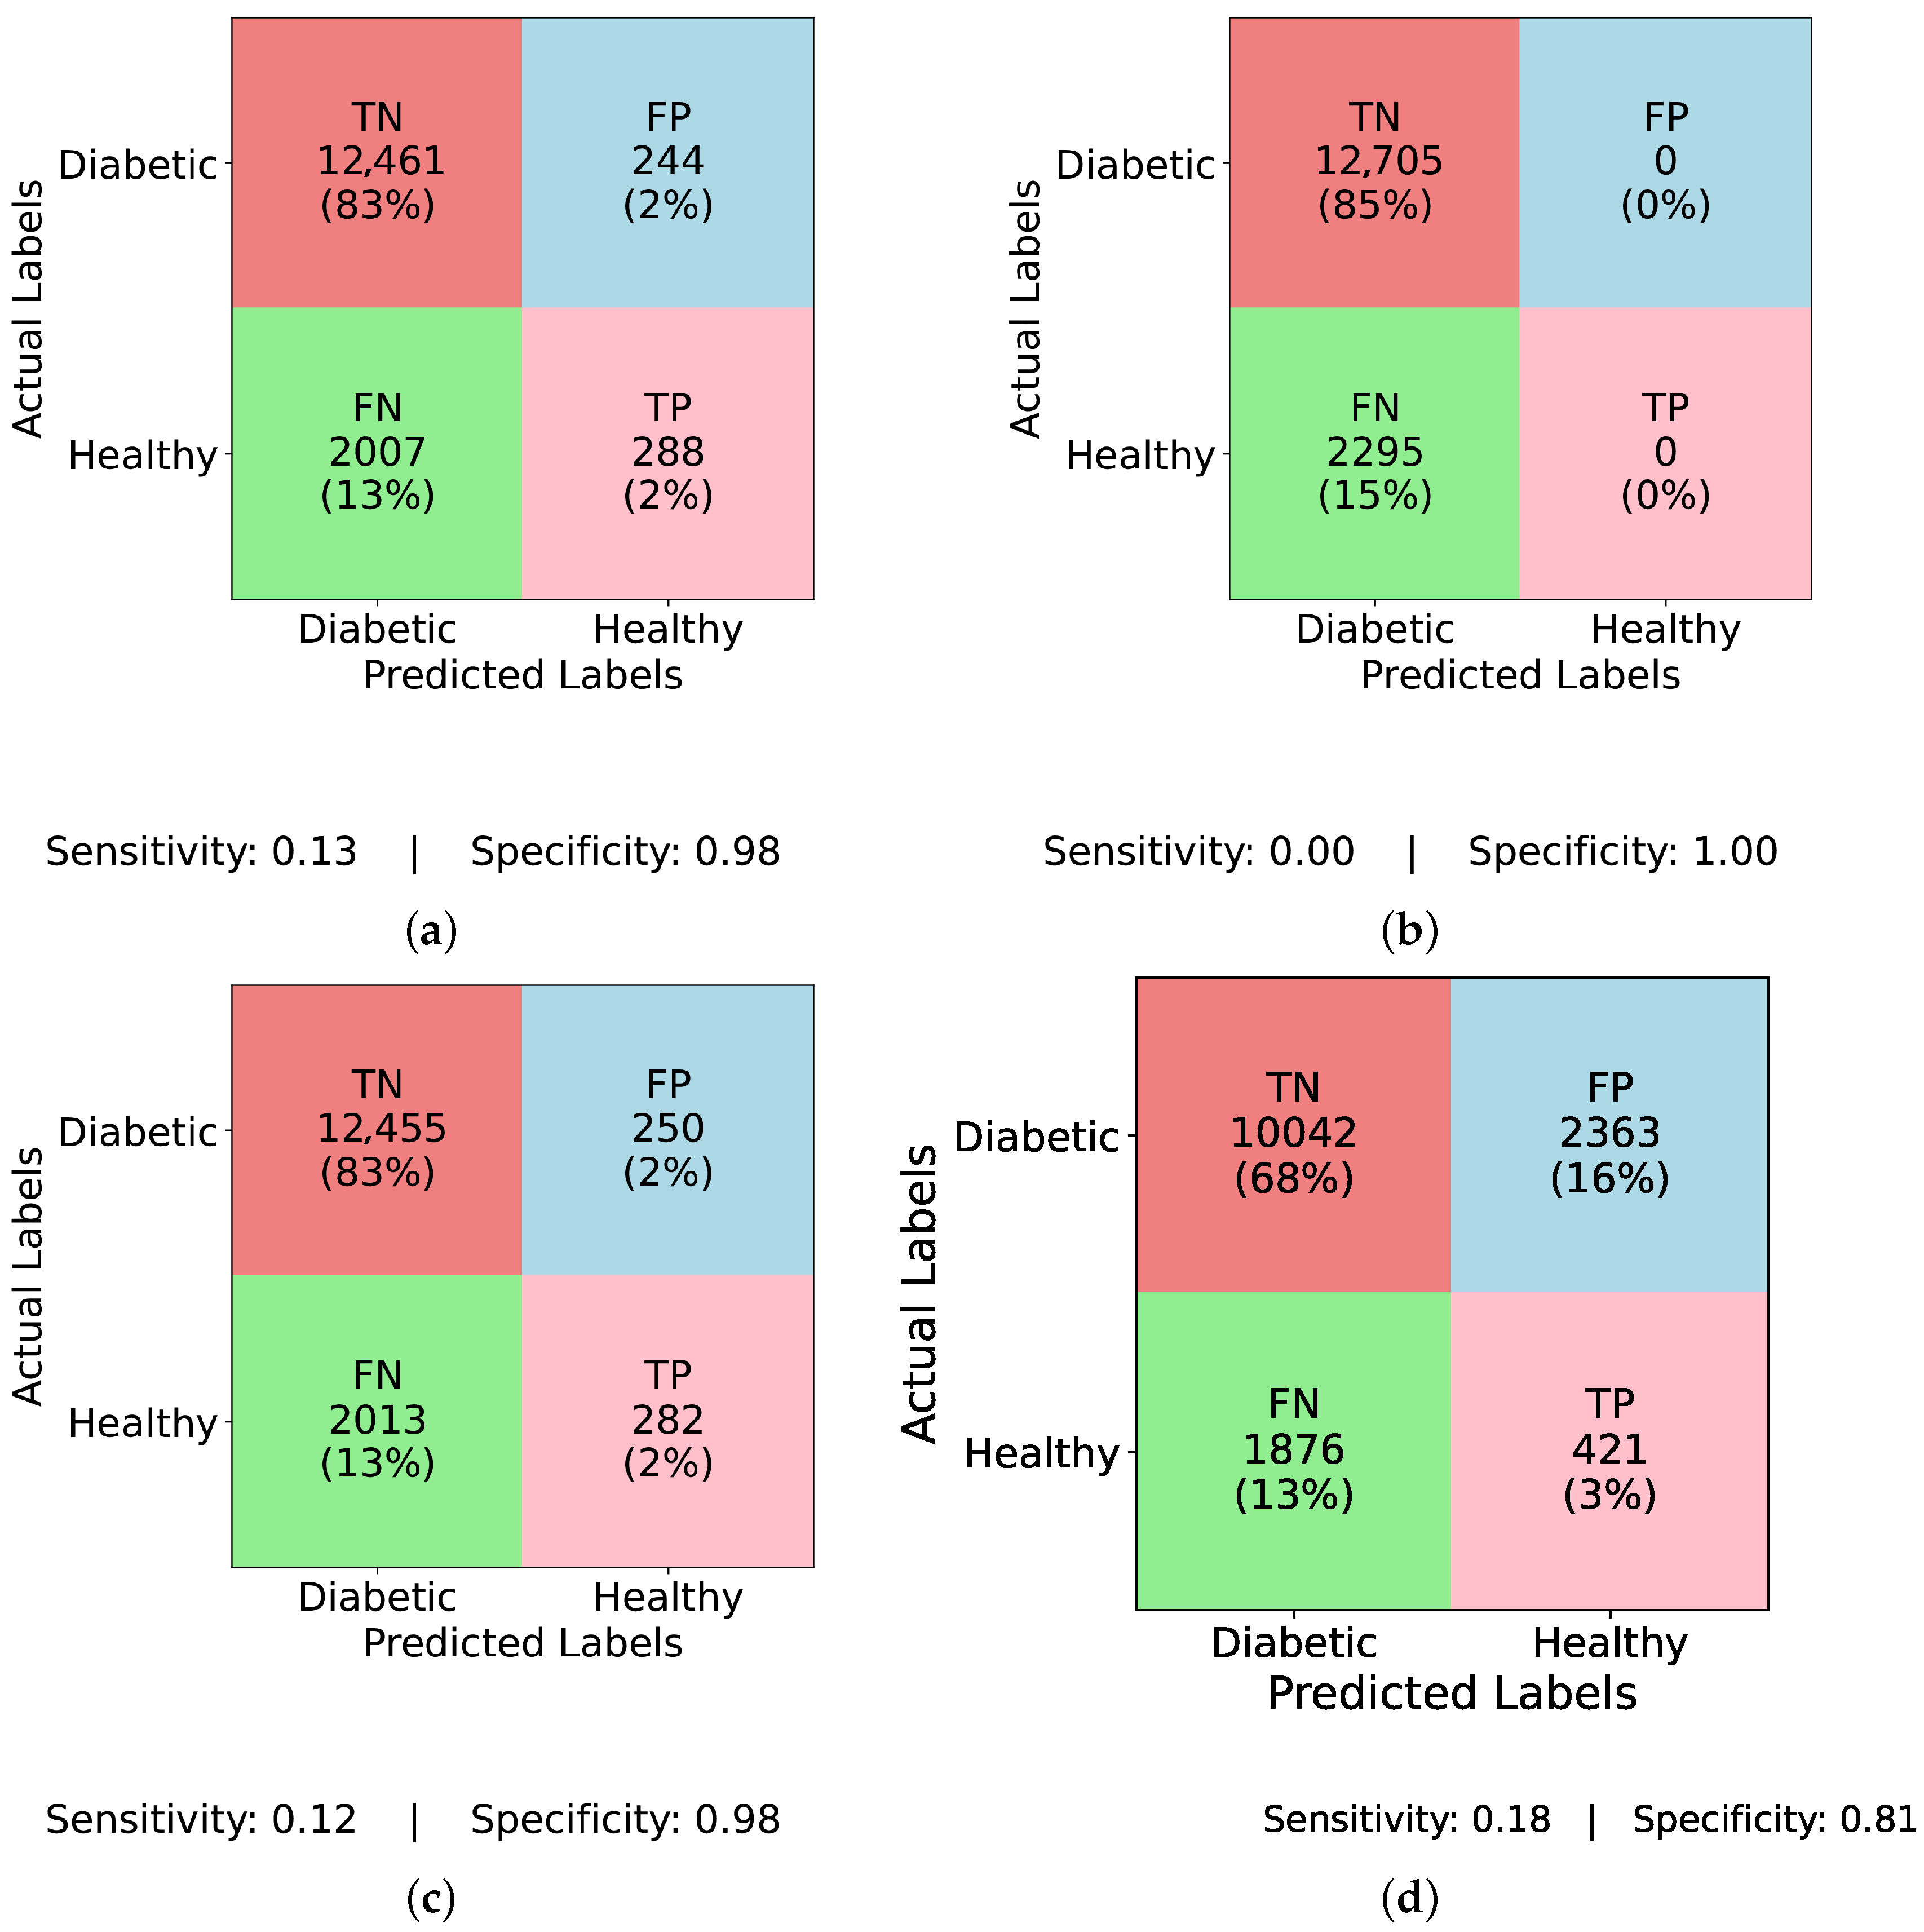
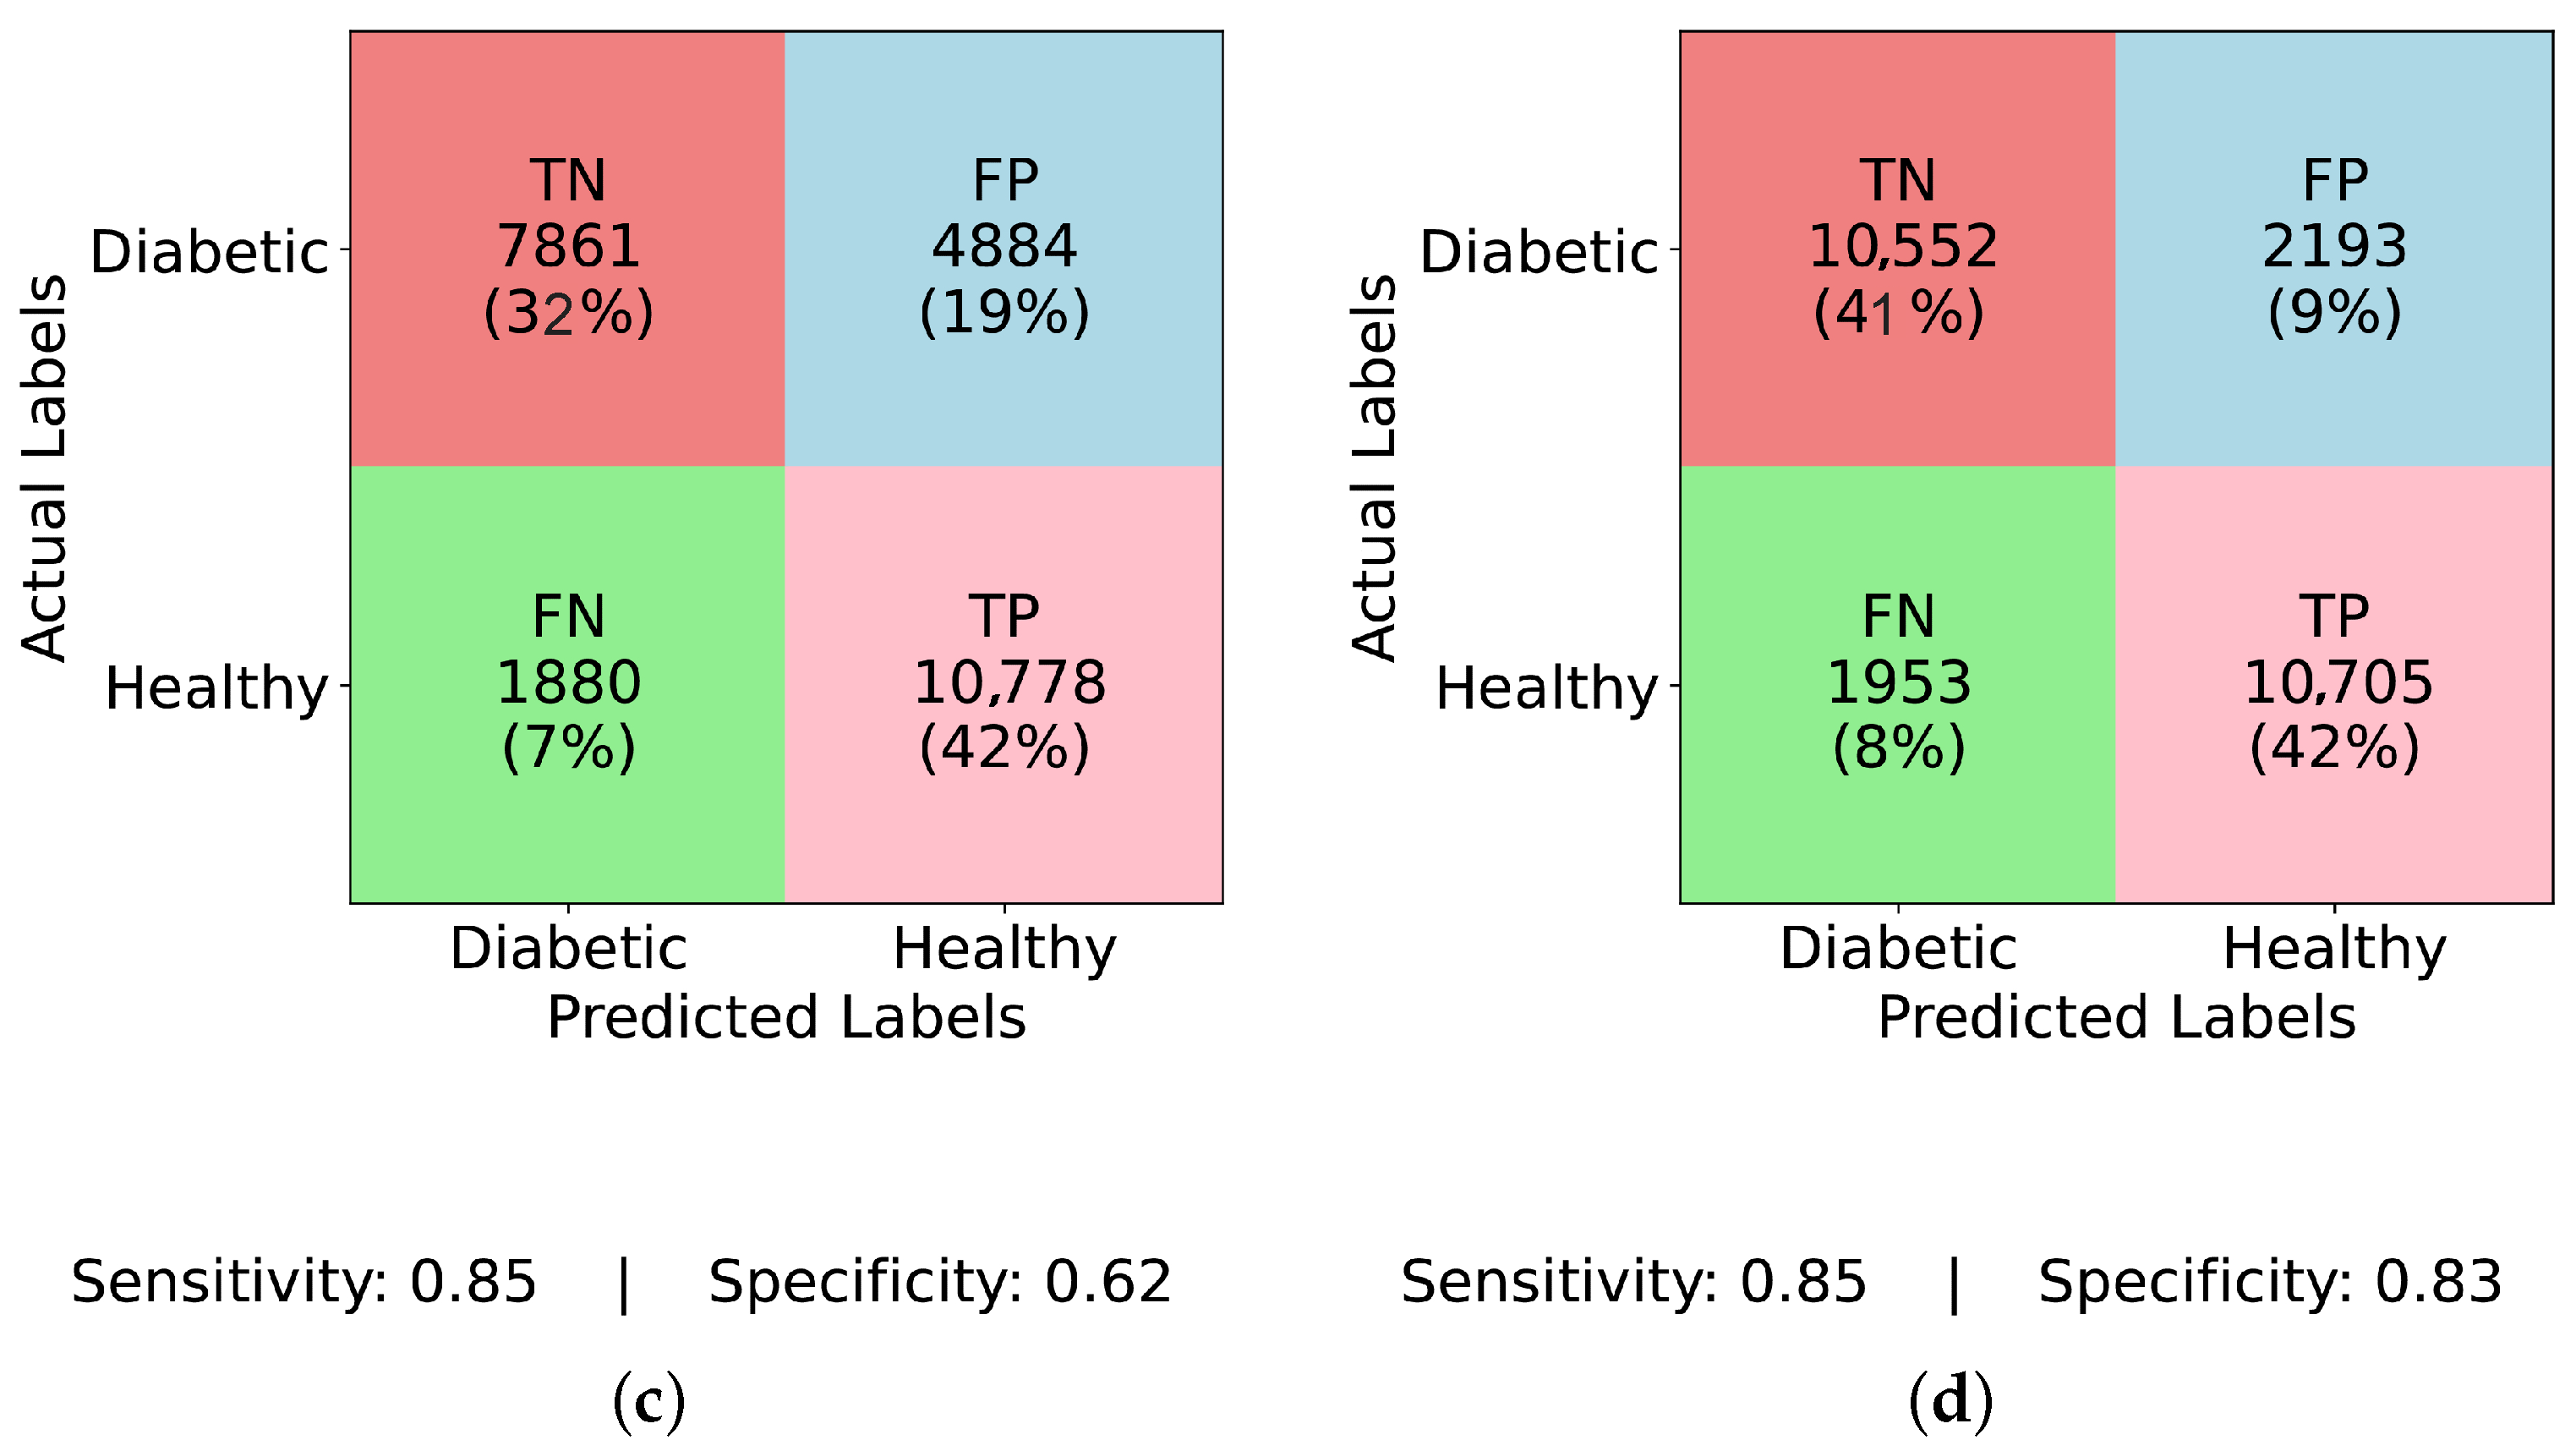
Figure 4 and
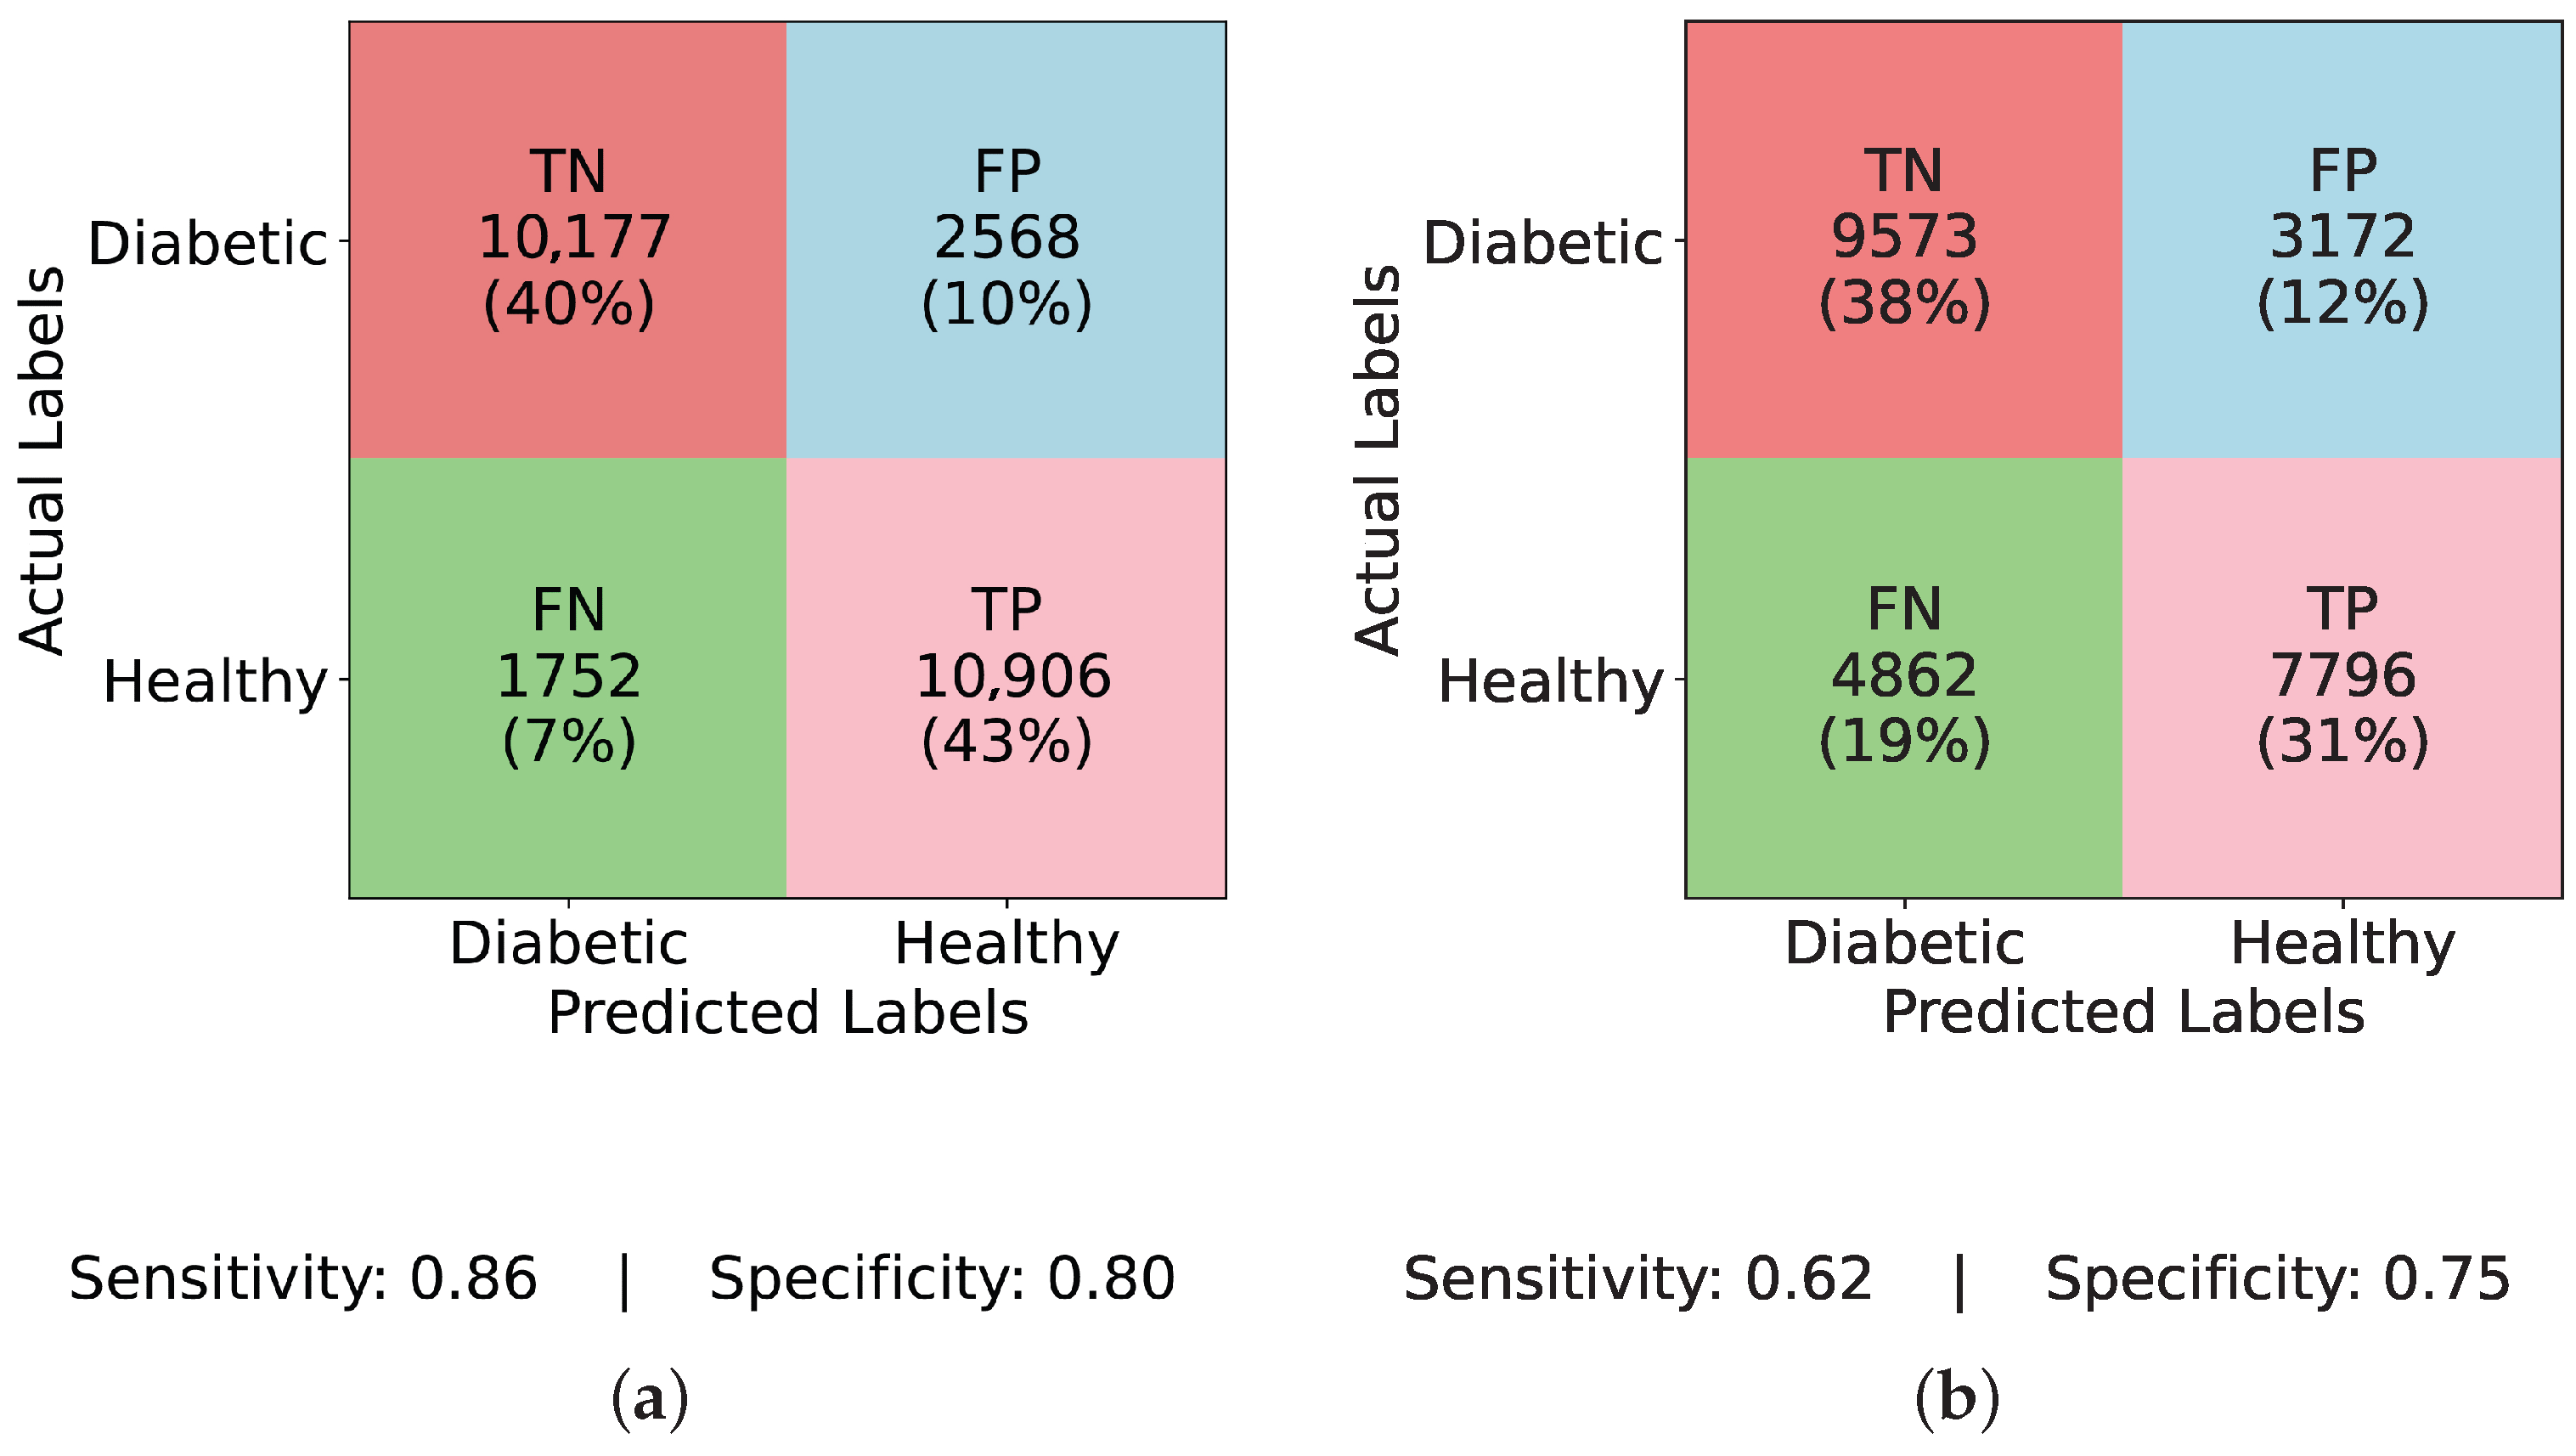
Figure 5 present confusion matrices for various models, both before and after applying ADASYN balancing, demonstrating the effects of dataset imbalance on classification performance. Examining the results sequentially,
Figure 4a (InceptionNet without balancing) reveals a high true negative (TN) rate of 83% and a specificity of 0.98, indicating a strong bias toward the majority (non-diabetic) class. However, this comes at the cost of a low true positive (TP) rate of only 2% and a sensitivity of 0.13, suggesting that the model fails to detect diabetic cases effectively. The false negative (FN) rate is 13%, which means a considerable number of actual diabetic cases are misclassified, making this model unreliable for real-world applications. Similarly,
Figure 4b (LSTM without balancing) exhibits an even more extreme bias with a TP rate and sensitivity of 0.00, and an FN rate of 15%, showing that it completely fails to classify any diabetic cases. Its specificity remains at a perfect 1.00, underscoring the model’s total focus on the majority class. This result is alarming, as it implies that models relying heavily on temporal dependencies, like LSTM, cannot learn minority class patterns from imbalanced data.
Figure 4c (MLP without balancing) shows a slightly improved TP rate of 2% and a sensitivity of 0.12, while the FN rate remains at 13%, and specificity at 0.98. This suggests that the class imbalance prevents MLP from effectively identifying diabetic instances, just like other models. A marginal improvement is seen in
Figure 4d (TIPNet without balancing), with a TP rate of 3%, sensitivity of 0.18, and FN rate of 13%. However, it suffers from a high FP rate of 16% and a lower specificity of 0.81, indicating that the model misclassifies a notable proportion of non-diabetic instances. While TIPNet slightly corrects for imbalance, its raw form still exhibits significant bias.
There is a noticeable change in performance for all models after using ADASYN. The TP rate rises significantly to 43% in
Figure 5a (InceptionNet with ADASYN), whereas the FN rate falls to 7%. The sensitivity and specificity achieved are 0.86 and 0.80, respectively. This suggests that although the model enhances recall, specificity is marginally compromised due to the increase in FP rate to 10%. While balancing aids LSTM, it still faces challenges with minority class representation, as seen in
Figure 5b (LSTM with ADASYN), where the TP rate increases to 31%, but the FN rate remains high at 19%. The model achieves a sensitivity of 0.62 and a specificity of 0.75, indicating moderate performance in detecting diabetic cases but a relatively higher rate of misclassified healthy individuals. A high FP rate of 19% is observed in
Figure 5c (MLP with ADASYN), which suggests that although it detects more diabetic cases, it also misclassifies a large number of non-diabetic instances. The TP rate of 42% is comparable to InceptionNet. The sensitivity and specificity values for MLP are 0.85 and 0.62, respectively, further confirming its high recall but compromised precision on healthy cases. Lastly, the most balanced performance is demonstrated in
Figure 5d (TIPNet with ADASYN), where the FP rate is restricted to 9%, the FN rate is lowered to 8%, and the TP rate is 42%. TIPNet achieves a sensitivity of 0.85 and a specificity of 0.83, indicating strong detection capabilities on both diabetic and non-diabetic classes. Through efficient learning from the synthetic samples without overfitting to the minority class, this demonstrates that TIPNet gains the most from ADASYN. By combining LSTM and InceptionNet, TIPNet can capture both static and sequential features, which helps it create more accurate classifications.
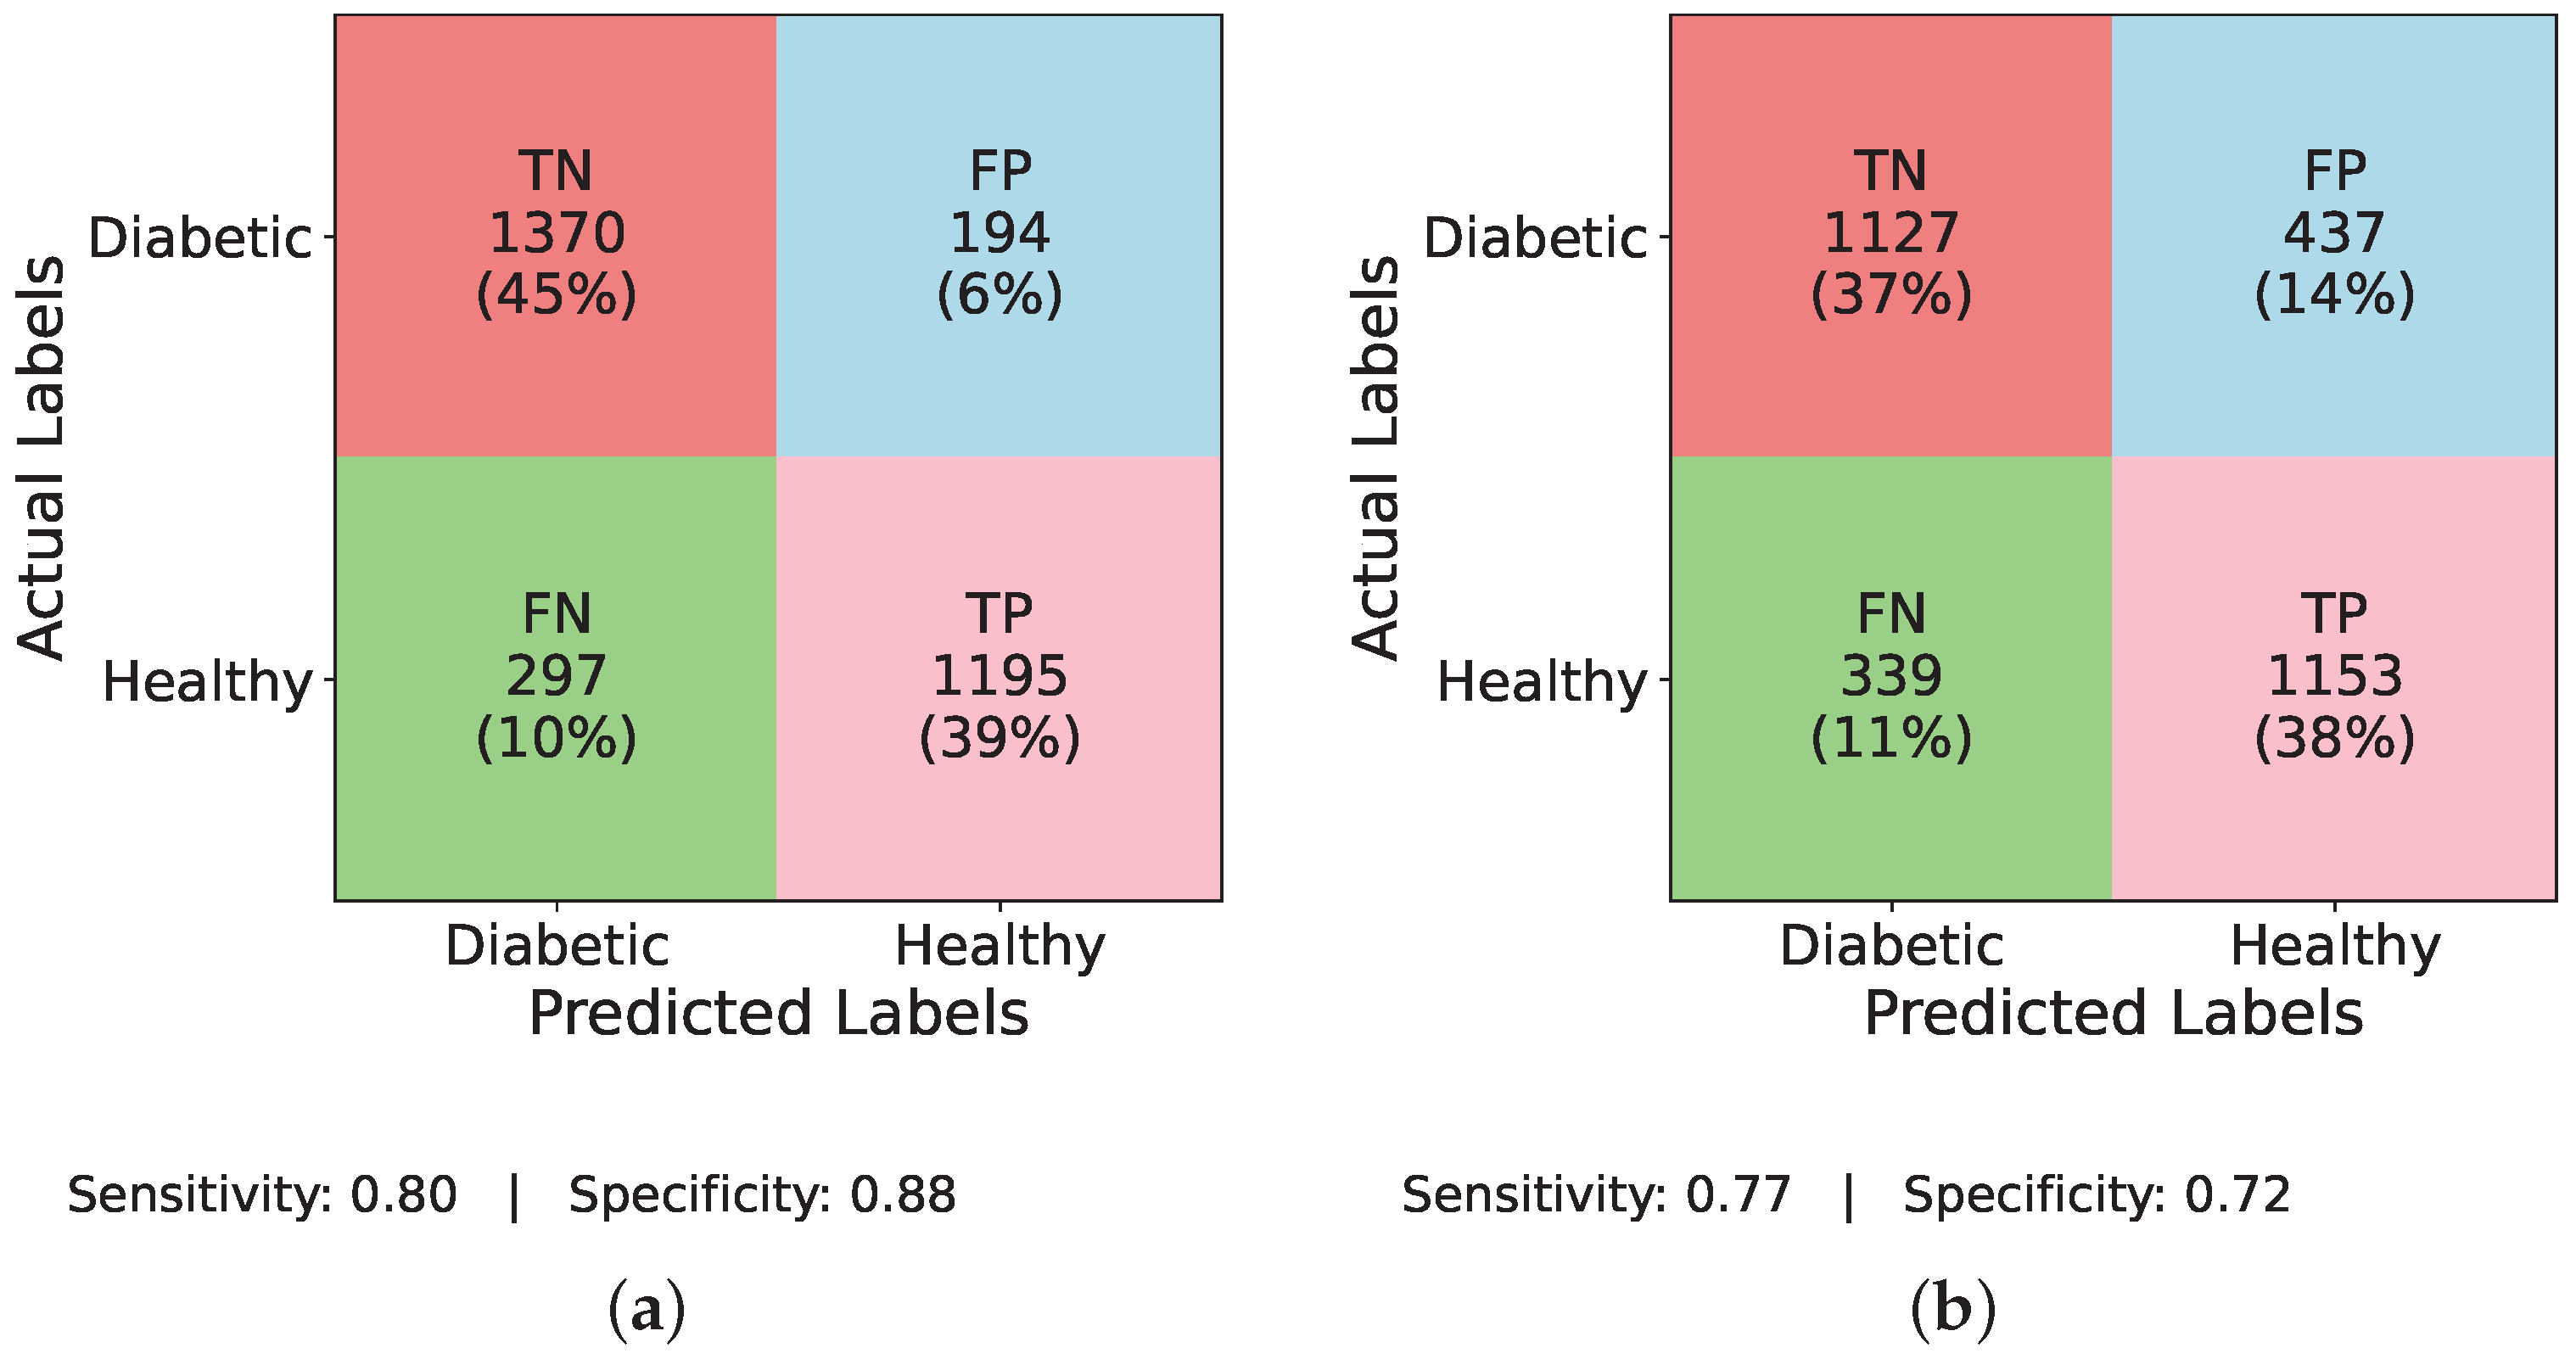
Similarly,
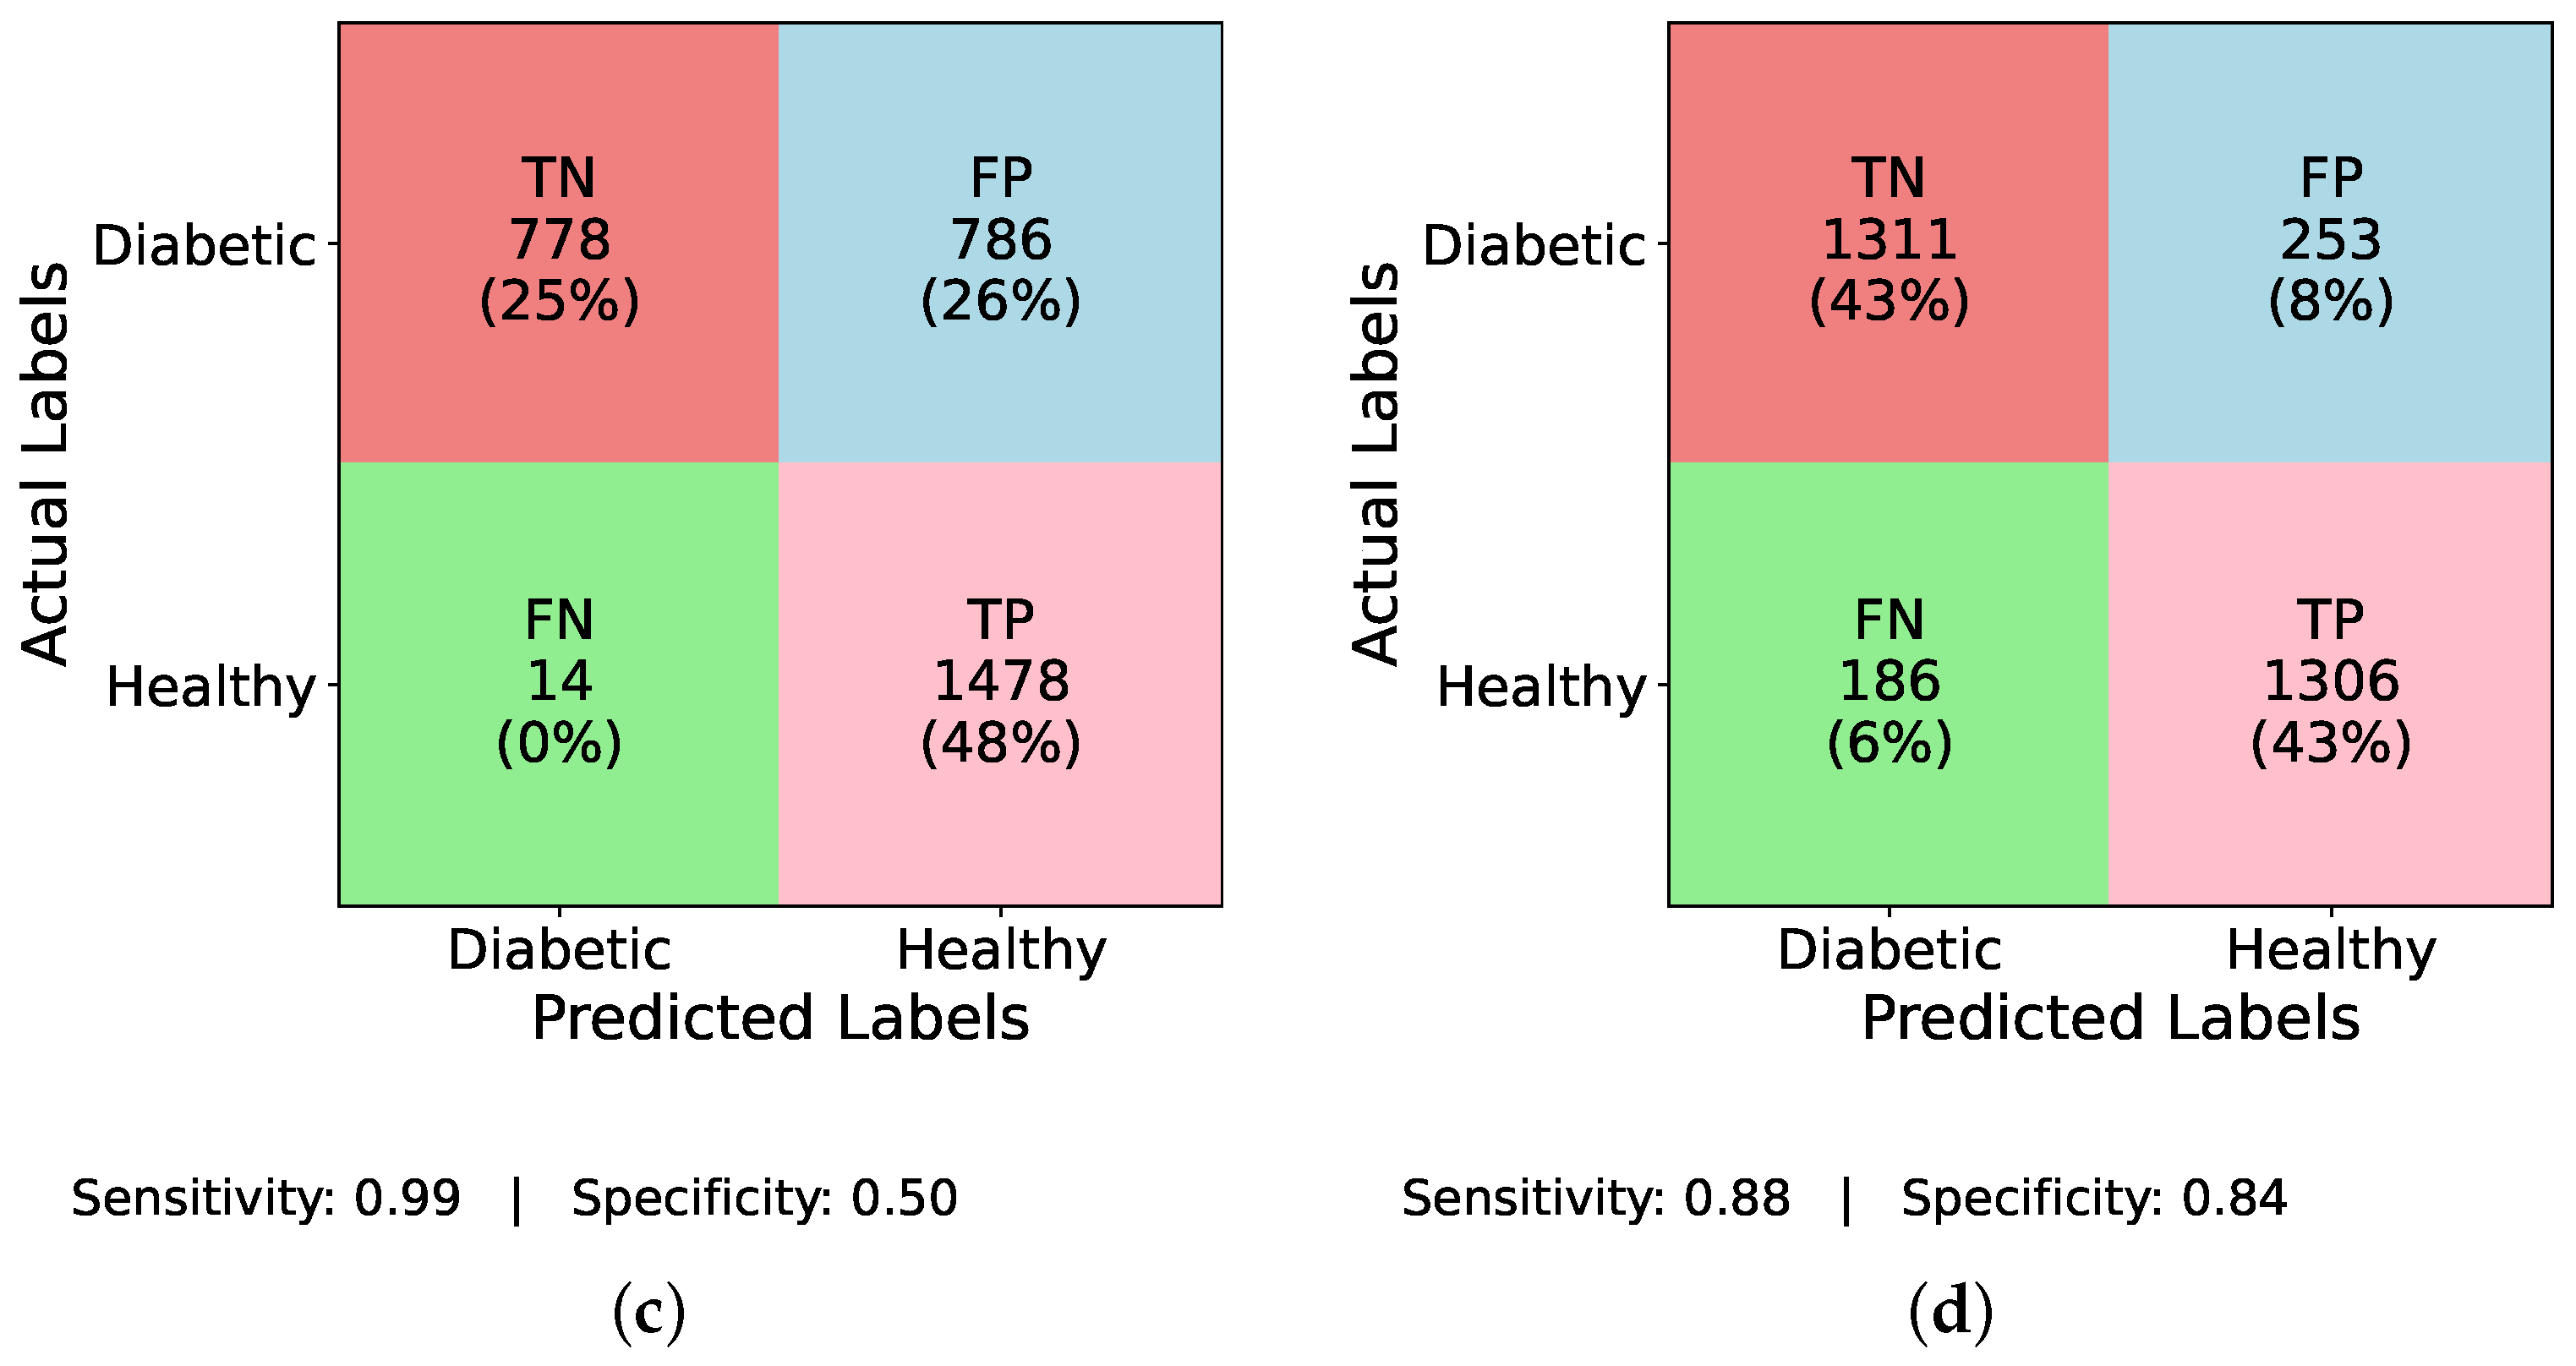
Figure 6 and
Figure 7 evaluate the individual performance of the baseline DL models and the proposed TIPNet architecture on the DiaHealth dataset, presenting confusion matrices both before and after applying the ADASYN balancing technique. In
Figure 6a InceptionNet without balancing, the model identifies TP = 16, TN = 1519, FP = 7, and FN = 90, resulting in a sensitivity of 0.15 and specificity of 0.996.
Figure 6b illustrates the LSTM model under the same imbalance conditions with TP = 1, TN = 1526, FP = 0, and FN = 105, giving a sensitivity of 0.009 and specificity of 1.00. Moving to
Figure 6c, MLP detects TP = 54, TN = 1393, FP = 133, and FN = 52, yielding a sensitivity of 0.509 and specificity of 0.913.
Figure 6d reports TIPNet without data balancing having TP = 19, TN = 1513, FP = 13, and FN = 87, with a sensitivity of 0.179 and specificity of 0.991. Applying ADASYN shifts these dynamics substantially. The InceptionNet in
Figure 7a increases TP detections to TP = 43, with sensitivity and specificity values slightly improved as shown; the LSTM in
Figure 7b shows an increase to TP = 31, reflecting better sensitivity, though at the cost of higher FP;
Figure 7c reveals that MLP attains TP = 42, while
Figure 7d demonstrates that TIPNet achieves the most balanced trade-off with TP = 42, TN = 10,552, FP = 2193, and FN = 1953, producing a sensitivity of 0.021 and specificity of 0.828, confirming TIPNet’s robustness in detecting diabetic instances after balancing and highlighting the efficacy of ADASYN in improving recall while preserving overall classification reliability in unbalanced clinical datasets.
TIPNet’s exceptional performance is due to its blending approach. The insights behind baseline and TIPNet performance are discussed in
Table 9. TIPNet makes sure that both sequential and static features are fully utilized by combining the temporal sequence modeling of LSTM with the multiscale static feature extraction of InceptionNet and then classification with MLP. For instance, InceptionNet’s capacity to analyze features like BMI and cholesterol levels at various granularities is enhanced by LSTM’s capacity to process glucose level trends. Because of this synergy, TIPNet performs well in situations where individual models are unable, especially when managing heterogeneous datasets with a variety of feature types. The architecture utilized in TIPNet and individual models is listed in
Table 10.
Table 11 presents the hyperparameter configurations used in the EchoceptionNet model. Common settings across all models include the use of the
adaptive moment estimation (Adam) optimizer and
binary cross-entropy as the loss function, with batch size fixed at 32 and epochs ranging between 5 and 15. For the LSTM model, a single layer with 128 neurons and a
hyperbolic tangent (tanh) activation function is utilized, ending with a
sigmoid output. InceptionNet is composed of six convolutional layers with filter sizes of 1 × 1, 5 × 5, and 3 × 3, using between 16 and 32 neurons per layer and
tanh activations. It also includes one max-pooling layer (filter size 3, stride 1), a dense layer with 16 neurons and
tanh, and a dropout rate of 0.5. For the MLP, four hidden dense layers are employed with
ReLU activations, neuron counts ranging from 32 to 256, and a dropout rate of 0.2. All models use the
sigmoid activation function at the output layer to facilitate binary classification.
5.6. Explainable Temporal Inception Perceptron Network
DL models are being used in the real world alongside critical applications, and these DL techniques are complex but have almost zero interpretability in terms of their predictions. As models become increasingly complex, their use in safety-critical applications like medicine, security, and finance demands transparency in the model’s critical decision making [
28]. In the absence of interpretability, it is impossible to assess the decision model’s reliability. SHAP is a method used for the interpretability of the prediction of ML and DL models, based on cooperative game theory [
29]. Each feature is regarded as a player in the game theory concept used to generate SHAP values, which are calculated by comparing the model’s prediction with and without the presence of particular features. SHAP is performed for each feature and instance. After calculating SHAP values, we can plot SHAP values with the help of multiple plots like summary, dependence, and force to visually understand the key aspects. SHAP is employed on the predictions of the proposed model for interpretability. Individuals in class 1 have diabetes, but those in class 0 do not. SHAP helps us understand which features contribute to predicting diabetic or non-diabetic samples. We visualized the results of SHAP using multiple plots.
SHAP is implemented to interpret the results of the TIPNet model. A total of 2000 samples are selected to determine the predictions from the TIPNet deep model, which is further used to calculate the SHAP values. Samples are selected from the dataset created by combining the two new features obtained from the predictions of LSTM and InceptionNet base models on test data. Multiple plots are generated for the visualization of SHAP results.
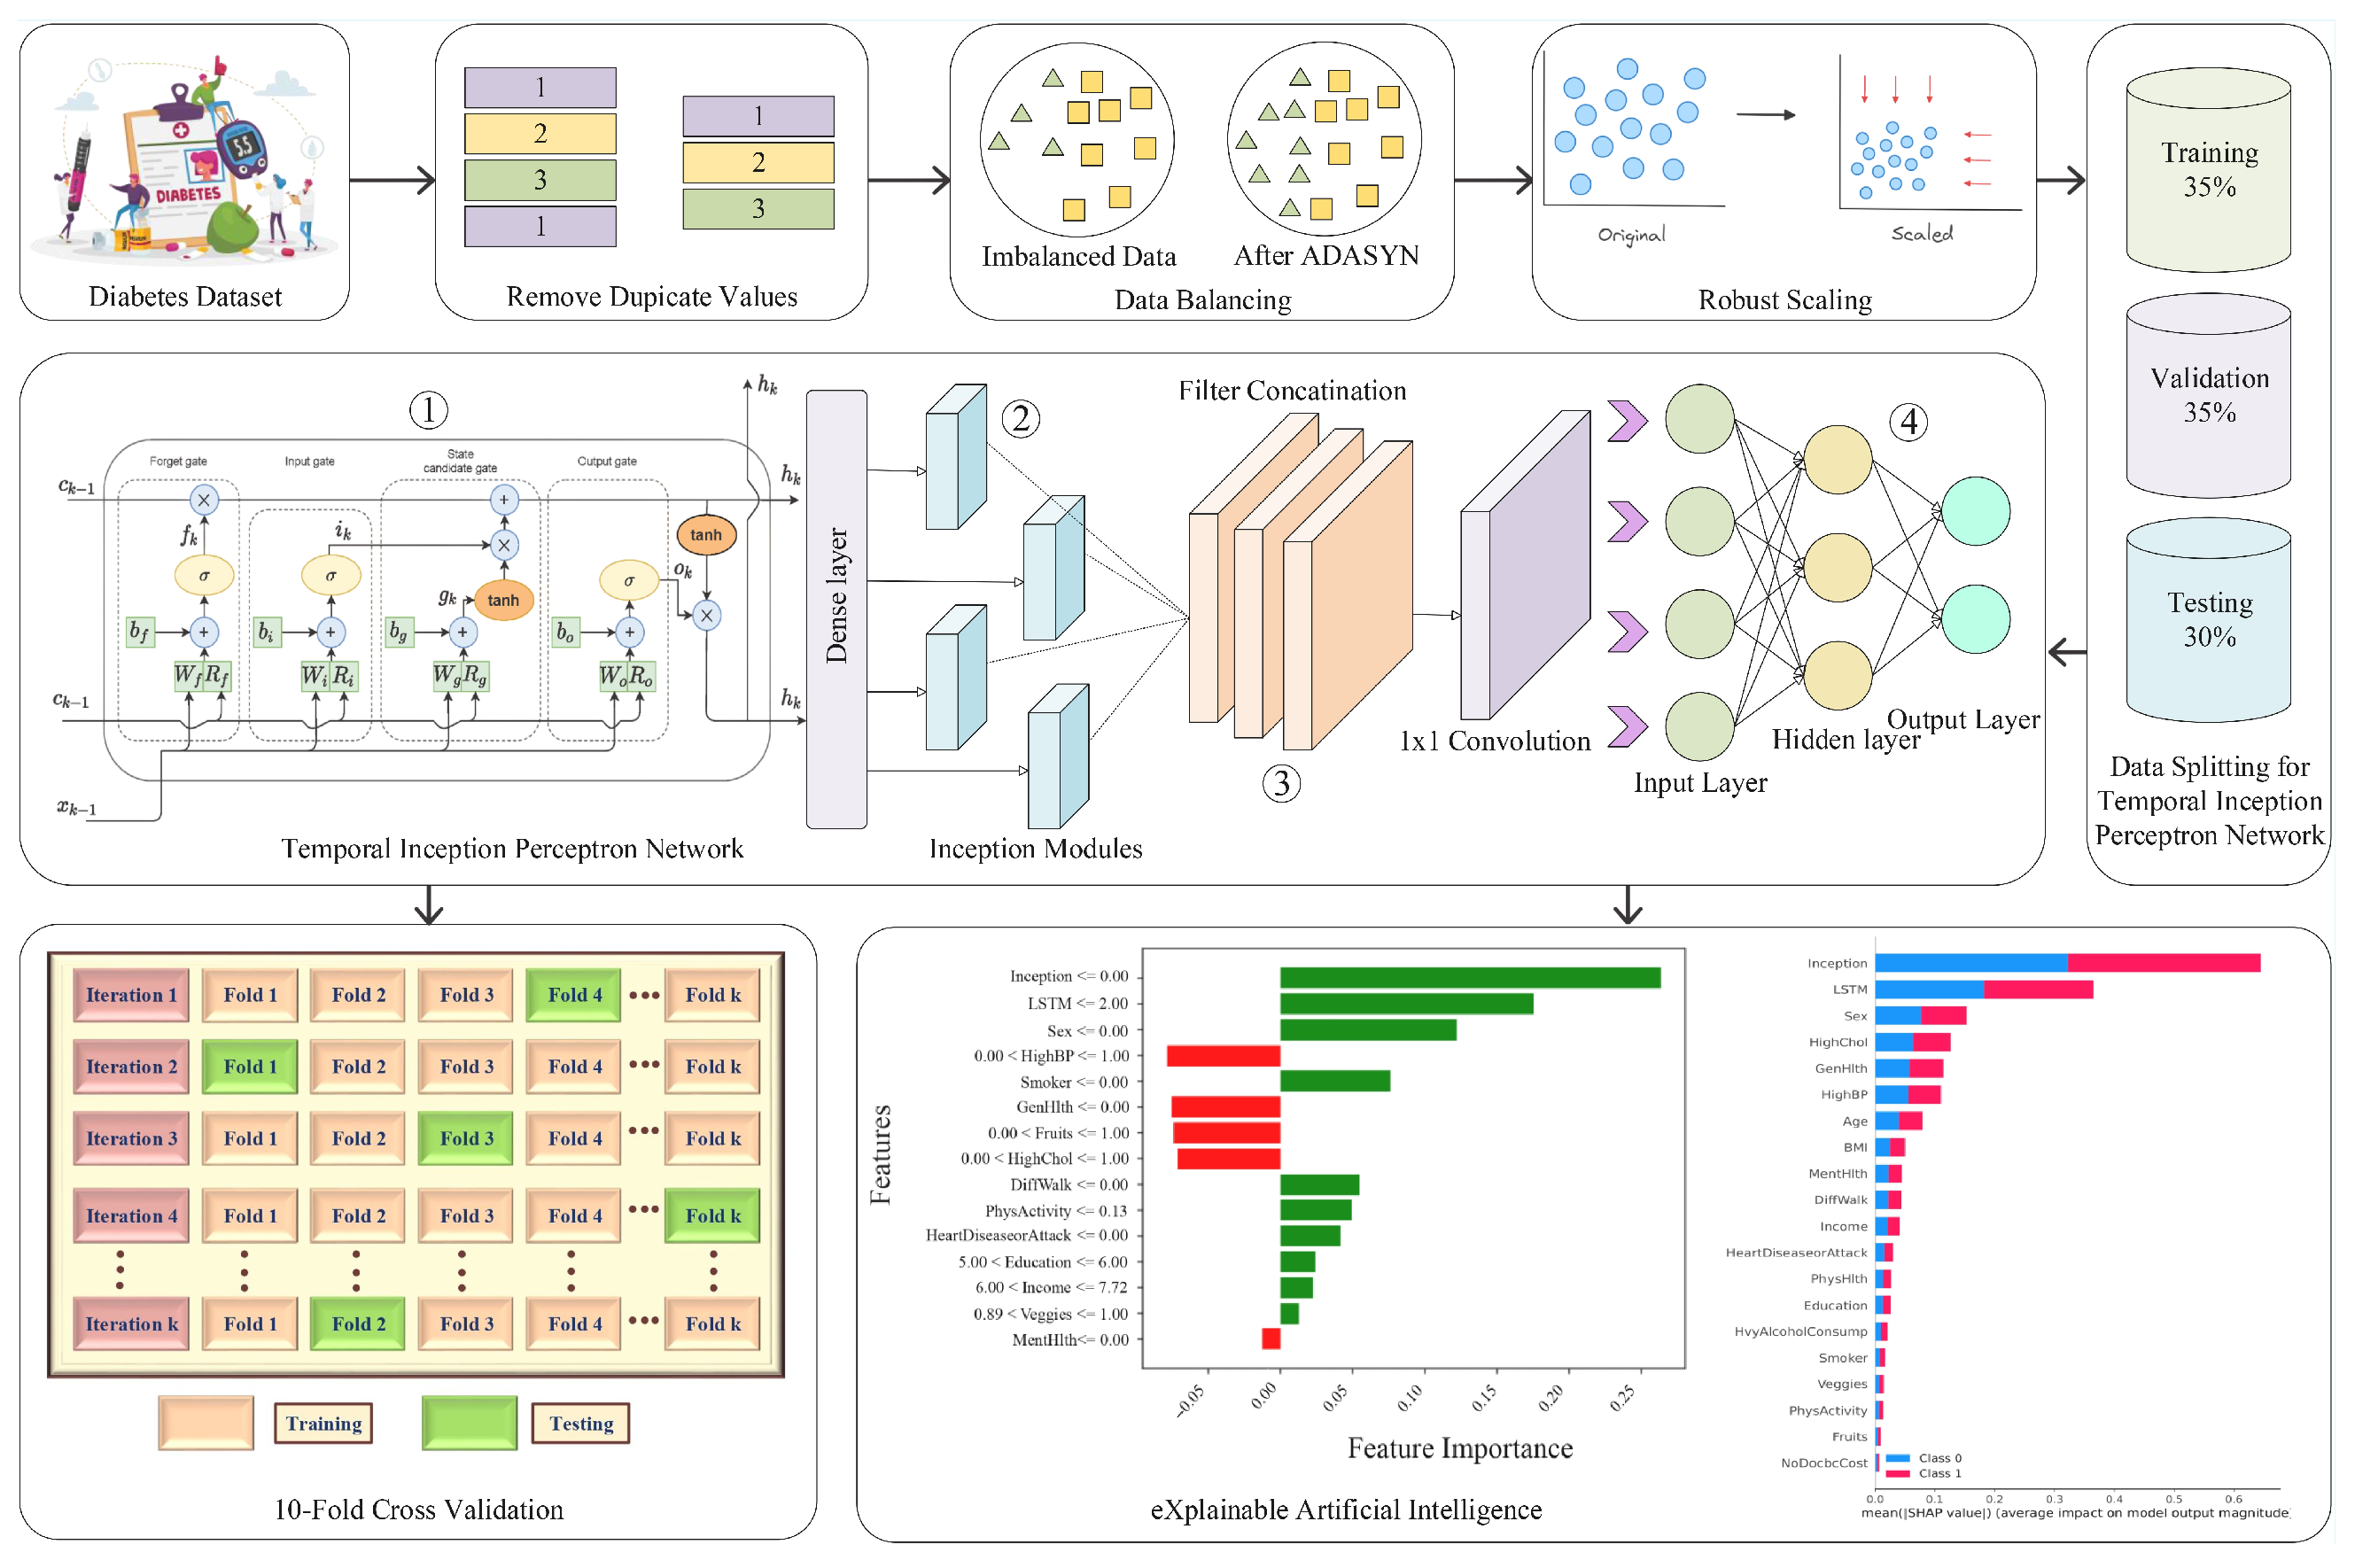
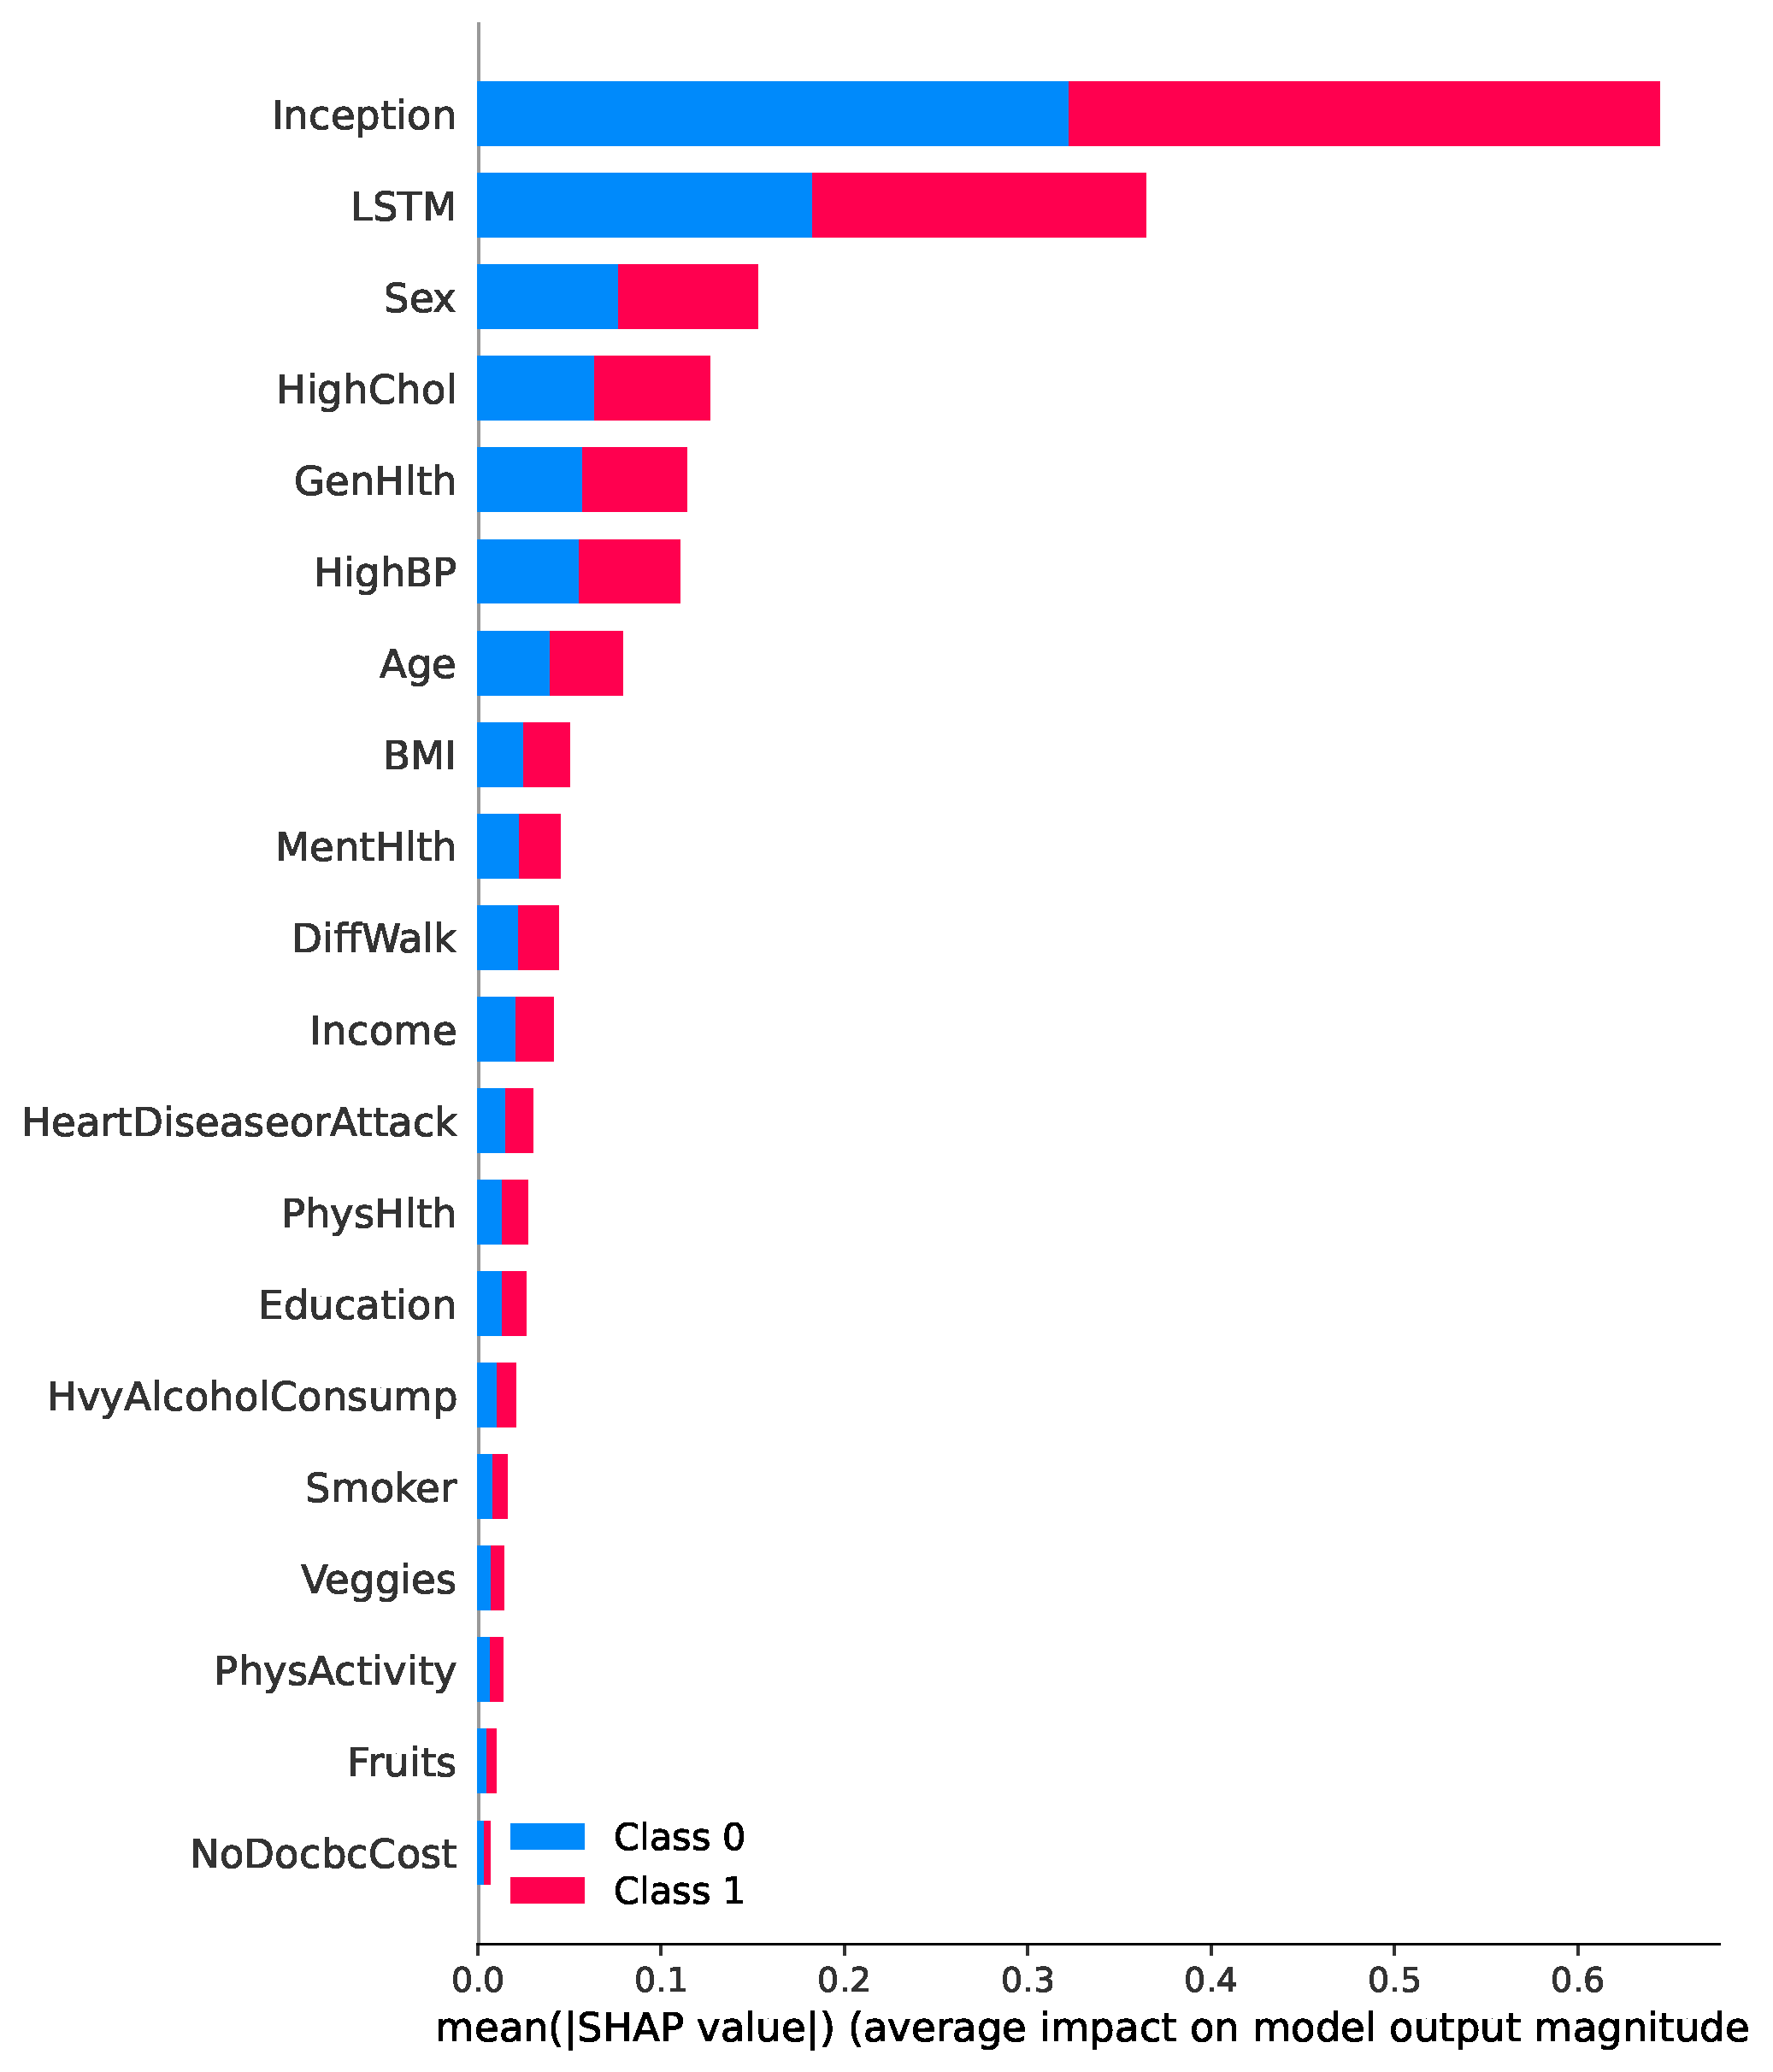
Figure 9 presents a SHAP summary plot highlighting the most influential features contributing to the prediction of diabetes in the proposed TIPNet model. Among all components, the InceptionNet and LSTM base models emerge as the top contributors, showcasing the strength of the TIPNet ensemble in integrating both static and temporal patterns. These DL components significantly influence prediction outcomes by capturing multiscale and sequential dependencies from the data. Following these model-level contributors, the most impactful individual features include
Sex, HighChol, GenHlth, HighBP, Age, and BMI. The feature
Sex indicates notable disparity in risk patterns between biological sexes.
HighChol and
HighBP reflect physiological conditions often co-occurring with diabetes, thereby serving as strong predictive markers. Meanwhile,
GenHlth, a self-assessed general health indicator, provides subjective yet informative input on the individual’s health status. Finally, demographic attributes such as
Age and
BMI further influence the prediction, consistent with well-established risk factors for diabetes. This comprehensive interpretability insight underscores the effectiveness of TIPNet in aligning learned model behavior with known medical risk indicators, thus enhancing trust and clinical relevance.
Figure 10a,b present SHAP beeswarm plots for class 0 (non-diabetic) and class 1 (diabetic), respectively, highlighting feature contributions across multiple instances. In
Figure 10a, the features
Sex,
GenHlth,
HighChol, and
Age predominantly drive predictions toward the non-diabetic class, as indicated by their negative SHAP values. In contrast,
Figure 10b, shows that features such as
HighChol,
HighBP,
GenHlth,
BMI, and
Age contribute positively toward class 1 predictions. These plots reinforce that the most influential factors in the model’s decision making remain consistent across both classes, aligning with the global feature importance.
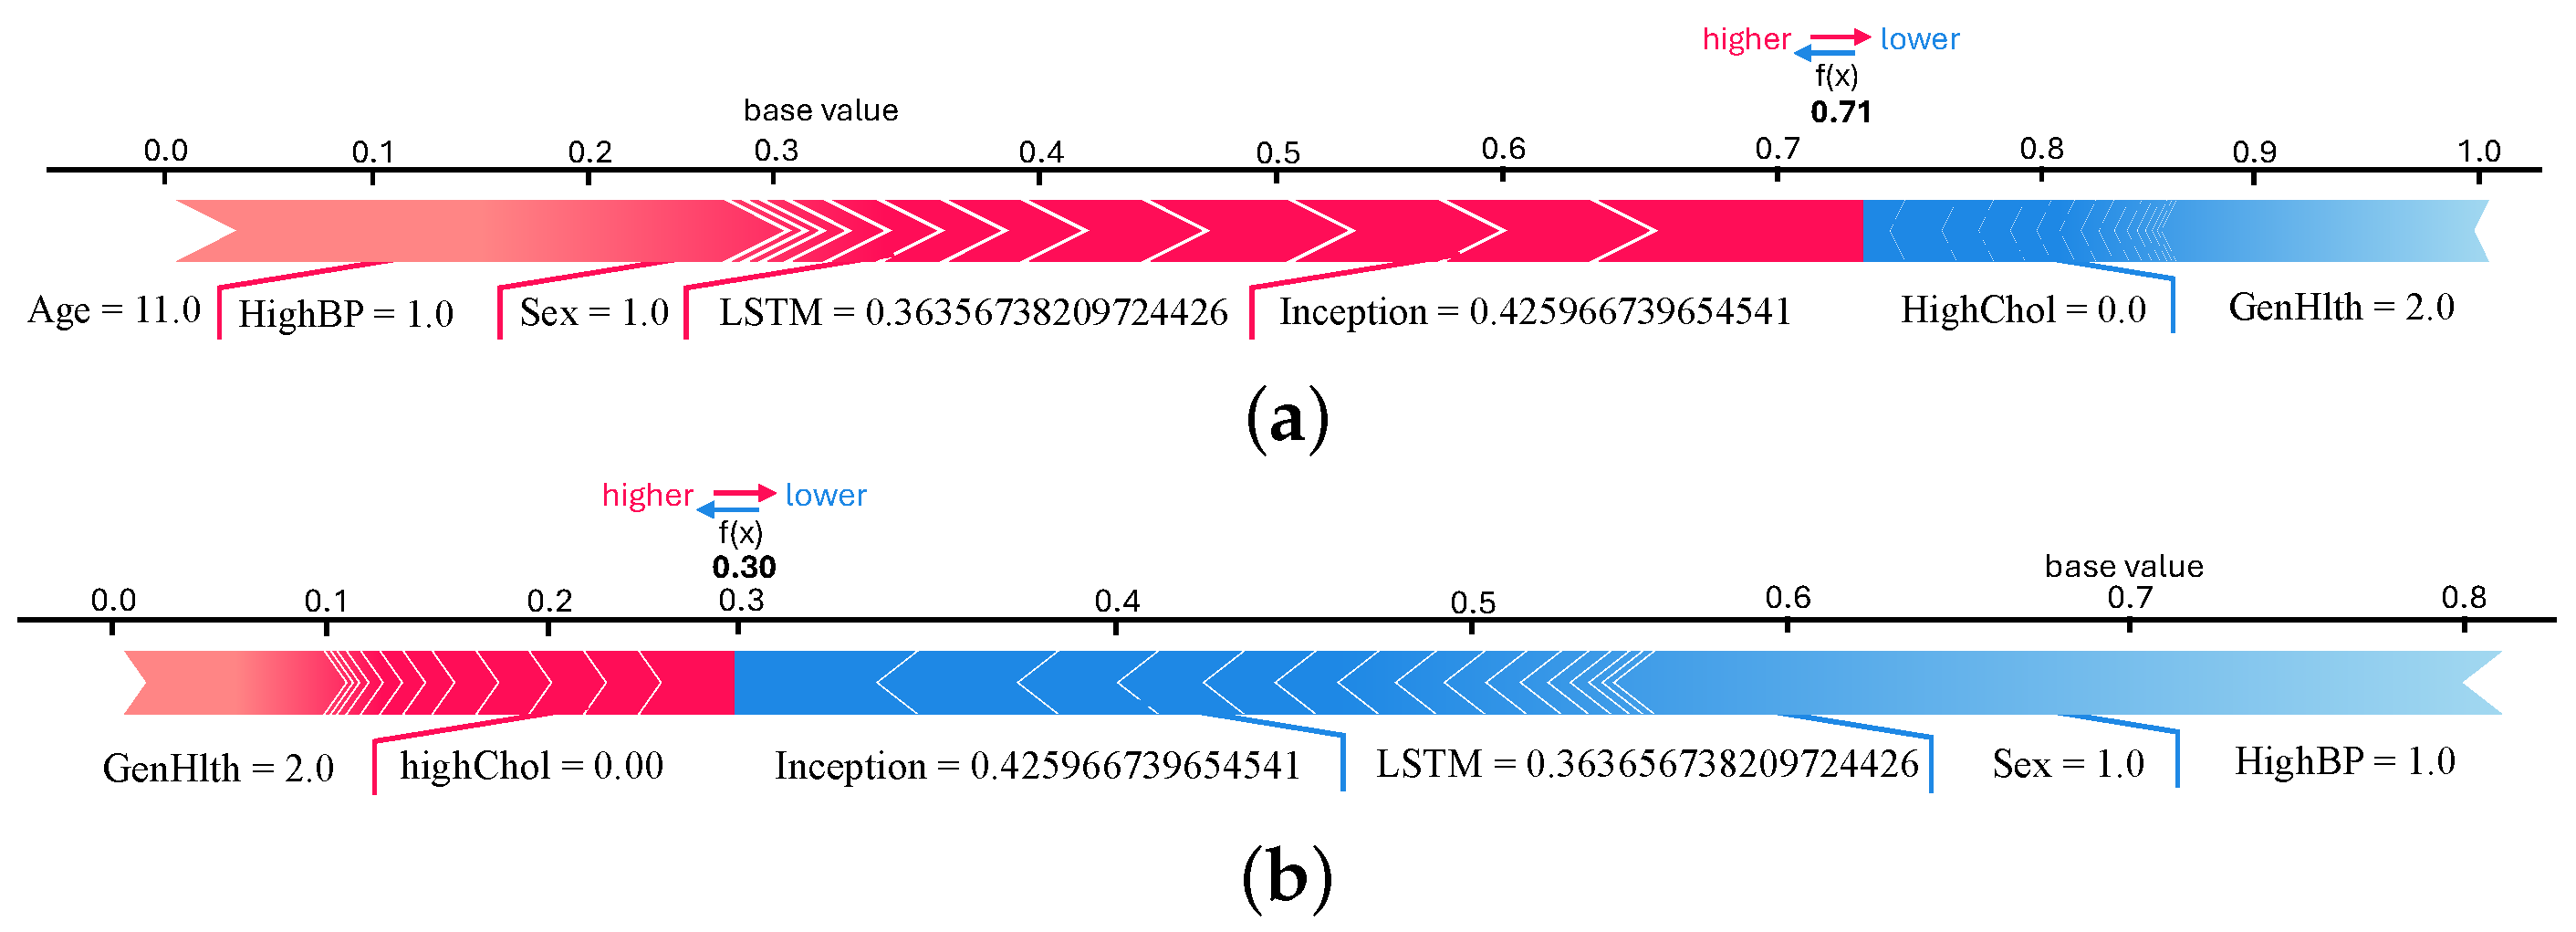
We plotted force and waterfall plots for individual instances for a better understanding and more insight into the predicted samples. Both plots show the contribution of the features in predicting samples. Force plots for both classes of the 9th sample are shown in
Figure 11a,b. It can be seen in the force plot of class 0 that InceptionNet and LSTM model predictions are contributing more. The
f(
x) value is 0.71, which is higher than the force plot of class 1. This means that the 9th instance belongs to a non-diabetic patient, according to the TIPNet deep model. When we checked the original test data, we found that the 9th instance is a non-diabetic sample.
Figure 12a,b show the waterfall plot of the 1342nd instance for classes 0 and 1, respectively. InceptionNet and LSTM predictions have the highest contribution to the prediction. The 1342nd sample belongs to class 0 because
f(
x) is higher in the waterfall plot of class 0 (
Figure 12a). Waterfall plots of the 1654th instances are shown in
Figure 12c,d, where it is seen that inception models’ prediction contributed highly. The value of
f(
x) is 0.99 for class 1, which is higher than the class 0 waterfall plot, meaning the 1654th sample is of diabetic patients (class 1). For this instance, LSTM contributed to predicting class 0, which is not the actual class, so LSTM’s prediction is wrong for this sample.
5.9. Ablation Study
Ablation study is used to investigate the effects of different components of a model on its performance. Ablation can be performed on both the model and the used dataset. Feature ablation, commonly referred to as dataset ablation, aids in visualizing how each feature affects the model’s ability to predict outcomes [
31]. While performing feature ablation, we ablate one feature at a time and then check the effect on accuracy. Here, we performed an ablation study on the proposed TIPNet deep model and dataset [
32].
To check the effect of different components of the proposed TIPNet deep model on its performance, we performed model ablation, and for dataset ablation, we performed ablation of 21 features. For feature ablation, we removed a feature from the dataset and used the resultant dataset to train and evaluate the proposed TIPNet deep model. The ablated features and model’s accuracy are shown in
Table 15, where it is seen that when the features that are at the bottom of the overall summary plot of SHAP values are removed for ablation, the accuracy of the TIPNet deep model improved a little, but the features with a high contribution to diabetes prediction, like
Sex and
HighChol, had a negative impact on the accuracy when removed from the dataset.
The results of model ablation of the TIPNet deep model are presented in
Table 16. For model ablation, we removed the complete layers and some units of specific layers and changed the optimizer from
Adam to
statistic gradient descent (SGD) to check their contribution to the TIPNet deep model’s performance. Replacing the
Adam optimizer with
SGD had the worst impact on the accuracy, at 0.68. The ablation results demonstrate the optimality of the suggested arrangement of layers, units of layers, and optimizer.
The results obtained when the decision threshold is set to 0.5, as shown in
Table 7, demonstrate optimal and well-balanced performance across all evaluation metrics. The proposed TIPNet model achieved the highest accuracy of 0.88, F1-score of 0.89, recall of 0.89, precision of 0.89, and an impressive AUC of 0.90, clearly outperforming all baseline models. This suggests that the threshold value of 0.5 effectively balances the trade-off between precision and recall, allowing the model to identify diabetic instances without over-committing to false positives or missing true cases. Moreover, even though the execution time for TIPNet is relatively high, 735 s, the significant improvement in predictive performance justifies the computational cost. The LSTM and InceptionNet models also performed competitively, with accuracies of 0.85 each, but their F1-scores of 0.84 and 0.86, respectively, and precision–recall trade-offs were slightly lower compared to TIPNet, highlighting the strength of the stacking strategy used in TIPNet.
In contrast, when the threshold is reduced to 0.3, as shown in
Table 17, the recall of all models significantly increases, particularly for TIPNet, which achieves a recall of 0.91. However, this comes at the expense of precision, which drops to 0.75 for TIPNet. This trade-off is expected because a lower threshold tends to classify more samples as positive, increasing the number of TPs but also introducing more FPs. While recall is beneficial in medical applications to avoid missing positive cases (i.e., undiagnosed diabetes), the drop in precision leads to many incorrect classifications, which may cause unnecessary alarms or follow-up procedures. Additionally, the overall F1-score remains stable with 0.82 for TIPNet, but the balance is tilted more toward sensitivity than specificity, potentially reducing the model’s practical effectiveness in scenarios requiring high confidence in positive predictions.
On the other hand, when the threshold is increased to 0.7, the precision of all models improves drastically, with TIPNet achieving a precision of 0.98. This indicates that most of the predictions classified as diabetic are indeed correct. However, this high precision is achieved at the cost of recall, which drops to 0.69 for TIPNet. Such a steep decline in recall reflects the model’s increased conservativeness, meaning it misses a substantial number of actual diabetic cases. The F1-score also slightly drops to 0.81, and although the accuracy remains high at 0.84, the model’s utility in early detection is compromised. In high-stakes domains like healthcare, missing TPs can be more detrimental than including some FPs, making high recall more desirable. Therefore, while a high threshold yields high-confidence predictions, it may fail to identify many true diabetic cases, limiting its use in broad screening contexts. In summary, setting the threshold to 0.5 provides the most balanced and reliable results, with high precision and recall, leading to the highest F1-score and AUC for the TIPNet model. Thresholds of 0.3 and 0.7 skew this balance, favoring recall and precision, respectively, but at the cost of the other metric, resulting in suboptimal overall performance. Thus, 0.5 stands out as the ideal threshold for robust and trustworthy diabetes prediction using the proposed TIPNet framework.

