
Inequities in Stroke Recovery: Examining Sociodemographic Predictors of Rehabilitation Success

 ,
,  , , , , , , and
Abstract
1. Introduction
2. Materials and Methods
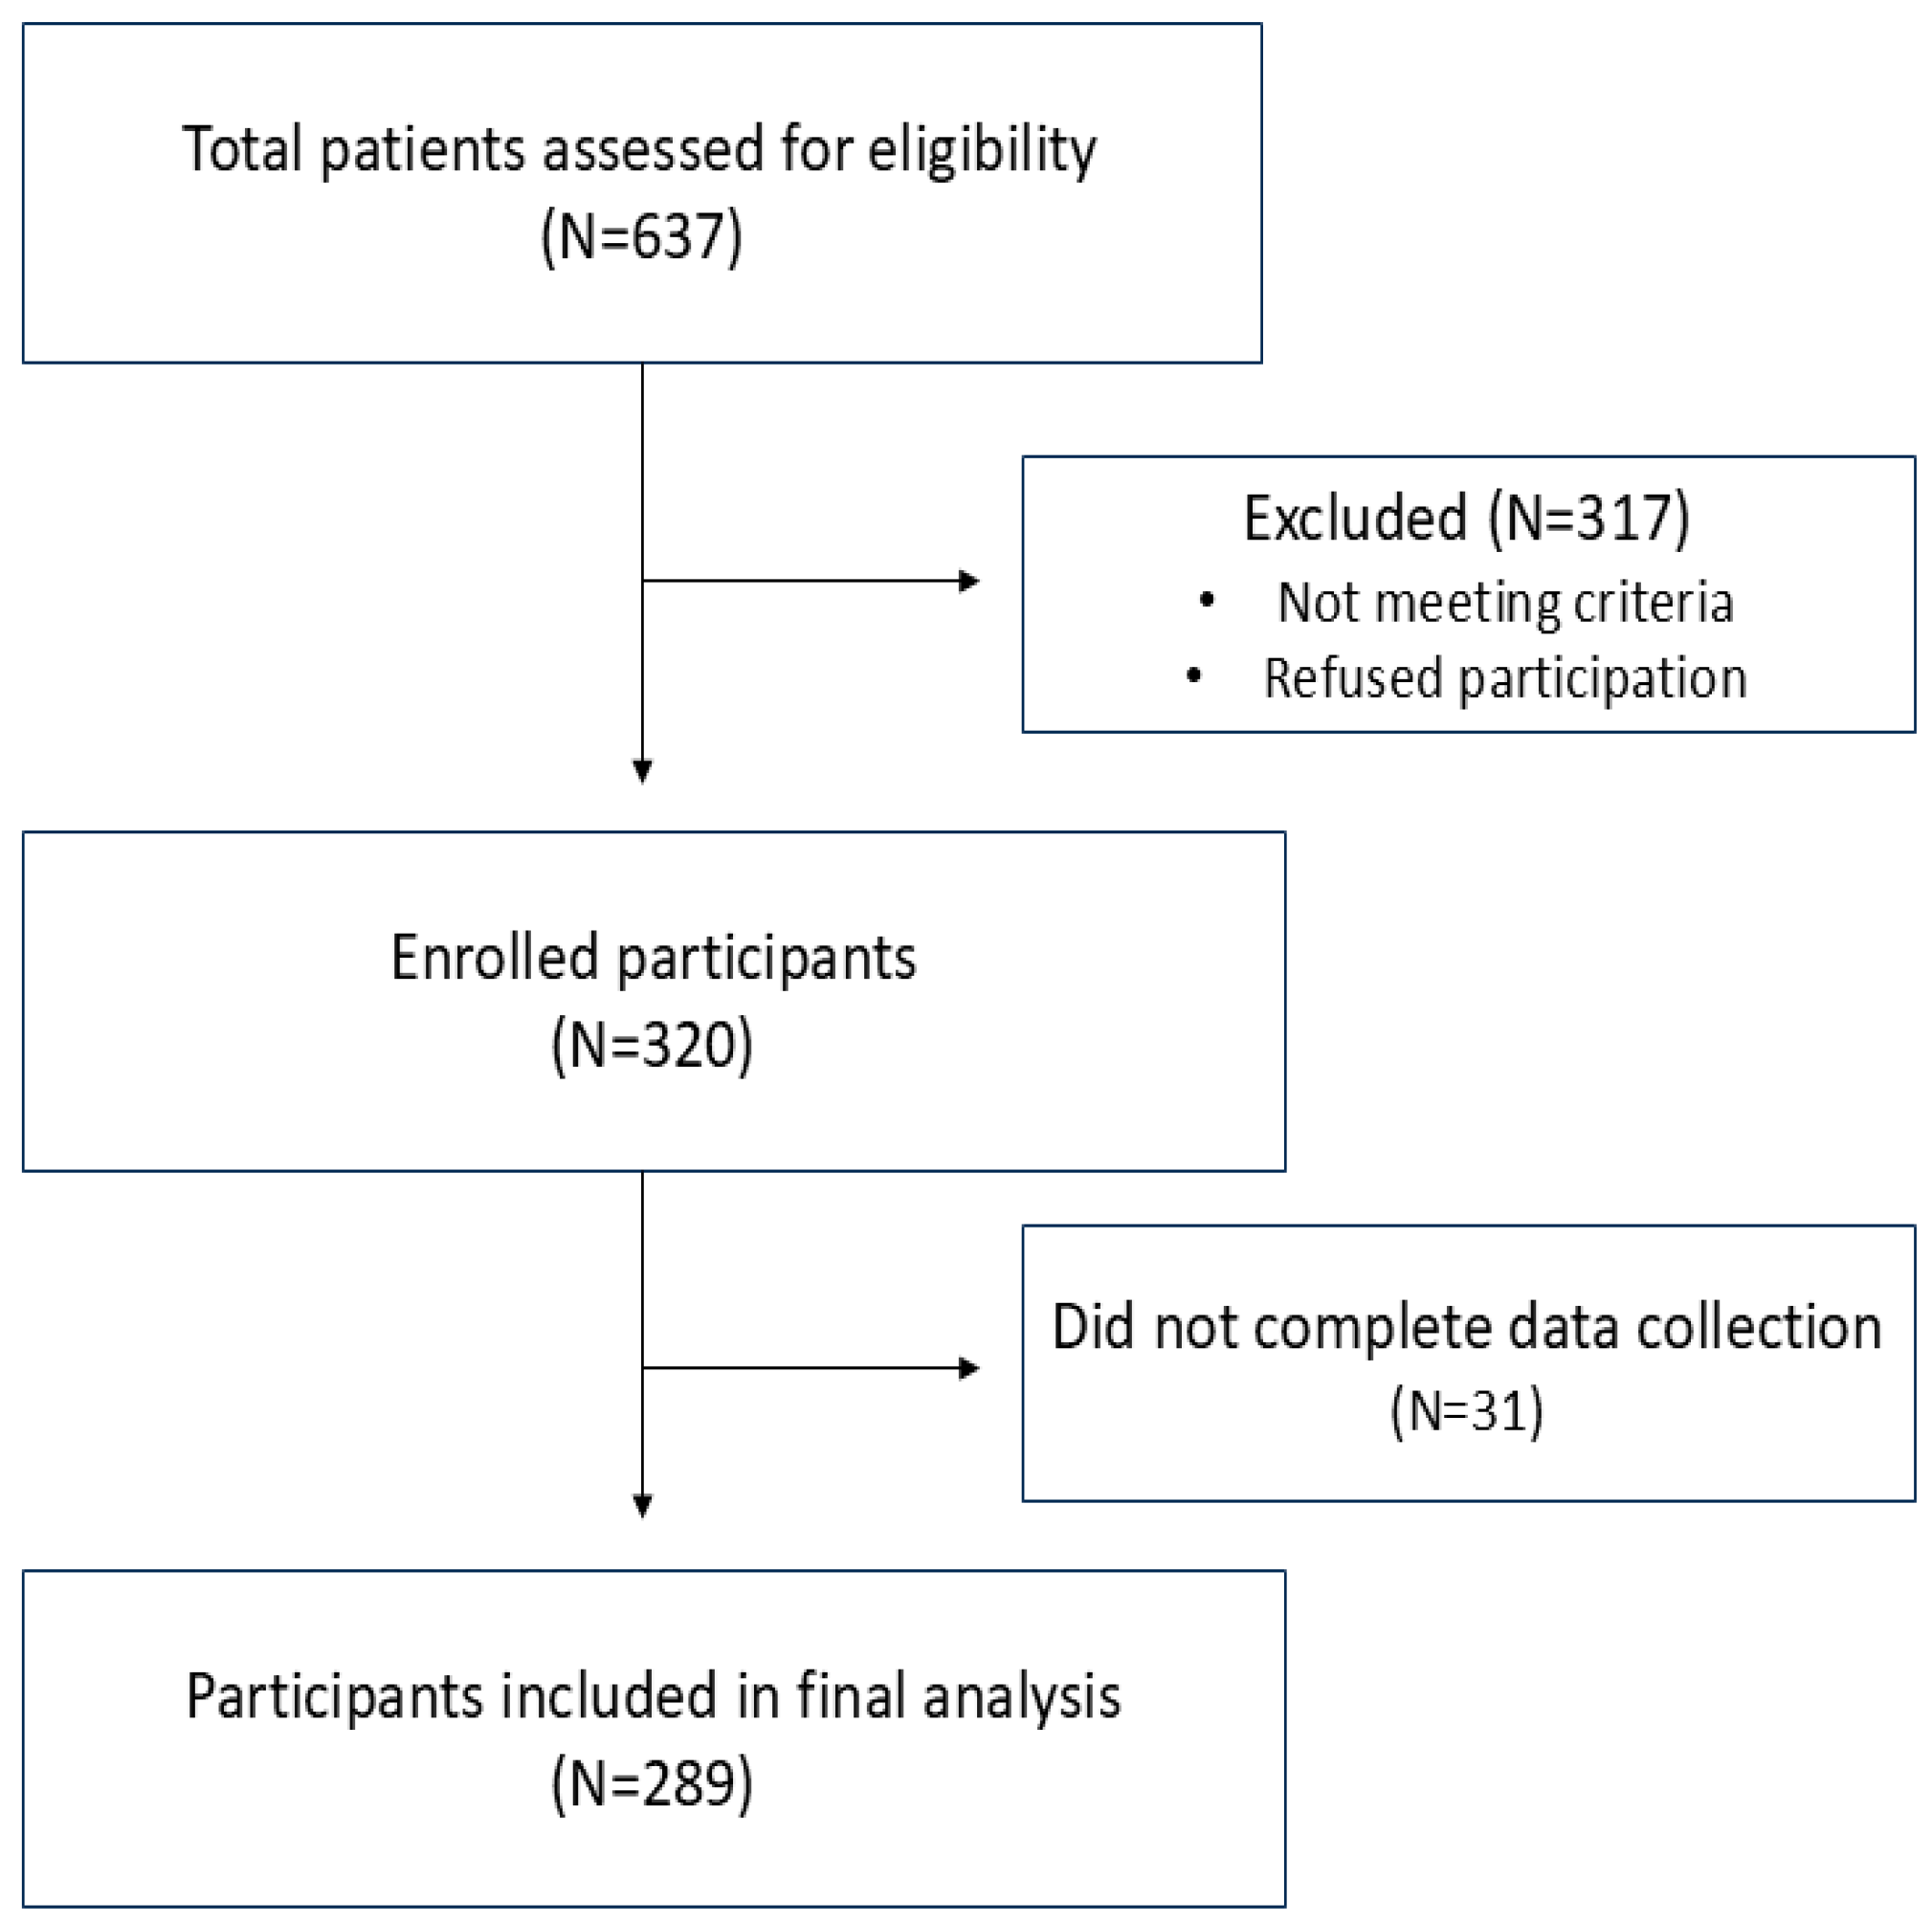
2.1. Study Design and Setting
2.2. Data Collection
2.3. Data Analyses
3. Results
3.1. General Characteristics of Participants
3.2. Influence of Socioeconomic Factors on Functional Recovery
3.2.1. Gait Speed (Speed)
3.2.2. Barthel Index
3.2.3. Berg Balance Scale
3.2.4. ARAT Scale
3.2.5. Ashworth Scale (Muscle Tone)
3.3. Correlation Between NIHSS Score and Functional Outcomes by SD Variable
4. Discussion
5. Conclusions
Supplementary Materials
Author Contributions
Funding
Institutional Review Board Statement
Informed Consent Statement
Data Availability Statement
Conflicts of Interest
Abbreviations
| SDS | Sociodemographic status |
| NIHSS | National Institutes of Health Stroke Scale |
| BI | Barthel Index |
| BBS | Berg Balance Scale |
| ARAT | Action Research Arm Test |
References
- Feigin, V.L.; Brainin, M.; Norrving, B.; Martins, S.; Sacco, R.L.; Hacke, W.; Fisher, M.; Pandian, J.; Lindsay, P. World Stroke Organization (WSO): Global Stroke Fact Sheet 2022. Int. J. Stroke 2022, 17, 18–29. [Google Scholar] [CrossRef] [PubMed]
- Langhorne, P.; Bernhardt, J.; Kwakkel, G. Stroke rehabilitation. Lancet 2011, 377, 1693–1702. [Google Scholar] [CrossRef] [PubMed]
- Kwakkel, G.; Lannin, N.A.; Borschmann, K.; English, C.; Ali, M.; Churilov, L.; Saposnik, G.; Winstein, C.; van Wegen, E.E.; Wolf, S.L.; et al. Standardized measurement of sensorimotor recovery in stroke trials: Consensus-based core recommendations from the Stroke Recovery and Rehabilitation Roundtable. Int. J. Stroke 2017, 12, 451–461. [Google Scholar] [CrossRef] [PubMed]
- Sun, Y.A.; Kalpakavadi, S.; Prior, S.; Thrift, A.G.; Waddingham, S.; Phan, H.; Gall, S.L. Socioeconomic status and health-related quality of life after stroke: A systematic review and meta-analysis. Health Qual. Life Outcomes 2023, 21, 115. [Google Scholar] [CrossRef] [PubMed]
- Addo, J.; Ayerbe, L.; Mohan, K.M.; Crichton, S.; Sheldenkar, A.; Chen, R.; Wolfe, C.D.; McKevitt, C. Socioec-onomic status and stroke: An updated review. Stroke 2012, 43, 1186–1191. [Google Scholar] [CrossRef] [PubMed]
- Marshall, I.J.; Wang, Y.; Crichton, S.; McKevitt, C.; Rudd, A.G.; Wolfe, C.D. The effects of socioeconomic status on stroke risk and outcomes. Lancet Neurol. 2015, 14, 1206–1218. [Google Scholar] [CrossRef] [PubMed]
- Cox, A.M.; McKevitt, C.; Rudd, A.G.; Wolfe, C.D. Socioeconomic status and stroke. Lancet Neurol. 2006, 5, 181–188. [Google Scholar] [CrossRef] [PubMed]
- Nguyen, M.T.H.; Sakamoto, Y.; Maeda, T.; Woodward, M.; Anderson, C.S.; Catiwa, J.; Yazidjoglou, A.; Carcel, C.; Yang, M.; Wang, X. Influence of socioeconomic status on functional outcomes after stroke: A systematic review and meta-analysis. J. Am. Heart Assoc. 2024, 13, e033078. [Google Scholar] [CrossRef] [PubMed]
- de Andrade, J.B.C.; Mohr, J.P.; Timbó, F.B.; Nepomuceno, C.R.; da Silva Moreira, J.V.; da Costa Goes Timbó, I.; Lima, F.O.; Silva, G.S.; Bamford, J. Oxfordshire Community Stroke Project Classification: A proposed automated algorithm. Eur. Stroke J. 2021, 6, 160–167. [Google Scholar] [CrossRef] [PubMed]
- Spilker, J.; Kongable, G.; Barch, C.; Braimah, J.; Brattina, P.; Daley, S.; Donnarumma, R.; Rapp, K.; Sailor, S. Using the NIH Stroke Scale to assess stroke patients. J. Neurosci. Nurs. 1997, 29, 384–392. [Google Scholar] [CrossRef] [PubMed]
- Middleton, A.; Fritz, S.L.; Lusardi, M. Walking speed: The functional vital sign. J. Aging Phys. Act. 2015, 23, 314–322. [Google Scholar] [CrossRef] [PubMed]
- Yang, H.; Chen, Y.; Wang, J.; Wei, H.; Chen, Y.; Jin, J. Activities of daily living measurement after ischemic stroke: Rasch analysis of the modified Barthel Index. Medicine 2021, 100, e24926. [Google Scholar] [CrossRef] [PubMed]
- Miyata, K.; Tamura, S.; Kobayashi, S.; Takeda, R.; Iwamoto, H. Berg Balance Scale is a Valid Measure for Plan Interventions and for Assessing Changes in Postural Balance in Patients with Stroke. J. Rehabil. Med. 2022, 54, jrm00359. [Google Scholar] [CrossRef] [PubMed]
- Hsieh, C.L.; Hsueh, I.P.; Chiang, F.M.; Lin, P.H. Inter-rater reliability and validity of the action research arm test in stroke patients. Age Ageing 1998, 27, 107–113. [Google Scholar] [CrossRef] [PubMed]
- Gregson, J.M.; Leathley, M.; Moore, A.P.; Sharma, A.K.; Smith, T.L.; Watkins, C.L. Reliability of the Tone Assessment Scale and the modified Ashworth scale as clinical tools for assessing poststroke spasticity. Arch. Phys. Med. Rehabil. 1999, 80, 1013–1016. [Google Scholar] [CrossRef] [PubMed]
- Marzola, P.; Melzer, T.; Pavesi, E.; Gil-Mohapel, J.; Brocardo, P.S. Exploring the Role of Neuroplasticity in Development, Aging, and Neurodegeneration. Brain Sci. 2023, 13, 1610. [Google Scholar] [CrossRef] [PubMed]
- Teasell, R.; Foley, N.; Salter, K.; Bhogal, S.; Jutai, J.; Speechley, M. Evidence-Based Review of Stroke Rehabil-itation: Executive summary, 12th edition. Top. Stroke Rehabil. 2009, 16, 463–488. [Google Scholar] [CrossRef] [PubMed]
- Mellon, L.; Brewer, L.; Hall, P.; Horgan, F.; Williams, D.; Hickey, A.; ASPIRE-S study group. Cognitive im-pairment six months after ischaemic stroke: A profile from the ASPIRE-S study. BMC Neurol. 2015, 15, 31. [Google Scholar] [CrossRef] [PubMed]
- van de Port, I.G.; Kwakkel, G.; van Wijk, I.; Lindeman, E. Susceptibility to deterioration of mobility long-term after stroke: A prospective cohort study. Stroke 2006, 37, 167–171. [Google Scholar] [CrossRef] [PubMed]
- Westerlind, E.; Persson, H.C.; Sunnerhagen, K.S. Return to work after a stroke in working age persons; A six-year follow up. PLoS ONE 2017, 12, e0169759. [Google Scholar] [CrossRef] [PubMed]
- Westerlind, E.; Persson, H.C.; Eriksson, M.; Norrving, B.; Sunnerhagen, K.S. Return to work after stroke: A Swedish nationwide registry-based study. Acta Neurol. Scand. 2020, 141, 56–64. [Google Scholar] [CrossRef] [PubMed]
- Gurková, E.; Bartoníčková, D.; Šaňák, D.; Šaňáková, Š.; Zapletalová, J.; Štureková, L. Relationship between social support, functional outcomes and health-related quality of life in working-aged adults at three months after ischemic stroke: Results from the FRAILTY study. Health Qual. Life Outcomes 2025, 23, 8. [Google Scholar] [CrossRef] [PubMed]
- Zhou, H.; Kulick, E.R. Social Support and Depression among Stroke Patients: A Topical Review. Int. J. Environ. Res. Public Health 2023, 20, 7157. [Google Scholar] [CrossRef] [PubMed]
- Cramer, S.C.; Wolf, S.L.; Adams, H.P., Jr.; Chen, D.; Dromerick, A.W.; Dunning, K.; Ellerbe, C.; Grande, A.; Janis, S.; Lansberg, M.G.; et al. Stroke Recovery and Rehabilitation Research: Issues, Opportunities, and the Na-tional Institutes of Health StrokeNet. Stroke 2017, 48, 813–819. [Google Scholar] [CrossRef] [PubMed]
- Gall, S.L.; Donnan, G.; Dewey, H.M.; Macdonell, R.; Sturm, J.; Gilligan, A.; Srikanth, V.; Thrift, A.G. Sex dif-ferences in presentation, severity, and management of stroke in a population-based study. Neurology 2010, 74, 975–981. [Google Scholar] [CrossRef] [PubMed]
- Appelros, P.; Stegmayr, B.; Terént, A. Sex differences in stroke epidemiology: A systematic review. Stroke 2009, 40, 1082–1090. [Google Scholar] [CrossRef] [PubMed]
- Reeves, M.J.; Bushnell, C.D.; Howard, G.; Gargano, J.W.; Duncan, P.W.; Lynch, G.; Khatiwoda, A.; Lisabeth, L. Sex differences in stroke: Epidemiology, clinical presentation, medical care, and outcomes. Lancet Neurol. 2008, 7, 915–926. [Google Scholar] [CrossRef] [PubMed]
- Carcel, C.; Woodward, M.; Wang, X.; Bushnell, C.; Sandset, E.C. Sex matters in stroke: A review of recent evidence on the differences between women and men. Front. Neuroendocrinol. 2020, 59, 100870. [Google Scholar] [CrossRef] [PubMed]
- Phan, H.T.; Blizzard, C.L.; Reeves, M.J.; Thrift, A.G.; Cadilhac, D.A.; Sturm, J.; Heeley, E.; Otahal, P.; Roth-well, P.; Anderson, C.S.; et al. Sex differences in long-term quality of life among survivors after stroke in the INSTRUCT. Stroke 2019, 50, 2299–2306. [Google Scholar] [CrossRef] [PubMed]
- Butsing, N.; Zauszniewski, J.A.; Ruksakulpiwat, S.; Griffin, M.T.Q.; Niyomyart, A. Association between post-stroke depression and functional outcomes: A systematic review. PLoS ONE 2024, 19, e0309158. [Google Scholar] [CrossRef] [PubMed]
- Kitzmüller, G.; Asplund, K.; Häggström, T. The long-term experience of family life after stroke. J. Neurosci. Nurs. 2012, 44, E1–E13. [Google Scholar] [CrossRef] [PubMed]
- Winstein, C.J.; Stein, J.; Arena, R.; Bates, B.; Cherney, L.R.; Cramer, S.C.; Deruyter, F.; Eng, J.J.; Fisher, B.; Harvey, R.L.; et al. Guidelines for Adult Stroke Rehabilitation and Recovery: A Guideline for Healthcare Professionals from the American Heart Association/American Stroke Association. Stroke 2016, 47, e98–e169. [Google Scholar] [CrossRef] [PubMed]
- Che, B.; Shen, S.; Zhu, Z.; Wang, A.; Xu, T.; Peng, Y.; Li, Q.; Ju, Z.; Geng, D.; Chen, J.; et al. Education Level and Long-term Mortality, Recurrent Stroke, and Cardiovascular Events in Patients with Ischemic Stroke. J. Am. Heart Assoc. 2020, 9, e016671. [Google Scholar] [CrossRef] [PubMed]
- Norlander, A.; Iwarsson, S.; Jönsson, A.C.; Lindgren, A.; Månsson Lexell, E. Participation in social and lei-sure activities while re-constructing the self: Understanding strategies used by stroke survivors from a long-term perspective. Disabil. Rehabil. 2021, 44, 4284–4292. [Google Scholar] [CrossRef] [PubMed]
- Langhammer, B.; Lindmark, B.; Stanghelle, J.K. Physiotherapy and physical functioning post-stroke: Exercise habits and functioning 4 years later? Long-term follow-up after a 1-year long-term intervention period: A randomized controlled trial. Brain Inj. 2014, 28, 1396–1405. [Google Scholar] [CrossRef] [PubMed]
- Perera, S.; Mody, S.H.; Woodman, R.C.; Studenski, S.A. Meaningful change and responsiveness in common physical performance measures in older adults. J. Am. Geriatr. Soc. 2006, 54, 743–749. [Google Scholar] [CrossRef] [PubMed]
- Tilson, J.K.; Sullivan, K.J.; Cen, S.Y.; Rose, D.K.; Koradia, C.H.; Azen, S.P.; Duncan, P.W.; Locomotor Experience Applied Post Stroke (LEAPS) Investigative Team. Meaningful gait speed improvement during the first 60 days poststroke: Minimal clinically important difference. Phys. Ther. 2010, 90, 196–208. [Google Scholar] [CrossRef] [PubMed]
- Bjegovic-Mikanovic, V.; Vasic, M.; Vukovic, D.; Jankovic, J.; Jovic-Vranes, A.; Santric-Milicevic, M.; Terzic-Supic, Z.; Hernandez-Quevedo, C. Serbia: Health System Review. Health Syst. Transit. 2019, 21, 1–211. [Google Scholar] [PubMed]

| Variable | Categories | N (%) | Subcategories | N (%) | |
|---|---|---|---|---|---|
| Age | Below 55 y | 52 (18%) | |||
| 55–65 y | 88 (30%) | ||||
| 65–75 y | 98 (34%) | ||||
| Above 75 y | 51 (18%) | ||||
| Sex | Female | 122 (42%) | |||
| Male | 167 (58%) | ||||
| Marital Status | Married | 180 (62%) | Married | 180 (62%) | |
| Single | 109 (38%) | Unmarried | 56 (20%) | ||
| Widow | 40 (14%) | ||||
| Divorced | 13 (4%) | ||||
| Education | Elementary | 174 (60%) | Without elementary e. | 23 (8%) | |
| Elementary e. | 151 (52%) | ||||
| High | 115 (40%) | High school | 55 (19%) | ||
| College | 49 (17%) | ||||
| Faculty | 11 (4%) | ||||
| Working Status | Employed | 115 (40%) | Employed | 83 (29%) | |
| Unemployed | 32 (11%) | ||||
| Pensioner | 174 (60%) | Pensioner | 174 (60%) | ||
| Variable | Categories | n (%) |
|---|---|---|
| Lateralization | Right | 157 (54%) |
| Left | 121 (42%) | |
| Both side | 11 (4%) | |
| Localization | Cortical | 69 (24%) |
| Subcortical | 131 (45%) | |
| Bilateral | 52 (18%) | |
| Lacunae | 13 (5%) | |
| Cerebellum | 24 (8%) | |
| Stroke type | Ischemic | 254 (88%) |
| Hemorrhagic | 35 (12%) |
| Outcome | Time | η1 ± sd1 | η2 ± sd2 | Test Statistics * | p Value * | F Value # | p Value # |
|---|---|---|---|---|---|---|---|
| Speed | Pre 1–Retest 2 | 0.39 ± 0.36 | 0.55 ± 0.38 | −13.6 | <0.0001 | F (333.5, 1.3) = 245.7 | <0.0001 |
| Pre 1–Post 2 | 0.39 ± 0.36 | 0.71 ± 0.44 | −14.2 | <0.0001 | |||
| Retest 1–Post 2 | 0.55 ± 0.38 | 0.71 ± 0.44 | −16.9 | <0.0001 | |||
| BI | Pre 1–Retest 2 | 58.4 ± 31.4 | 70.1 ± 27 | −15.6 | <0.0001 | F (367.6, 1.3) = 290.5 | <0.0001 |
| Pre 1–Post 2 | 58.4 ± 31.4 | 80.2 ± 24 | −18.2 | <0.0001 | |||
| Retest 1–Post 2 | 70.1 ± 27 | 80.2 ± 24 | −14.9 | <0.0001 | |||
| BBS | Pre 1–Retest 2 | 29.3 ± 17.4 | 37.1 ± 15.6 | −15.5 | <0.0001 | F (339.5, 1.3) = 300.3 | <0.0001 |
| Pre 1–Post 2 | 29.3 ± 17.4 | 42.8 ± 14.7 | −18.2 | <0.0001 | |||
| Retest 1–Post 2 | 37.1 ± 15.6 | 42.8 ± 14.7 | −15.9 | <0.0001 | |||
| ARAT | Pre 1–Retest 2 | 36.5 ± 23.7 | 40.6 ± 22.2 | −7.65 | <0.0001 | F (323.5, 1.3) = 323.5 | <0.0001 |
| Pre 1–Post 2 | 36.5 ± 23.7 | 43.1 ± 21.7 | −8.7 | <0.0001 | |||
| Retest 1–Post 2 | 40.6 ± 22.2 | 43.1 ± 21.7 | −6.95 | <0.0001 |
| SDF | Categories | Time | Multicomparison | Interaction | ||||
|---|---|---|---|---|---|---|---|---|
| Pre * | Retest * | Post * | Pre-Retest # | Pre-Post # | Retest—Post # | SDvar: Time | ||
| Age | Below 55 y | 0.42 ± 0.38 | 0.65 ± 0.38 | 0.87 ± 0.45 | <0.0001 | <0.0001 | <0.0001 | F (364.4, 3.8) = 2.8 p = 0.02 |
| 55–65 y | 0.45 ± 0.4 | 0.58 ± 0.42 | 0.74 ± 0.46 | <0.0001 | <0.0001 | <0.0001 | ||
| 65–75 y | 0.38 ± 0.33 | 0.52 ± 0.36 | 0.66 ± 0.42 | <0.0001 | <0.0001 | <0.0001 | ||
| Above 75 y | 0.29 ± 0.32 | 0.46 ± 0.32 | 0.61 ± 0.4 | <0.0001 | <0.0001 | <0.0001 | ||
| Comparison # | 0.152 | 0.09 | 0.01 | |||||
| Sex | Female | 0.33 ± 0.33 | 0.47 ± 0.35 | 0.6 ± 0.41 | <0.0001 | <0.0001 | <0.0001 | F (334, 1.3) = 4.8 p = 0.02 |
| Male | 0.44 ± 0.37 | 0.61 ± 0.38 | 0.8 ± 0.44 | <0.0001 | <0.0001 | <0.0001 | ||
| Comparison # | 0.02 | 0.003 | 0.004 | |||||
| Marital status | Married | 0.44 ± 0.39 | 0.62 ± 0.4 | 0.8 ± 0.43 | <0.0001 | <0.0001 | <0.0001 | F (334, 1.3) = 5.4 p = 0.01 |
| Single | 0.32 ± 0.3 | 0.45 ± 0.33 | 0.52 ± 0.42 | <0.0001 | <0.0001 | <0.0001 | ||
| Comparison # | 0.008 | 0.0006 | 0.00008 | |||||
| Education | Elementary | 0.4 ± 0.37 | 0.55 ± 0.38 | 0.71 ± 0.43 | <0.0001 | <0.0001 | <0.0001 | F (332, 1.3) = 0.13 p = 0.78 |
| High | 0.38 ± 0.34 | 0.55 ± 0.38 | 0.72 ± 0.45 | <0.0001 | <0.0001 | <0.0001 | ||
| Comparison # | 0.78 | 0.99 | 0.99 | |||||
| Working status | Pensioner | 0.36 ± 0.33 | 0.51 ± 0.34 | 0.66 ± 0.4 | <0.0001 | <0.0001 | <0.0001 | F (333.7, 1.3) = 3.6; p = 0.04 |
| Employment relationship | 0.44 ± 0.4 | 0.62 ± 0.43 | 0.81 ± 0.47 | <0.0001 | <0.0001 | <0.0001 | ||
| Comparison # | 0.122 | 0.03 | 0.007 | |||||
| Coefficients | Estimate | Std. Error | Z Value | p Value |
|---|---|---|---|---|
| Age | −0.02 | 0.01 | −1.16 | 0.25 |
| Sex | −0.64 | 0.27 | −2.39 | 0.01 |
| Marital | 0.48 | 0.27 | 1.94 | 0.04 |
| Education | −0.26 | 0.26 | −0.97 | 0.33 |
| Working | −0.05 | 0.35 | −0.13 | 0.89 |
| NIHSS | −0.25 | 0.14 | −1.93 | 0.04 |
| Intercept | 0.95 | 0.79 | 1.19 | 0.23 |
| SDF | Categories | Time | Multicomparison | Interaction | ||||
|---|---|---|---|---|---|---|---|---|
| Pre * | Retest * | Post * | Pre-Retest # | Pre-Post # | Retest—Post # | SDvar: Time | ||
| Age | Below 55 y | 62.6 ± 27.8 | 73.8 ± 20.8 | 86.5 ± 16.2 | <0.0001 | <0.0001 | <0.0001 | F (364.4, 3.8) = 2.8 p = 0.02 |
| 55–65 y | 65.6 ± 29.8 | 76.7 ± 23.3 | 84 ± 19.4 | <0.0001 | <0.0001 | <0.0001 | ||
| 65–75 y | 58.3 ± 31.3 | 68.9 ± 28.7 | 78.6 ± 26.8 | <0.0001 | <0.0001 | <0.0001 | ||
| Above 75 y | 41.8 ± 32.8 | 57.2 ± 31 | 70.1 ± 28.9 | <0.0001 | <0.0001 | <0.0001 | ||
| Comparison # | 0.0001 | 0.0003 | 0.001 | |||||
| Sex | Female | 56 ± 33.4 | 66.7 ± 29.3 | 76.7 ± 26.4 | <0.0001 | <0.0001 | <0.0001 | F (365, 1.3) = 0.64 p = 0.46 |
| Male | 60.1 ± 29.9 | 72.6 ± 25 | 82.7 ± 22.1 | <0.0001 | <0.0001 | <0.0001 | ||
| Comparison # | 0.274 | 0.06 | 0.03 | |||||
| Marital status | Married | 60.8 ± 31.3 | 72.7 ± 26.9 | 82.2 ± 23.7 | <0.0001 | <0.0001 | <0.0001 | F (366, 1.3) = 0.31 p = 0.63 |
| Single | 54.4 ± 31.4 | 65.8 ± 26.8 | 76.7 ± 24.2 | <0.0001 | <0.0001 | <0.0001 | ||
| Comparison # | 0.09 | 0.03 | 0.06 | |||||
| Education | Elementary | 56.8 ± 33.6 | 68.7 ± 29.1 | 78.8 ± 25.7 | <0.0001 | <0.0001 | <0.0001 | F (366, 1.3) = 0.02 p = 0.92 |
| High | 60.7 ± 27.9 | 72.2 ± 23.5 | 82.3 ± 21.1 | <0.0001 | <0.0001 | <0.0001 | ||
| Comparison # | 0.314 | 0.115 | 0.226 | |||||
| Working status | Pensioner | 55.3 ± 32.2 | 67.3 ± 29 | 77.3 ± 26.4 | <0.0001 | <0.0001 | <0.0001 | F (366, 1.3) = 0.09 p = 0.82 |
| Employed | 63 ± 29.8 | 74.3 ± 23.2 | 84.4 ± 19.3 | <0.0001 | <0.0001 | <0.0001 | ||
| Comparison # | 0.059 | 0.03 | 0.014 | |||||
| SDF | Categories | Time | Multicomparison | Interaction | ||||
|---|---|---|---|---|---|---|---|---|
| Pre * | Retest * | Post * | Pre-Retest # | Pre-Post # | Retest—Post # | SDvar: Time | ||
| Age | Below 55 y | 37.6 ± 15.1 | 45.2 ± 10.6 | 50.7 ± 17 | <0.0001 | <0.0001 | <0.0001 | F (336, 3.8) = 0.5 p = 0.73 |
| 55–65 y | 31.5 ± 17 | 39.3 ± 14 | 45.7 ± 11.7 | <0.0001 | <0.0001 | <0.0001 | ||
| 65–75y | 28.3 ± 17.1 | 35.4 ± 16.1 | 41 ± 16.2 | <0.0001 | <0.0001 | <0.0001 | ||
| Above 75 y | 20.2 ± 16.4 | 29.3 ± 17 | 34.3 ± 16.6 | <0.0001 | <0.0001 | <0.0001 | ||
| Comparison # | <0.0001 | <0.0001 | <0.0001 | |||||
| Sex | Female | 25.4 ± 17.8 | 33.1 ± 16.9 | 38.6 ± 16.3 | <0.0001 | <0.0001 | <0.0001 | F (339, 1.3) = 0.08 p = 0.83 |
| Male | 32.3 ± 16.5 | 40.2 ± 13.7 | 46 ± 12.5 | <0.0001 | <0.0001 | <0.0001 | ||
| Comparison # | 0.001 | 0.0002 | 0.00003 | |||||
| Marital status | Married | 30.3 ± 17.9 | 38.6 ± 15.6 | 44.5 ± 14.3 | <0.0001 | <0.0001 | <0.0001 | F (339, 1.3) = 1.6 p = 0.22 |
| Single | 27.7 ± 16.5 | 34.7 ± 15.3 | 40 ± 15 | <0.0001 | <0.0001 | <0.0001 | ||
| Comparison # | 0.23 | 0.047 | 0.013 | |||||
| Education | Elementary | 27.8 ± 18.2 | 35.6 ± 16.8 | 41.6 ± 15.9 | <0.0001 | <0.0001 | <0.0001 | F (338, 1.3) = 0.32 p = 0.62 |
| High | 31.6 ± 16 | 39.3 ± 13.3 | 44.6 ± 12.4 | <0.0001 | <0.0001 | <0.0001 | ||
| Comparison # | 0.08 | 0.06 | 0.09 | |||||
| Working status | Pensioner | 26.4 ± 17.2 | 34.5 ± 15.9 | 40.3 ± 15.7 | <0.0001 | <0.0001 | <0.0001 | F (338, 1.3) = 0.5; p = 0.04 |
| Employed | 34 ± 16.8 | 41.2 ± 14.2 | 46.9 ± 11.9 | <0.0001 | <0.0001 | <0.0001 | ||
| Comparison # | 0.0004 | 0.0006 | 0.0002 | |||||
| SDF | Categories | Time | Multicomparison | Interaction | ||||
|---|---|---|---|---|---|---|---|---|
| Pre * | Retest * | Post * | Pre-Retest # | Pre-Post # | Retest—Post # | SDvar: Time | ||
| Age | Below 55 y | 36.9 ± 22.5 | 42 ± 20 | 46 ± 19.3 | <0.0001 | <0.0001 | <0.0001 | F (321, 3.7) = 1.9 p = 0.11 |
| 55–65 y | 34 ± 25.1 | 39.4 ± 23.6 | 42.4 ± 23.4 | <0.0001 | <0.0001 | <0.0001 | ||
| 65–75 y | 36.2 ± 23.4 | 39.2 ± 23.7 | 40.7 ± 23.3 | <0.0001 | <0.0001 | <0.0001 | ||
| Above 75 y | 40.6 ± 21.6 | 44.1 ± 19.3 | 46.3 ± 17.8 | <0.0001 | <0.0001 | <0.0001 | ||
| Comparison # | 0.49 | 0.56 | 0.38 | |||||
| Sex | Female | 36.5 ± 24.6 | 40.5 ± 22.8 | 42.5 ± 22.5 | <0.0001 | <0.0001 | <0.0001 | F (339, 1.3) = 0.08 p = 0.83 |
| Male | 36.5 ± 23 | 40.7 ± 21.7 | 43.6 ± 21.1 | <0.0001 | <0.0001 | <0.0001 | ||
| Comparison # | 0.99 | 0.95 | 0.68 | |||||
| Marital status | Married | 35.4 ± 24 | 40.3 ± 22.1 | 43.1 ± 21.8 | <0.0001 | <0.0001 | <0.0001 | F (323, 1.2) = 3.2 p = 0.06 |
| Single | 35.6 ± 23 | 41.3 ± 22.3 | 43.2 ± 21.7 | <0.0001 | <0.0001 | <0.0001 | ||
| Comparison # | 0.31 | 0.72 | 0.96 | |||||
| Education | Elementary | 36.4 ± 23.7 | 40.1 ± 22.6 | 42.3 ± 22 | <0.0001 | <0.0001 | <0.0001 | F (322, 1.2) = 1.56 p = 0.21 |
| High | 36.6 ± 23.7 | 41.5 ± 21.5 | 44.7 ± 21.2 | <0.0001 | <0.0001 | <0.0001 | ||
| Comparison # | 0.95 | 0.64 | 0.41 | |||||
| Working status | Pensioner | 37.5 ± 23.4 | 41 ± 22.2 | 42.8 ± 21.8 | <0.0001 | <0.0001 | <0.0001 | F (323, 1.2) = 4.6; p = 0.02 |
| Employed | 34.7 ± 24.1 | 39.9 ± 22.2 | 43.7 ± 21.7 | <0.0001 | <0.0001 | <0.0001 | ||
| Comparison # | 0.36 | 0.7 | 0.76 | |||||
| Ashworth Arm | Time | ||||
|---|---|---|---|---|---|
| Categories ** | Pre | Retest | Post | p Value * | χ2 |
| 4 | 1 (1%) | 1 (1%) | 1 (1%) | <0.0001 | 35.9 |
| 3 | 5 (2%) | 3 (1%) | 1 (1%) | ||
| 2 | 14 (5%) | 11 (4%) | 11 (4%) | ||
| 1+ | 21 (8%) | 20 (8%) | 17 (6%) | ||
| 1 | 77 (29%) | 83 (32%) | 72 (28%) | ||
| 0 | 144 (55%) | 144 (55%) | 160 (61%) | ||
| 3 | 1 (1%) | 1 (1%) | 2 (1%) | <0.0001 | 19 |
| 2 | 10 (4%) | 5 (2%) | 9 (4%) | ||
| 1+ | 21 (8%) | 18 (7%) | 14 (5%) | ||
| 1 | 92 (34%) | 95 (35%) | 85 (31%) | ||
| 0 | 147 (54%) | 152 (55%) | 161 (59%) | ||
| Coefficients | Estimate | Std. Error | Z Value | p Value |
|---|---|---|---|---|
| Age | 0.03 | 0.02 | 1.53 | 0.13 |
| Sex | −0.71 | 0.43 | −1.66 | 0.09 |
| Marital | −0.76 | 0.39 | −1.97 | 0.04 |
| Education | −1.15 | 0.39 | −0.38 | 0.71 |
| Working | −0.78 | 0.49 | −1.98 | 0.04 |
| Intercept | −2.74 | 1.2 | −2.34 | 0.02 |
Disclaimer/Publisher’s Note: The statements, opinions and data contained in all publications are solely those of the individual author(s) and contributor(s) and not of MDPI and/or the editor(s). MDPI and/or the editor(s) disclaim responsibility for any injury to people or property resulting from any ideas, methods, instructions or products referred to in the content. |
© 2025 by the authors. Licensee MDPI, Basel, Switzerland. This article is an open access article distributed under the terms and conditions of the Creative Commons Attribution (CC BY) license (https://creativecommons.org/licenses/by/4.0/).
Share and Cite
Dedijer Dujović, S.; Djordjević, O.; Vidaković, A.; Mitrović, S.; Grajić, M.; Tomić, T.D.; Rosić, S.; Radić, A.; Konstantinović, L. Inequities in Stroke Recovery: Examining Sociodemographic Predictors of Rehabilitation Success. Healthcare 2025, 13, 1739. https://doi.org/10.3390/healthcare13141739
Dedijer Dujović S, Djordjević O, Vidaković A, Mitrović S, Grajić M, Tomić TD, Rosić S, Radić A, Konstantinović L. Inequities in Stroke Recovery: Examining Sociodemographic Predictors of Rehabilitation Success. Healthcare. 2025; 13(14):1739. https://doi.org/10.3390/healthcare13141739
Chicago/Turabian StyleDedijer Dujović, Suzana, Olivera Djordjević, Aleksandra Vidaković, Sindi Mitrović, Mirko Grajić, Tijana Dimkić Tomić, Stefan Rosić, Ana Radić, and Ljubica Konstantinović. 2025. "Inequities in Stroke Recovery: Examining Sociodemographic Predictors of Rehabilitation Success" Healthcare 13, no. 14: 1739. https://doi.org/10.3390/healthcare13141739
APA StyleDedijer Dujović, S., Djordjević, O., Vidaković, A., Mitrović, S., Grajić, M., Tomić, T. D., Rosić, S., Radić, A., & Konstantinović, L. (2025). Inequities in Stroke Recovery: Examining Sociodemographic Predictors of Rehabilitation Success. Healthcare, 13(14), 1739. https://doi.org/10.3390/healthcare13141739