Article

Does Exercise Performance Differ Among Male Law Enforcement Officers Based on Their Body Mass Index Category?

1
Department of Kinesiology and Sport Management, Texas A&M University, College Station, TX 77843, USA
2
Department of Kinesiology, Texas A&M University-Corpus Christi, Corpus Christi, TX 78412, USA
3
Faculty of Physical Education and Sports, University of Banja Luka, 78000 Banja Luka, RS, Bosnia and Herzegovina
4
Department of Kinesiology, California State University Fullerton, Fullerton, CA, 92831, USA
5
Tactical Research Unit, Bond University, Robina, QLD 4226, Australia
6
School of Kinesiology, Applied Health, and Recreation, Oklahoma State University, Stillwater, OK 74078, USA
7
Tactical Fitness and Nutrition Lab, Oklahoma State University, Stillwater, OK 74078, USA
*
Author to whom correspondence should be addressed.
Healthcare 2025, 13(13), 1584; https://doi.org/10.3390/healthcare13131584
Submission received: 13 May 2025 / Revised: 18 June 2025 / Accepted: 27 June 2025 / Published: 2 July 2025
(This article belongs to the Special Issue Health and Readiness of Tactical Populations)

Abstract

Objectives: To assess differences in exercise performance among law enforcement officers (LEOs) based on body mass index (BMI). Methods: Five hundred and thirty-two male LEOs (n = 532; age 38.9 ± 7.4 yrs; height: 180.1 ± 6.9 cm; body mass: 92.1 ± 15.1 kg) were analyzed. The LEOs were stratified into three BMI groups: “healthy” (18.5–24.9 kg/m2), “overweight” (25.0–29.9 kg/m2), and “obese” (≥30.0 kg/m2). Tests for push-ups, sit-ups, estimated VO2max, vertical jump (VJ), and peak anaerobic power output (PAPw) were conducted. Non-parametric Kruskal–Wallis H and Quade’s rank-based ANCOVA with age as a covariate test were used to evaluate differences in exercise performance between BMI groups. Mann–Whitney U tests with Bonferroni post hoc corrections were used for pairwise comparisons. Effect sizes were calculated as rank eta squared (ηH2) for the Kruskal–Wallis H test results. Results: Differences were noted across BMI groups for the push-ups (p < 0.001, ηH2 = 0.101), sit-ups (p < 0.001, ηH2 = 0.187), VO2max (p < 0.001, ηH2 = 0.145), VJ (p < 0.001, ηH2 = 0.137), and PAPw (p < 0.001, ηH2 = 0.504). The pairwise comparisons revealed differences between each group, with the obese and overweight groups exhibiting a lower VJ, VO2max, and performance in push-ups and sit-ups while having a higher PAPw than the healthy group, even after adjusting for age. Conclusions: These data demonstrate that a higher BMI is associated with poorer exercise performance, except for PAPw, and highlight the importance of maintaining a healthy BMI in LEOs.

1. Introduction

Research among law enforcement officers (LEOs) has consistently reported that body mass tends to increase with years of service [1,2,3]. Studies have also demonstrated that most law enforcement duties are approximately 80–90% sedentary, due to long hours spent sitting in the patrol unit and completing paperwork [4,5], which can further intensify occupational demands relative to one’s physical preparedness and alertness, as intervals of sitting or inactivity typically precede strenuous activities. The sudden change in habitual conditions may increase the risk of injuries, morbidity, and even premature mortality, especially for LEOs in poor physical health [6].
Many law enforcement agencies conduct routine physical and fitness assessments, during which anthropometric measurements, such as weight, height, and body composition parameters, are recorded [1,6,7,8,9,10,11,12,13,14]. Information regarding the individual’s body mass index (BMI), waist-to-hip, and waist-to-height ratio may be calculated from these values [10,15]. Body mass index is a quantitative measure that estimates one’s body mass in relation to one’s height [16,17]. Although there are benefits to using BMI as a general screening tool for one’s health (i.e., quick and cost-effective), the BMI scale has received criticism for its inability to differentiate between fat mass (FM) and skeletal muscle mass (SMM) [10,18,19]. Noting this limitation in tissue differentiation, for tactical personnel, a higher BMI has been shown to unfavorably affect performance in running, push-ups, sit-ups, and vertical jump (VJ) [20]. Dawes et al. [12] demonstrated that LEO trainees in a ‘healthy’ BMI group had significantly higher Defensive Tactics and Arrest Control scores than those in an ‘overweight’ BMI group. Similarly, negative correlations have been found between the BMI category and 1.5 km run performance and maximal oxygen uptake (VO2max) [11,21]. When longer distances were analyzed (e.g., 3 km), BMIs over 30 kg/m2 demonstrated a negative association with running velocity [4]. Furthermore, Dawes et al. [11] found that trunk muscular endurance was negatively correlated with BMI in part-time special weapons and tactics (SWAT) officers. Based on previous studies, a higher BMI, regardless of body composition [20], negatively influences certain physical fitness measures. Hence, the BMI within tactical populations may be an accurate, quick, and non-invasive method to provide an initial health and fitness evaluation.
Law enforcement agencies in the US are currently not held to a national standard of physical fitness. However, The Cooper Institute proposed diverse assessments for this population [22]. While these assessments do not provide a comprehensive scope of a LEO’s ability to perform the occupation, they still offer pertinent information regarding the individual’s risk of injury and ability to perform specific occupational duties. For example, research suggests that poor scores in VJ height and aerobic fitness tests (i.e., 2.4 km run and 20 m multistage fitness test [20MFST]) are strongly correlated to musculoskeletal injury risk [23,24]. For instance, Orr and colleagues [23] assessed the relationship between leg power (measured via VJ height) and rates of reported injuries among 1201 basic police recruits in an Australian Police Force College. The research team found that 17% of participants who reached a 60–70 cm VJ height reported injuries or illnesses, while 54% of those who reached a 30–34 cm VJ height reported injuries and illnesses, highlighting a threefold greater risk of injury or illness for those with a lower VJ height. Furthermore, in a sample of 307 police trainees [25], push-ups (rs = −0.621), VJ (rs = −0.515), and 2.4 km run time (rs = −0.698) were all correlated with performance on an occupationally specific physical capability test that involved pushing and dragging objects, vaulting walls, and sprinting [26] Concerning BMI, Dawes et al. [13] investigated specific fitness variables that predicted a LEO’s success in a physical ability test (PAT) and observed a significantly higher BMI in the low-performers group than the high-performers, signifying the correlation between BMI and physical performance [13].
Given these findings, BMI can provide important insights into physical and exercise performance-related outcomes among tactical personnel. However, it remains less clear how LEOs across different BMI classifications differ in exercise performance parameters. Therefore, this study aimed to assess differences in exercise performance parameters among LEOs based on BMI classifications. It was hypothesized that those with a higher BMI would have lower fitness levels.

2. Materials and Methods

2.1. Subjects

Retrospective data of 532 male LEOs (age: 38.9 ± 7.4 years; height: 180.1 ± 6.9 cm; body mass: 92.1 ± 15.1 kg) from a single US-based law enforcement agency were analyzed. The data were derived from a portion of the agency’s fitness assessment conducted in 2018. Demographic data included the LEOs’ age, height, body mass, and BMI. Both height and body mass were self-reported, following a previously conducted method by Dawes et al. [10], showing no difference between self-reported and measured height (p = 0.830), body mass (p = 0.527), and BMI (p = 0.623). The LEOs were stratified into three different BMI classifications, including healthy (18.5–24.9 kg/m2), overweight (25.0–29.9 kg/m2), and obese (≥30.0 kg/m2). This study’s sample size was a convenience sample of de-identified data provided by the LEO agency, and the researchers had no control over the final sample size. The inclusion criteria for the participants included participating in the physical performance testing; however, not all participants were required to complete every test. Therefore, there are differences in the sample size per component of the physical performance variables. The only exclusion criterion for this study was if the LEOs did not complete any of the physical performance testing, which meant they did not have any data reported. Nevertheless, all procedures were conducted according to the Declaration of Helsinki. The Oklahoma State University (#ED-19-120-STW) institutional ethics committee approved using archival data for this study.

2.2. Parameters

Specific performance assessments were collected for each group during the agency’s annual fitness assessment, which included 1 min push-ups and sit-ups tests, a 20MFST, and a VJ. The results from 20MFST and VJ were then used in specific formulas, detailed hereafter, to determine VO2max and anaerobic power output, respectively. The scores for each test were collected by the law enforcement agency’s state patrol training staff. All staff were trained by an instructor who was a certified Tactical Strength and Conditioning Facilitator (TSAC-F), and TSAC-F-certified instructors verified the proficiency of each staff.

2.3. Upper Body and Trunk Muscular Endurance

2.3.1. One-Minute Push-Ups and Sit-Ups

The objective of these assessments was to complete as many push-ups or sit-ups as possible within a 1 min time frame. The validity of these procedures was acknowledged in previous studies [7,27,28]. The test was concluded once the officer failed to maintain proper technique and criteria, or 1 min had expired. Repetitions were counted in single complete units.

2.3.2. Twenty-Meter Multistage Fitness Test (20MSFT)

The protocols for the 20MSFT have been previously described by Dawes et al. [13] and are a commonly used assessment by LEOs/agencies to assess aerobic fitness [26]. The objective of this test was to run between two lines marked on the ground, which were spaced 20 m apart, while keeping pace to an audio cadence. The test started with an initial speed of 8.5 km/h, increasing by 0.5 km/h at every stage. The test was concluded when an officer reached volitional fatigue or could not maintain the stage’s set pace for two consecutive beeps. The total number of completed shuttles was recorded as their final score [29]. The total number of completed shuttles was converted to an estimated VO2max to assess aerobic fitness level [30].

2.4. Lower Body Power and Peak Power Output

Vertical Jump (VJ) Height

Similar to previous investigations in this population, VJ height was measured using a Just Jump (ProBotics Inc., Huntsville, AL, USA) system that calculates jump height based on flight time [7,27,28]. Each officer stepped onto the mat and, when ready, performed a vertical jump with an arm swing. Three attempts were allowed, with 10–30 s of rest between jumps. The highest jump was recorded as the officer’s final score and was then converted to centimeters for analysis. Additionally, the best VJ attempt was used to calculate peak anaerobic power output (PAPw) using the Sayers equation: Peak Power (W) = (60.7 × jump height (cm)) + (45.3 × body mass (kg)) − 2055 [31]. Relative PAPw was also calculated: P A P w k g . It is worth noting that VJ testing is fairly common among LEOs and is a practical and cost-effective method for assessing PAPw [32].

2.5. Statistical Analysis

2.5.1. Overview

All statistical analyses were performed with SPSS statistical analysis software (IBM Corp., Armonk, NY, USA, Version 29). Statistical significance was accepted at p ≤ 0.05 for all statistical analyses. Data are reported as medians and interquartile ranges for all nonparametric test results, as well as means ± standard deviations.

2.5.2. G*Power Sensitivity Analysis

Given that we used a large convenience sample (n = 532), conducting an a priori power analysis was not feasible. Rather, a post hoc sensitivity analysis was performed using G*Power (v3.1.9.6) to determine the minimum detectable effect sizes across the primary parameters. For non-parametric group comparisons (e.g., Kruskal–Wallis), the parametric analog (one-way ANOVA) indicated that, assuming α = 0.05 and 80% power, the study was sensitive to detect effect sizes of f = 0.135, reflecting small-to-moderate group differences. Similarly, for Quade’s rank-based ANCOVA, sensitivity analysis using fixed-effects ANCOVA (with 3 groups and 1 covariate) yielded a minimum detectable effect size of f = 0.135. For correlational analyses, sensitivity analysis based on Pearson’s r (used as an approximation for Spearman’s rank-order correlation test) indicated that the study could detect correlation coefficients of r ≥ ±0.085, indicating sufficient power to detect small to moderate associations. These analyses provide conservative estimates of statistical sensitivity and are reported here to increase transparency regarding our sample adequacy.

2.5.3. Normality and Correlation Analysis

Given our study sample size (exceeding 50 participants), the Kolmogorov–Smirnov Test was used to assess normality, which was violated for all demographic and exercise performance parameters except power output. A Spearman’s rank-order correlation test was used to evaluate the association between the demographic and exercise performance variables, with a Pearson’s correlation test conducted on PAPw.

2.5.4. Non-Parametric Tests

A non-parametric Kruskal–Wallis H test was used (as normality was violated) to assess differences in exercise performance parameters between BMI classification groups. Where statistically significant effects were found, the Mann–Whitney U test was used for pairwise comparisons. To reduce the risk of Type 1 errors (false positives), Bonferroni post hoc corrections for the Mann–Whitney U test were interpreted. Effect sizes were calculated as rank eta squared (ηH2), which was calculated using the following formula, where H is the Kruskal–Wallis H test statistic and n is the total number of observations: ηH2 = H ( n 1 ) . For pairwise comparisons between groups (i.e., healthy versus obese), effect sizes were calculated using the rank-biserial correlation (rb), where the following formula was applied, with N representing the total sample size of the two groups being compared: rb = z N . The rb was interpreted as follows: 0.1 = small, 0.3 = medium, 0.5 = large. In addition, a univariate non-parametric Quade’s rank-based ANCOVA test (an alternative to a parametric ANCOVA as normality was violated) was conducted with age as a covariate, and pairwise comparisons were performed using t-tests on ranked covariate-adjusted residuals. The effect size for the ANCOVA test results was computed via the following equation based on the ranked data: rANCOVA = t t ^ 2 + d f . The data rANCOVA is interpreted the same as the rb.

2.5.5. Parametric Tests

A one-way analysis of variance (ANOVA) was conducted to assess the difference in PAPw between BMI classification groups, given that PAPw did not violate the assumption of normality. The effect size for ANOVA statistics was calculated as partial eta squared. For pairwise comparisons with Bonferroni post hoc corrections between groups, effect sizes were calculated using Cohen’s d and interpreted as follows: <0.2 trivial, <0.5 small, <0.8 moderate, <1.2 large, and >1.2 very large [33]. Then, to account for age as a covariate, an analysis of covariance (ANCOVA) was conducted, with pairwise comparisons using the Bonferroni post hoc correction.

2.5.6. Multicollinearity

To assess potential multicollinearity between BMI and age, variance inflation factors (VIFs) were calculated using linear regression models. The VIFs were interpreted as <2 = low multicollinearity, 2 to 5 = moderate multicollinearity, and >5 = high multicollinearity.

3. Results

3.1. Correlation Analysis

Spearman’s rank-order and Pearson’s (PAPw only) correlation analysis revealed significant (p < 0.001) positive and inverse associations between age, height, body mass, BMI, and exercise performance parameters (See Table 1). Notably, correlations were strongest between body mass and PAPw (r = 0.956), followed by BMI and PAPw (r = 0.807) and relative PAPw and VJ (rs = 0.710). Weak to moderate inverse correlations were noted between BMI and VJ height (rs = −0.396), sit-ups (rs = −0.446), push-ups (rs = −0.328), and VO2max (rs = −0.541).

3.2. Demographic Data

Significant differences were noted across BMI classification groups for the demographic variables, including age (p < 0.001, ηH2 = 0.050), body mass (p < 0.001, ηH2 = 0.607), and BMI (p < 0.001, ηH2 = 0.843), while height did not differ (p = 0.529, ηH2 = 0.002). Pairwise comparisons revealed that the healthy BMI group differed from the obese group in that they were younger (p < 0.001, rb = −0.312), as well as having a lower body mass (p < 0.001, rb = −1.051) and a lower BMI (p < 0.001, rb = −1.247). In addition, the healthy BMI group differed from the overweight group in that they were younger (p = 0.006, rb = −0.163), as well as having a lower body mass (p < 0.001, rb = −0.428) and BMI (p = 0.006, rb = −0.163). Lastly, the overweight BMI group differed from the obese group in that they were younger (p = 0.006, rb = −0.138), as well as having a lower body mass (p < 0.001, rb = −0.596) and BMI (p < 0.001, rb = −0.683).
The rank-based ANCOVA analysis revealed significant differences across the BMI groups for body mass (p < 0.001) and BMI (p < 0.001), but not height (p = 0.534), when accounting for age as a covariate. Pairwise comparisons revealed that the healthy BMI group had a lower body mass (p < 0.001, rANCOVA = −0.737) and BMI (p < 0.001, rANCOVA = −0.885) compared to the obese group. Furthermore, the healthy BMI group had a lower body mass (p < 0.001, rANCOVA = −0.449) and BMI (p < 0.001, rANCOVA = −0.677) compared to the overweight group. The overweight BMI group also had a lower body mass (p < 0.001, rANCOVA = −0.619) and BMI (p < 0.001, rANCOVA = −0.799) compared to the obese group. Table 2 displays demographic data.

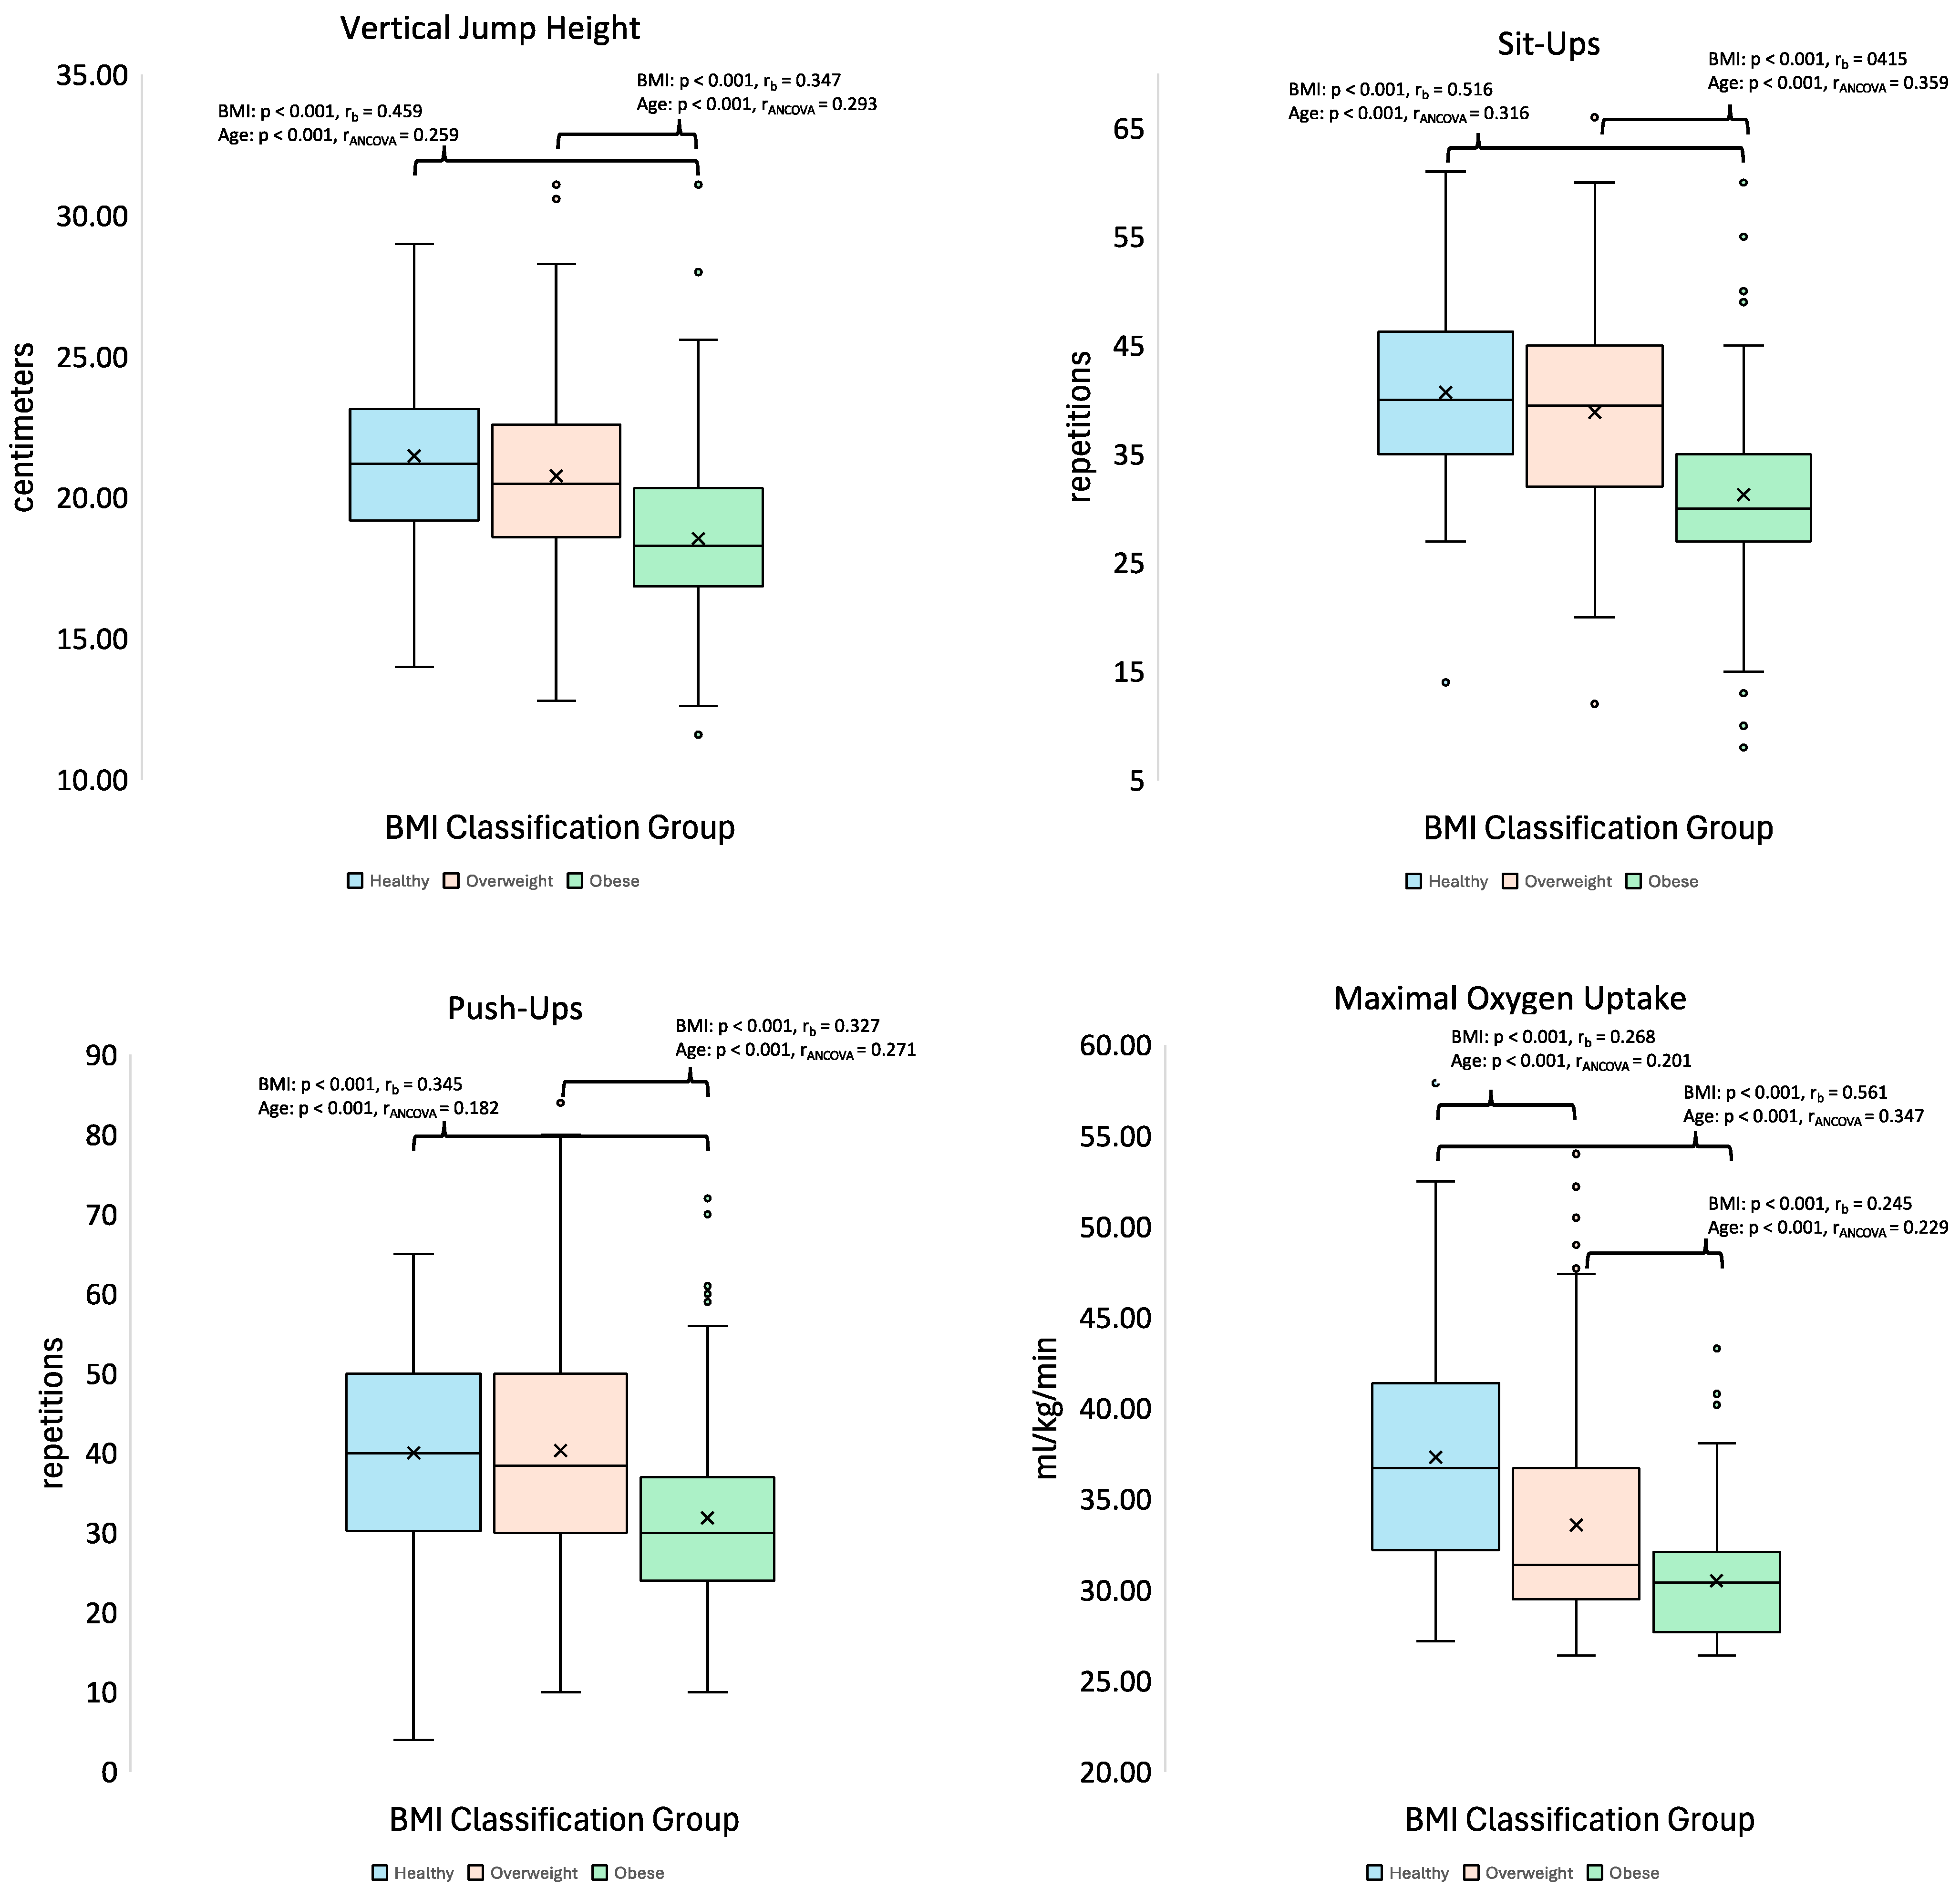
3.3. Exercise Performance Measures

The non-parametric and parametric ANOVA analyses revealed significant differences were noted across BMI classification groups for push-ups (p < 0.001, ηH2 = 0.101), sit-ups (p < 0.001, ηH2 = 0.187), VO2max (p < 0.001, ηH2 = 0.145), VJ height (p < 0.001, ηH2 = 0.137), absolute PAPw (p < 0.001, ηp2 = 0.485), and relative PAPw (p < 0.001, ηH2 = 0.040). Pairwise comparisons revealed the healthy BMI group differed from the obese group in that they completed more push-ups (p < 0.001, rb = 0.345) and sit-ups (p < 0.001, rb = 0.516), had higher VO2max values (p < 0.001, rb = 0.561) and VJ height (p < 0.001, rb = 0.459), but had lower absolute PAPw (p < 0.001, d = −2.526). In addition, the healthy BMI group differed from the overweight group in that they had higher VO2max values (p < 0.001, rb = 0.268) and had lower absolute PAPw (p < 0.001, d = −1.270). The overweight BMI group differed from the obese group in that they completed more repetitions for the push-ups test (p < 0.001, rb = 0.327) and sit-ups test (p < 0.001, rb = 0.415), in addition having displayed higher VO2max values (p < 0.001, rb = 0.245) VJ height (p < 0.001, rb = 0.347), but lower absolute PAPw (p < 0.001, d = −1.521). Lastly, the healthy BMI group had lower relative PAPw than the overweight BMI group (p < 0.001, rb = −0.183) and obese BMI group (p = 0.003, rb = −0.281), with no difference noted between the overweight and obese BMI groups (p = 0.306, rb = −0.083). Table 3 presents the exercise performance parameters as raw data, means, and standard deviations. Figure 1 displays the differences between BMI groups in exercise performance data between BMI categories using the nonparametric ANOVA and ANCOVA test results. Figure 2 displays the differences between BMI groups in both absolute (parametric) and relative PAPw (non-parametric) data, categorized by BMI, along with the ANOVA and ANCOVA test results.
The rank-based ANCOVA analysis revealed significant differences across the BMI groups for push-ups (p < 0.001), sit-ups (p < 0.001), VO2max (p < 0.001), VJ height (p < 0.001), and the parametric ANOCOVA test revealed differences for PAPw (p < 0.001) when accounting for age as a covariate. Pairwise comparisons revealed that the healthy BMI group completed more repetitions for the push-ups test (p < 0.001, rANCOVA = 0.182) and sit-ups test (p < 0.001, rANCOVA = 0.316), as well as had higher VO2max values (p < 0.001, rANCOVA = 0.347) and VJ height values (p < 0.001, rANCOVA = 0.259) compared to the obese group. Furthermore, the healthy BMI group had higher VO2max values (p < 0.001, rANCOVA = 0.201) than the overweight BMI group. The overweight BMI group also completed more repetitions for the push-ups test (p < 0.001, rANCOVA = 0.271) and sit-ups test (p < 0.001, rANCOVA = 0.359), as well as had higher VO2max values (p < 0.001, rANCOVA = 0.229) and VJ height values (p < 0.001, rANCOVA = 0.293) compared to the obese group. Lastly, the obese BMI group exhibited higher relative PAPw than both the healthy BMI group (p < 0.001, rANCOVA = −0.308) and the overweight BMI group (p = 0.008, rANCOVA = −0.122), with the overweight BMI group also displaying a higher relative PAPw than the healthy BMI group (p < 0.001, rANCOVA = −0.220). In terms of absolute PAPW, the parametric ANCOVA analysis revealed that the obese BMI group had a higher absolute PAPw than the healthy BMI group (p < 0.001) and the overweight BMI group (p < 0.001), in addition to the overweight BMI group displayed a higher absolute PAPw than the healthy BMI group (p < 0.001).

3.4. Multicollinearity Assessment

The multicollinearity assessment revealed consistent VIFs for BMI and age across models (VIF ≈ 1.025 to 1.060), which suggests no issue of multicollinearity. These findings support the interpretation that BMI and age contributed independently to exercise performance outcomes.

4. Discussion

This retrospective study examined differences in exercise performance among LEOs according to BMI classifications. The main findings of the present study demonstrated that a higher BMI was associated with poorer exercise performance, except for estimated lower body peak power output, even when accounting for age as a covariate. Thus, the hypothesis of this study was generally supported. The obese and overweight BMI groups displayed lower push-up scores (22.6% and 0.6%), sit-up scores (26.1% and 4.6%), VO2max values (20.0% and 10.5%), and VJ height (14.5% and 3.2%), while having a greater absolute PAPw (36.7% and 17.5%) and relative PAPw (3.3% and 2.5%) than the healthy group, respectively. It is also important to note that the overweight and obese BMI groups were older than the healthy BMI group (7.3% and 12.7% older, respectively). Spearman’s rank-order correlation results showed that BMI was weakly to moderately inversely correlated to the exercise performance parameters, excluding PAPw, which was strongly positively correlated with BMI. On the contrary, age was only weakly negatively correlated with push-ups and moderately positively correlated with PAPw. It is worthwhile noting that the correlation between BMI and absolute PAPw indicates that individuals with greater body mass tend to produce higher absolute power outputs. This relationship is consistent with fundamental biomechanical principles, as increased mass can contribute to greater force production during high-intensity physical tasks. Collectively, our findings suggest that the LEO with a higher BMI consistently performed worse across all exercise performance parameters. This information may be useful in developing nutritional and exercise intervention strategies to improve one’s BMI and, thus, improve exercise performance outcomes.
While differences were noted between the healthy BMI group and the two other BMI groups, the percentage differences and larger effect sizes for the exercise performance parameters demonstrate that, on average, obese LEOs performed worse on their fitness tests. However, PAPw was an exception, as revealed by a strong positive correlation between absolute PAPw and BMI. An underlying explanation for this is that a greater BMI—particularly when accompanied by increased fat-free mass—can enhance absolute power output, as more muscle mass contributes to greater force production during short-duration, high-intensity tasks. However, this is only speculative concerning our sample, as fat-free mass was not directly assessed. Furthermore, this may also underscore the importance of evaluating PAPw relative to body mass (e.g., watts/kg), particularly in occupational settings where relative power may be a more relevant indicator of functional capacity and task performance. Yet, we found that the healthy BMI group also displayed a lower relative PAPw than the other BMI groups, which may be explained by the notion that the LEOs with a higher BMI may still possess a higher level of skeletal muscle mass than their lower BMI counterparts. Nevertheless, our findings suggest that being classified as obese (BMI ≥ 30 kg/m2) is associated with a meaningful reduction in exercise performance and, potentially, occupation-specific physical abilities [13]. This is consistent with previous reports demonstrating that LEOs with a higher BMI have lower exercise performance parameters than their healthy BMI counterparts. For instance, Dawes and colleagues [12] assessed the influence of BMI classification on the physiological and perceptual demands of defensive tactics training among 24 state patrol officers, finding that overweight officers had lower defensive tactics scores than their counterparts with a healthy BMI. Interestingly, Estevez et al. [34] found that mildly obese Brazilian male highway police officers (28.6 ± 4.8 kg/m2) did not experience a negative impact on their aerobic power or muscular endurance performance based on their BMI classification. The discrepancy between our findings and those of Dawes and Estevez could be attributed to numerous factors, including differences in sample size, BMI range, and classification. For instance, the Estevez study classified participants as mildly obese, and the large standard deviation (±4.8 kg/m2) suggests substantial variability, which may have masked potential BMI-related performance effects. In our study, the larger sample size and classification of individuals with higher BMI levels (≥30 kg/m2) likely allowed for clearer detection of performance decrements associated with obesity. Nonetheless, it is plausible that LEOs with higher BMI may encounter increased physiological strain [10,18], which may negatively impact exercise and job performance.
Previous reports have shown that one’s ability to perform a greater number of push-ups [35] and those with a greater cardiorespiratory fitness (CRF) level have a lower incidence of cardiovascular disease (CVD)-related events [36,37,38,39]. An important observation of the present study is that the healthy and overweight BMI group, on average, demonstrated the ability to perform 40 push-ups, which has been identified as a threshold associated with a statistically significantly lower risk of a CVD event occurring among male firefighters (who are a similar occupational group to LEOs) [35]. It is worth noting that not every LEO within these respective BMI groups could complete 40 push-ups (i.e., 56% of the healthy individuals and 49.6% of the overweight individuals completed ≥40 push-ups). Regarding CRF, the LEOs of the present study collectively displayed sub-optimal VO2max values (i.e., 29.5 ± 12.3 mL/kg/min), with even the healthy BMI group exhibiting low levels (36.2 ± 9.2 mL/kg/min). Compared to the American College of Sports Medicine VO2max value standard (based on age), the healthy BMI group is considered to have “poor” CRF, while the overweight and obese BMI groups have “very poor” CRF levels [40]. It is essential to note that although the method used to estimate VO2max has been previously employed [26], and some researchers have considered this method as valid [41,42], it is plausible that VO2max values are underestimated [26]. Utilizing indirect calorimetry during a cardiopulmonary exercise test can provide a more accurate assessment of LEOs’ CRF, and it is possible that the healthier BMI group may display higher CRF levels, while the overweight and obese BMI groups may display even poorer CRF. Nonetheless, the results in the current investigation suggest that the LEOs in this study should aim to improve CRF regardless of BMI category.
Several studies have shown that significant increases in body mass, as well as BMI, tend to occur within tactical populations as years of service increase [1,2,3]. This may be due to a variety of factors, such as decreased physical activity and sleep quality, increased levels of stress, irregular work schedules, and reliance on fast food due to erratic shiftwork [2,22]. Additionally, certain aspects of physical performance, such as lower-body power, upper-body strength and endurance, and aerobic fitness, have been shown to decline with age [6]. Therefore, the two-fold effect of an increase in BMI and age may negatively impact an officer’s ability to perform essential job tasks across the occupational lifespan. Noting this, a well-structured conditioning program could help mitigate the loss of fitness with aging and optimize officer BMI. Nevertheless, it is important to note that although the overweight and obese LEOs of the present study were older than those with a healthy BMI, our assessment of age as a covariate in both parametric and non-parametric ANCOVA analyses confirmed that BMI remained a unique, statistically significant, and independent predictor of exercise performance outcomes. Lastly, the multicollinearity analysis revealed no issues of multicollinearity between BMI and age, suggesting that BMI and age contribute independently to performance.
The present study is not without limitations. First, the data come from a large convenience sample and are non-probabilistic; therefore, strict interpretations may not be appropriate. Second, the sample was limited to only males and did not account for other potentially influential factors, such as years of experience, race, and ethnicity. It is plausible that factors such as sex, exercise training history, and years of experience may influence the outcomes of this study. For instance, although speculative, those who log more training hours per week are likely to exhibit greater exercise performance parameter metrics. Additionally, female LEOs may exhibit lower performance values across all BMI groups compared to their male counterparts. Future work should include female LEOs and consider the impact of other population-based variables. It is also worth noting that because this study utilized a convenience sample, we were unable to control for the inter-rater reliability of the testers from the EO agency. Lastly, although Dawes et al. [10] have demonstrated no differences between self-reported and measured height, body mass, and BMI, it is still worth noting this as a potential limitation, as one may still over- or underestimate their metrics.

5. Conclusions

While it is well understood that a higher BMI can negatively impact one’s physical ability [43,44], the results of this study highlight the importance of maintaining healthy BMI levels in LEOs, as they may predict the underlying fitness variables necessary for occupational duties. Tactical athletes should focus on employing interventions that aid their ability to maintain a healthy BMI, and further consideration is likely needed to understand the impact of body composition (i.e., fat and lean mass) on exercise performance among LEOs, as BMI does not account for these variables. In terms of practical applications, interventions, such as routine physical evaluations, proper strength and conditioning programs, behavioral strategies for maintaining healthy habits, stress management, sleep quality, and nutritional approaches, should be prioritized in law enforcement agencies. Intervention priority should be given to those with a higher BMI and/or older age, as they are at most risk of poorer task performance on the job.

Author Contributions

Conceptualization, D.R.M. and J.J.D.; methodology, D.E.G., D.R.M. and J.J.D.; formal analysis, D.E.G.; investigation, J.J.D.; data curation, D.E.G.; writing—original draft preparation, D.E.G.; writing—review and editing, D.E.G., D.R.M., F.K., R.G.L., R.M.O. and J.J.D. All authors have read and agreed to the published version of the manuscript.

Funding

This research received no external funding.

Institutional Review Board Statement

The study was conducted in accordance with the Declaration of Helsinki and approved by the Institutional Review Board of Oklahoma State University (#ED-19-120-STW), approval date (7 October 2019).

Informed Consent Statement

Informed consent was obtained from all subjects involved in the study.

Data Availability Statement

No new data were created or analyzed in this study. Data sharing is not applicable to this article.

Conflicts of Interest

The authors declare no conflict of interest.

Abbreviations

The following abbreviations are used in this manuscript:
20MFST20 m Multistage Fitness Test
ANCOVAAnalysis of Covariance
BMIBody Mass Index
CRFCardiorespiratory Fitness
CVDCardiovascular Disease
LEOLaw Enforcement Officer
PAPwPeak Anaerobic Power Output
PATPhysical Ability Test
SMMSkeletal Muscle Mass
SWATSpecial Weapons and Tactics
TSAC-FTactical Strength and Conditioning Facilitator
USUnited States
VJVertical Jump
VO2maxMaximal Oxygen Uptake

References

  1. Boyce, R.; Jones, G.; Lloyd, C.; Boone, E. A Longitudinal Observation of Police: Body Composition Changes over 12 Years with Gender and Race Comparisons. J. Exerc. Physiol. Online 2008, 11, 1. [Google Scholar]
  2. Kukic, F.; Cvorovic, A.; Dawes, J.J.; Korpanovski, N. Body mass index differences of police cadets and police employees. In Proceedings of the International Scientific Conference Effects of Applying Physical Activity on Anthropological Status of Children Adolescents and Adults, Belgrade, Serbia, 11–12 December 2017; pp. 11–12. [Google Scholar]
  3. Sörensen, L.; Smolander, J.; Louhevaara, V.; Korhonen, O.; Oja, P. Physical activity, fitness and body composition of Finnish police officers: A 15-year follow-up study. Occup. Med. 2000, 50, 3–10. [Google Scholar] [CrossRef] [PubMed]
  4. Dopsaj, M.; Vuković, M. Prevalence of the body mass index (BMI) among the members of the Ministry of Interior of the Republic of Serbia: Pilot study. Bezbednost 2015, 57, 28–48. [Google Scholar] [CrossRef]
  5. Kukic, F.; Dopsaj, M. Structural analysis of body composition status in Abu Dhabi police personnel. NBP Nauka Bezbednosti Polic. 2016, 21, 19–38. [Google Scholar] [CrossRef]
  6. Dawes, J.J.; Orr, R.M.; Flores, R.R.; Lockie, R.G.; Kornhauser, C.; Holmes, R. A physical fitness profile of state highway patrol officers by gender and age. Ann. Occup. Environ. Med. 2017, 29, 16. [Google Scholar] [CrossRef]
  7. Beck, A.Q.; Clasey, J.L.; Yates, J.W.; Koebke, N.C.; Palmer, T.G.; Abel, M.G. Relationship of Physical Fitness Measures vs. Occupational Physical Ability in Campus Law Enforcement Officers. J. Strength Cond. Res. 2015, 29, 2340–2350. [Google Scholar] [CrossRef]
  8. Bissett, D.; Bissett, J.; Snell, C. Physical agility tests and fitness standards: Perceptions of law enforcement officers. Police Pract. Res. 2012, 13, 208–223. [Google Scholar] [CrossRef]
  9. Canetti, E.F.D.; Orr, R.M.; Brown, W.; Schram, B.; Lockie, R.G.; Dawes, J.J. The Use of Musculoskeletal Fitness Measures as Indicators of Performance in Police Occupational Tasks. Int. J. Exerc. Sci. 2024, 17, 819–830. [Google Scholar] [CrossRef]
  10. Dawes, J. Accuracy of Self-Reported Height, Body Mass and Derived Body Mass Index in a Group of Law Enforcement Officers. Nauka Bezb. Polic. 2019, 24, 7–15. [Google Scholar] [CrossRef]
  11. Dawes, J.; Orr, R.; Elder, C.; Rockwell, C. Association between Body Fatness and Measures of Muscular Endurance Among Part-Time Swat Officers. J. Aust. Strength Cond. 2014, 22, 32–36. [Google Scholar]
  12. Dawes, J.J.; Kornhauser, C.L.; Crespo, D.; Elder, C.L.; Lindsay, K.G.; Holmes, R.J. Does Body Mass Index Influence the Physiological and Perceptual Demands Associated with Defensive Tactics Training in State Patrol Officers? Int. J. Exerc. Sci. 2018, 11, 319–330. [Google Scholar] [CrossRef] [PubMed]
  13. Dawes, J.J.; Lindsay, K.; Bero, J.; Elder, C.; Kornhauser, C.; Holmes, R. Physical Fitness Characteristics of High vs. Low Performers on an Occupationally Specific Physical Agility Test for Patrol Officers. J. Strength Cond. Res. 2017, 31, 2808–2815. [Google Scholar] [CrossRef] [PubMed]
  14. Dawes, J.J.; Orr, R.M.; Siekaniec, C.L.; Vanderwoude, A.A.; Pope, R. Associations between anthropometric characteristics and physical performance in male law enforcement officers: A retrospective cohort study. Ann. Occup. Environ. Med. 2016, 28, 26. [Google Scholar] [CrossRef]
  15. Čvorović, A.; Kukić, F.; Heinrich, K.M.; Dopsaj, M. Association of waist to height ratio with 2.4 kilometers running time among male police populations. Work 2022, 71, 1097–1104. [Google Scholar] [CrossRef]
  16. Garber, C.E.; Blissmer, B.; Deschenes, M.R.; Franklin, B.A.; Lamonte, M.J.; Lee, I.M.; Nieman, D.C.; Swain, D.P. American College of Sports Medicine position stand. Quantity and quality of exercise for developing and maintaining cardiorespiratory, musculoskeletal, and neuromotor fitness in apparently healthy adults: Guidance for prescribing exercise. Med. Sci. Sports Exerc. 2011, 43, 1334–1359. [Google Scholar] [CrossRef]
  17. Pollock, M.L.; Gaesser, G.A.; Butcher, J.D.; Després, J.-P.; Dishman, R.K.; Franklin, B.A.; Garber, C.E. ACSM Position Stand: The Recommended Quantity and Quality of Exercise for Developing and Maintaining Cardiorespiratory and Muscular Fitness, and Flexibility in Healthy Adults. Med. Sci. Sports Exerc. 1998, 30, 975–991. [Google Scholar] [CrossRef]
  18. Knowles, R.; Carter, J.; Jebb, S.A.; Bennett, D.; Lewington, S.; Piernas, C. Associations of Skeletal Muscle Mass and Fat Mass With Incident Cardiovascular Disease and All-Cause Mortality: A Prospective Cohort Study of UK Biobank Participants. J. Am. Heart Assoc. 2021, 10, e019337. [Google Scholar] [CrossRef] [PubMed]
  19. Kukic, F.; Dopsaj, M.; Dawes, J.; Orr, R.M.; Cvorovic, A. Use of human body morphology as an indication of physical fitness: Implications for police officers. Int. J. Morphol. 2018, 36, 1407–1412. [Google Scholar] [CrossRef]
  20. Kukic, F.; Cvorovic, A.; Dawes, J.; Orr, R.M.; Dopsaj, M. Relations of body voluminosity and indicators of muscularity with physical performance of police employees: Pilot study. Balt. J. Sport Health Sci. 2018, 4, 30–38. [Google Scholar] [CrossRef]
  21. Nogueira, E.C.; Porto, L.G.; Nogueira, R.M.; Martins, W.R.; Fonseca, R.M.; Lunardi, C.C.; de Oliveira, R.J. Body Composition is Strongly Associated With Cardiorespiratory Fitness in a Large Brazilian Military Firefighter Cohort: The Brazilian Firefighters Study. J. Strength Cond. Res. 2016, 30, 33–38. [Google Scholar] [CrossRef]
  22. Cooper Institute. Frequently Asked Questions Regarding Fitness Standards in Law Enforcement. Available online: https://www.valorforblue.org/Clearinghouse/697/Frequently-Asked-Questions-Regarding-Fitness-Standards-in-Law-Enforcement (accessed on 1 June 2025).
  23. Orr, R.; Pope, R.; Peterson, S.; Hinton, B.; Stierli, M. Leg Power As an Indicator of Risk of Injury or Illness in Police Recruits. Int. J. Environ. Res. Public Health. 2016, 13, 237. [Google Scholar] [CrossRef] [PubMed]
  24. Tomes, C.D.; Sawyer, S.; Orr, R.; Schram, B. Ability of fitness testing to predict injury risk during initial tactical training: A systematic review and meta-analysis. Inj. Prev. 2020, 26, 67–81. [Google Scholar] [CrossRef] [PubMed]
  25. Lockie, R.; Dawes, J.J.; Sakura, T.; Schram, B.; Orr, R.M. Relationships Between Physical Fitness Assessment Measures and a Workplace Task-Specific Physical Assessment Among Police Officers: A Retrospective Cohort Study. J. Strength Cond. Res. 2023, 37, 678–683. [Google Scholar] [CrossRef]
  26. Campbell, P.; Maupin, D.; Lockie, R.G.; Dawes, J.J.; Simas, V.; Canetti, E.; Schram, B.; Orr, R. Evaluating the Variability Between 20-m Multistage Fitness Test Estimating Equations in Law Enforcement Recruits. J. Strength Cond. Res. 2024, 38, 742–748. [Google Scholar] [CrossRef] [PubMed]
  27. Lockie, R.G.; Dawes, J.J.; Kornhauser, C.L.; Holmes, R.J. Cross-Sectional and Retrospective Cohort Analysis of the Effects of Age on Flexibility, Strength Endurance, Lower-Body Power, and Aerobic Fitness in Law Enforcement Officers. J. Strength Cond. Res. 2019, 33, 451–458. [Google Scholar] [CrossRef]
  28. Kukic, F.; Orr, R.; Markovic, M.; Dawes, J.; Cvorovic, A.; Koropanovski, N. Factorial and Construct Validity of Sit-Up Test of Different Durations to Assess Muscular Endurance of Police Students. Sustainability 2022, 14, 13630. [Google Scholar] [CrossRef]
  29. Léger, L.A.; Lambert, J. A maximal multistage 20-m shuttle run test to predict VO2 max. Eur. J. Appl. Physiol. Occup. Physiol. 1982, 49, 1–12. [Google Scholar] [CrossRef]
  30. Ramsbottom, R.; Brewer, J.; Williams, C. A progressive shuttle run test to estimate maximal oxygen uptake. Br. J. Sports Med. 1988, 22, 141–144. [Google Scholar] [CrossRef]
  31. Sayers, S.P.; Harackiewicz, D.V.; Harman, E.A.; Frykman, P.N.; Rosenstein, M.T. Cross-validation of three jump power equations. Med. Sci. Sports Exerc. 1999, 31, 572–577. [Google Scholar] [CrossRef]
  32. Post, B.K.; Dawes, J.J.; Lockie, R.G. Relationships Between Tests of Strength, Power, and Speed and the 75-Yard Pursuit Run. J. Strength Cond. Res. 2022, 36, 99–105. [Google Scholar] [CrossRef]
  33. Sullivan, G.M.; Feinn, R. Using Effect Size-or Why the P Value Is Not Enough. J. Grad. Med. Educ. 2012, 4, 279–282. [Google Scholar] [CrossRef] [PubMed]
  34. Esteves, J.; Andrade, M.; Gealh, L. Characterization of the physical condition and cardiovascular risk of highway police officers. Rev. Andal. Med. Deporte 2015, 7, 66–71. [Google Scholar] [CrossRef]
  35. Yang, J.; Christophi, C.A.; Farioli, A.; Baur, D.M.; Moffatt, S.; Zollinger, T.W.; Kales, S.N. Association Between Push-up Exercise Capacity and Future Cardiovascular Events Among Active Adult Men. JAMA Netw. Open 2019, 2, e188341. [Google Scholar] [CrossRef] [PubMed]
  36. Strauss, M.; Foshag, P.; Brzęk, A.; Vollenberg, R.; Jehn, U.; Littwitz, H.; Leischik, R. Cardiorespiratory Fitness Is Associated with a Reduced Cardiovascular Risk in Occupational Groups with Different Working Conditions: A Cross-Sectional Study among Police Officers and Office Workers. J. Clin. Med. 2021, 10, 2025. [Google Scholar] [CrossRef]
  37. Acar, H.; Eler, N. The Relationship between Body Composition and Jumping Performance of Volleyball Players. J. Educ. Train. Stud. 2019, 7, 192. [Google Scholar] [CrossRef]
  38. McAllister, M.J.; Gonzalez, D.E.; Leonard, M.; Martaindale, M.H.; Bloomer, R.J.; Pence, J.; Martin, S.E. Risk Factors for Cardiometabolic Disease in Professional Firefighters. J. Occup. Environ. Med. 2023, 65, 119–124. [Google Scholar] [CrossRef]
  39. McAllister, M.J.; Gonzalez, D.E.; Leonard, M.; Martaindale, M.H.; Bloomer, R.J.; Pence, J.; Martin, S.E. Firefighters with Higher Cardiorespiratory Fitness Demonstrate Lower Markers of Cardiovascular Disease Risk. J. Occup. Environ. Med. 2022, 64, 1036–1040. [Google Scholar] [CrossRef]
  40. Ferguson, B. ACSM’s guidelines for exercise testing and prescription 9th Ed. 2014. J. Can. Chiropr. Assoc. 2014, 58, 328. [Google Scholar]
  41. Flouris, A.D.; Metsios, G.S.; Famisis, K.; Geladas, N.; Koutedakis, Y. Prediction of VO2max from a new field test based on portable indirect calorimetry. J. Sci. Med. Sport 2010, 13, 70–73. [Google Scholar] [CrossRef]
  42. Sproule, J.; Kunalan, C.; McNeill, M.; Wright, H. Validity of 20-MST for predicting VO2max of adult Singaporean athletes. Br. J. Sports Med. 1993, 27, 202–204. [Google Scholar] [CrossRef]
  43. Hardy, R.; Cooper, R.; Aihie Sayer, A.; Ben-Shlomo, Y.; Cooper, C.; Deary, I.J.; Demakakos, P.; Gallacher, J.; Martin, R.M.; McNeill, G.; et al. Body mass index, muscle strength and physical performance in older adults from eight cohort studies: The HALCyon programme. PLoS ONE 2013, 8, e56483. [Google Scholar] [CrossRef] [PubMed]
  44. Ding, C.; Jiang, Y. The Relationship between Body Mass Index and Physical Fitness among Chinese University Students: Results of a Longitudinal Study. Healthcare 2020, 8, 570. [Google Scholar] [CrossRef] [PubMed]
Figure 1. Exercise performance data (except power output); ‘age’ denotes the effect of BMI when adjusting for age as a covariate. rb = rank-biserial correlation effect size and rANCOVA = the ANCOVA test ranked data effect size.
Healthcare 13 01584 g001
Figure 2. Absolute (parametric; mean ± SD) relative (non-parametric; Median and Interquartile ranges) peak anaerobic power output data; ‘age’ denotes the effect of BMI when adjusting for age as a covariate. rb = rank-biserial correlation effect size and rANCOVA = the ANCOVA test ranked data effect size.
Healthcare 13 01584 g002
Table 1. Correlation Analysis Results.
VariableAgeHeightBody MassBMIVJSit−UpsPush−UpsVO2maxPAPw
Height (cm)−0.019
Body mass (kg)0.197 **0.504 **
Body mass Index (kg/m2)0.249 **0.0170.861 **
Vertical Jump (cm)−0.442 **−0.052−0.352 **−0.396 **
Sit−Ups (repetitions)−0.376 **−0.010−0.372 **−0.446 **0.466 **
Push−Ups (repetitions)−0.344 **−0.226 **−0.383 **−0.328 **0.501 **0.663 **
VO2max (mL/kg/min)−0.418 **0.037−0.427 **−0.541 **0.409 **0.580 **0.517 **
Peak Power Output (watts) #0.0690.511 **0.956 **0.807 **−0.063−0.302 **−0.269 **−0.200 **
Relative Peak Power Output (watts/kg)−0.317 **0.282 **0.311 **0.209 **0.710 **0.199 **0.197 **0.120 *0.590 **
* Significant at p < 0.05; ** Significant at p < 0.001. BMI = Body Mass Index; cm = centimeters; kg = kilograms; m = meters; min = minutes; mL = mililiters; VJ = Vertical Jump, VO2max = Maximal Oxygen Uptake. PAPw = Peak Anerobic Power Output. # denotes that the Pearson’s correlation test was used for the peak power output.
Table 2. Demographic data.
BMI Classification Group Age (years) Height (cm) Body Mass (kg) Body Mass Index (kg/m2)
NNNN
Median (IQR)Healthy10236 (30−41.5) *102180.3 (175.2−183.5)10274.8 (70.9−80.7) *†¥§10223.7 (22.8−24.4) *†¥§
Overweight25939 (33−45) *260180.3 (175.2−185.4)26088.4 (83.4−92.9) *‡∞¥26027.3 (26.2−28.6) *‡∞¥
Obese17043 (36−47) ‡†170180.3 (175.2−183.5)170104.3 (99.2−113.3) ‡†§∞17032.1 (31−33.9) ‡†§∞
Total53139 (33−46)532180.3 (175.2−185.4)53290.7 (81.6−101.1)53228 (25.4−30.9)
Mean ± SDHealthy10235.93±7.62102180.7±7.1810276.1±7.7210223.27±1.39
Overweight25938.88±7.07260179.66±6.7226088.43±8.4926027.35±1.46
Obese17040.83±7.15170180.33±7.31170107.46±12.717032.99±2.95
Total53138.94±7.39532180.07±6.9953292.15±15.1453228.37±4.06
Data a represented as medians (IQR) for non−parametric test, as well as means ± SD. n sizes vary due to metrics not being completed or missing observations for the participant(s). BMI = Body mass Index (kg/m2); cm = circumference; IQR = interquartile range; kg = kilogram; m = meters. The pairwise comparison non−parametric Mann−Whitney U test results are denoted with the following symbols: * Significantly different from Obese group; deviations; Significantly different from Overweight group; Significantly different from Healthy group. The univariate non−parametric Quade’s rank−based ANCOVA test results are denoted with the following symbols: ¥ Significantly different from Obese group; deviations; § Significantly different from Overweight group; Significantly different from Healthy group.
Table 3. Exercise performance data.
BMI Classification Group Sit−Ups (Repetitions) Push−Ups (Repetitions) VO2Max (mL/kg/min) Vertical Jump (cm) Absolute PAPw (watts) Relative PAPw (watts/kg)
NNNNNN
healthy10240.69±8.1410040.05±11.799937.32±6.859021.47±2.95902706.55±399.819035.4±2.6
overweight26038.85±8.1926040.32±13.6725333.58±5.8923920.78±3.112393226.18±412.4523936.3±2.2
obese17031.28±8.3316831.9±11.9211630.52±3.4314918.55±2.941493924.09±525.2814936.6±1.7
Total53236.79±9.0652837.59±13.3448233.56±6.0147820.22±3.234783345.89±623.7447836.2±2.2
Data a represented as means ± standard. n size vary due to metrics not completed or missing observation for the participant(s). BMI = Body Mass Index; cm = Centimeters; kg = Kiligrams; min = Minutes; mL = Mililiters; N = sample size; VO2Max = Maximal Oxygen Uptake; PAPw = Peak Anaerobic Power Output.
Disclaimer/Publisher’s Note: The statements, opinions and data contained in all publications are solely those of the individual author(s) and contributor(s) and not of MDPI and/or the editor(s). MDPI and/or the editor(s) disclaim responsibility for any injury to people or property resulting from any ideas, methods, instructions or products referred to in the content.

