
Social, Economic, and Ethico-Political Determinants of Psychosomatic Health Disparities: Equity and Fairness Under COVID-19 in Japan


Abstract
1. Introduction
2. Materials and Methods
2.1. Population, Data Collection, and Questions
- SWLS (5 questions).
- PERMA profiler (23 questions).
- I COPPE, which has been adapted and modified for this study (19 questions).
- Physical/Mental and Feeling Change under COVID-19.
2.2. Data Analysis Method
3. Results
3.1. Health Inequalities Concerning Objective Personal Economic Situations
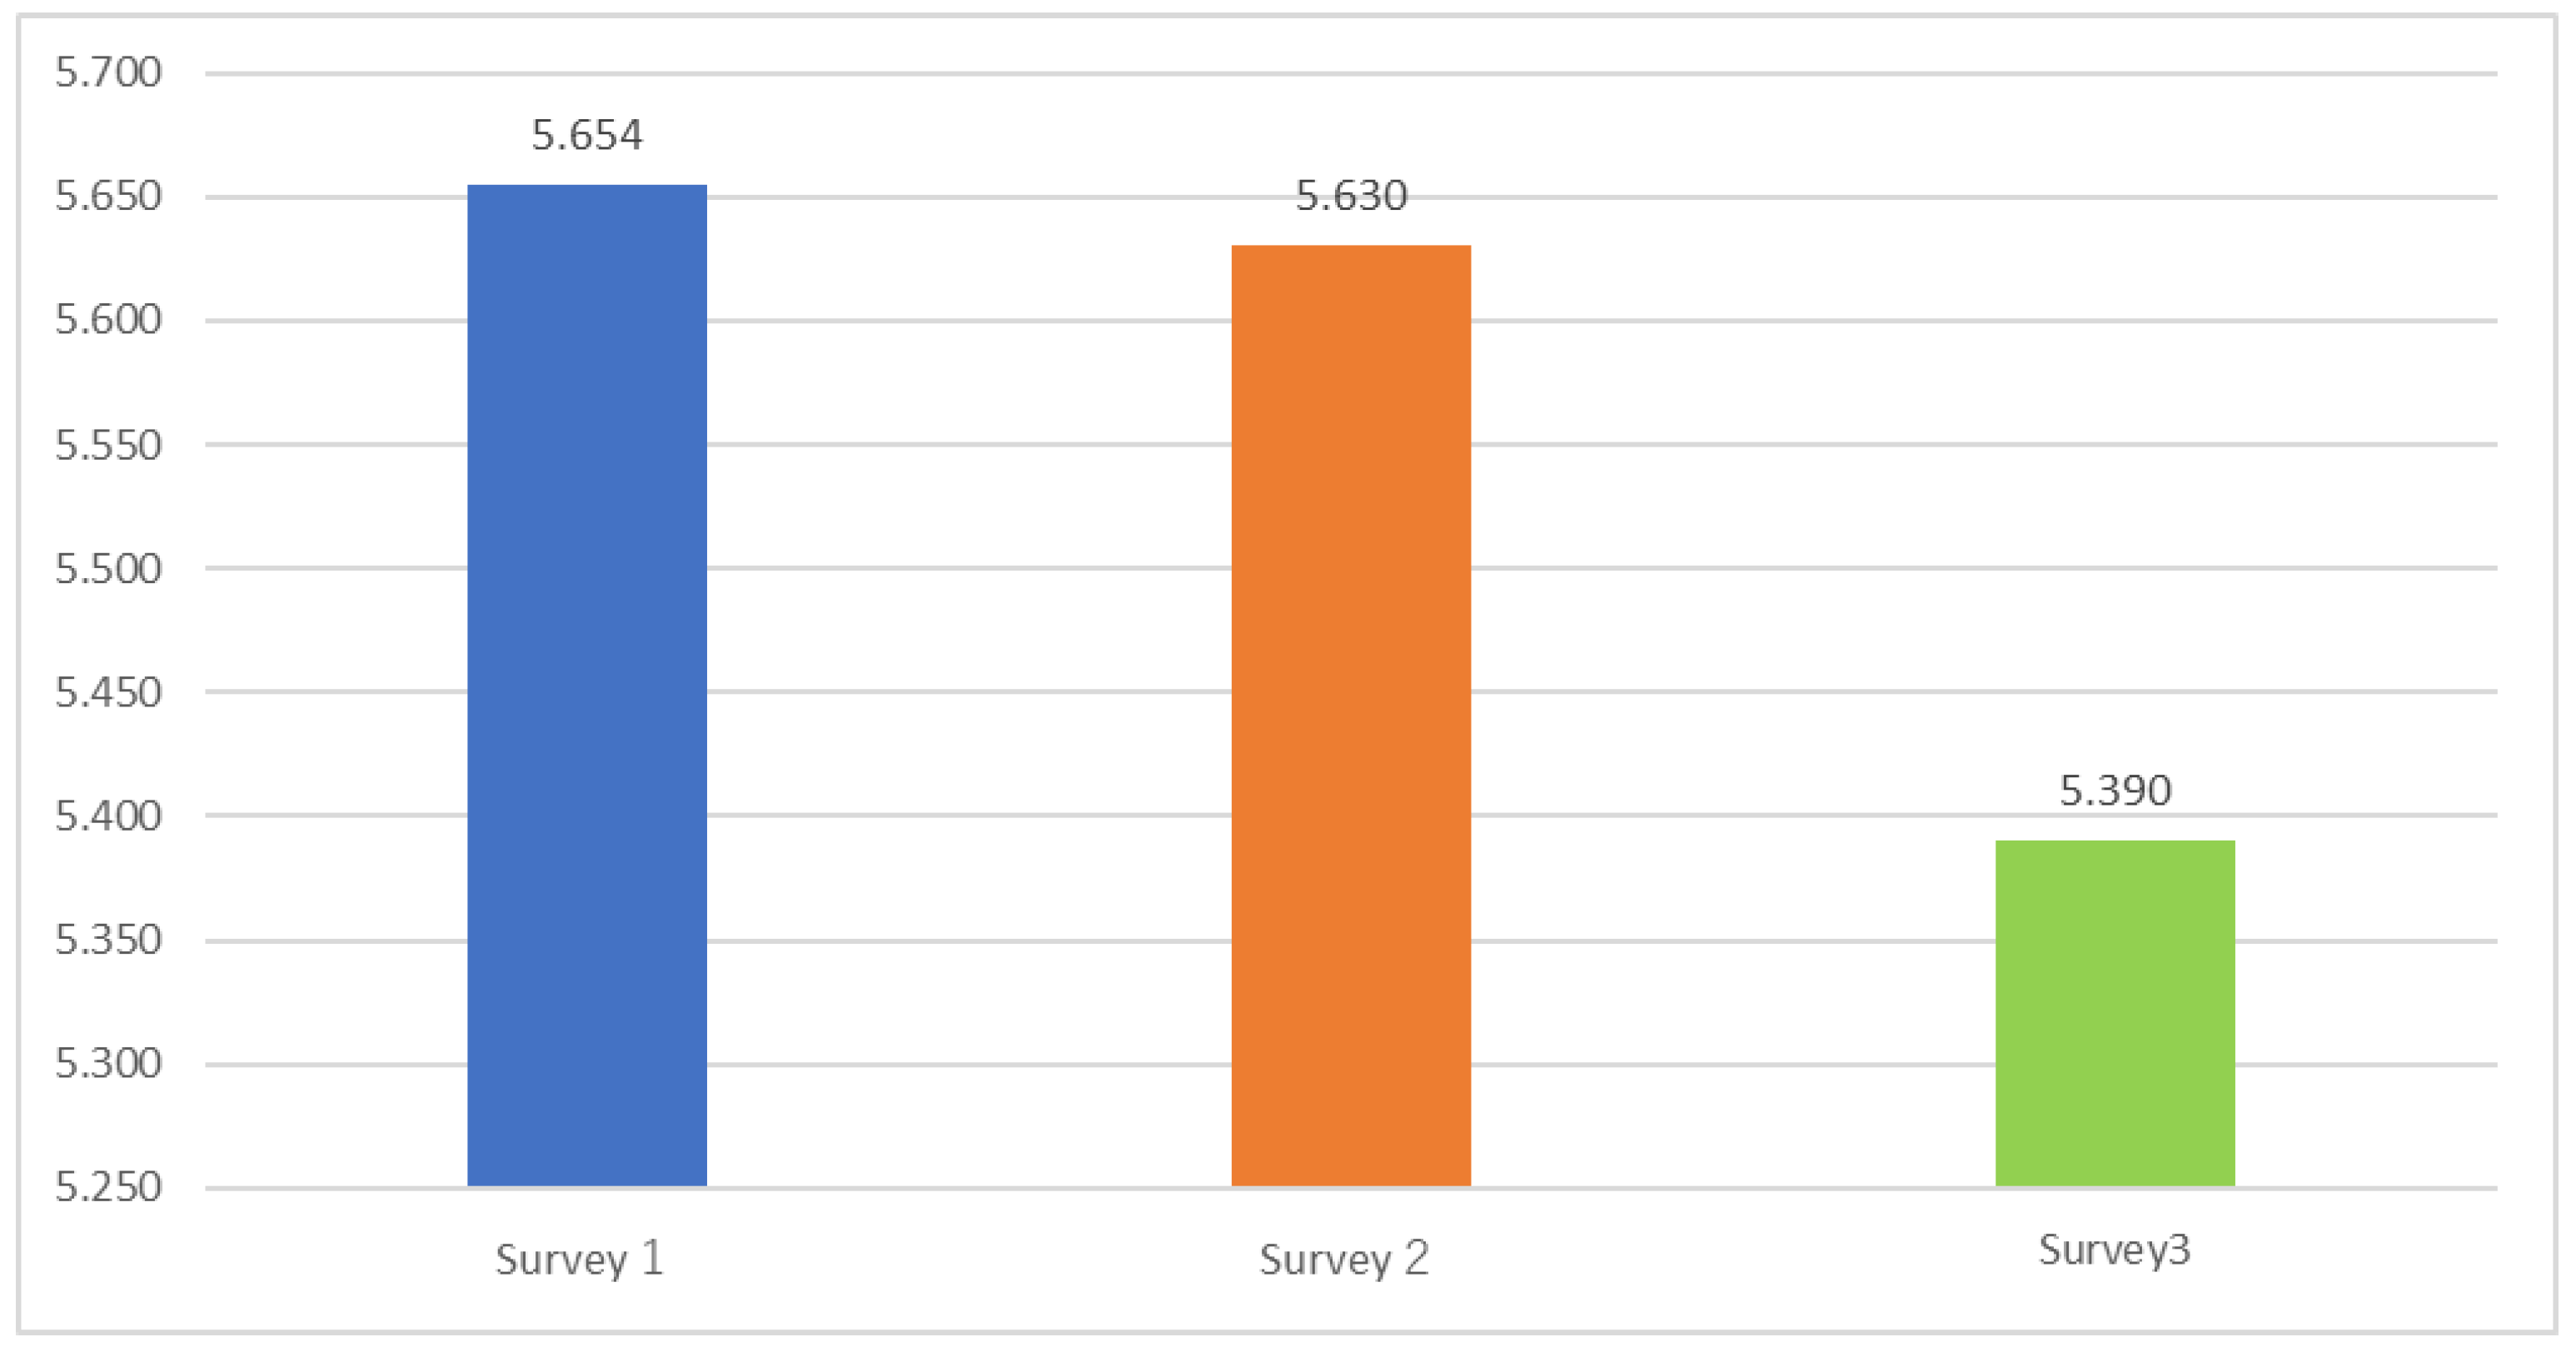
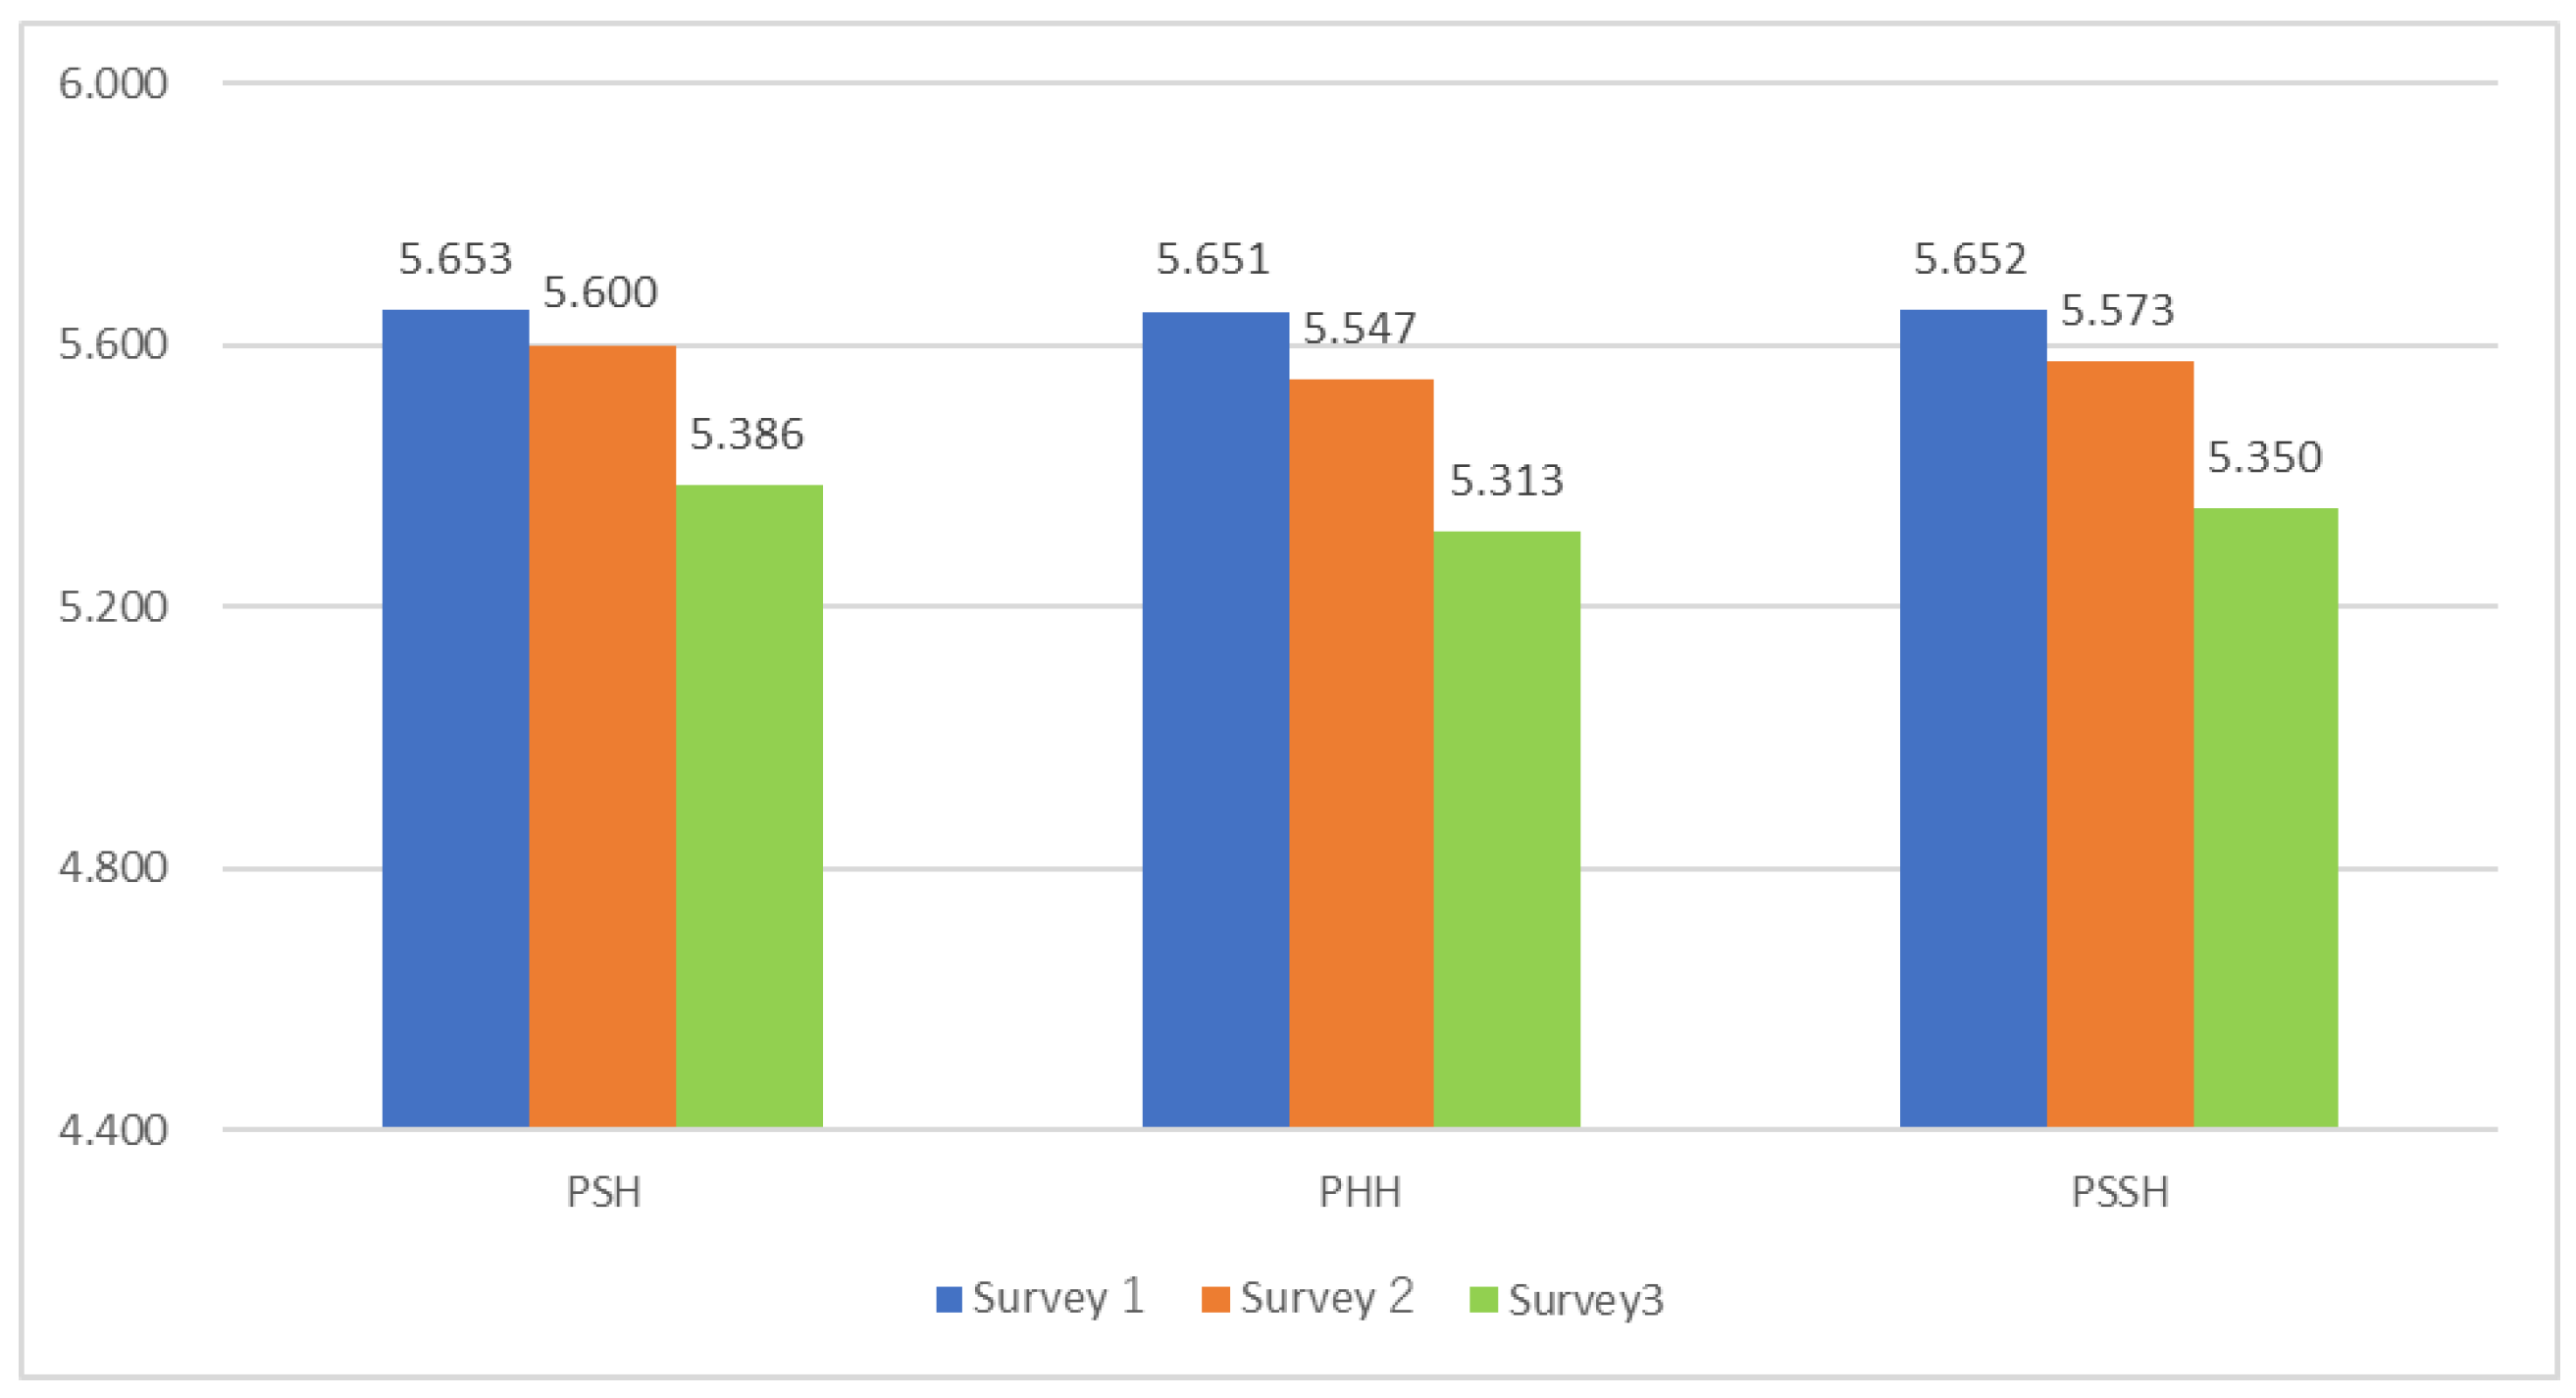
3.1.1. Decline in WB During COVID-19
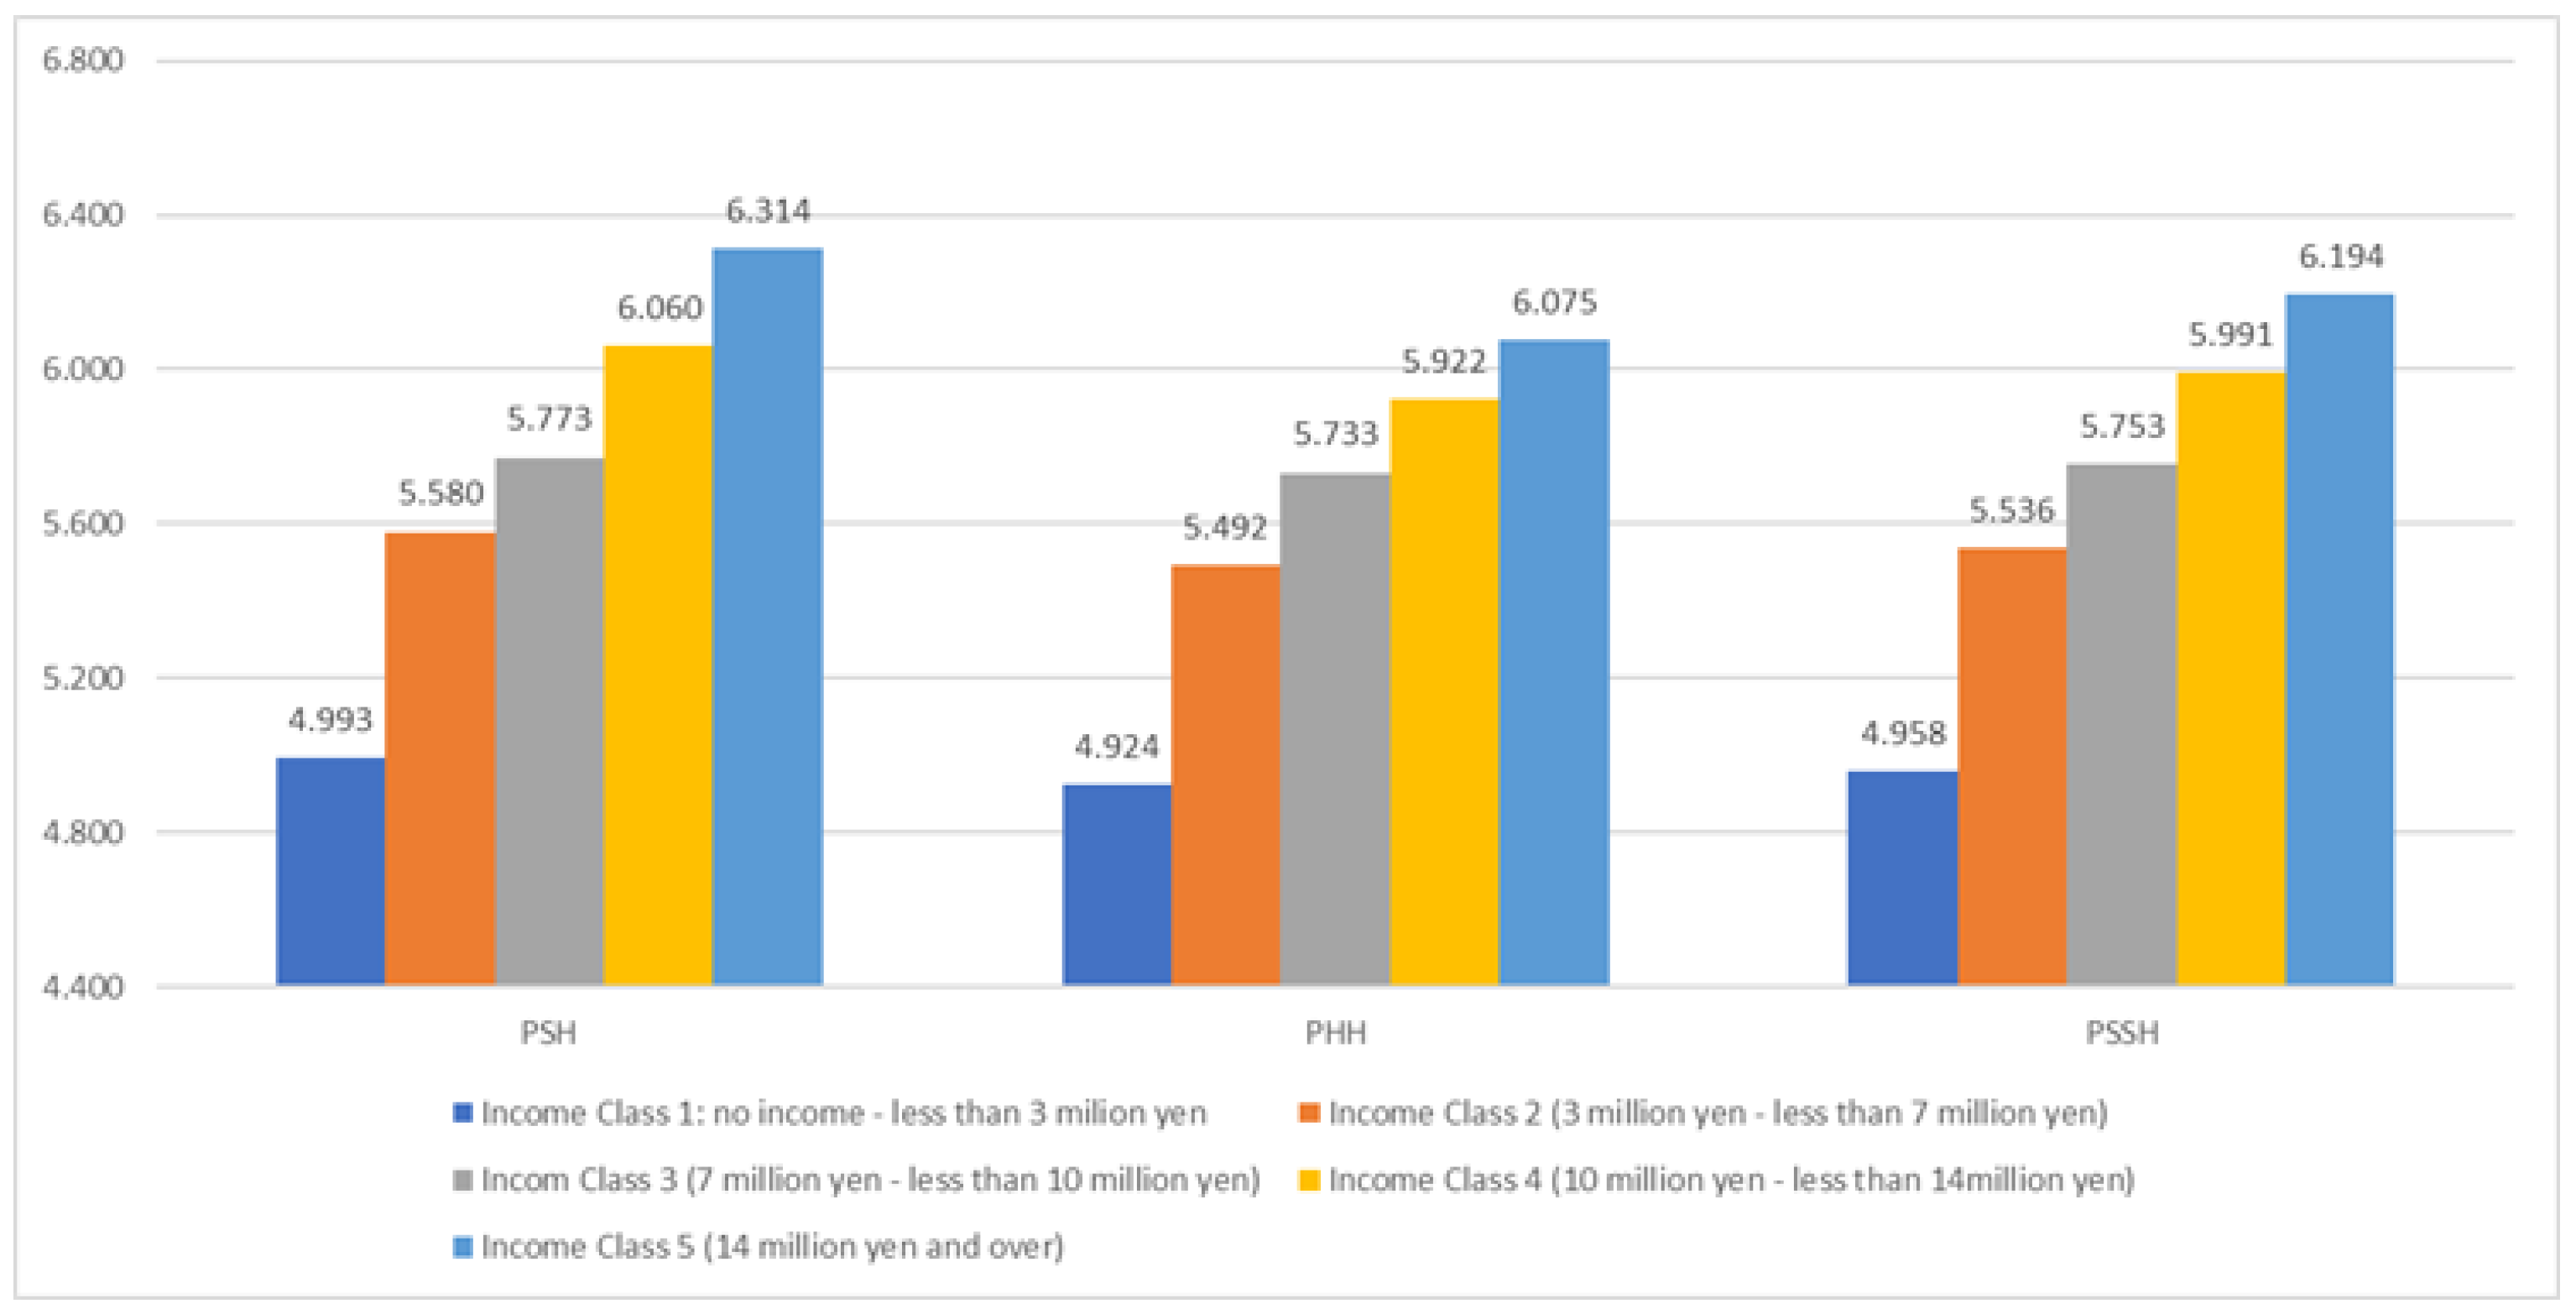
3.1.2. Income and Psychosomatic Health
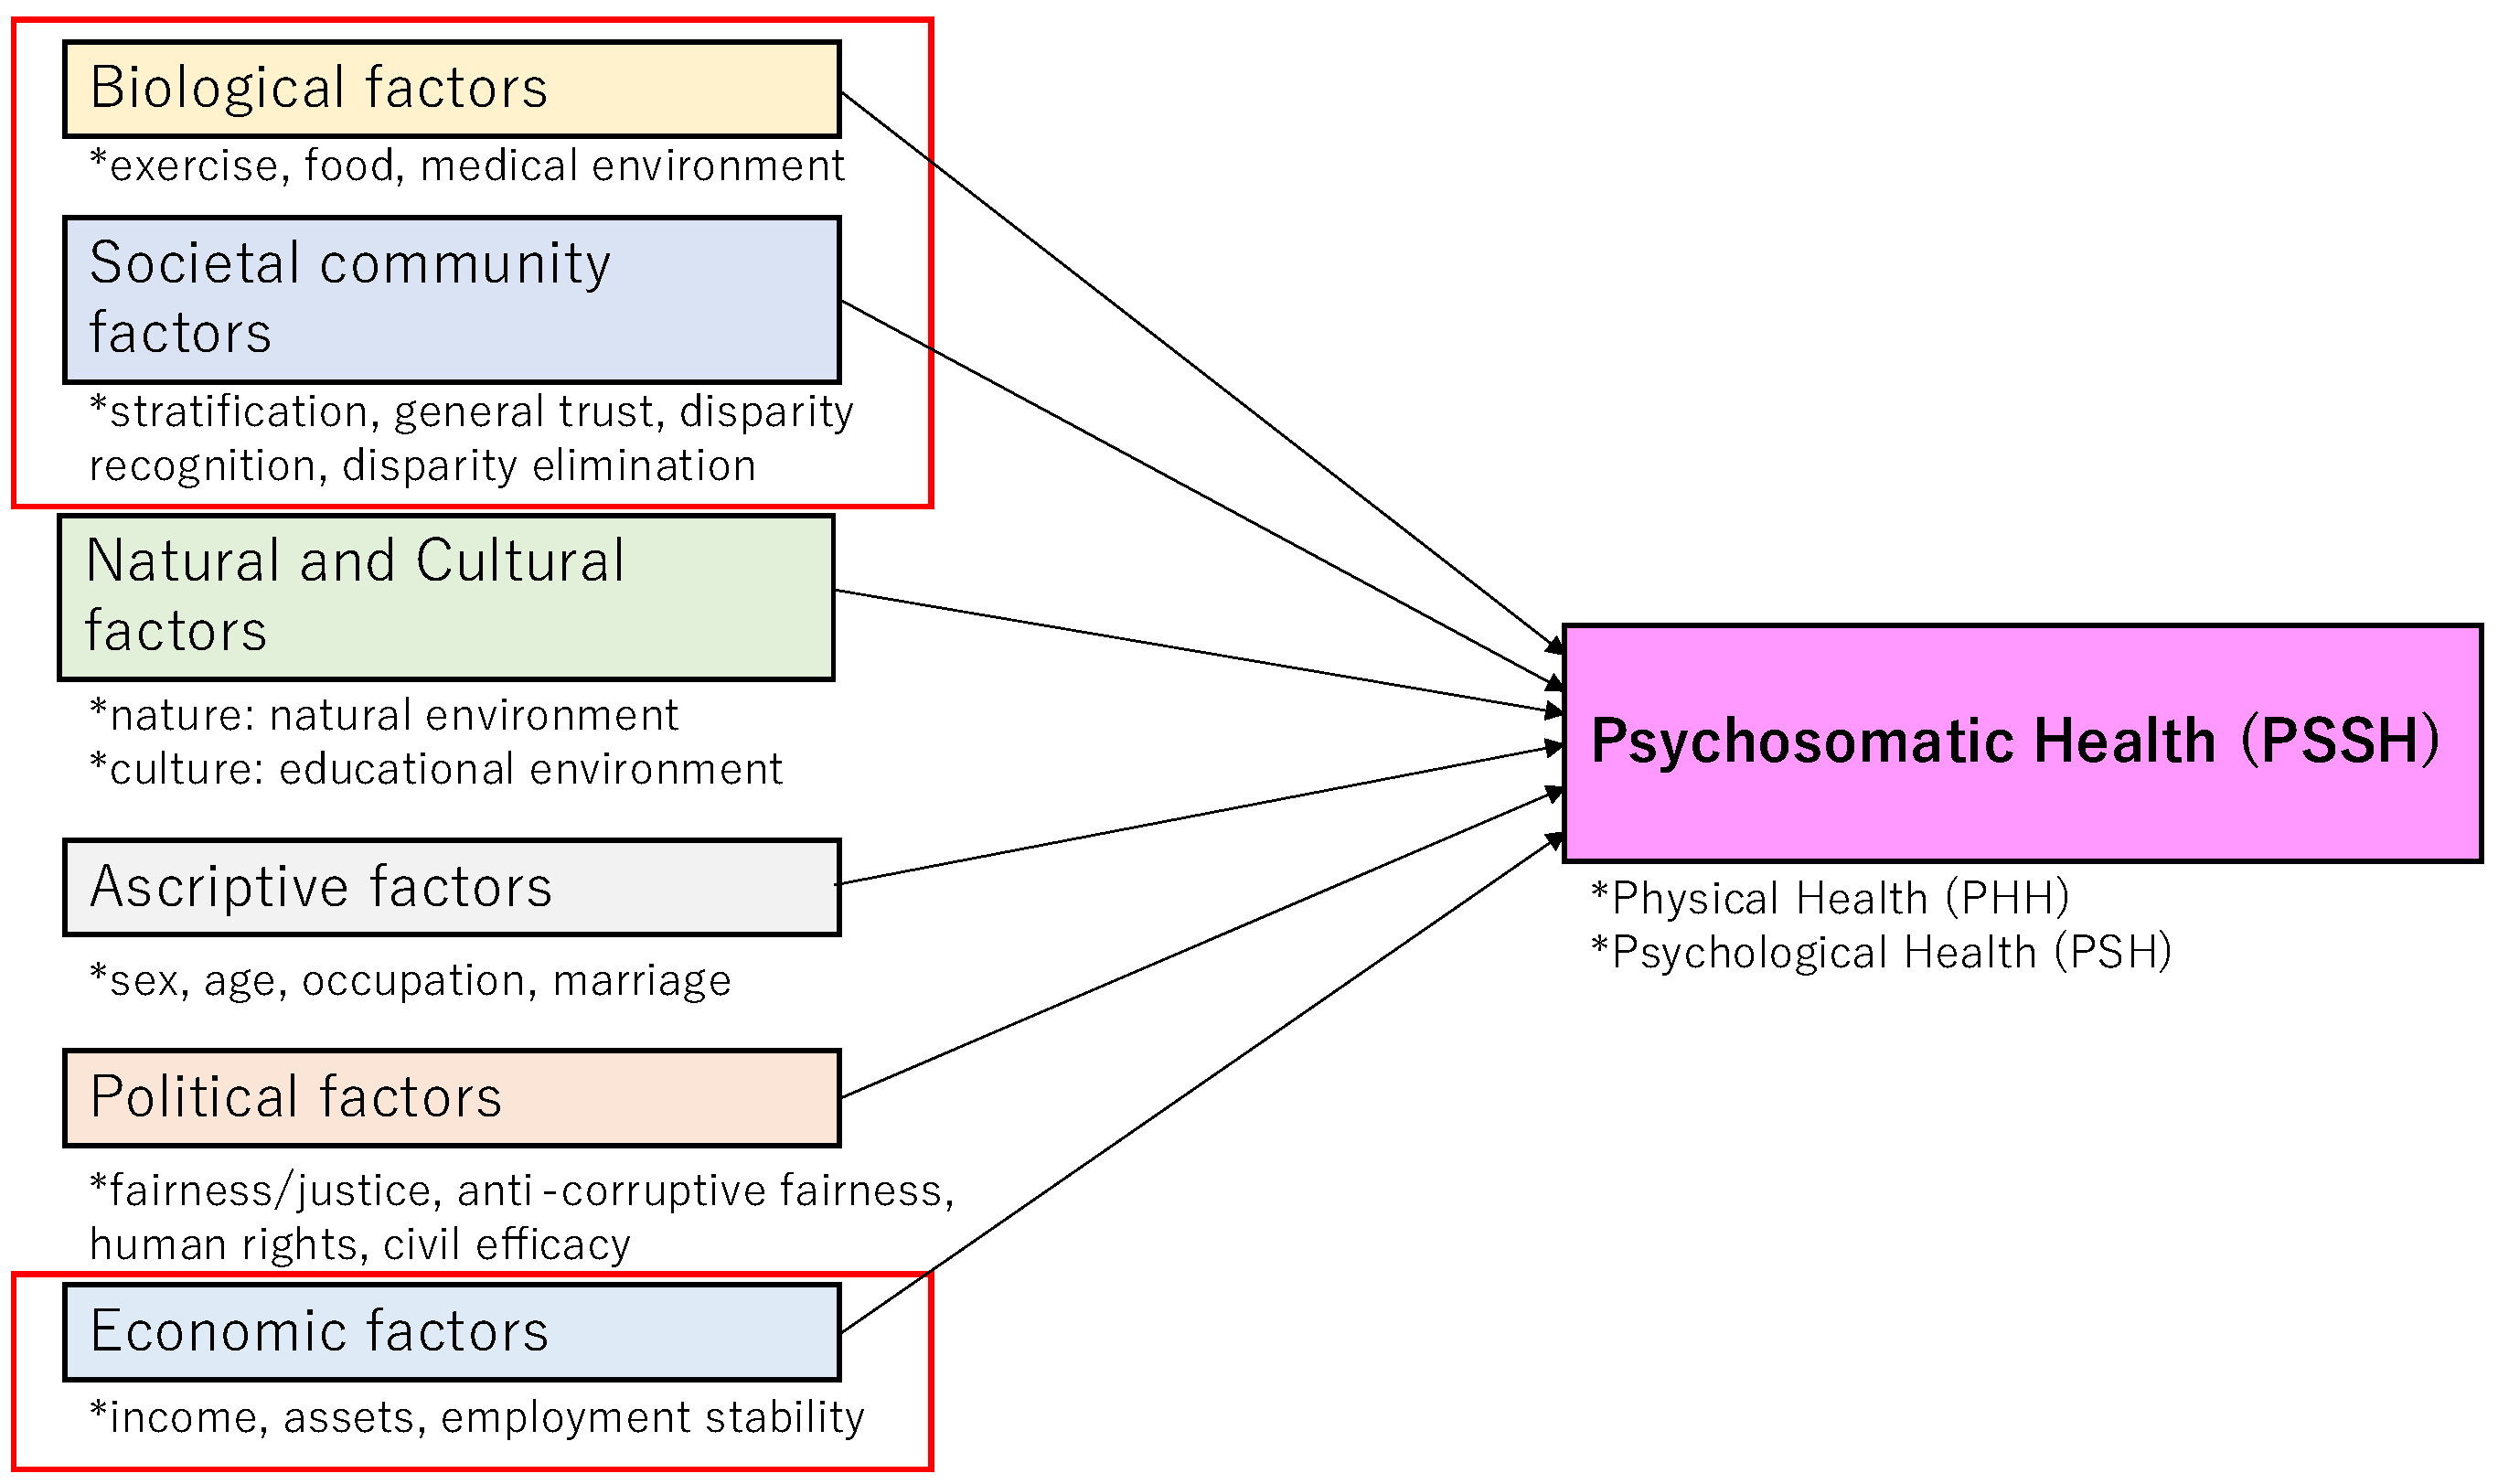
3.2. Factors of Psychosomatic Inequality: Correlations with Psychosomatic Inequalities
- Ascriptive factors: gender, age, occupation, and marriage.
- 2.
- Biological factors: exercise (adequate exercise habits), eating (healthy eating habits), and medical environment.
- 3.
- Natural and cultural factors: natural environment, educational environment (around oneself and children near them).
- 4.
- Economic factors: income, assets, and employment stability.
- 5.
- Societal community factors: stratification satisfaction (satisfaction with social status and stratification, abridged as stratification in the following), general trust (trust in people in general), disparity recognition (in society), disparity elimination (eliminating disparity and achieving an equal society through social welfare, redistribution through taxes, and so forth).
- 6.
- Political factors: fairness/justice (in Japanese politics in terms of decision-making, the disparity between the rich and the poor, and so forth), anti-corruptive fairness (the country’s government is fair and not corrupt), human rights, and civil efficacy (possibility or wish to change the society and politics towards desirable directions by one’s own engagement).
3.3. Multiple Regression Analyses
3.4. Examination of Psychosomatic Health
3.4.1. Liaison Between Psychological and Physical Health
3.4.2. Relative Importance of Psychological/Physical Well-Being for Overall Wellbeing
3.5. Psychosomatic Dynamics Under COVID-19: Pivotal Factors of Fairness and Justice in the COVID-19 Crisis
4. Discussion on Multi-Dimensional Psychosomatic Health Disparities
4.1. Multi-Dimensional Inequalities/Disparities and Fairness/Justice in Their Dynamics
4.2. Philosophical Implications: Multi-Dimensional, Multi-Layered, and Ethical Fairness and Justice Against Psychosomatic Health Disparity
4.3. Multi-Dimensional Communitarian Interventions: Social-Community, Political, Economic Measures, and Public Deliberation
5. Limits of This Study
6. Conclusions: Multi-Dimensional Determinants and Interventions for Psychosomatic Health Equity
6.1. Summary of Key Findings and Correspondence to Study Objectives
6.2. Normative Implications of the Communitarian Intervention for Health Equity
Author Contributions
Funding
Institutional Review Board Statement
Informed Consent Statement
Data Availability Statement
Acknowledgments
Conflicts of Interest
Glossary
| Ethico-Political Determinants | ethical and political factors, such as justice and fairness, that influence the distribution of health or well-being |
| Health Disparity | systematic differences in health outcomes across social, economic, or political circumstances, often reflecting unfair and avoidable inequalities |
| Psychosomatic health/well-being | the integrated state of mental and physical well-being, emphasizing their interdependence to denote close mind-body alignment |
| WB | well-being |
| SWLS | Satisfaction With Life Scale |
| PERMA | Positive Emotion, Engagement, Relationships, Meaning, and Accomplishment |
| I COPPE | Interpersonal, Community, Occupational, Physical, Psychological, and Economic well-being |
| I CCOPPPE | I COPPE and Cultural and Political Well-being |
| PHH | Physical Health |
| PSH | Psychological Health |
| PSSH | Psychosomatic Health |
Appendix A. Questions in the Three Surveys
Appendix A.1. Factors in Survey 1, Survey 2, and Survey 3
| Category | Factor | Survey 1 | Survey 2 | Survey 3 | Answer |
| Ascriptive factors | gender | Please let us know your gender. | Please let us know your gender. | Please let us know your gender. | 1 (Men), 2 (Women) |
| age | Please let us know your age. | Please let us know your age. | Please let us know your age. | ||
| occupation | Please let us know your occupation. | Please let us know your occupation. | Please let us know your occupation. | See Appendix B, “Occupation” | |
| marriage | Are you married? | Are you married? | Are you married? | See Appendix B, “Marital status” | |
| Biological factors | exercise/eating | Do you think you are doing healthy exercise and eating? | 1 = not at all, 10 = very much | ||
| exercise | Do you consider your exercise habits to be adequate? | ||||
| eating | Do you consider yourself to eat healthily? | ||||
| medical environment | Do you think the medical environment in your neighborhood, such as hospitals and pharmacies, is well-developed? | Do you think the medical environment in your neighborhood, such as hospitals and pharmacies, is well-developed? | |||
| Natural and Cultural factors | natural environment | How rich and blessed do you feel about the natural environment surrounding you? | Do you think the natural environment surrounding you is good? | Do you think the natural environment surrounding you is good? | 1 = not at all, 10 = very much |
| educational environment | How well do you feel about your own educational or lifelong learning environment and the learning environment of the children around you? | Do you think your own educational or lifelong learning and the learning environment of children around you are fulfilling? | Do you think your own educational or lifelong learning and the learning environment of children around you are fulfilling? | ||
| Economic factors | income | Do you think your income is sufficient for you to make a living now that COVID-19 has struck? | Do you think your income is sufficient to live your life? | Do you think your income is sufficient to live your life? | 1 = not at all, 10 = very much |
| assets | Do you think you have sufficient assets (financial, house, land, car, etc.) to live your life now that COVID-19 has occurred? | Do you consider your assets (financial, house, land, car, etc.) sufficient for your life? | Do you consider your assets (financial, house, land, car, etc.) sufficient for your life? | ||
| employment stability | Now that COVID-19 has occurred, do you consider your employment to be stable? | Do you feel that your employment is stable? | Do you feel that your employment is stable? | ||
| Societal community factors | stratification satisfaction | I think I am satisfied with my social status and stratification. | Are you satisfied with your social status and stratification? | Are you satisfied with your social status and stratification? | 1 = not at all, 10 = very much |
| general trust | Do you find people generally trustworthy? | Do you find people generally trustworthy? | Do you find people generally trustworthy? | ||
| disparity recognition | How much disparity do you think exists in the society around you? | Do you think that there is a disparity in the society around you? | Do you think that there is a disparity in the society around you? | ||
| disparity elimination | Do you think that the society around you realizes the elimination of disparities (equal society) through social welfare and redistribution through taxes? | Do you think that the society around you realizes the elimination of disparity (equal society) through social welfare and redistribution through taxes? | Do you think that the society around you realizes the elimination of disparity (equal society) through social welfare and redistribution through taxes? | ||
| Political factors | fairness/justice | I believe that fairness and justice are achieved in our country’s politics in decision-making, the disparity between the rich and poor, and so on. | Do you think Japanese politics achieves fairness and justice in decision-making, the disparity between the rich and poor, and so on? | Do you think Japanese politics achieves fairness and justice in decision-making, the disparity between the rich and poor, and so on? | 1 = not at all, 10 = very much |
| Anti-corruptive fairness | I think that my government is corruption-free and fair. | Do you think that the Japanese government is corruption-free and fair? | Do you think that the Japanese government is corruption-free and fair? | ||
| human rights | I believe that fundamental human rights are respected in my country. | Do you think that fundamental human rights are respected in Japan? | Do you think that fundamental human rights are respected in Japan? | ||
| civil efficacy | How much do you think you can change the society and politics around you in a desirable direction through your involvement? | Do you want to change the society and politics around you in a desirable direction through your involvement? | Do you want to change the society and politics around you in a desirable direction through your involvement? |
| Category | Factor | Survey 2 | Survey 3 | Answer |
| Fair society | fair society | All things considered, I think our current society is fair. | All things considered, I think our current society is fair. | 1 = not at all, 10 = completely |
| Just society | just society | All things considered, I think our current society is just. | All things considered, I think our current society is just. | |
| Fair/Just Society * | 1 | All things considered, I think our current society is fair. | ||
| 2 | All things considered, I think our current society is unfair. | |||
| 3 | All things considered, I think our current society is just. | |||
| 4 | All things considered, I think our current society is unjust. | |||
| Distributive Justice ** | disparity of justice | Do you think the disparity in Japan is in the right/just state? | ||
| welfare justice | Do you think that welfare is rightly/justly correcting the disparity in current society? | |||
| Contribution Optimism | contribution | Do you want to contribute to society? | Do you usually seek to contribute to others or the world around you in your activities? | 1 = not at all, 10 = completely |
| optimism | How optimistic would you say you are about your future? | I am optimistic about my future. | ||
| Source: Made by the authors. Notes: * The Fair Society/Just Society score is calculated as the “sum of the scores for the items 1, 2, 3, and 4” divided by 4. The score for item 2 and item 4 is calculated by subtracting 11 from the original figure. ** As for Distributive Justice, the score is calculated by “the sum of the scores for the disparity of justice, welfare justice, and disparity elimination” divided by 3. | ||||
Appendix A.2. Changes
| Item | Survey 1 |
| Mental change | Mental changes, such as anxiety and restlessness. |
| Physical Change | Physical Change, such as condition and health situation. |
Appendix A.3. PERMA Profiler, SWLS, I COPPE, and Revised HEMA—R SWLS
| Question | Answer in this Survey | Original Answer | |
| 1 | In most ways, my life is close to my ideal. | 1 = Strongly disagree, 10 = Strongly agree | 1 = Strongly disagree, 2 = Disagree, 3 = Slightly disagree, 4 = Neither agree nor disagree, 5 = Slightly agree, 6 = Agree, 7 = Strongly agree |
| 2 | The conditions of my life are excellent. | ||
| 3 | I am satisfied with my life. | ||
| 4 | So far, I have gotten the important things I want in life. | ||
| 5 | If I could live my life over, I would change almost nothing. | ||
| Notes: For details, see the site on SWLS (http://labs.psychology.illinois.edu/~ediener/SWLS.html). Accessed on 14 October 2024. | |||
| Label | Question | Answer in This Survey | Original Response Anchors | |
| Block 1 | A1 | How much of the time do you feel you are making progress toward accomplishing your goals? | 1 = not at all, 10 = completely | 0 = never, 10 = always |
| E1 | How often do you become absorbed in what you are doing? | |||
| P1 | In general, how often do you feel joyful? | |||
| N1 | In general, how often do you feel anxious? | |||
| A2 | How often do you achieve the important goals you have set for yourself? | |||
| Block 2 | H1 | In general, how would you describe your health? | 1 = not at all, 10 = completely | 0 = terrible, 10 = excellent |
| Block 3 | M1 | In general, to what extent do you lead a purposeful and meaningful life? | 1 = not at all, 10 = completely | 0 = not at all, 10 = completely |
| R1 | To what extent do you receive help and support from others when you need it? | |||
| M2 | In general, to what extent do you feel that what you do in your life is valuable and worthwhile? | |||
| E2 | In general, to what extent do you feel excited and interested in things? | |||
| Lon | How lonely do you feel in your daily life? | |||
| Block 4 | H2 | How satisfied are you with your current physical health? | 1 = not at all, 10 = completely | 0 = not at all, 10 = completely |
| Block 5 | P2 | In general, how often do you feel positive? | 1 = not at all, 10 = completely | 0 = never, 10 = always |
| N2 | In general, how often do you feel angry? | |||
| A3 | How often are you able to handle your responsibilities? | |||
| N3 | In general, how often do you feel sad? | |||
| E3 | How often do you lose track of time while doing something you enjoy? | |||
| Block 6 | H3 | Compared to others of the same age and sex, how is your health? | 1 = not at all, 10 = completely | 0 = terrible, 10 = excellent |
| Block 7 | R2 | To what extent do you feel loved? | 1 = not at all, 10 = completely | 0 = not at all, 10 = completely |
| M3 | To what extent do you generally feel you have a sense of direction in your life? | |||
| R3 | How satisfied are you with your personal relationships? | |||
| P3 | In general, to what extent do you feel contented? | |||
| Block 8 | hap | Taking all things together, how happy would you say you are? | 1 = not at all, 10 = completely | 0 = not at all, 10 = completely |
| Notes: For details, see [13]. P = Positive emotions, E = Engagement, R = Relationships, M = Meaning, A = Accomplishment, H = Health, N = Negative emotions, Lon = Lonely, hap = happiness. | ||||
| Label | Question | Answer in This Survey | Original Answer |
| OV_WB_PR | When it comes to the best possible life for you, on which number do you stand now? | 1 = the worst your life can be 10 = the best your life can be | 0 = the worst your life can be 10 = the best your life can be |
| OV_WB_PA | When it comes to the best possible life for you, on which number did you stand five years ago? | ||
| OV_WB_FU | When it comes to the best possible life for you, on which number do you think you will stand five years from now? | ||
| IN_WB_PR | When it comes to relationships with important people in your life, which number do you stand on now? | 1 = the worst your life can be 10 = the best your life can be | 0 = the worst your life can be 10 = the best your life can be |
| IN_WB_FU | When it comes to relationships with important people in your life, on which number do you think you will stand five years from now? | ||
| CO_WB_PR | When it comes to the community where you live, on which number do you stand now? | 1 = the worst your life can be 10 = the best your life can be | 0 = the worst your life can be 10 = the best your life can be |
| CO_WB_FU | When it comes to the community where you live, on which number do you think you will stand five years from now? | ||
| OC_WB_PR | When it comes to your main occupation (employed, self-employed, volunteer, stay-at-home), which number do you stand on now? | 1 = the worst your life can be 10 = the best your life can be | 0 = the worst your life can be 10 = the best your life can be |
| OC_WB_FU | When it comes to your main occupation (employed, self-employed, volunteer, stay at home), on which number do you think you will stand five years from now? | ||
| PH_WB_PR | When it comes to your physical health, which number do you stand on now? | 1 = the worst your life can be 10 = the best your life can be | 0 = the worst your life can be 10 = the best your life can be |
| PH_WB_FU | When it comes to your physical health, which number do you think you will stand on five years from now? | ||
| PS_WB_PR | When it comes to your emotional and psychological well-being, which number do you stand on now? | 1 = the worst your life can be 10 = the best your life can be | 0 = the worst your life can be 10 = the best your life can be |
| PS_WB_FU | When it comes to your emotional and psychological well-being, which number do you think you will stand on five years from now? | ||
| EC_WB_PR | When it comes to your economic situation, which number do you stand on now? | 1 = the worst your life can be 10 = the best your life can be | 0 = the worst your life can be 10 = the best your life can be |
| EC_WB_FU | When it comes to your economic situation, which number do you think you will stand on five years from now? | ||
| PO_WB_PA | When it comes to your political situation, which number do you stand on now? | 1 = the worst your life can be 10 = the best your life can be | |
| PO_WB_FU | When it comes to your political situation, which number do you think you will stand five years from now? | ||
| CU_WB_PA | When it comes to your cultural situation, which number do you stand on now? | 1 = the worst your life can be 10 = the best your life can be | |
| CU_WB_FU | When it comes to your cultural situation, which number do you think you will stand on five years from now? | ||
| Notes: For details, see [14]. OV_WB = Overall Well-Being, IN_WB = Interpersonal Well-Being, CO_WB = Community Well-Being, OC_WB = Occupational Well-Being, PH_WB = Physical Well-Being, PS_WB = Psychological Well-Being, EC_WB = Economic Well-Being. PO_WB = Political Well-Being, CU_WB = Cultural Well-Being. PR = Present, PA = Past, FU = Future. The original I COPPE in Survey 1 includes the former seven items; the I CCOPPPE in Survey 2 and Survey 3 adds the latter two. | |||
| Question | Answer in This Survey | Original Answer | |
| 1 | Seeking relaxation? | 1 = not at all, 10 = very much | 1 = not at all, 7 = very much |
| 2 | Seeking to develop a skill, learn, or gain insight into something? | ||
| 3 | Seeking to do what you believe in? | ||
| 4 | Seeking pleasure? | ||
| 5 | Seeking to pursue excellence or a personal ideal? | ||
| 6 | Seeking enjoyment? | ||
| 7 | Seeking to take it easy? | ||
| 8 | Seeking to use the best in yourself? | ||
| 9 | Seeking fun? | ||
| 10 | Seeking to contribute to others or the surrounding world? | ||
| Notes: For details, see [24]. In this survey, the response scale of 1 (not at all) to 10 (very much) is adopted. | |||
Appendix B. Respondents of the Three Surveys (After Data Screening)
| Survey 1 (%) | Survey 2 (%) | Survey 3 (%) | |
| Number of respondents | 4698 | 6855 | 2472 |
| Number of survey questions | 383 | 401 | 174 |
| Residence | |||
| 10 prefectures with big cities | 2783 (59.2) | 1520 (22.2) | 1102 (45.6) |
| 37 prefectures without big cities | 1915 (40.8) | 5335 (77.8) | 1370 (55.4) |
| Gender | |||
| Men | 2283 (48.6) | 4404 (64.2) | 1626 (65.8) |
| Women | 2415 (51.4) | 2451 (35.8) | 846 (34.2) |
| Age | |||
| 10s | 790 (16.8) * | 36 (0.5) * | 7 (0.3) * |
| 20s | 759 (16.2) | 460 (6.7) | 125 (5.1) |
| 30s | 785 (16.7) | 1038 (15.1) | 346 (14.0) |
| 40s | 783 (16.7) | 1726 (25.2) | 610 (24.7) |
| 50s | 777 (16.5) | 1740 (25.4) | 626 (25.3) |
| 60s | 804 (17.1) | 1236 (18.0) | 480 (19.4) |
| 70s and older | 619 (9.0) | 278 (11.2) | |
| Marital status | |||
| married | 2172 (46.2) | 4074 (59.4) | 1418 (57.4) |
| unmarried | 2301 (49.0) | 2242 (32.7) | 846 (34.2) |
| separation | 225 (4.8) | 539 (7.9) ** | 208 (8.4) ** |
| Occupation | |||
| executive of a company or association | 44 (0.9) | 123 (1.8) | 53 (2.1) |
| office worker, staff of an association | 1386 (29.5) | 2085 (30.4) | 734 (29.7) |
| part-time employee, contract employee, dispatched labor | 206 (4.4) | 1196 (17.4) | 433 (17.5) |
| part-time worker, part-time job, home-based workers without an employment contract | 585 (12.5) | 17 (0.2) | 7 (0.3) |
| civil servants | 140 (3.0) | 253 (3.7) | 68 (2.8) |
| self-employed, family employee, freelance | 286 (6.1) | 818 (11.9) | 294 (11.9) |
| faculty member | 123 (1.8) | 39 (1.6) | |
| student | 795 (16.9) | 95 (1.4) | 26 (1.1) |
| homemaker | 700 (14.9) | 766 (11.2) | 292 (11.8) |
| pensioner | 147 (3.1) | 603 (8.8) | 267 (10.8) |
| none | 365 (7.8) | 690 (10.1) | 240 (9.7) |
| others | 44 (0.9) | 86 (1.3) | 19 (0.8) |
| Education | |||
| currently attending high school | 351 (7.5) | 43 (0.6) | 7 (0.3) |
| currently attending vocational college, specialized training college | 75 (1.6) | 84 (1.2) | 26 (1.1) |
| currently attending junior college, college | 48 (1.0) | 47 (0.7) | 8 (0.3) |
| university/college preparatory school | 14 (0.3) | 4 (0.1) | |
| currently attending university | 366 (7.8) | 88 (1.3) | 35 (1.4) |
| currently attending a Master’s or Doctoral course | 22 (0.5) | 19 (0.3) | 3 (0.1) |
| junior high school | 70 (1.5) | 175 (2.6) | 50 (2.0) |
| high school | 997 (21.2) | 2153 (31.4) | 664 (26.9) |
| vocational college, specialized training college | 370 (7.9) | 638 (9.3) | 240 (9.7) |
| junior college, college | 404 (8.6) | 598 (8.7) | 217 (8.8) |
| university | 1778 (37.8) | 2657 (38.8) | 1081 (43.7) |
| more than a Master’s degree | 203 (4.3) | 349 (5.1) | 141 (5.7) |
| Notes: * In Survey 1, the 10s were 16, 17, 18, and 19 years old, while in Surveys 2 and 3, the 10s were 18 and 19 years old. Details of Survey 1 are as follows: 313 16- and 17-year-olds (6.7%) and 477 18- and 19-years old (10.2%). ** divorce 418 (6.1)/death 121 (1.8). ** divorce 161 (6.5)/death 47 (1.9). | |||
Appendix C. Descriptive Statistics on Key Well-Being Indicators in Surveys 1 to 3
Appendix C.1. Descriptive Statistics on the Main WB and Health Indicators in Survey 1
| Descriptive Statistics | ||||
| Average | Standard Deviation | Skewness | Kurtosis | |
| PERMA | 5.648 | 1.591 | −0.185 | 0.120 |
| general WB | 5.654 | 1.602 | −0.190 | 0.102 |
| IOv | 5.647 | 1.891 | −0.302 | −0.191 |
| SWLS | 25.070 | 9.984 | −0.145 | −0.463 |
| EUD | 5.889 | 1.511 | −0.082 | 0.483 |
| HED | 6.598 | 1.491 | −0.006 | 0.227 |
| PSH | 5.653 | 1.643 | −0.263 | 0.136 |
| PHH | 5.651 | 1.788 | −0.236 | −0.023 |
| PSSH | 5.652 | 1.632 | −0.244 | 0.119 |
| Notes: For all items, frequencies were 4698, and none were excluded. The minimum value was 1.000, and the maximum value was 10.000, except for SWLS, which had a minimum value of 5.000 and a maximum value of 50.000. | ||||
Appendix C.2. Descriptive Statistics on the Main WB and Health Indicators in Survey 2
| Descriptive Statistics | ||||
| Average | Standard Deviation | Skewness | Kurtosis | |
| PERMA | 5.618 | 1.600 | −0.204 | 0.584 |
| general WB | 5.630 | 1.610 | −0.217 | 0.556 |
| IOv | 5.540 | 1.912 | −0.266 | 0.003 |
| SWLS | 24.290 | 9.729 | −0.196 | −0.202 |
| EUD | 5.626 | 1.579 | −0.244 | 1.075 |
| HED | 5.845 | 1.587 | −0.251 | 1.094 |
| PSH | 5.600 | 1.647 | −0.231 | 0.344 |
| PHH | 5.547 | 1.854 | −0.185 | 0.025 |
| PSSH | 5.573 | 1.654 | −0.189 | 0.305 |
| Notes: For all items, the frequencies were 6855, and none were excluded. With the exception of SWLS, the minimum value was 1.000, and the maximum value was 10.000; the minimum value for SWLS was 5.000, and the maximum value was 50.000. | ||||
Appendix C.3. Descriptive Statistics on the Main WB and Health Indicators in Survey 3
| Descriptive Statistics | ||||
| Average | Standard Deviation | Skewness | Kurtosis | |
| PERMA | 5.385 | 1.718 | −0.168 | −0.082 |
| general WB | 5.390 | 1.732 | −0.176 | −0.116 |
| IOv | 5.247 | 2.059 | −0.188 | −0.593 |
| SWLS | 23.350 | 10.665 | 0.011 | −0.716 |
| EUD | 5.365 | 1.670 | −0.226 | 0.494 |
| HED | 5.656 | 1.676 | −0.289 | 0.635 |
| PSH | 5.386 | 1.782 | −0.199 | −0.238 |
| PHH | 5.313 | 1.871 | −0.118 | −0.235 |
| PSSH | 5.350 | 1.740 | −0.129 | −0.176 |
| Notes: For all items, the number of frequencies was 6855, and none were excluded. With the exception of SWLS, the minimum value was 1.000, and the maximum value was 10.000; the minimum value for SWLS was 5.000, and the maximum value was 50.000. | ||||
Appendix D. Comparison of WB in the Three Surveys (General WB Index)
Appendix E. Correlations Between Psychological Health (PSH)/Physical Health (PHH)/Psycho Somatic Health (PSSH) and Factors (Survey 1, 2, 3)
| PSH | PHH | PSSH | Mental Change | Physical Change | ||||||||
| Survey 1 (N = 4698) | Survey 2 (N = 6855) | Survey 3 (N = 2472) | Survey 1 (N = 4698) | Survey 2 (N = 6855) | Survey 3 (N = 2472) | Survey 1 (N = 4698) | Survey 2 (N = 6855) | Survey 3 (N = 2472) | Survey 1 (N = 4698) | Survey 1 (N = 4698) | ||
| Ascriptive factors (4) | Gender | 0.053 ** | 0.006 | 0.007 | 0.021 | 0.023 † | 0.039 * | 0.038 ** | 0.016 | 0.024 | 0.059 ** | 0.026 † |
| [19] | [18] | [17] | [19] | [16] | [19] | |||||||
| Age | 0.033 * | 0.124 ** | 0.175 ** | −0.062 ** | 0.005 | 0.064 ** | −0.018 | 0.065 ** | 0.124 ** | 0.048 ** | 0.099 ** | |
| [20] | [18] | [14] | [19] | [16] | [18] | [16] | [19] | [10] | ||||
| Occupation | 0.239 ** | 0.194 ** | 0.153 ** | 0.213 ** | 0.169 ** | 0.163 ** | 0.237 ** | 0.191 ** | 0.166 ** | −0.050 ** | −0.059 ** | |
| [16] | [17] | [15] | [16] | [15] | [14] | [16] | [17] | [14] | [18] | [17] | ||
| Marriage | 0.161 ** | 0.231 ** | 0.257 ** | 0.081 ** | 0.160 ** | 0.189 ** | 0.125 ** | 0.205 ** | 0.233 ** | −0.005 | 0.000 | |
| [17] | [16] | [13] | [17] | [17] | [13] | [17] | [16] | [13] | ||||
| Biological factors (3/2) | Exercise/Eating | (0.466 **) | 0.705 ** | (0.458 **) | 0.663 ** | (0.485 **) | 0.723 ** | (−0.115 **) | (−0.126 **) | |||
| [1] | [1] | [1] | ||||||||||
| Exercise | 0.375 ** | 0.392 ** | 0.403 ** | −0.135 ** | −0.123 ** | |||||||
| [13] | [12] | [13] | [3] | [6] | ||||||||
| Eating | 0.556 ** | 0.524 ** | 0.566 ** | −0.096 ** | −0.129 ** | |||||||
| [4] | [2] | [2] | [11] | [2] | ||||||||
| Medical environment | 0.480 ** | 0.565 ** | 0.427 ** | 0.451 ** | 0.475 ** | 0.534 ** | −0.075 ** | −0.087 ** | ||||
| [10] | [8] | [9] | [10] | [9] | [9] | [13] | [12] | |||||
| Natural and Cultural factors (2) | Natural environment | 0.536 ** | 0.610 ** | 0.579 ** | 0.443 ** | 0.512 ** | 0.481 ** | 0.512 ** | 0.591 ** | 0.555 ** | −0.061 ** | −0.076 ** |
| [8] | [5] | [5] | [8] | [4] | [6] | [8] | [5] | [6] | [15] | [14] | ||
| Educational environment | 0.549 ** | 0.684 ** | 0.629 ** | 0.472 ** | 0.555 ** | 0.540 ** | 0.535 ** | 0.652 ** | 0.612 ** | −0.112 ** | −0.097 ** | |
| [5] | [2] | [2] | [5] | [2] | [1] | [5] | [2] | [2] | [9] | [11] | ||
| Economic factors (3) | Income | 0.539 ** | 0.591 ** | 0.577 ** | 0.472 ** | 0.494 ** | 0.487 ** | 0.530 ** | 0.572 ** | 0.557 ** | −0.128 ** | −0.129 ** |
| [7] | [7] | [6] | [5] | [7] | [5] | [7] | [7] | [5] | [6] | [2] | ||
| Assets | 0.541 ** | 0.598 ** | 0.599 ** | 0.478 ** | 0.511 ** | 0.518 ** | 0.534 ** | 0.584 ** | 0.585 ** | −0.135 ** | −0.128 ** | |
| [6] | [6] | [4] | [3] | [5] | [3] | [6] | [6] | [3] | [3] | [5] | ||
| Employment stability | 0.462 ** | 0.553 ** | 0.538 ** | 0.399 ** | 0.469 ** | 0.465 ** | 0.451 ** | 0.538 ** | 0.525 ** | −0.126 ** | −0.133 ** | |
| [11] | [9] | [7] | [11] | [8] | [7] | [11] | [8] | [7] | [7] | [1] | ||
| Societal community factors (4) | Stratification satisfaction | 0.692 ** | 0.638 ** | 0.647 ** | 0.580 ** | 0.525 ** | 0.529 ** | 0.666 ** | 0.612 ** | 0.616 ** | −0.151 ** | −0.120 ** |
| [1] | [4] | [1] | [1] | [3] | [2] | [1] | [3] | [1] | [1] | [7] | ||
| General trust | 0.564 ** | 0.640 ** | 0.602 ** | 0.464 ** | 0.506 ** | 0.495 ** | 0.538 ** | 0.602 ** | 0.574 ** | −0.103 ** | −0.116 ** | |
| [2] | [3] | [3] | [7] | [6] | [4] | [4] | [4] | [4] | [10] | [8] | ||
| Disparity recognition | 0.086 ** | 0.239 ** | 0.143 ** | 0.066 ** | 0.166 ** | 0.116 ** | 0.080 ** | 0.212 ** | 0.136 ** | 0.053 ** | 0.045 ** | |
| [18] | [15] | [16] | [18] | [16] | [15] | [18] | [15] | [15] | [17] | [18] | ||
| Disparity elimination | 0.310 ** | 0.429 ** | 0.440 ** | 0.275 ** | 0.380 ** | 0.400 ** | 0.307 ** | 0.427 ** | 0.441 ** | −0.095 ** | −0.065 ** | |
| [15] | [12] | [10] | [15] | [12] | [10] | [15] | [12] | [10] | [12] | [16] | ||
| Political factors (4) | Fairness/Justice | 0.419 ** | 0.365 ** | 0.407 ** | 0.380 ** | 0.330 ** | 0.367 ** | 0.419 ** | 0.367 ** | 0.406 ** | −0.134 ** | −0.129 ** |
| [12] | [13] | [11] | [13] | [13] | [11] | [12] | [13] | [11] | [5] | [2] | ||
| Anti-corruptive fairness | 0.338 ** | 0.314 ** | 0.346 ** | 0.315 ** | 0.296 ** | 0.330 ** | 0.343 ** | 0.322 ** | 0.355 ** | −0.141 ** | −0.115 ** | |
| [14] | [14] | [12] | [14] | [14] | [12] | [14] | [14] | [12] | [2] | [9] | ||
| Human rights | 0.560 ** | 0.483 ** | 0.502 ** | 0.473 ** | 0.417 ** | 0.422 ** | 0.541 ** | 0.475 ** | 0.484 ** | −0.074 ** | −0.070 ** | |
| [3] | [11] | [8] | [4] | [11] | [8] | [3] | [11] | [8] | [14] | [15] | ||
| Civil efficiency | 0.493 ** | 0.551 ** | 0.481 ** | 0.413 ** | 0.458 ** | 0.401 ** | 0.475 ** | 0.531 ** | 0.462 ** | −0.122 ** | −0.082 ** | |
| [9] | [10] | [9] | [10] | [9] | [9] | [10] | [10] | [9] | [8] | [13] | ||
| PSH | 1.000 | 1.000 | 1.000 | 0.809 ** | 0.784 ** | 0.816 ** | 0.947 ** | 0.937 ** | 0.950 ** | −0.157 ** | −0.145 ** | |
| PHH | 0.809 ** | 0.784 ** | 0.816 ** | 1.000 | 1.000 | 1.000 | 0.955 ** | 0.951 ** | 0.955 ** | −0.154 ** | −0.189 ** | |
| PSSH | 0.947 ** | 0.937 ** | 0.950 ** | 0.955 ** | 0.951 ** | 0.955 ** | 1.000 | 1.000 | 1.000 | −0.164 ** | −0.177 ** | |
| Mental change | −0.157 ** | −0.154 ** | −0.164 ** | 1.000 | 0.457 ** | |||||||
| Physical change | −0.145 ** | −0.189 ** | −0.177 ** | 0.457 ** | 1.000 | |||||||
| Fair society | 0.428 ** | 0.463 ** | 0.384 ** | 0.404 ** | 0.428 ** | 0.455 ** | ||||||
| Just society | 0.426 ** | 0.481 ** | 0.370 ** | 0.421 ** | 0.419 ** | 0.472 ** | ||||||
| Fair/Just society | 0.243 ** | 0.221 ** | 0.245 ** | |||||||||
| Distributive justice | 0.472 ** | 0.420 ** | 0.471 ** | |||||||||
| Contribution | 0.505 ** | 0.588 ** | 0.576 ** | 0.419 ** | 0.452 ** | 0.476 ** | 0.484 ** | 0.546 ** | 0.551 ** | −0.046 * | −0.073 ** | |
| Optimism | 0.624 ** | 0.752 ** | 0.716 ** | 0.514 ** | 0.611 ** | 0.605 ** | 0.595 ** | 0.718 ** | 0.692 ** | −0.145 ** | −0.132 ** | |
| Notes: **: p < 0.01, *: p < 0.05, †: p < 0.1. Gender (man = 0, woman = 1). The figure for age is the actual age (non-logarithm). Occupation: no job = 0, otherwise = 1. Marital status: unmarried, divorced, or bereaved = 0, married = 1. The figures in parentheses concerning exercise/eating are based on the calculated values of Pearson correlation coefficients. The figure in brackets indicates the order (from the highest) of the magnitude concerning the estimated coefficient for each variable. The italicized figures in parentheses indicate the number of variables in each category; for biological factors, refer to the information below. The blank space indicates that the relevant variable is not asked in Survey 1, 2, or 3. “Exercise” and “Eating” are separately asked in Survey 1, while an integrated item, “Exercise/Eating,” is asked in Survey 2. | ||||||||||||
Appendix F. Multiple Regression Analysis: Sum of Standardized Partial Regression Coefficients of the Basic Factors in Each Category
| PSH | PHH | PSSH | Mental Change | Physical Change | ||||
| Survey1 | Survey2 | Survey1 | Survey2 | Survey1 | Survey2 | Survey1 | ||
| Ascriptive factors | 0.149 (11.4%) | 0.081 (6.8%) | 0.191 (15.9%) | 0.123 (12.0%) | 0.162 (12.4%) | 0.122 (10.2%) | 0.072 (19.5%) | 0.153 (34.9%) |
| [5] 4 | [5] 3 | [3] 3 | [4] 2 | [5] 3 | [4] 4 | [2] 2 | [1] 2 | |
| Biological factors | 0.233 (17.8%) | 0.402 (33.8%) | 0.348 (29.0%) | 0.468 (45.5%) | 0.312 (23.9%) | 0.458 (38.4%) | 0.060 (16.3%) | 0.090 (20.5%) |
| [2] 2 | [1] 2 | [1] 3 | [1] 2 | [2] 3 | [1] 2 | [3] 1 | [2] 1 | |
| Natural and Cultural factors | 0.204 (15.5%) | 0.237 (19.9%) | 0.154 (12.8%) | 0.172 (16.7%) | 0.187 (14.4%) | 0.208 (17.4%) | ||
| [3] 2 | [3] 2 | [4] 2 | [2] 2 | [4] 2 | [3] 2 | |||
| Economic factors | 0.061 (4.6%) | 0.111 (9.3%) | 0.044 (3.7%) | 0.084 (8.2%) | 0.055 (4.2%) | 0.101 (8.5%) | 0.039 (10.6%) | 0.060 (13.7%) |
| [6] 1 | [4] 3 | [6] 1 | [5] 2 | [6] 1 | [5] 2 | [5] 1 | [4] 1 | |
| Societal community factors | 0.448 (34.1%) | 0.315 (26.5%) | 0.309 (25.8%) | 0.153 (14.9%) | 0.394 (30.2%) | 0.237 (19.9%) | 0.140 (37.9%) | 0.090 (20.5%) |
| [1] 2 | [2] 3 | [2] 2 | [3] 2 | [1] 2 | [2] 3 | [1] 2 | [2] 2 | |
| Political factors | 0.217 (16.5%) | 0.042 (3.5%) | 0.153 (12.8%) | 0.028 (2.7%) | 0.193 (14.8%) | 0.066 (5.5%) | 0.058 (15.7%) | 0.046 (10.5%) |
| [4] 2 | [6] 1 | [5] 2 | [6] 1 | [3] 2 | [6] 2 | [4] 1 | [5] 1 | |
| Notes: Total values of the partial regression coefficients (β) of all the variables within each category are listed (blank space for the value of 0). Figures in brackets indicate the order (from the highest) of the magnitude of the Pearson correlation coefficient for each variable; as for ascriptive factors, coefficients alone are listed. The italicized figures in parentheses indicate the number of variables in each category. Figures in parentheses indicate the share of the total of standardized partial correlation coefficients for all categories. Anti-corruptive fairness is not included in the calculation since the total of the category can become negative (due to the estimation results showing the reverse sign against the original theoretical conjecture). | ||||||||
Appendix G. Multiple Regression Analysis Factors (Surveys 1 and Survey 2)
Appendix G.1. Multiple Regression Analysis of the Basic Factors (Surveys 1 and 2)
| PSH | PHH | PSSH | Mental Change | Physical Change | |||||
| Survey1 | Survey2 | Survey1 | Survey2 | Survey1 | Survey2 | Survey1 | Survey1 | ||
| R | 0.815 | 0.835 | 0.708 | 0.727 | 0.795 | 0.818 | 0.203 | 0.210 | |
| R2 | 0.664 | 0.697 | 0.501 | 0.529 | 0.631 | 0.670 | 0.041 | 0.044 | |
| adjusted R2 | 0.663 | 0.696 | 0.500 | 0.528 | 0.630 | 0.669 | 0.040 | 0.042 | |
| β | β | ||||||||
| Ascriptive factors (4) | Gender | 0.031 ** | 0.022 | 0.017 * | 0.043 ** | ||||
| [13] | [14] | [5] | |||||||
| Age | −0.033 * | 0.023 ** | −0.109 ** | −0.087 ** | −0.075 ** | −0.048 ** | 0.029 * | 0.116 ** | |
| [11] | [13] | [3] | [4] | [9] | [8] | [7] | [1] | ||
| Occupation | 0.033 ** | 0.027 ** | 0.046 ** | 0.036 ** | 0.042 ** | 0.033 ** | |||
| [11] | [12] | [11] | [9] | [12] | [11] | ||||
| Marriage | 0.052 ** | 0.031 ** | 0.036 ** | 0.045 ** | 0.024 * | −0.037 * | |||
| [10] | [10] | [13] | [11] | [13] | [7] | ||||
| Biological factors (3/2) | Exercise/ Eating | 0.296 ** | — | 0.411 ** | — | 0.377 ** | |||
| — | [1] | — | [1] | — | [1] | ||||
| Exercise | — | 0.064 ** | — | 0.040 ** | — | −0.060 ** | |||
| — | [9] | — | [13] | — | [2] | ||||
| Eating | 0.155 ** | — | 0.198 ** | — | 0.185 ** | — | −0.090 ** | ||
| [2] | — | [2] | — | [2] | — | [2] | |||
| Medical environment | 0.078 ** | 0.106 ** | 0.086 ** | 0.057 ** | 0.087 ** | 0.081 ** | |||
| [8] | [5] | [5] | [7] | [7] | [6] | ||||
| Natural and Cultural factors (2) | Natural environment | 0.114 ** | 0.088 ** | 0.083 ** | 0.108 ** | 0.103 ** | 0.097 ** | ||
| [4] | [6] | [6] | [2] | [3] | [5] | ||||
| Educational environment | 0.090 ** | 0.149 ** | 0.071 ** | 0.064 ** | 0.084 ** | 0.111 ** | |||
| [7] | [2] | [7] | [5] | [8] | [3] | ||||
| Economic factors (3) | Income | 0.029 * | |||||||
| [11] | |||||||||
| Assets | 0.061 ** | 0.046 ** | 0.044 ** | 0.057 ** | 0.055 ** | 0.064 ** | |||
| [9] | [7] | [12] | [7] | [10] | [7] | ||||
| Employment stability | 0.036 ** | 0.027 * | 0.037 ** | −0.039 * | −0.060 ** | ||||
| [9] | [11] | [10] | [6] | [3] | |||||
| Societal community factors (4) | Stratification satisfaction | 0.322 ** | 0.137 ** | 0.242 ** | 0.095 ** | 0.294 ** | 0.121 ** | −0.087 ** | |
| [1] | [4] | [1] | [3] | [1] | [2] | [1] | |||
| General trust | 0.126 ** | 0.144 ** | 0.067 ** | 0.058 ** | 0.100 ** | 0.100 ** | −0.040 * | ||
| [3] | [3] | [8] | [6] | [5] | [4] | [6] | |||
| Disparity recognition | 0.034 ** | 0.016 * | 0.053 ** | 0.050 ** | |||||
| [14] | [15] | [4] | [4] | ||||||
| Disparity elimination | |||||||||
| Political factors (4) | Fairness/ Justice | −0.046 ** | |||||||
| [5] | |||||||||
| Anti-corruptive fairness | −0.076 ** | −0.048 ** | −0.045 ** | −0.063 ** | −0.042 ** | −0.058 ** | |||
| [14] | [15] | [14] | [14] | [16] | [3] | ||||
| Human rights | 0.103 ** | 0.089 ** | 0.101 ** | 0.027 * | |||||
| [6] | [4] | [4] | [12] | ||||||
| Civil efficiency | 0.114 ** | 0.042 ** | 0.064 ** | 0.028 * | 0.092 ** | 0.039 ** | |||
| [4] | [8] | [10] | [10] | [6] | [9] | ||||
| Notes: **: p < 0.01, *: p < 0.05. Independent variables: all basic factors, including ascriptive factors. PSH and notes of other variables: see Table 1. Blank spaces indicate that the factor does not appear in the analysis. The figure in brackets indicates the order (from the highest) of the magnitude of each variable. “Exercise” and “Eating” are separately asked in Survey 1, while an integrated item, “exercise/Eating,” is asked in Survey 2. — indicates ‘no calculation.’ The italicized figures in parentheses indicate the number of variables in each category; as for biological factors, refer to Appendix E. | |||||||||
Appendix G.2. Multiple Regression Analysis of All Factors, Including Additional Items
| PSH | PHH | PSSH | ||
| R | 0.882 | 0.747 | 0.851 | |
| R2 | 0.778 | 0.558 | 0.725 | |
| adjusted R2 | 0.778 | 0.557 | 0.724 | |
| β | ||||
| Ascriptive factors (4) | Gender | 0.021 ** | 0.016 * | |
| [12] | [17] | |||
| Age | −0.090 ** | −0.049 ** | ||
| [3] | [9] | |||
| Occupation | 0.021 ** | 0.037 ** | 0.029 ** | |
| [12] | [8] | [11] | ||
| Marriage | 0.031 ** | 0.022 ** | ||
| [10] | [15] | |||
| Biological factors (3/2) | Exercise/Eating | 0.181 ** | 0.355 ** | 0.287 ** |
| [2] | [1] | [1] | ||
| Medical environment | 0.070 ** | 0.036 ** | 0.052 ** | |
| [7] | [9] | [8] | ||
| Natural and Cultural factors (2) | Natural environment | 0.036 ** | 0.078 ** | 0.056 ** |
| [9] | [4] | [6] | ||
| Educational environment | 0.063 ** | 0.045 ** | ||
| [8] | [10] | |||
| Economic factors (3) | Income | 0.025 ** | ||
| [11] | ||||
| Assets | 0.033 ** | 0.025 * | ||
| [11] | [13] | |||
| Employment stability | 0.018 * | |||
| [16] | ||||
| Societal community factors (4) | Stratification satisfaction | 0.095 ** | 0.068 ** | 0.081 ** |
| [5] | [6] | [5] | ||
| General trust | 0.082 ** | 0.029 * | 0.055 ** | |
| [6] | [12] | [7] | ||
| Disparity recognition | ||||
| Disparity elimination | ||||
| Political factors (4) | Fairness/Justice | |||
| Anti-corruptive fairness | −0.041 ** | −0.034 ** | ||
| [15] | [18] | |||
| Human rights | 0.022 * | 0.025 ** | ||
| [13] | [13] | |||
| Civil efficiency | ||||
| HED | 0.120 ** | 0.074 ** | 0.097 ** | |
| [4] | [5] | [4] | ||
| EUD | 0.177 ** | 0.052 ** | 0.118 ** | |
| [3] | [7] | [3] | ||
| Fair/Just Society | 0.016 ** | |||
| [14] | ||||
| Contribution | −0.035 ** | −0.027 ** | ||
| [10] | [12] | |||
| Optimism | 0.268 ** | 0.210 ** | 0.251 ** | |
| [1] | [2] | [2] | ||
| Notes: **: p < 0.01, *: p < 0.05.Independent variables: all basic factors, including Ascriptive factors, Hedonic, Eudaimonic, Contribution, Optimism, and Fair/Just society. PSH and notes of other variables: see Appendix E. | ||||
Appendix H. Correlations Concerning I COPPE
Appendix H.1. Correlations Between I CCOPPPE (Survey 1)
| IOv | IPs | IPh | IN | IC | IO | IE | IPo | |
| IOv | 1.000 | 0.817 ** | 0.717 ** | 0.814 ** | 0.709 ** | 0.790 ** | 0.796 ** | 0.664 ** |
| IPs | 0.817 ** | 1.000 | 0.807 ** | 0.776 ** | 0.701 ** | 0.771 ** | 0.777 ** | 0.676 ** |
| IPh | 0.717 ** | 0.807 ** | 1.000 | 0.693 ** | 0.660 ** | 0.716 ** | 0.723 ** | 0.638 ** |
| INT | 0.814 ** | 0.776 ** | 0.693 ** | 1.000 | 0.749 ** | 0.765 ** | 0.732 ** | 0.636 ** |
| IC | 0.709 ** | 0.701 ** | 0.660 ** | 0.749 ** | 1.000 | 0.752 ** | 0.702 ** | 0.687 ** |
| IO | 0.790 ** | 0.771 ** | 0.716 ** | 0.765 ** | 0.752 ** | 1.000 | 0.774 ** | 0.706 ** |
| IE | 0.796 ** | 0.777 ** | 0.723 ** | 0.732 ** | 0.702 ** | 0.774 ** | 1.000 | 0.735 ** |
| IPo | 0.664 ** | 0.676 ** | 0.638 ** | 0.636 ** | 0.687 ** | 0.706 ** | 0.735 ** | 1.000 |
| Notes: **: p < 0.01. | ||||||||
Appendix H.2. Correlations Between I CCOPPPE (Survey 2)
| IOv | IPs | IPh | IN | IC | IO | IE | IPo | ICul | |
| IOv | 1.000 | 0.828 ** | 0.723 ** | 0.824 ** | 0.720 ** | 0.778 ** | 0.794 ** | 0.645 ** | 0.694 ** |
| IPs | 0.828 ** | 1.000 | 0.796 ** | 0.778 ** | 0.708 ** | 0.768 ** | 0.770 ** | 0.657 ** | 0.725 ** |
| IPh | 0.723 ** | 0.796 ** | 1.000 | 0.680 ** | 0.657 ** | 0.709 ** | 0.694 ** | 0.632 ** | 0.672 ** |
| INT | 0.824 ** | 0.778 ** | 0.680 ** | 1.000 | 0.752 ** | 0.749 ** | 0.718 ** | 0.634 ** | 0.697 ** |
| IC | 0.720 ** | 0.708 ** | 0.657 ** | 0.752 ** | 1.000 | 0.752 ** | 0.689 ** | 0.672 ** | 0.718 ** |
| IO | 0.778 ** | 0.768 ** | 0.709 ** | 0.749 ** | 0.752 ** | 1.000 | 0.765 ** | 0.661 ** | 0.700 ** |
| IE | 0.794 ** | 0.770 ** | 0.694 ** | 0.718 ** | 0.689 ** | 0.765 ** | 1.000 | 0.718 ** | 0.738 ** |
| IPo | 0.645 ** | 0.657 ** | 0.632 ** | 0.634 ** | 0.672 ** | 0.661 ** | 0.718 ** | 1.000 | 0.808 ** |
| ICul | 0.694 ** | 0.725 ** | 0.672 ** | 0.697 ** | 0.718 ** | 0.700 ** | 0.738 ** | 0.808 ** | 1.000 |
| Notes: **: p < 0.01. | |||||||||
Appendix H.3. Correlations Between I CCOPPPE (Survey 3)
| IOv | IPs | IPh | IN | IC | IO | IE | IPo | ICul | |
| IOv | 1.000 | 0.815 ** | 0.738 ** | 0.831 ** | 0.712 ** | 0.803 ** | 0.829 ** | 0.688 ** | 0.704 ** |
| IPs | 0.815 ** | 1.000 | 0.810 ** | 0.785 ** | 0.708 ** | 0.773 ** | 0.767 ** | 0.697 ** | 0.738 ** |
| IPh | 0.738 ** | 0.810 ** | 1.000 | 0.698 ** | 0.672 ** | 0.740 ** | 0.719 ** | 0.664 ** | 0.700 ** |
| INT | 0.831 ** | 0.785 ** | 0.698 ** | 1.000 | 0.735 ** | 0.763 ** | 0.738 ** | 0.669 ** | 0.709 ** |
| IC | 0.712 ** | 0.708 ** | 0.672 ** | 0.735 ** | 1.000 | 0.758 ** | 0.670 ** | 0.697 ** | 0.736 ** |
| IO | 0.803 ** | 0.773 ** | 0.740 ** | 0.763 ** | 0.758 ** | 1.000 | 0.788 ** | 0.705 ** | 0.727 ** |
| IE | 0.829 ** | 0.767 ** | 0.719 ** | 0.738 ** | 0.670 ** | 0.788 ** | 1.000 | 0.730 ** | 0.728 ** |
| IPo | 0.688 ** | 0.697 ** | 0.664 ** | 0.669 ** | 0.697 ** | 0.705 ** | 0.730 ** | 1.000 | 0.820 ** |
| ICul | 0.704 ** | 0.738 ** | 0.700 ** | 0.709 ** | 0.736 ** | 0.727 ** | 0.728 ** | 0.820 ** | 1.000 |
| Notes: **: p < 0.01. | |||||||||
Appendix I. Correlations Between IPs/IPh/(PSSH-PHH) and Factors (Survey 1, 2, 3)
| IPs | IPh | PSSH−PHH | ||||||||
| Survey1 | Survey2 | Survey3 | Survey1 | Survey2 | Survey3 | Survey1 | Survey2 | Survey3 | ||
| Ascriptive factors (4) | Sex | 0.047 ** | 0.010 | 0.005 | 0.029 * | 0.029 * | 0.047 * | 0.046 ** | −0.027 * | −0.054 ** |
| [19] | [20] | [18] | [16] | [10] | [14] | [12] | ||||
| Age | 0.022 | 0.111 ** | 0.150 ** | −0.084 ** | −0.002 | 0.042 * | 0.155 ** | 0.167 ** | 0.171 ** | |
| [18] | [14] | [17] | [17] | [1] | [1] | [1] | ||||
| Occupation | 0.210 ** | 0.170 ** | 0.130 ** | 0.207 ** | 0.160 ** | 0.160 ** | 0.011 | 0.006 | −0.028 | |
| [16] | [17] | [15] | [16] | [17] | [14] | |||||
| Marriage | 0.138 ** | 0.212 ** | 0.225 ** | 0.073 ** | 0.161 ** | 0.185 ** | 0.112 ** | 0.073 ** | 0.095 ** | |
| [17] | [15] | [13] | [18] | [16] | [13] | [2] | [6] | [9] | ||
| Biological factors (3/2) | Exercise/Eating | 0.660 ** | 0.656 ** | −0.059 ** | ||||||
| [1] | [1] | [8] | ||||||||
| Exercise | 0.339 ** | 0.378 ** | −0.080 ** | |||||||
| [13] | [12] | [6] | ||||||||
| Eating | 0.519 ** | 0.507 ** | −0.022 | |||||||
| [4] | [2] | |||||||||
| Medical environment | 0.458 ** | 0.529 ** | 0.431 ** | 0.456 ** | 0.023 | 0.082 ** | ||||
| [9] | [8] | [9] | [10] | [4] | ||||||
| Natural and Cultural factors (2) | Natural environment | 0.506 ** | 0.568 ** | 0.533 ** | 0.457 ** | 0.514 ** | 0.472 ** | 0.094 ** | 0.048 ** | 0.118 ** |
| [5] | [5] | [5] | [8] | [5] | [6] | [3] | [11] | [4] | ||
| Educational environment | 0.496 ** | 0.628 ** | 0.552 ** | 0.479 ** | 0.565 ** | 0.533 ** | 0.054 ** | 0.084 ** | 0.100 ** | |
| [7] | [2] | [2] | [4] | [2] | [1] | [9] | [3] | [6] | ||
| Economic factors (3) | Income | 0.493 ** | 0.551 ** | 0.511 ** | 0.468 ** | 0.498 ** | 0.476 ** | 0.039 ** | 0.049 ** | 0.106 ** |
| [8] | [7] | [6] | [6] | [7] | [5] | [12] | [10] | [5] | ||
| Assets | 0.499 ** | 0.559 ** | 0.534 ** | 0.473 ** | 0.515 ** | 0.507 ** | 0.033 * | 0.032 ** | 0.088 ** | |
| [6] | [6] | [4] | [5] | [4] | [3] | [13] | [13] | [10] | ||
| Employment stability | 0.427 ** | 0.508 ** | 0.474 ** | 0.398 ** | 0.479 ** | 0.446 ** | 0.042 ** | 0.034 ** | 0.080 ** | |
| [11] | [9] | [7] | [11] | [8] | [7] | [11] | [12] | [11] | ||
| Societal community factors (4) | Stratification satisfaction | 0.628 ** | 0.590 ** | 0.578 ** | 0.577 ** | 0.530 ** | 0.514 ** | 0.093 ** | 0.065 ** | 0.147 ** |
| [1] | [4] | [1] | [1] | [3] | [2] | [4] | [7] | [2] | ||
| General trust | 0.521 ** | 0.596 ** | 0.542 ** | 0.463 ** | 0.512 ** | 0.482 ** | 0.091 ** | 0.099 ** | 0.132 ** | |
| [3] | [3] | [3] | [7] | [6] | [4] | [5] | [2] | [3] | ||
| Disparity recognition | 0.069 ** | 0.205 ** | 0.128 ** | 0.073 ** | 0.164 ** | 0.109 ** | 0.021 | 0.073 ** | 0.034 † | |
| [18] | [16] | [16] | [19] | [15] | [15] | [5] | [14] | |||
| Disparity elimination | 0.282 ** | 0.394 ** | 0.386 ** | 0.277 ** | 0.385 ** | 0.384 ** | 0.017 | 0.002 | 0.033 † | |
| [15] | [12] | [10] | [15] | [12] | [10] | [15] | ||||
| Political factors (4) | Fairness/Justice | 0.380 ** | 0.345 ** | 0.362 ** | 0.377 ** | 0.344 ** | 0.358 ** | 0.007 | −0.008 | 0.035 † |
| [12] | [13] | [11] | [13] | [13] | [11] | [13] | ||||
| Anti-corruptive fairness | 0.310 ** | 0.293 ** | 0.310 ** | 0.315 ** | 0.310 ** | 0.323 ** | −0.006 | −0.027 * | −0.001 | |
| [14] | [14] | [12] | [14] | [14] | [12] | [14] | ||||
| Human rights | 0.524 ** | 0.452 ** | 0.460 ** | 0.481 ** | 0.427 ** | 0.417 ** | 0.070 ** | 0.019 | 0.095 ** | |
| [2] | [11] | [8] | [3] | [11] | [8] | [7] | [8] | |||
| Civil efficiency | 0.443 ** | 0.498 ** | 0.414 ** | 0.418 ** | 0.468 ** | 0.391 ** | 0.066 ** | 0.049 ** | 0.096 ** | |
| [10] | [10] | [9] | [10] | [9] | [9] | [8] | [9] | [7] | ||
| EUD | 0.524 ** | 0.656 ** | 0.580 ** | 0.501 ** | 0.582 ** | 0.528 ** | 0.092 ** | 0.145 ** | 0.168 ** | |
| HED | 0.321 ** | 0.647 ** | 0.588 ** | 0.305 ** | 0.570 ** | 0.516 ** | 0.064 ** | 0.122 ** | 0.173 ** | |
| Fair/Just society | 0.242 ** | 0.228 ** | −0.009 | |||||||
| Distributive justice | 0.436 ** | 0.428 ** | −0.001 | |||||||
| Contribution | 0.444 ** | 0.573 ** | 0.497 ** | 0.419 ** | 0.507 ** | 0.461 ** | 0.075 ** | 0.124 ** | 0.122 ** | |
| Optimism | 0.572 ** | 0.720 ** | 0.671 ** | 0.499 ** | 0.621 ** | 0.606 ** | 0.100 ** | 0.090 ** | 0.129 ** | |
| Notes: **: p < 0.01, *: p < 0.05, †: p < 0.1. Gender (man = 0, woman = 1). The figure for age is the actual age (non-logarithm). Occupation: no job = 0, otherwise = 1. Marital status: unmarried, divorced, or bereaved = 0, married = 1. The figures in parentheses concerning exercise/eating are based on the calculated values of Pearson correlation coefficients. The figure in brackets indicates the order (from the highest) of the magnitude concerning the estimated coefficient for each variable. The italicized figures in parentheses indicate the number of variables in each category; refer to the information below for biological factors. The blank space indicates that the relevant variable is not asked in Surveys 1 or 2. “Exercise” and “Eating” are separately asked in Survey 1, while an integrated item, “Exercise/Eating,” is asked in Survey 2. | ||||||||||
Appendix J. Multiple Regression Analysis Concerning I COPPE
Appendix J.1. Multiple Regression Analysis Between IOv and IPh, Ips (Surveys 1, 2, 3)
| IOv | |||
| Survey1 | Survey2 | Survey3 | |
| R | 0.822 | 0.835 | 0.825 |
| R2 | 0.676 | 0.697 | 0.681 |
| adjusted R2 | 0.676 | 0.697 | 0.681 |
| β (standardized partial regression coefficient) | |||
| IPs | 0.682 ** | 0.689 ** | 0.632 ** |
| [1] | [1] | [1] | |
| IPh | 0.167 ** | 0.174 ** | 0.225 ** |
| [2] | [2] | [2] | |
| Notes: **: p < 0.01. | |||
Appendix J.2. Multiple Regression Analysis Between IOv and I CCOPPPE Indicators (Surveys 1, 2, 3)
| IOv | |||
| Survey1 | Survey2 | Survey3 | |
| R | 0.887 | 0.895 | 0.904 |
| R2 | 0.787 | 0.802 | 0.818 |
| adjusted R2 | 0.787 | 0.801 | 0.817 |
| β (standardized partial regression coefficient) | |||
| IPs | 0.269 ** | 0.275 ** | 0.193 ** |
| [2] | [2] | [3] | |
| IPh | −0.001 | 0.041 ** | 0.023 * |
| [5] | [7] | ||
| IN | 0.307 ** | 0.335 ** | 0.323 ** |
| [1] | [1] | [2] | |
| IC | 0.003 | 0.026 ** | 0.026† |
| [7] | [6] | ||
| IO | 0.168 ** | 0.113 ** | 0.144 ** |
| [4] | [4] | [4] | |
| IE | 0.235 ** | 0.243 ** | 0.324 ** |
| [3] | [3] | [1] | |
| IPo | −0.004 | −0.017 † | 0.001 |
| [8] | |||
| ICul | −0.029 ** | −0.050 ** | |
| [6] | [5] | ||
| Notes: **: p < 0.01,*: p < 0.05,†: p < 0.1 | |||
Appendix J.3. Multiple Regression Analysis Between IOv and PSSH/I CCOPPPE Items (Surveys 1, 2, 3)
| IOv | |||
| Survey1 | Survey2 | Survey3 | |
| R | 0.883 | 0.892 | 0.903 |
| R2 | 0.780 | 0.796 | 0.816 |
| adjusted R2 | 0.780 | 0.796 | 0.815 |
| β (standardized partial regression coefficient) | |||
| (IPs + IPh)/2 | 0.226 ** | 0.268 ** | 0.202 ** |
| [3] | [2] | [3] | |
| IN | 0.331 ** | 0.358 ** | 0.339 ** |
| [1] | [1] | [1] | |
| IC | −0.001 | 0.024 ** | 0.024 |
| [6] | |||
| IO | 0.174 ** | 0.117 ** | 0.142 ** |
| [4] | [7] | [4] | |
| IE | 0.244 ** | 0.259 ** | 0.328 ** |
| [2] | [3] | [2] | |
| IPo | −0.003 | −0.027 ** | 0.000 |
| [5] | |||
| ICul | −0.022 * | −0.048 ** | |
| [7] | [5] | ||
| Notes: **: p < 0.01, *: p < 0.05, IOv = Overall Well-Being, Ips = Psychological Well-Being, IPh = Physical Well-Being, IN = Interpersonal Well-Being, IC = Community Well-Being, IO = Occupational Well-Being, IE= Economic Well-Being, IPo = Political Well-Being, ICul = Cultural Well-Being [see Appendix A.3, I COPPE/I CCOPPPE]. | |||
References
- Kobayashi, M.; Ishido, H.; Mizushima, J.; Ishikawa, H. Multi-Dimensional Dynamics of Psychological Health Disparities under the COVID-19 in Japan: Fairness/Justice in Socio-Economic and Ethico-Political Factors. Int. J. Environ. Res. Public Health 2022, 19, 16437. [Google Scholar] [CrossRef] [PubMed]
- Engel, G.L. The need for a new medical model: A challenge for biomedicine. Science 1977, 196, 129–136. [Google Scholar] [CrossRef] [PubMed]
- Lipowski, Z.J. What does the word ‘psychosomatic’ really mean? A historical and semantic inquiry. Psychosom. Med. 1984, 46, 153–171. [Google Scholar] [CrossRef] [PubMed]
- Psychosomatics Today; Aisenstein, M., Rappoport de Aisemberg, E., Eds.; The International Psychoanalytical Association Psychoanalytic Ideas and Applications Series; Routledge: New York, NY, USA, 2010. [Google Scholar]
- Wolman, B.B. Psychosomatic Disorders; Plenum Pub Corp: New York, NY, USA, 1988. [Google Scholar]
- Ackerman, D.K.; DiMartini, A.F. (Eds.) Psychosomatic Medicine (Pittsburgh Pocket Psychiatry); Oxford University Press: New York, NY, USA, 2015. [Google Scholar]
- Turp, M. Psychosomatic Health: The Body and the Word; Red Globe Press: London, UK, 2001. [Google Scholar]
- Spillane, A.; Larkin, C.; Cocroan, P.; Matvienko-Sikar, K.; Riordan, F. Physical and Psychosomatic Health Outcomes in People Bereaved by Suicide Compared to People Bereaved by Other Modes of Death: A Systematic Review. BMC Public Health 2017, 17, 939. [Google Scholar] [CrossRef]
- Friberg, P.; Hagquist, C.; Osika, W. Self-perceived Psychosomatic Health in Swedish Children, Adolescents, and Young Adults: An Internet-Based Survey over Time. BMJ Open 2012, 2, e000681. [Google Scholar] [CrossRef] [PubMed]
- Paschouna, D.A.; Damigosa, D.; Skapinakisa, P.; Siamopoulosa, K. The Psychosomatic Health of the Spouses of Chronic Kidney Disease Patients. Eur. Psychiatry 2015, 30, 608. [Google Scholar] [CrossRef]
- Kobayashi, M. Well-being and Fairness in the COVID-19 Crisis in Japan: Insights from Positive Political Psychology. In Social Fairness in a Post-Pandemic World: Interdisciplinary Perspectives; Ishido, H., Mizushima, J., Kobayashi, H., Zhang, X., Eds.; Palgrave: New York, NY, USA, 2023. [Google Scholar]
- Kobayashi, M. Political Philosophies and Positive Political Psychology: Inter-Disciplinary Framework for the Common Good. Front. Psychol. 2021, 12, 727818. [Google Scholar] [CrossRef]
- Diener, E. The Science of Well-Being: The Collected Works of Ed Diener; Springer Science + Business Media: Berlin/Heidelberg, Germany, 2009. [Google Scholar]
- Sumino, Z. Development of the Japanese version of the Satisfaction with Life Scale. In Proceedings of the Japanese Association of Educational Psychology 36th Annual Convention, Kyoto, Japan, 28–30 September 1994. [Google Scholar] [CrossRef]
- Seligman, M.E.P. Flourish: A Visionary New Understanding of Happiness and Well-Being; Atria: New York, NY, USA, 2012. [Google Scholar]
- Butler, J.; Kern, M.L. The PERMA-Profiler: A brief multidimensional measure of flourishing. Int. J. Wellbeing 2016, 6, 1–48. [Google Scholar] [CrossRef]
- Prilleltensky, I.; Foodsz, S.; Prilleltensky, O.; Myers, N.; Rubenstein, C.; Jin, Y.; McMahon, A. Assessing multi-dimensional well-being: Development and validation of the I COPPE scale. J. Community Psychol. 2015, 43, 199–226. [Google Scholar] [CrossRef]
- Wilkinson, R.G. The Impact of Inequality: How to Make Sick Societies Healthier; The New Press: New York, NY, USA, 2005. [Google Scholar]
- Wilkinson, R.; Pickett, S. The Inner Level: How More Equal Societies Reduce Stress, Restore Sanity and Improve Everyone’s Well-Being; Penguin Books: London, UK, 2019. [Google Scholar]
- Wilkinson, R.; Pickett, S. The Spirit Level: Why Greater Equality Makes Societies Stronger; Bloomsbury: London, UK, 2011. [Google Scholar]
- Marmot, M.G. The Health Gap: The Challenge of an Unequal World; Bloomsbury Pub Plc: New York, NY, USA, 2015. [Google Scholar]
- Marmot, M.; Wilkinson, R.G. (Eds.) Social Determinants of Health; Oxford University Press: New York, NY, USA, 2006. [Google Scholar]
- Kawachi, I.; Kennedy, B.P.; Wilkinson, R.G. The Society and Population Health Reader: Income Inequality and Health; New Press: New York, NY, USA, 1999. [Google Scholar]
- Hunt, S.M. Subjective Health Indicators and Health Promotion. Health Promot. Int. 1988, 3, 23–34. [Google Scholar] [CrossRef]
- Monden, C. Subjective Health and Subjective Well-Being. In Encyclopedia of Quality of Life and Well-Being Research; Springer: Dordrecht, The Netherlands, 2014; Volume 20. [Google Scholar]
- Peterson, C. A Primer in Positive Psychology; Oxford University Press: New York, NY, USA, 2006. [Google Scholar]
- Huta, V. Eudaimonic and Hedonic Orientations: Theoretical Considerations and Research Findings. In Handbook of Eudaimonic Well-Being; Springer: New York, NY, USA, 2016. [Google Scholar]
- Sandel, M.J. Justice: What’s the Right Thing to Do? Farrar, Straus and Giroux-Macmillan: New York, NY, USA, 2009. [Google Scholar]
- Sandel, M.J. Liberalism and the Limits of Justice; Cambridge University Press: Cambridge, UK, 1982. [Google Scholar]
- Mizushima, J. Social Justice and the Response to the COVID-19 Crisis in European Countries. In Social Fairness in a Post-Pandemic World: Interdisciplinary Perspectives; Ishido, H., Mizushima, J., Kobayashi, H., Zhang, X., Eds.; Palgrave: New York, NY, USA, 2023. [Google Scholar]
- Kobayashi, M. Psychological Examination of Political Philosophies: Interrelationship Among Citizenship, Justice, and Well-Being in Japan. Front. Psychol. 2022, 12, 790671. [Google Scholar] [CrossRef] [PubMed]

| Factor Category | Specific Elements | Survey | Strength of Correlation | Comment |
|---|---|---|---|---|
| 1. Ascriptive Factors | Gender, Age | Both | Very Low or Insignificant | Exception: Weak positive correlation between age and PSH/PSSH in some surveys (0.1 range) |
| Marital Status | Low (0.1 range) | |||
| Occupation | Low (below 0.25) | |||
| 2. Biological Factors | Exercise | Survey 1 | Moderate (0.3 range): PSH/PHH | Stronger correlation with physical health |
| Eating | Survey 1 | High (0.5 range) | Stronger with psychological health | |
| Exercise + Eating | Survey 2 | High to Very High (0.6–0.7 range) | Stronger with psychological health The combined item shows a strong association | |
| Medical Environment | Both | Moderate to High (0.4–0.5 range) | Significant for all health indicators | |
| 3. Natural and Cultural Factors | Natural Environment | Both | Moderate to High (0.4–0.5 range) | Significant for all health indicators |
| Educational Environment (Self/Children) | Both | Moderate to High (0.4–0.6 range) | Education linked to health inequality | |
| 4. Economic Factors | Income, Assets, Employment Stability | Both | Moderate to High (0.4–0.5 range) | Aligned with objective data in Section 3.1.2 |
| 5. Societal Community Factors | Stratification Satisfaction | Both | High (0.5–0.6 range) | One of the strongest correlations |
| General Trust | Both | Moderate to High (0.4–0.6 range) | ||
| Disparity Recognition | Both | Negligible or Very Low (0.08–0.14 range) | ||
| Disparity Elimination Orientation | Both | Moderate (0.3–0.4 range) | ||
| 6. Political Factors | Fairness/Justice | Both | Moderate (0.3–0.4 range) | |
| Anti-Corruption Fairness | Both | Moderate (0.3–0.4 range) | ||
| Human Rights | Both | Moderate to High (0.4–0.5 range) | A central concept of justice | |
| Civil Efficacy | Both | Moderate to High (0.4–0.5 range) | Reflects a willingness for political engagement, Related to citizenship |
| PHH | PSSH | Mental Change | Physical Change | |||
|---|---|---|---|---|---|---|
| Survey 1 | Survey 2 | Survey 1 | Survey 2 | Survey 1 | ||
| Ascriptive factors | low | low | low | low | negligible | low |
| [3] 3 | [4] 2 | [5] 3 | [4] 4 | [2] 2 | [1] 2 | |
| Biological factors | moderate | moderate | moderate | moderate | negligible | negligible |
| [1] 3 | [1] 2 | [2] 3 | [1] 2 | [3] 1 | [2] 1 | |
| Natural and Cultural factors | low | low | low | low | ||
| [4] 2 | [2] 2 | [4] 2 | [3] 2 | |||
| Economic factors | negligible | negligible | negligible | low | negligible | negligible |
| [6] 1 | [5] 2 | [6] 1 | [5] 2 | [5] 1 | [4] 1 | |
| Societal community factors | moderate | low | moderate | low | low | negligible |
| [2] 2 | [3] 2 | [1] 2 | [2] 3 | [1] 2 | [2] 2 | |
| Political factors | low | negligible | low | negligible | negligible | negligible |
| [5] 2 | [6] 1 | [3] 2 | [6] 2 | [4] 1 | [5] 1 | |
Disclaimer/Publisher’s Note: The statements, opinions and data contained in all publications are solely those of the individual author(s) and contributor(s) and not of MDPI and/or the editor(s). MDPI and/or the editor(s) disclaim responsibility for any injury to people or property resulting from any ideas, methods, instructions or products referred to in the content. |
© 2025 by the authors. Licensee MDPI, Basel, Switzerland. This article is an open access article distributed under the terms and conditions of the Creative Commons Attribution (CC BY) license (https://creativecommons.org/licenses/by/4.0/).
Share and Cite
Kobayashi, M.; Ishido, H.; Mizushima, J.; Ishikawa, H. Social, Economic, and Ethico-Political Determinants of Psychosomatic Health Disparities: Equity and Fairness Under COVID-19 in Japan. Healthcare 2025, 13, 1362. https://doi.org/10.3390/healthcare13121362
Kobayashi M, Ishido H, Mizushima J, Ishikawa H. Social, Economic, and Ethico-Political Determinants of Psychosomatic Health Disparities: Equity and Fairness Under COVID-19 in Japan. Healthcare. 2025; 13(12):1362. https://doi.org/10.3390/healthcare13121362
Chicago/Turabian StyleKobayashi, Masaya, Hikari Ishido, Jiro Mizushima, and Hirotaka Ishikawa. 2025. "Social, Economic, and Ethico-Political Determinants of Psychosomatic Health Disparities: Equity and Fairness Under COVID-19 in Japan" Healthcare 13, no. 12: 1362. https://doi.org/10.3390/healthcare13121362
APA StyleKobayashi, M., Ishido, H., Mizushima, J., & Ishikawa, H. (2025). Social, Economic, and Ethico-Political Determinants of Psychosomatic Health Disparities: Equity and Fairness Under COVID-19 in Japan. Healthcare, 13(12), 1362. https://doi.org/10.3390/healthcare13121362