Abstract
Background/Objectives: Approximately one-third of patients with cardiovascular disease (CVD) experience depression. This study aimed to develop and validate a nomogram for assessing the risk of depression in patients with CVD. Methods: In a cross-sectional study design, we analyzed data obtained from 6702 patients with CVD who participated in the 2007–2018 National Health and Nutrition Examination Survey. The dataset was randomly split into training and validation cohorts at a 0.75 to 0.25 ratio. Univariate and multivariate logistic regression analyses were applied to the training cohort to identify predictors for a web-based dynamic nomogram, which was then validated in the validation cohort. Results: Blood Cd concentration, sedentary time, eosinophil count, marital status, work limitations, sleep disorders, asthma, stomach or intestinal illness, confusion or memory problems, ethnicity, and cotinine were identified as risk factors for depression in patients with CVD, and these 11 risk factors were incorporated into the nomogram. The area under the curve (AUC) of the nomogram was 0.852 (95% CI: 0.842–0.862) in the training cohort, with a sensitivity of 83.28% and specificity of 72.95%. The AUC was 0.856 (95% CI: 0.838–0.872) in the validation cohort, with a sensitivity of 79.14% and a specificity of 76.65%. The C-index of the nomogram was 0.852 in the training cohort, with a mean absolute error of 0.012 based on 1000 bootstrap replicates. The C-index of the nomogram model was 0.863 in the validation cohort, with a mean absolute error of 0.017. Conclusions: Our nomogram model demonstrates potential clinical utility for the early screening of depression risk in patients with CVD.
1. Introduction
In its 2019 statistics, the World Health Organization (WHO) estimated that cardiovascular disease (CVD) accounted for approximately 32% of all-cause mortality worldwide, making it a leading cause of premature death, especially in low- and middle-income countries (https://www.who.int/data/gho/data/indicators/indicator-details/GHO/estimated-population-based-prevalence-of-depression/, accessed on 10 September 2024). Although the exact underlying mechanism(s) has yet to be determined, multiple factors, including family history, ethnicity, hypertension, smoking, high cholesterol, diabetes, physical inactivity, stress, and loneliness/social isolation, have been linked to CVD etiology [1].
Depression is a severe mental illness that impairs overall well-being, resulting in disability [2] and suicidal thoughts [3]. Approximately 280 million people worldwide or 3.8% of the total population, suffer from depression (https://www.who.int/data/gho, accessed on 10 September 2024). In addition to traditional risk factors, depression has been established as an important risk factor for CVD morbidity and mortality. People with depression exhibit a higher risk of CVD morbidity and mortality than those without depression. Concurrently, patients with CVD are more predisposed to depression than the general population [4,5], implying the coexistence of the two health conditions.
Depression affects various CVD patients, including those with coronary artery disease [6], chronic heart failure [7], angina pectoris [8], and stroke [9]. A benchmarking study of ischemic heart disease in Australia showed that up to 40% of patients experienced depression [10]. In a hospital-based study, nearly 66% of patients developed depression after being hospitalized due to cardiac disease or acute myocardial infarction [11]. Depression affects the effectiveness of rehabilitation and quality of life in patients with CVD, such that the risk of adverse events and mortality increases [12]. The association between depression and CVD has been reviewed and summarized in recent meta-analyses of prospective cohort studies [4]. Collectively, the findings of previous studies imply a pathological connection between these two health conditions [13].
Depression has a multifaceted etiology, with social, psychological, behavioral, and biological risk factors acting separately or concurrently [14]. Social risk factors include poor socio-demographics [15], loneliness and/or social isolation [16], ongoing difficulties [17], physical disabilities [18], and poor work performance [19]. Environmental factors include neurotoxic substances like cadmium, lead, mercury, and arsenic [20]. These risk factors for depression are also linked to the biological and behavioral risk factors that contribute to the development of CVD. In contrast, adopting a healthy lifestyle, such as physical activity, avoiding prolonged sitting, and a healthy diet, has antidepressant effects, lowers the risk of CVD, reduces CVD recurrence, and facilitates rehabilitation to a normal lifestyle [21]. Taken together, the findings from previous studies highlight the need for a multifaceted approach to assessing depression risk in patients with CVD because they may share risk factors [22].
Constructing a multivariate regression analysis-based nomogram may facilitate screening for depression risk among patients with CVD, enabling early detection, intervention, and rehabilitation. Unfortunately, screening for post-CVD depression risk is often ignored or insufficiently addressed, as most patients do not receive appropriate care and/or treatment [5]. This study aimed to develop and validate a nomogram model to screen for the risk of depression in patients with CVD.
2. Materials and Methods
2.1. Study Design
The National Center for Health Statistics (NCHS) of the Centers for Disease Control and Prevention (CDC) conducts the National Health and Nutrition Examination Survey (NHANES) on an annual basis to assess the health and nutritional status of adults and children in the United States through personal interviews and physical examinations. The NHANES uses a complex, multistage probability sampling design and surveys 5000 people every two years on average. After cleaning the data and removing missing samples, we selected six NHANES (2007–2018) cycles as the original dataset for analysis. The NCHS Research Ethics Review Board reviewed and approved the NHANES protocol (as well as the publicly released de-identified data). Due to the open availability of NANES, this study was exempted from the Institutional Review Board (IRB) review. Informed consent was not required for this study because it was a secondary analysis of existing datasets.
2.2. Participants
As illustrated in Figure 1, we combined six NHANES survey cycles from 2007 to 2018, with a total of 119,609 participants. We excluded participants without CVD (n = 111,538) and/or those without depression data (n = 1369). The remaining 6702 patients with CVD were included in the final data analysis. During the modeling process, 3/4 of the participants were randomly assigned to the training cohort (n = 5025), with the remaining 1/4 assigned to the validation cohort (n = 1677).
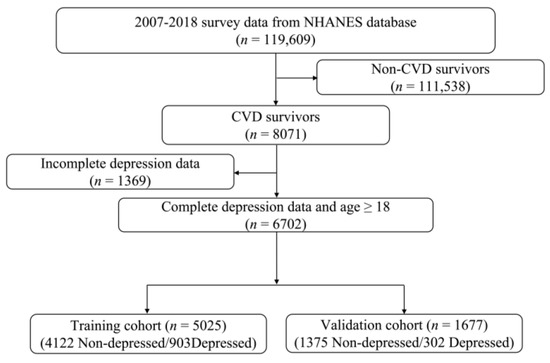
Figure 1.
Flow chart of the study participants.
2.3. Data Interpolation
No imputation was performed for the primary outcomes of depression and CVD due to the absence of missing data. For missing data, we used the Jomo package for multilevel joint modeling and multiple imputations [23]. We conducted interpolation in a Bayesian framework using a survey-weighted generalized linear model [24,25]. We used the Gibbs sampling method to generate five imputed datasets after a burn-in of 1000 rounds to ensure that the imputed datasets were not affected by random events [26]. We chose the final dataset for analysis by examining model fit indicators, such as the Akaike Information Criterion (AIC) and the Bayesian Information Criterion (BIC). We did this to ensure that the selected dataset accurately represented the data distribution (Appendix B Figure A1).
The NHANES uses a stratified, multistage probability sampling design in which individuals are divided into primary sampling units and geographical strata. The Jomo package supports joint modeling using a multilevel framework, which helps account for intra-cluster correlation while retaining between-cluster variability during the imputation process [27]. This is especially important in our case to maintain the internal structure and heterogeneity of the dataset to ensure robust prediction modeling. While other survey-specific imputation approaches, such as those incorporating sampling weights, are valid, we chose a method that preserved the variability across sampling clusters. Furthermore, the Jomo package allows for the flexible imputation of datasets containing continuous and categorical variables. Given these considerations, the Jomo package is appropriate for our study and follows the best practices for handling missing data in complex survey datasets, such as the NHANES.
2.4. Cross-Validation: Evaluating the Predictive Model Performance
We evaluated the performance of our predictive model using the 10-fold cross-validation method, which enhances reliability by mitigating the risk of overfitting and enhances generalization by using every data point to train and test the datasets. The dataset was randomly shuffled and partitioned into ten equal-sized folds. For each iteration, 1-fold was reserved for testing the model while the remaining folds were used for training the model. This procedure was repeated 10 times, with each fold serving as the testing set once. After the model was fitted to each training fold, predictions were generated for the corresponding validation fold. The model performance was evaluated using metrics such as accuracy, sensitivity, specificity, area under the receiver operating characteristic curve (ROCAUC), and area under the precision-recall curve (PRAUC). The cross-validation had a mean accuracy of 85.3 ± 0.5 with a PRAUC of 62.8 ± 1.17, indicating a solid predictive capability despite the observed class imbalance (Appendix B Figure A2).
2.5. Variables
2.5.1. Definition of Cardiovascular Disease and Depression
The Medical Conditions Questionnaire (MCQ) was used to determine the presence of self-reported CVD, which was defined as having a disease(s) diagnosed by a health professional, such as congestive heart failure, coronary heart disease, angina pectoris, heart attack (myocardial infarction), or stroke. The presence of depression was determined using the nine-item Patient Health Questionnaire-9 [28]. The participants were asked about their depressive status over the previous two weeks and how troubled they were by the situation presented. Responses were rated as “not at all” (0), “several days” (1), “more than half of the time” (2), and “nearly every day” (3). The possible scores range from 0 to 27. The scores for all nine questions were combined, and a PHQ-9 score of 10 was used to determine the presence of major depression. Although a clinical diagnosis of depression requires a comprehensive evaluation that consists of physical examination, lab tests, psychiatric evaluation, and the Diagnostic and Statistical Manual of Mental Disorders, Fifth Edition (DSM-5), the use of a PHQ-9 score of ≥10 has been proven to be a sensitive and specific cut-off for identifying individuals likely to meet the criteria for depression [29]. We were interested in exploring the risk of depression in patients with CVD, helping to identify those who may benefit from early detection and intervention.
2.5.2. Definition of Risk Factors
Comorbidities, health behaviors, complete blood count, blood metal toxin concentrations, and socio-demographic factors were considered potential risk factors in this study. Comorbidities included asthma, osteoarthritis, stomach or intestinal illness with vomiting and/or diarrhea, work limitations due to health conditions, mobility disorders, memory problems or confusion, sleep disorders, and use of prescribed medications. Asthma and osteoarthritis were diagnosed based on self-reports or by a physician or other professionals.
Stomach or intestinal illness was defined as a “YES” answer to the following question: Have you had a stomach or intestinal illness that caused vomiting or diarrhea within the last 30 days? Work limitations were considered present if there was a “YES” answer to the following question: Do you have any long-term physical, mental, or emotional problems or illnesses? Mobility disorders were considered present when the response to the following question was “YES”: Do you have difficulty walking without the use of special equipment due to a health condition? Memory problems or confusion were considered present based on a response of “YES” to the following question: Are you limited in any way because you have difficulty remembering or because you experience periods of confusion? Sleep disorders were considered present with a “YES” to the following question: Have you ever told a doctor or another health professional that you have difficulty sleeping? Prescription medicine use was defined as answering “YES” to the following question: Have you used or taken medication that requires a prescription in the last 30 days?
This study considered physical activity (PA), sedentary time, body mass index (BMI), smoking (smokers vs. non-smokers), heavy alcohol consumption, sleep duration [25], and oral health [30] as health behavior parameters. Daily physical activity was assessed using the International Physical Activity Questionnaire (IPAQ), which classified activities lasting ≥ 10 min into three categories: vigorous work or recreational activity (VPA), moderate work or recreational activity (MPA), and light walking or bicycle physical activity (LPA). Information on frequency (days per week) and duration (minutes per day) was collected using specific questionnaire items (e.g., PAQ605, PAQ610, PAQ615, PAQ620, PAQ625, PAQ630, PAQ635, PAQ640, PAQ645, PAQ650, PAQ665, PAQ670, PAD675). The intensity of physical activity was determined using metabolic equivalent tasks (METs), with 8.0 assigned to VPA, 4.0 to MPA, and 3.0 to LPA. The total amount of physical activity performed each week was calculated in MET-min/week by summing the VPA, MPA, and LPA MET scores, daily duration in minutes, and number of days per week. Physical activity was classified as low (less than 500 MET-min/week), moderate (500–1000 MET-min/week), or high (>1000 MET-min/week), as previously suggested [31]. BMI was categorized as underweight (<18.5 kg/m2), normal weight (18.5–24.9 kg/m2), overweight (25.5–29.9 kg/m2), or obese (≥30.0 kg/m2).
Blood samples were collected at NHANES mobile examination centers and delivered to the National Center for Environmental Health and Centers for Disease Control and Prevention. Beckman Coulter (Brea, CA, USA) MAXM instruments were used to perform a complete blood count (CBC), with CBC parameters calculated by counting, sizing, automatic diluting, and mixing samples. The systemic immune-inflammation index (SII) was calculated as the product of the platelet and neutrophil counts divided by the lymphocyte count [24]. The systemic inflammatory response index (SIRI) was calculated as the product of the monocyte and neutrophil counts divided by the lymphocyte count [32]. Eosinophil count and red cell distribution width were included. Blood concentrations of lead, cadmium, mercury, and cotinine were also measured. Detailed procedures for specimen collection and processing are available on the NHANES website (https://www.cdc.gov/nchs/nhanes/about/index.html/, accessed on 10 September 2024).
We classified SII, SIRI, eosinophil count, red cell distribution width, and blood levels of lead, cadmium, mercury, and cotinine into quartiles (Q1–Q4) based on their population distributions. This method was chosen because these biomarkers do not have widely accepted clinical cut-off values for predicting the risk of depression. Quartile-based categorization facilitates the identification of potential dose-response relationships, reduces the influence of outliers and skewed distributions, and improves interpretability in epidemiological analyses. Age was maintained as a continuous variable because of its well-established linear relationship with depression and its importance as a covariate in statistical models. Categorizing age may result in the loss of information and decreased model performance; thus, it was left in its original form to maximize analytical accuracy.
Additionally, social and demographic factors included sex (female vs. male), ethnicity (non-Hispanic white, non-Hispanic Black, Mexican American, other Hispanic, other race), education (less than 9th grade, 9–11th grade, high school grad/GED, some college or AA degree, college graduate or above), marital status (married/living with partner, widowed/divorced/separated, never married), and family income to poverty ratio (more than 130% or less than 130%).
2.6. Statistical Analysis
Means and standard deviations were used to represent normally distributed data, while medians and quartiles were used for non-normally distributed data. Categorical variables were expressed as counts and percentages (%), and group comparisons were performed using the chi-square test. Pearson’s correlation analysis was performed for all variables. The variance inflation factor (VIF) was used to detect multicollinearity. Variables with the highest VIF were removed sequentially from the dataset until all variables had a VIF of <4. We used univariate logistic regression analysis to identify significant predictors (p < 0.05) among the extracted socio-demographic, health behavior, and clinical and laboratory parameters. The selected predictors were then entered into a multivariate logistic regression model. The association between risk factors and post-CVD depression was measured using odds ratios (OR) and 95% confidence intervals (CI). In our nomogram model, each risk factor was assigned a point based on its OR. The probability of depression risk was obtained by adding the total score of each risk factor and locating the score on a total-point scale. The accuracy of the nomogram model was assessed using an internal bootstrap method that involved 1000 repeated random samples with their replacements. The discriminative ability and predictive performance of the nomogram model were evaluated using ROC curves and calibration plots. The clinical prediction utility of the model was evaluated using decision curve analysis (DCA) and a clinical impact curve (CIC). All statistical analyses and graph visualizations were performed using R-4.3.2 for Windows [33].
3. Results
3.1. Description of CVD Patients by Depression Status
Table 1 describes CVD patients according to their depression status. Depression was present in 17.9% of the study population, with 17.9% in the training cohort (n = 903) and 18.0% in the validation cohort (n = 302). CVD patients with depression were younger, more likely to be male, Mexican American, or Hispanic, less educated, more likely to live without a partner or never to have married, more likely to be poor, obese, drink alcohol, and smoke; to have asthma, osteoarthritis, stomach or intestinal illness, work limitations, mobility disorders, confusion or memory problems, longer sleep duration, poor dental health, longer sedentary time, and lower physical activity than CVD patients without depression. Additionally, patients with CVD and depression had higher SII, blood cadmium, and cotinine levels but lower SIRI, eosinophil count, blood lead concentration, red blood cell distribution width, and Hg concentration than those without depression.

Table 1.
Descriptive statistics of the study participants by depression status.
Furthermore, except for prescribed medication use, there were significant differences in all other measured parameters between the non-depressed and depressed participants in the training cohort. Except for SII, red cell distribution width, eosinophil count, prescribed medication use, and sedentary time, all other measured parameters showed significant differences between non-depressed and depressed participants in the validation cohort (Appendix A Table A1). This implies that the training and validation cohorts were somewhat heterogeneous.
3.2. Risk Factors for Post-CVD Depression
Table 2 shows the outcomes of the univariate and multivariate logistic regression analyses for the entire training and validation cohorts. Univariate logistic regression revealed that positive risk factors for depression were female sex, non-white ethnicity (i.e., Mexican American, Hispanic, non-Hispanic Black, and other races), living alone (i.e., not living with a partner or never married), lower family income to poverty ratio, drinking, smoking, eosinophils, blood cadmium and cotinine levels, asthma, osteoarthritis, stomach or intestinal illness, work limitations, mobility disorders, confusion or memory problems, sleep disorders, poor dental health, and sedentary time. Negative risk factors for depression included age, education, BMI, SII, SIRI, red cell distribution width, blood lead and mercury levels, sleep duration, and physical activity. Multifactorial logistic regression revealed that the positive risk factors for depression were female sex, race, never married status, lower family income to poverty ratio, drinking, SIRI, eosinophil counts, blood cadmium level, asthma, osteoarthritis, stomach or intestinal illness, work limitations, confusion or memory problems, sleep disorders, and sedentary time. Negative risk factors for depression included age, education, smoking, SII, SIRI, red blood cell distribution width, blood lead, mercury and cotinine levels, and physical activity.
Table 2.
Univariate and multivariate logistic regression analyses of risk factors for depression in patients with cardiovascular disease.
3.3. Elimination of Multicollinearity
The existence of multicollinearity was checked by calculating the variance inflation factor (VIF). SII, SIRI, NLR, and AISI were excluded from the prediction model because their VIFs exceeded 4 (Appendix A Table A2). A web-based dynamic nomogram for predicting prediabetes risk was built using the selected features.
3.4. Goodness of Fit Testing
The Hosmer-Lemeshow (HL) test is a statistical tool that assesses the performance and robustness of a nomogram model by comparing the observed and expected frequencies calculated from the model. The H-L test yielded a p-value of 0.6397, suggesting a good fit for the nomogram prediction model.
3.5. Construction of a Risk Prediction Nomogram for Depression
A nomogram model was constructed to predict the risk of depression in patients with CVD. Each predictor was assigned a score from 0 to 100, and a vertical line was drawn downward from the total points to represent the likelihood of depression (Figure 2). Higher scores suggest an increased risk of post-CVD depression. The risk of depression can also be predicted using our web calculator (https://zhaol2022713269.shinyapps.io/DynNomapp/, accessed on 12 March 2025).
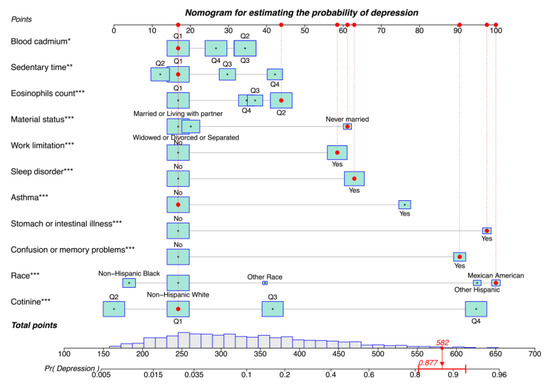
Figure 2.
Nomogram for estimating the probability of depression. Asterisks represent statistical significance: * p < 0.05, ** p < 0.01, and *** p < 0.001.
Consider the following scenario: Mexican American (scale score of 100), never married (scale score of 61), first quantile blood cadmium (scale score of 17), first quantile sedentary time (scale score of 17), second quantile eosinophil count (scale score of 43), first quantile blood cotinine (scale score of 17), with work limitations (scale score of 58), sleep disorders (scale score of 63), stomach or intestinal illness (scale score of 98), and confusion or memory problems (scale score of 91), but no asthma (scale score of 17). The corresponding scores of the case on the column chart were 100, 61, 17, 17, 43, 17, 58, 63, 98, 91, and 17 points, respectively, with a total score of 582 points, and the corresponding risk probability of depression was 0.877 (87.7%).
The depression risk scoring model had a good discriminative AUC of 0.852 (95% CI = 0.842–0.862, p < 0.001) in the training cohort, with a sensitivity of 83.28% and a specificity of 72.95% (Figure 3A). The nomogram model also had a high AUC of 0.856 (95% CI: 0.838–0.872, p < 0.001) in the validation cohort, with a sensitivity of 79.14% and specificity of 76.65 (Figure 3B), indicating good discriminative ability.
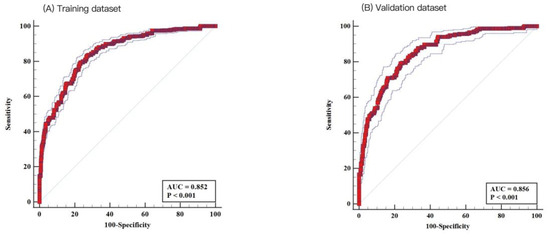
Figure 3.
Receiver operating characteristic (ROC) analysis. Nomogram demonstrated good discrimination for depression in patients with cardiovascular disease: (A) the training dataset (area under the curve [AUC]: 0.852; 95% confidence interval [CI]: 0.842–0.862) and (B) the testing dataset (AUC: 0.856; 95% CI: 0.838–0.872).
3.6. Performance Assessment of the Risk Prediction Nomogram for Depression
Internal validation using 1000 bootstrap samples showed that the C-index of the nomogram was 0.852 in the training cohort, with a mean absolute error of 0.012 (Figure 4A). The nomogram calibration plot in the training cohort demonstrated acceptable calibration, with a Brier score of 0.102, indicating good calibration with no difference between the actual rate and predicted probabilities. Internal validation using 1000 bootstrap samples showed that the C-index of the nomogram model was 0.863 in the validation cohort, with a mean absolute error of 0.017 (Figure 4B). The nomogram calibration plot demonstrated acceptable calibration, with a Brier score of 0.103, again indicating a close match between the predicted and observed depression rates.
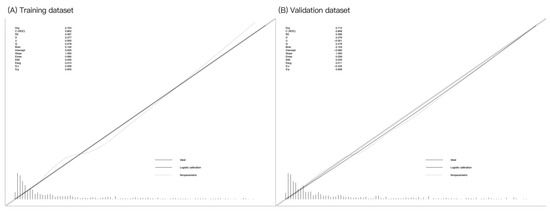
Figure 4.
Calibration curves for the training and validation datasets. Calibration plots showing the high accuracy of the absolute risk prediction for depression: (A) training dataset (Emax = 0.060, Eavg = 0.012, p = 0.955) and (B) testing dataset (Emax = 0.039, Eavg = 0.011, p = 0.658). If the nomogram has good calibration, a 45-degree diagonal line will be present between the actual depression rate (y-axis) and predicted depression probability (x-axis). The lack of statistical significance (p > 0.05) indicates good calibration, with no difference between the actual and predicted probabilities.
DCA was used to evaluate the clinical utility of our nomogram model (Figure 5). The DCA of the training cohort (red dashed line) indicates that the nomogram has a greater net benefit than treated or not treated when the threshold probability ranges from 0.02 to 0.91. The DCA of the validation cohort (blue dashed line) also indicates that the developed nomogram provides a greater net benefit than treatment when the threshold probability falls between 0.05 and 0.90.
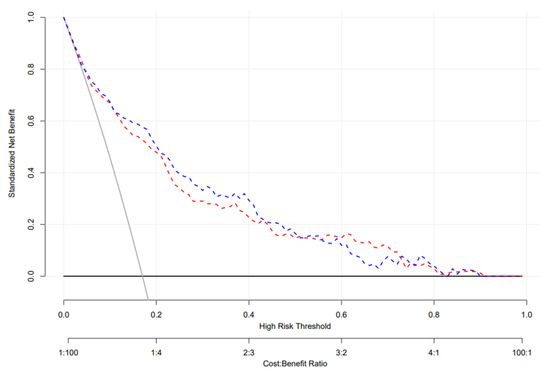
Figure 5.
Decision curve analysis of the testing and validation datasets. The decision curve provided greater benefits of the prediction model across the range of 15 to 80%. The blue and red dashed lines indicate the nomograms in the training and validation datasets, respectively; the brown solid line indicates the assumption that all patients are treated, and the dark solid line indicates the assumption that no patient is treated.
Finally, CIC analysis was used for the risk stratification of depression. At a low-risk threshold, the number of depressed populations based on the nomogram model differed from the true depression populations (Figure 6A). At the high-risk threshold, the two CIC curves became more closely aligned with the validation cohort, with a greater degree of coincidence (Figure 6B). Overall, our findings indicate that our nomogram model has greater clinical utility for predicting depression in CVD survivors than intervention or non-intervention.
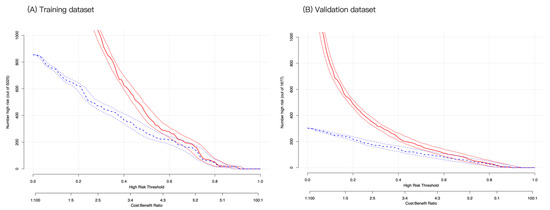
Figure 6.
Clinical impact curve analysis for probability stratification of 1000 subjects using a bootstrap random sampling method. At the same horizontal coordinate (high-risk threshold), the vertical coordinates of high-risk patients (blue dashed line) and high-risk patients with depression (red solid line) were compared in the training (A) and validation (B) cohorts. If the vertical coordinate of the red solid line is higher than that of the blue dashed line, it is considered clinically significant at that point.
4. Discussion
This population-based cross-sectional study aimed to develop and validate a nomogram for predicting depression risk in patients with CVD. Multivariate regression analysis identified 11 predictors of depression. ROC analysis revealed that our nomogram had a high predictive ability for depression in the datasets used in this study. The calibration curve showed good agreement between the predicted and observed depression probabilities. Decision curve and clinical impact curve analyses showed that our nomogram can be used to predict depression risk in patients with CVD.
Our nomogram model revealed that the risk of depression in patients with CVD varies by race and social and demographic characteristics. In this study, we found that Mexican Americans and other Hispanics were more likely to experience post-CVD depression than non-Hispanic whites. In line with this, a growing body of research shows that Mexican Americans are disproportionately affected by depression disorders [34]. Many risk factors have been linked to mental illness in Mexican Americans, including low socioeconomic status, frequent drinking, health conditions, discrimination, and acculturation [35]. Additionally, those who had never married had a higher risk of developing depression than those who were married, with no difference between those who were married and living with a partner and those living alone. In support of the current findings, living alone (i.e., separated, divorced, widowed, or never married) was a positive risk factor for depression in various populations [36]. There are several possible explanations for this. First, the socio-demographics and lifestyles of Mexican Americans may contribute to increased post-CVD depression risk by activating stress-response pathways (i.e., the sympathetic nervous system and the hypothalamic-pituitary-pituitary-adrenal axis), thereby altering cardiovascular function and structure [37]. Second, psychological stress, such as loneliness and social isolation, may induce unhealthy behavioral changes, such as inactivity, poor diet, smoking, alcoholism, and obesity, as well as increased stress reactivity and exaggerated inflammatory responses, contributing to increased depression and CVD risk [38].
Our findings indicated that post-CVD depression risk is related to health conditions such as stomach or intestinal illness, asthma, and cognitive dysfunction (i.e., confusion and memory problems). In agreement with the current findings, previous studies have linked depression with gastrointestinal symptoms [39] and asthma [40]. Depression may be linked to gastrointestinal issues via the microbiota-gut-brain axis [41], as demonstrated in patients with depression [42]. Pathologically, health conditions can increase the risk of developing depression by triggering anxiety and stress [43], altering brain function and structure [44], or adding medications [45]. Asthma is a psychosomatic disease that causes emotional stress, which can exacerbate symptoms by activating the sympathetic nervous system and the hypothalamic-pituitary-adrenocortical axis [46]. Furthermore, some explanations can be provided for the association between confusion or memory problems and post-CVD depression risk. First, brain structural changes due to hypoperfusion or infarction may contribute to cognitive dysfunction in patients with CVD [47]. Second, impaired cognition in patients with CVD may result from the accumulation of common risk factors such as hypertension, diabetes, dyslipidemia, and atherosclerosis [48]. Third, medications such as anticholinergic drugs prescribed to patients with CVD may induce confusion or memory loss [49].
Our findings indicate that the risk of post-CVD depression is also related to sleep disorders and work limitations. Depressed individuals are more likely to experience sleep disorders than non-depressed individuals [50], implying a strong link between the two mental health conditions. Sleep disturbances, for example, have long been regarded as the most important secondary symptoms of depression. Depression is widely considered a risk factor for insomnia because it disrupts both homeostatic and circadian sleep drives [51]. In addition, sleep deficiency can lead to an inflammatory response that affects peripheral arteries and sympathetic and sensory-motor nerves, leading to blood elevation and increased CVD risk [52]. Depression and CVD impact work limitations. In a retrospective observational study, depression was linked to poor work performance in 100 patients with CVD undergoing a cardiac rehabilitation program [53]. A large, nationally representative survey of the Australian population (n = 8841) showed that depression and CVD are synergistically associated with poor work performance [19]. The association between work productivity loss and CVDs has been well-reviewed and summarized in a study [54]. Taken together, the current and previous studies show that depression and CVD have an additive or synergistic effect on patients’ sleep quality and work performance [55].
Our findings suggest that the risk of depression in patients with CVD is linked to sedentary behavior and cotinine. Sedentary behavior is a well-known risk factor for physical and mental health issues. Our findings support the importance of sedentary time and cotinine levels in predicting depression risk in patients with CVD. Sedentarism-related inflammatory responses, such as increased interleukin-6 and decreased brain-derived nerve growth factor levels, are recognized as pathological causes of emotional stress and depression [56]. Cotinine, the primary metabolite of nicotine, has been shown to improve psychiatric symptoms [57] and reduce various consequences of chronic stress, such as reduced working memory and synaptic loss [58]. Given that secondary smoking is a significant risk factor for CVD [59], caution is necessary when considering the association between cotinine and depression.
Metabolomics is a promising tool for understanding the role of heavy metal exposure in the onset and progression of depression [60]. Cadmium is a neurotoxin that can cross the blood-brain barrier and cause oxidative stress, neuro-inflammation, impaired ciliogenesis, and neuronal cell death, resulting in brain damage and mental disorders [61]. We found that the risk of depression was positively related to blood cadmium levels, which supports previous findings on the relationship between blood cadmium and depression in a nationwide sample of young adults [62]. At the same time, blood cadmium levels can be modulated by lifestyle factors such as physical activity. A cross-sectional study involving 5560 adults aged 20 years from the NHANES 2015–2018 showed that the impact of blood cadmium levels on depression risk differed by activity status; the high-intensity activity group had the lowest depression risk, while the inactive group had the highest depression risk [63]. The prognostic role of blood cadmium in depression remains to be confirmed in prospective cohort studies.
Finally, our findings indicate a pathological link between eosinophil counts and depression. Several lines of evidence implicate immune dysfunction in the pathogenesis of depression. Eosinophils are pleiotropic leukocytes that play a role in the initiation and transmission of inflammatory responses, and their elevation is used as a biomarker for mental health conditions like anxiety and depression [64]. A prospective population-based study from Sweden found a potential causal link between duodenal inflammation (mast cells and eosinophils) and psychological distress in functional gut disorders [65]. The relationship between eosinophil count and depression has been thoroughly reviewed and summarized in a scoping review paper of 34 anxiety and depression studies [66].
Taken together, depression is a complex mental illness with far-reaching consequences for an individual’s health. CVD sequelae cause functional impairments, lower the quality of life, and impede reintegration into the family and society. Patients with CVD who do not receive medical care are less likely to return to work than those who do [67]. As a result, CVD has devastating effects on both patients and their families. The risk of depression in patients with CVD is linked to a variety of factors, including inflammatory responses, impaired neuroplasticity, genetic inheritance, the presence of specific metabolites, comorbidities, and unhealthy lifestyles.
This study had some limitations that should be considered. First, several variables used in this study were self-reported, including smoking status, alcohol consumption, sedentary time, and sleep disorders. Therefore, we cannot rule out the possibility of subjective bias influencing the objectivity of the results. Second, the external validation of this study relied on the allocation ratio method, with data sourced solely from the NHANES database. While this approach provides a robust framework for model development and internal validation, it limits the generalizability of the findings to other populations or settings. Ideally, external validation should involve independent datasets from different regions or healthcare systems to confirm the model’s applicability in diverse clinical settings. However, this was not feasible due to differences in data collection practices and available variables across databases. Third, the cross-sectional nature of this study made it impossible to establish a causal relationship between exposure and outcome. Prospective cohort studies are required to clarify these temporal relationships and determine the causal pathways, which would strengthen the predictive validity of the identified risk factors. Third, the cross-sectional nature of this study imposes some limitations. This prevents us from establishing any causal relationships between exposure and outcome because the data were collected at a single time point with no longitudinal follow-up. Furthermore, because this study was based on NHANES data collected between 2007 and 2018, the interpretation and generalizability of the findings are limited by time. These findings reflect associations specific to that period and may not fully capture more recent trends or population shifts. Prospective cohort studies are required to clarify these temporal relationships and identify causal pathways to improve the predictive validity of the identified risk factors. Fourth, our variable selection process used univariate logistic regression to identify predictors before incorporating them into a multivariable model. While this approach reduces noise and improves model interpretability, it has significant limitations. Specifically, univariate screening may exclude variables that are not individually significant but could contribute significantly to the predictive performance when combined with other covariates. This can result in the omission of significant predictors and potentially biased model estimates. Lastly, while the HL test-based calibration of our prediction model provides a good overall fit, it has well-known limitations. In a large sample, the HL test may become overly sensitive to minor deviations or fail to detect significant miscalibrations within specific risk strata. Furthermore, the results may differ depending on how the data are organized, affecting their reliability. As a result, using only the HL test may not provide an accurate picture of model calibration. To address this, we presented calibration plots that visually assessed the agreement between the predicted and observed probabilities across risk levels. The plots show that the model remained well-calibrated across the risk spectrum. Nonetheless, we acknowledge that more comprehensive quantitative measures, such as calibration-in-the-large and calibration slope, would improve the assessment of the model performance.
5. Conclusions
Our findings suggest that multiple factors are involved in the risk of depression in patients with CVD. To the best of our knowledge, this is the first study to design and validate a nomogram for predicting depression in patients with CVD. The nomogram model incorporates diverse sets of predictors related to social and demographic factors, comorbidities, health behaviors, metabolites, and exposure to toxic substances. The performance assessment of the nonogram model demonstrated its potential clinical utility for the early screening of depression risk in patients with CVD.
Author Contributions
Conceptualization, Z.L., Y.Z. and H.K.; methodology, Z.L., Y.Z. and H.K.; software, Z.L., Y.Z. and H.K.; validation, Z.L., Y.Z. and H.K.; formal analysis, Z.L., Y.Z. and H.K.; resources, Z.L., Y.Z. and H.K.; data curation, Z.L., Y.Z. and H.K.; writing—original draft preparation, Z.L., Y.Z. and H.K.; writing—review and editing, Z.L., Y.Z. and H.K.; visualization, Z.L., Y.Z. and H.K. All authors have read and agreed to the published version of the manuscript.
Funding
This research received no external funding.
Institutional Review Board Statement
This study was exempted from the Institutional Review Board (IRS) review because it was a secondary analysis of existing data sets.
Informed Consent Statement
We used the MHANES 2017–2018 for this study. Informed consent was not required for this study because it was a secondary analysis of existing data sets.
Data Availability Statement
The datasets generated and/or analyzed during the current study are available in the NHANES [https://www.cdc.gov/nchs/nhanes/about/index.html/, accessed on 10 September 2024].
Acknowledgments
This study used data from the NHANES. The author thanks the database staff team for their efforts and all participants involved in contributing to the data.
Conflicts of Interest
The authors declare no conflicts of interest.
Abbreviations
The following abbreviations are used in this manuscript:
| CVD | Cardiovascular disease |
| AUC | Area under the curve |
| WHO | World Health Organization |
| NCHS | National Center for Health Statistics |
| CDC | Center for Disease Control and Prevention |
| NHNES | National Health and Nutrition Examination Survey |
| BIC | Bayesian Information Criterion |
| ROCAUC | Area the under the receiver operating characteristic curve |
| PRAUC | Area under the precision-recall curve |
| MCQ | Medical conditions questionnaire |
| PHQ-9 | Nine-item Patient Health Questionnaire |
| DSM-5 | Diagnostic and Statistical Manual of Mental Disorders, firth edition |
| PA | Physical activity |
| BMI | Body mass index |
| LPA | Light physical activity |
| MPA | Moderate physical activity |
| VPA | Vigorous physical activity |
| METs | Metabolic equivalent tasks |
| CBC | Complete blood count |
| SII | Systemic immune-inflammation index |
| SIRI | Systemic inflammatory response index |
| VIF | Variance inflation factor |
| OR | Odds ratio |
| CI | Confidence interval |
| DCA | Decision curve analysis |
| CIC | Clinical impact curve |
| HL | Hosmer-Lemeshow |
Appendix A
Table A1.
Descriptive statistics of the study participants by depression status in each cohort.
Table A1.
Descriptive statistics of the study participants by depression status in each cohort.
| Factors | Levels | Training Cohort (n = 5025) | p-Value | Validation Cohort (n = 1677) | p-Value | ||
|---|---|---|---|---|---|---|---|
| Not Depressed | Depressed | Not Depressed | Depressed | ||||
| (n = 4122) | (n = 903) | (n = 1375) | (n = 302) | ||||
| Age (mean (SD)) | 69.04 (10.54) | 59.16 (11.68) | <0.0001 | 69.25 (10.77) | 59.10 (12.27) | <0.0001 | |
| Gender (%) | Male | 2519 (61.11) | 424 (46.95) | <0.0001 | 833 (60.58) | 138 (45.70) | <0.0001 |
| Female | 1603 (38.89) | 479 (53.05) | 542 (39.42) | 164 (54.30) | |||
| Race (%) | Non-Hispanic White | 2618 (63.51) | 444 (49.17) | <0.0001 | 879 (63.93) | 146 (48.34) | <0.0001 |
| Mexican American | 325 (7.88) | 122 (13.51) | 119 (8.65) | 42 (13.91) | |||
| Other Hispanic | 261 (6.33) | 116 (12.85) | 79 (5.75) | 39 (12.91) | |||
| Non-Hispanic Black | 823 (19.97) | 179 (19.82) | 271 (19.71) | 63 (20.86) | |||
| Other Race | 95 (2.30) | 42 (4.65) | 27 (1.96) | 12 (3.97) | |||
| Education (%) | Less Than 9th Grade | 655 (15.89) | 218 (24.14) | <0.0001 | 232 (16.87) | 60 (19.87) | <0.0001 |
| 9-11th Grade | 751 (18.22) | 196 (21.71) | 259 (18.84) | 72 (23.84) | |||
| High School Grad/GED | 1112 (26.98) | 244 (27.02) | 364 (26.47) | 82 (27.15) | |||
| Some College or AA degree | 1012 (24.55) | 224 (24.81) | 331 (24.07) | 83 (27.48) | |||
| College Graduate or above | 592 (14.36) | 21 (2.33) | 189 (13.75) | 5 (1.66) | |||
| Material status (%) | Married/Living with partner | 2392 (58.03) | 393 (43.52) | <0.0001 | 773 (56.22) | 139 (46.03) | <0.0001 |
| Widowed/Divorced/Separated | 1488 (36.10) | 375 (41.53) | 520 (37.82) | 119 (39.40) | |||
| Never married | 242 (5.87) | 135 (14.95) | 82 (5.96) | 44 (14.57) | |||
| Family income to poverty ratio (%) | More than 130% | 2829 (68.63) | 364 (40.31) | <0.0001 | 955 (69.45) | 135 (44.70) | <0.0001 |
| Less than 130% | 1293 (31.37) | 539 (59.69) | 420 (30.55) | 167 (55.30) | |||
| BMI (%) | Underweight (<18.5) | 19 (0.46) | 5 (0.55) | <0.0001 | 8 (0.58) | 4 (1.32) | 0.0017 |
| Normal (18.5 to <25) | 690 (16.74) | 128 (14.17) | 229 (16.65) | 48 (15.89) | |||
| Overweight (25 to <30) | 1316 (31.93) | 195 (21.59) | 449 (32.65) | 68 (22.52) | |||
| Obese (30 or greater) | 2097 (50.87) | 575 (63.68) | 689 (50.11) | 182 (60.26) | |||
| Alcohol status (%) | Non-drinker | 1637 (39.71) | 243 (26.91) | <0.0001 | 573 (41.67) | 79 (26.16) | <0.0001 |
| Drinker | 2485 (60.29) | 660 (73.09) | 802 (58.33) | 223 (73.84) | |||
| Smoking status (%) | Never smoker | 1524 (36.97) | 266 (29.46) | <0.0001 | 498 (36.22) | 86 (28.48) | <0.0001 |
| Former smoker | 1930 (46.82) | 263 (29.13) | 673 (48.95) | 89 (29.47) | |||
| Current smoker | 668 (16.21) | 374 (41.42) | 204 (14.84) | 127 (42.05) | |||
| SII (%) | Q1 | 1004 (24.36) | 266 (29.46) | 0.0001 | 336 (24.44) | 72 (23.84) | 0.2379 |
| Q2 | 1106 (26.83) | 184 (20.38) | 328 (23.85) | 57 (18.87) | |||
| Q3 | 1010 (24.50) | 216 (23.92) | 363 (26.40) | 90 (29.80) | |||
| Q4 | 1002 (24.31) | 237 (26.25) | 348 (25.31) | 83 (27.48) | |||
| SIRI (%) | Q1 | 977 (23.70) | 300 (33.22) | <0.0001 | 301 (21.89) | 101 (33.44) | 0.0002 |
| Q2 | 1055 (25.59) | 209 (23.15) | 353 (25.67) | 58 (19.21) | |||
| Q3 | 1016 (24.65) | 237 (26.25) | 357 (25.96) | 74 (24.50) | |||
| Q4 | 1074 (26.06) | 157 (17.39) | 364 (26.47) | 69 (22.85) | |||
| Eosinophils count (%) | Q1 | 1440 (34.93) | 252 (27.91) | 0.0001 | 461 (33.53) | 88 (29.14) | 0.0318 |
| Q2 | 1307 (31.71) | 343 (37.98) | 425 (30.91) | 120 (39.74) | |||
| Q3 | 674 (16.35) | 143 (15.84) | 249 (18.11) | 47 (15.56) | |||
| Q4 | 701 (17.01) | 165 (18.27) | 240 (17.45) | 47 (15.56) | |||
| Red cell distribution width (%) | Q1 | 1135 (27.54) | 305 (33.78) | 0.0024 | 381 (27.71) | 99 (32.78) | 0.1175 |
| Q2 | 917 (22.25) | 186 (20.60) | 294 (21.38) | 64 (21.19) | |||
| Q3 | 1048 (25.42) | 214 (23.70) | 340 (24.73) | 78 (25.83) | |||
| Q4 | 1022 (24.79) | 198 (21.93) | 360 (26.18) | 61 (20.20) | |||
| Blood lead (%) | Q1 | 970 (23.53) | 301 (33.33) | <0.0001 | 360 (26.18) | 106 (35.10) | 0.0162 |
| Q2 | 1026 (24.89) | 203 (22.48) | 323 (23.49) | 63 (20.86) | |||
| Q3 | 1029 (24.96) | 232 (25.69) | 351 (25.53) | 72 (23.84) | |||
| Q4 | 1097 (26.61) | 167 (18.49) | 341 (24.80) | 61 (20.20) | |||
| Blood cadmium (%) | Q1 | 1103 (26.76) | 165 (18.27) | <0.0001 | 371 (26.98) | 46 (15.23) | <0.0001 |
| Q2 | 1107 (26.86) | 172 (19.05) | 363 (26.40) | 67 (22.19) | |||
| Q3 | 974 (23.63) | 232 (25.69) | 360 (26.18) | 78 (25.83) | |||
| Q4 | 938 (22.76) | 334 (36.99) | 281 (20.44) | 111 (36.75) | |||
| Mercury (%) | Q1 | 992 (24.07) | 307 (34.00) | <0.0001 | 312 (22.69) | 84 (27.81) | 0.0020 |
| Q2 | 1035 (25.11) | 210 (23.26) | 347 (25.24) | 82 (27.15) | |||
| Q3 | 975 (23.65) | 250 (27.69) | 346 (25.16) | 86 (28.48) | |||
| Q4 | 1120 (27.17) | 136 (15.06) | 370 (26.91) | 50 (16.56) | |||
| Cotinine (%) | Q1 | 1137 (27.58) | 150 (16.61) | <0.0001 | 400 (29.09) | 48 (15.89) | <0.0001 |
| Q2 | 1134 (27.51) | 110 (12.18) | 359 (26.11) | 44 (14.57) | |||
| Q3 | 1020 (24.75) | 211 (23.37) | 350 (25.45) | 66 (21.85) | |||
| Q4 | 831 (20.16) | 432 (47.84) | 266 (19.35) | 144 (47.68) | |||
| Asthma (%) | No | 3379 (81.97) | 503 (55.70) | <0.0001 | 1148 (83.49) | 165 (54.64) | <0.0001 |
| Yes | 743 (18.03) | 400 (44.30) | 227 (16.51) | 137 (45.36) | |||
| Osteoarthritis (%) | No | 1626 (39.45) | 225 (24.92) | <0.0001 | 549 (39.93) | 82 (27.15) | <0.0001 |
| Yes | 2496 (60.55) | 678 (75.08) | 826 (60.07) | 220 (72.85) | |||
| Stomach or intestinal illness (%) | No | 3757 (91.15) | 596 (66.00) | <0.0001 | 1243 (90.40) | 198 (65.56) | <0.0001 |
| Yes | 365 (8.85) | 307 (34.00) | 132 (9.60) | 104 (34.44) | |||
| Work limitation (%) | No | 2540 (61.62) | 238 (26.36) | <0.0001 | 856 (62.25) | 75 (24.83) | <0.0001 |
| Yes | 1582 (38.38) | 665 (73.64) | 519 (37.75) | 227 (75.17) | |||
| Mobility disorder (%) | No | 2737 (66.40) | 488 (54.04) | <0.0001 | 917 (66.69) | 167 (55.30) | 0.0002 |
| Yes | 1385 (33.60) | 415 (45.96) | 458 (33.31) | 135 (44.70) | |||
| Confusion memory problems (%) | No | 3380 (82.00) | 457 (50.61) | <0.0001 | 1159 (84.29) | 160 (52.98) | <0.0001 |
| Yes | 742 (18.00) | 446 (49.39) | 216 (15.71) | 142 (47.02) | |||
| Prescribed medicine use (%) | No | 54 (1.31) | 10 (1.11) | 0.7429 | 7 (0.51) | 5 (1.66) | 0.0778 |
| Yes | 4068 (98.69) | 893 (98.89) | 1368 (99.49) | 297 (98.34) | |||
| Sleep duration (%) | <6 | 534 (12.95) | 104 (11.52) | <0.0001 | 179 (13.02) | 36 (11.92) | <0.0001 |
| ≤8 | 2864 (69.48) | 435 (48.17) | 969 (70.47) | 139 (46.03) | |||
| ≤12 | 724 (17.56) | 364 (40.31) | 227 (16.51) | 127 (42.05) | |||
| Sleep disorder (%) | No | 2479 (60.14) | 276 (30.56) | <0.0001 | 808 (58.76) | 80 (26.49) | <0.0001 |
| Yes | 1643 (39.86) | 627 (69.44) | 567 (41.24) | 222 (73.51) | |||
| Teeth health (%) | Good | 2423 (58.78) | 376 (41.64) | <0.0001 | 808 (58.76) | 135 (44.70) | <0.0001 |
| Fair | 924 (22.42) | 215 (23.81) | 303 (22.04) | 71 (23.51) | |||
| Poor | 775 (18.80) | 312 (34.55) | 264 (19.20) | 96 (31.79) | |||
| Sedentary time (%) | Q1 | 1534 (37.21) | 307 (34.00) | <0.0001 | 501 (36.44) | 100 (33.11) | 0.0505 |
| Q2 | 1089 (26.42) | 211 (23.37) | 351 (25.53) | 78 (25.83) | |||
| Q3 | 762 (18.49) | 232 (25.69) | 273 (19.85) | 80 (26.49) | |||
| Q4 | 737 (17.88) | 153 (16.94) | 250 (18.18) | 44 (14.57) | |||
| Physical activity (%) | Vigorous | 1212 (29.40) | 185 (20.49) | <0.0001 | 390 (28.36) | 43 (14.24) | <0.0001 |
| Moderate | 390 (9.46) | 76 (8.42) | 127 (9.24) | 22 (7.28) | |||
| Low | 2520 (61.14) | 642 (71.10) | 858 (62.40) | 237 (78.48) | |||
BMI, body mass index; SII, systemic immune-inflammation index; SIRI, systemic inflammatory response index.
Table A2.
The VIF values of the selected variables.
Table A2.
The VIF values of the selected variables.
| Variable | lambda.1se |
|---|---|
| Race | 1.310458 |
| Material status | 2.293593 |
| Blood cadmium | 3.727409 |
| Cotinine | 2.470422 |
| Asthma | 1.367038 |
| Stomach intestinal illness | 1.179397 |
| Confusion memory problems | 1.753833 |
| Sleep disorder | 2.169977 |
| Eosinophils count | 2.537814 |
| Walk limitation | 1.673927 |
| Sedentary time | 3.124892 |
Appendix B
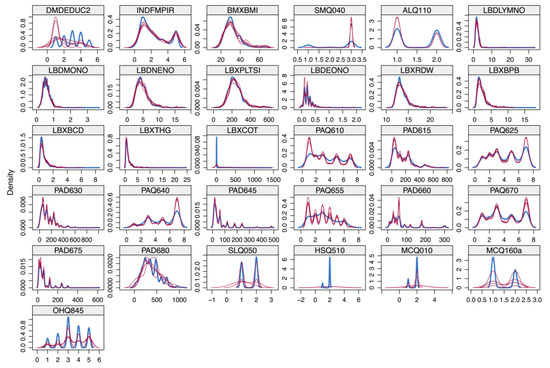
Figure A1.
Effects of data imputation.
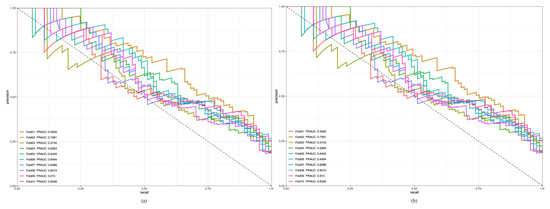
Figure A2.
Results of 10-fold cross-validation for the training (a) and testing datasets (b).
References
- Adhikary, D.; Barman, S.; Ranjan, R.; Stone, H. A systematic review of major cardiovascular risk factors: A growing global health concern. Cureus 2022, 14, e30119. [Google Scholar] [CrossRef]
- Liu, J.; Liu, Y.; Ma, W.; Tong, Y.; Zheng, J. Temporal and spatial trend analysis of all-cause depression burden based on Global Burden of Disease (GBD) 2019 study. Sci. Rep. 2024, 14, 12346. [Google Scholar] [CrossRef]
- Basha, E.A.; Mengistu, B.T.; Engidaw, N.A.; Wubetu, A.D.; Haile, A.B. Suicidal ideation and its associated factors among patients with major depressive disorder at Amanuel Mental Specialized Hospital, Addis Ababa, Ethiopia. Neuropsychiatr. Dis. Treat. 2021, 17, 1571–1577. [Google Scholar] [CrossRef]
- Kwapong, Y.A.; Boakye, E.; Khan, S.S.; Honigberg, M.C.; Martin, S.S.; Oyeka, C.P.; Hays, A.G.; Natarajan, P.; Mamas, M.A.; Blumenthal, R.S.; et al. Association of depression and poor mental health with cardiovascular disease and suboptimal cardiovascular health among young adults in the United States. J. Am. Heart Assoc. 2023, 12, e028332. [Google Scholar] [CrossRef]
- Li, X.; Zhou, J.; Wang, M.; Yang, C.; Sun, G. Cardiovascular disease and depression: A narrative review. Front. Cardiovasc. Med. 2023, 10, 1274595. [Google Scholar] [CrossRef]
- Carney, R.M.; Freedland, K.E. Depression and coronary heart disease. Nat. Rev. Cardiol. 2017, 14, 145–155. [Google Scholar] [CrossRef]
- Rutledge, T.; Reis, V.A.; Linke, S.E.; Greenberg, B.H.; Mills, P.J. Depression in heart failure a meta-analytic review of prevalence, intervention effects, and associations with clinical outcomes. J. Am. Coll. Cardiol. 2006, 48, 1527–1537. [Google Scholar] [CrossRef]
- Smith, D.F.; Sterndorff, B.; Røpcke, G.; Gustavsen, E.M.; Hansen, J.K. Prevalence and severity of anxiety, depression and Type A behaviors in angina pectoris. Scand. J. Psychol. 1996, 37, 249–258. [Google Scholar] [CrossRef]
- Ayerbe, L.; Ayis, S.; Wolfe, C.D.; Rudd, A.G. Natural history, predictors and outcomes of depression after stroke: Systematic review and meta-analysis. Br. J. Psychiatry 2013, 202, 14–21. [Google Scholar] [CrossRef]
- Wynn, A. Unwarranted emotional distress in men with ischaemic heart disease (IHD). Med. J. Aust. 1967, 2, 847–851. [Google Scholar] [CrossRef]
- Cay, E.L.; Vetter, N.; Philip, A.E.; Dugard, P. Psychological status during recovery from an acute heart attack. J. Psychosom. Res. 1972, 16, 425–435. [Google Scholar] [CrossRef]
- Lichtman, J.H.; Froelicher, E.S.; Blumenthal, J.A.; Carney, R.M.; Doering, L.V.; Frasure-Smith, N.; Freedland, K.E.; Jaffe, A.S.; Leifheit-Limson, E.C.; Sheps, D.S.; et al. Depression as a risk factor for poor prognosis among patients with acute coronary syndrome: Systematic review and recommendations: A scientific statement from the American Heart Association. Circulation 2014, 129, 1350–1369. [Google Scholar] [CrossRef]
- Khandaker, G.M.; Zuber, V.; Rees, J.M.B.; Carvalho, L.; Mason, A.M.; Foley, C.N.; Gkatzionis, A.; Jones, P.B.; Burgess, S. Correction: Shared mechanisms between coronary heart disease and depression: Findings from a large UK general population-based cohort. Mol. Psychiatry 2021, 26, 3659–3661, Erratum in Mol. Psychiatry 2020, 25, 1477–1486. [Google Scholar] [CrossRef]
- Borsboom, D. A network theory of mental disorders. World Psychiatry 2017, 16, 5–13. [Google Scholar] [CrossRef]
- Fel, S.; Jurek, K.; Lenart-Kłoś, K. The relationship between socio-demographic factors and depression: A cross sectional study among civilian participants in hostilities in Ukraine. Sci. Rep. 2023, 13, 21897. [Google Scholar] [CrossRef]
- Ge, L.; Yap, C.W.; Ong, R.; Heng, B.H. Social isolation, loneliness and their relationships with depressive symptoms: A population-based study. PLoS ONE 2017, 12, e0182145. [Google Scholar] [CrossRef]
- Matcham, F.; Simblett, S.K.; Leightley, D.; Dalby, M.; Siddi, S.; Haro, J.M.; Lamers, F.; Penninx, B.W.H.J.; Bruce, S.; Nica, R.; et al. The association between persistent cognitive difficulties and depression and functional outcomes in people with major depressive disorder. Psychol. Med. 2023, 53, 6334–6344. [Google Scholar] [CrossRef]
- Karki, P.; Shahi, P.V.; Sapkota, K.P.; Bhandari, R.; Adhikari, N.; Shrestha, B. Depressive symptoms and associated factors among persons with physical disabilities in disability care homes of Kathmandu district, Nepal: A mixed method study. PLoS Glob. Public Health 2023, 3, e0001461. [Google Scholar] [CrossRef]
- O’Neil, A.; Williams, E.D.; Stevenson, C.E.; Oldenburg, B.; Sanderson, K. Co-morbid depression is associated with poor work outcomes in persons with cardiovascular disease (CVD): A large, nationally representative survey in the Australian population. BMC Public Health 2012, 12, 47. [Google Scholar] [CrossRef]
- Nguyen, H.D.; Kim, M.S. Interactions between cadmium, lead, mercury, and arsenic and depression: A molecular mechanism involved. J. Affect. Disord. 2023, 327, 315–329. [Google Scholar] [CrossRef]
- Kim, H.; Yoo, J.; Han, K.; Jeon, H.J. Physical activity and cardiovascular health in depression: Links between changes in physical activity and cardiovascular risk. Gen. Hosp. Psychiatry 2022, 78, 35–41. [Google Scholar] [CrossRef]
- Shiga, T. Depression and cardiovascular diseases. J. Cardiol. 2023, 81, 485–490. [Google Scholar] [CrossRef]
- Quartagno, M.; Grund, S.; Carpenter, J. Jomo: A flexible package for two-level joint modelling multiple imputation. R J. 2019, 11, 205–228. [Google Scholar] [CrossRef]
- You, Y.; Ablitip, A.; Chen, Y.; Ding, H.; Chen, K.; Cui, Y.; Ma, X. Saturation effects of the relationship between physical exercise and systemic immune inflammation index in the short-sleep population: A cross-sectional study. BMC Public Health 2024, 24, 1920. [Google Scholar] [CrossRef]
- You, Y.; Li, J.; Zhang, Y.; Li, X.; Li, X.; Ma, X. Exploring the potential relationship between short sleep risks and cognitive function from the perspective of inflammatory biomarkers and cellular pathways: Insights from population-based and mice studies. CNS Neurosci. Ther. 2024, 30, e14783. [Google Scholar] [CrossRef]
- Quartagno, M.; Carpenter, J.R.; Goldstein, H. Multiple imputation with survey weights: A multilevel approach. J. Surv. Stat. Methodol. 2020, 8, 965–989. [Google Scholar] [CrossRef]
- Muntner, P.; Hardy, S.T.; Fine, L.J.; Jaeger, B.C.; Wozniak, G.; Levitan, E.B.; Colantonio, L.D. Trends in blood pressure control among US adults with hypertension, 1999–2000 to 2017–2018. JAMA 2020, 324, 1190–1200. [Google Scholar] [CrossRef]
- Manea, L.; Gilbody, S.; McMillan, D. Optimal cut-off score for diagnosing depression with the Patient Health Questionnaire (PHQ-9): A meta-analysis. CMAJ 2012, 184, E191–E196. [Google Scholar] [CrossRef]
- Hou, X.Z.; Wu, Q.; Lv, Q.Y.; Yang, Y.T.; Li, L.L.; Ye, X.J.; Yang, C.Y.; Lv, Y.F.; Wang, S.H. Development and external validation of a risk prediction model for depression in patients with coronary heart disease. J. Affect. Disord. 2024, 367, 137–147. [Google Scholar] [CrossRef]
- Dye, B.A.; Li, X.; Lewis, B.G.; Iafolla, T.; Beltran-Aguilar, E.D.; Eke, P.I. Overview and quality assurance for the oral health component of the National Health and Nutrition Examination Survey (NHANES), 2009–2010. J. Public Health Dent. 2014, 74, 248–256. [Google Scholar] [CrossRef]
- Tucker, J.M.; Welk, G.J.; Beyler, N.K. Physical activity in U.S.: Adults compliance with the Physical Activity Guidelines for Americans. Am. J. Prev. Med. 2011, 40, 454–461. [Google Scholar] [CrossRef]
- Dziedzic, E.A.; Gąsior, J.S.; Tuzimek, A.; Paleczny, J.; Junka, A.; Dąbrowski, M.; Jankowski, P. Investigation of the associations of novel inflammatory biomarkers-systemic inflammatory index (SII) and systemic inflammatory response index (SIRI)-with the severity of coronary artery disease and acute coronary syndrome occurrence. Int. J. Mol. Sci. 2022, 23, 9553. [Google Scholar] [CrossRef] [PubMed]
- R Foundation for Statistical Computing. R: A Language and Environment for Statistical Computing; R Foundation for Statistical Computing: Vienna, Australia, 2021; Available online: https://www.R-project.org (accessed on 10 September 2024).
- Rao, U.; Poland, R.E.; Lin, K.M. Comparison of symptoms in African-American, Asian-American, Mexican-American and Non-Hispanic White patients with major depressive disorder. Asian J. Psychiatr. 2012, 5, 28–33. [Google Scholar] [CrossRef]
- De Oliveira, G.; Cianelli, R.; Gattamorta, K.; Kowalski, N.; Peragallo, N. Social determinants of depression among Hispanic women. J. Am. Psychiatr. Nurses Assoc. 2017, 23, 28–36. [Google Scholar] [CrossRef]
- Bulloch, A.G.M.; Williams, J.V.A.; Lavorato, D.H.; Patten, S.B. The depression and marital status relationship is modified by both age and gender. J. Affect. Disord. 2017, 223, 65–68. [Google Scholar] [CrossRef]
- Osborne, M.T.; Shin, L.M.; Mehta, N.N.; Pitman, R.K.; Fayad, Z.A.; Tawakol, A. Disentangling the links between psychosocial stress and cardiovascular disease. Circ. Cardiovasc. Imaging 2020, 13, e010931. [Google Scholar] [CrossRef]
- Sharma, T.; Padala, P.R.; Mehta, J.L. Loneliness and social isolation: Determinants of cardiovascular outcomes. Curr. Cardiol. Rev. 2021, 17, e051121190873. [Google Scholar] [CrossRef]
- Eustis, S.J.; McCall, M.W.; Murphy, E.A.; Wirth, M.D. Association between gastrointestinal symptoms and depression in a representative sample of adults in the United States: Findings from National Health and Nutrition Examination Survey (2005–2016). J. Acad. Consult. Liaison Psychiatry 2022, 63, 268–279. [Google Scholar] [CrossRef]
- Stubbs, M.A.; Clark, V.L.; Gibson, P.G.; Yorke, J.; McDonald, V.M. Associations of symptoms of anxiety and depression with health-status, asthma control, dyspnoea, dysfunction breathing and obesity in people with severe asthma. Respir. Res. 2022, 23, 341. [Google Scholar] [CrossRef]
- Zhu, F.; Tu, H.; Chen, T. The Microbiota-Gut-Brain Axis in Depression: The potential pathophysiological mechanisms and microbiota combined antidepression effect. Nutrients 2022, 14, 2081. [Google Scholar] [CrossRef]
- Kumar, A.; Pramanik, J.; Goyal, N.; Chauhan, D.; Sivamaruthi, B.S.; Prajapati, B.G.; Chaiyasut, C. Gut microbiota in anxiety and depression: Unveiling the relationships and management options. Pharmaceuticals 2023, 16, 565. [Google Scholar] [CrossRef]
- Herrera, P.A.; Campos-Romero, S.; Szabo, W.; Martínez, P.; Guajardo, V.; Rojas, G. Understanding the relationship between depression and chronic diseases such as diabetes and hypertension: A grounded theory study. Int. J. Environ. Res. Public Health 2021, 18, 12130. [Google Scholar] [CrossRef]
- Dehdar, K.; Raoufy, M.R. Brain structural and functional alterations related to anxiety in allergic asthma. Brain Res. Bull. 2023, 202, 110727. [Google Scholar] [CrossRef]
- Celano, C.M.; Freudenreich, O.; Fernandez-Robles, C.; Stern, T.A.; Caro, M.A.; Huffman, J.C. Depressogenic effects of medications: A review. Dialogues Clin. Neurosci. 2011, 13, 109–125. [Google Scholar] [CrossRef]
- Beck, A.; Crain, A.L.; Solberg, L.I.; Unützer, J.; Glasgow, R.E.; Maciosek, M.V.; Whitebird, R. Severity of depression and magnitude of productivity loss. Ann. Fam. Med. 2011, 9, 305–311. [Google Scholar] [CrossRef]
- Song, R.; Xu, H.; Dintica, C.S.; Pan, K.Y.; Qi, X.; Buchman, A.S.; Bennett, D.A.; Xu, W. Associations between cardiovascular risk, structural brain changes, and cognitive decline. J. Am. Coll. Cardiol. 2020, 75, 2525–2534. [Google Scholar] [CrossRef]
- Leritz, E.C.; McGlinchey, R.E.; Kellison, I.; Rudolph, J.L.; Milberg, W.P. Cardiovascular disease risk factors and cognition in the elderly. Curr. Cardiovasc. Risk Rep. 2011, 5, 407–412. [Google Scholar] [CrossRef]
- Papenberg, G.; Bäckman, L.; Fratiglioni, L.; Laukka, E.J.; Fastbom, J.; Johnell, K. Anticholinergic drug use is associated with episodic memory decline in older adults without dementia. Neurobiol. Aging 2017, 55, 27–32. [Google Scholar] [CrossRef]
- Nutt, D.J. Neurobiological mechanisms in generalized anxiety disorder. J. Clin. Psychiatry 2001, 62, 22–27. [Google Scholar]
- Lerner, D.; Adler, D.A.; Rogers, W.H.; Chang, H.; Lapitsky, L.; McLaughlin, T.; Reed, J. Work performance of employees with depression: The impact of work stressors. Am. J. Health Promot. 2010, 24, 205–213. [Google Scholar] [CrossRef]
- Irwin, M.R.; Witarama, T.; Caudill, M.; Olmstead, R.; Breen, E.C. Sleep loss activates cellular inflammation and signal transducer and activator of transcription (STAT) family proteins in humans. Brain Behav. Immun. 2015, 47, 86–92. [Google Scholar] [CrossRef]
- Sakamoto, M.; Suematsu, Y.; Yano, Y.; Kaino, K.; Teshima, R.; Matsuda, T.; Fujita, M.; Tazawa, R.; Fujimi, K.; Miura, S.I. Depression and anxiety are associated with physical performance in patients undergoing cardiac rehabilitation: A retrospective observational study. J. Cardiovasc. Dev. Dis. 2022, 9, 21. [Google Scholar] [CrossRef]
- Gordois, A.L.; Toth, P.P.; Quek, R.G.; Proudfoot, E.M.; Paoli, C.J.; Gandra, S.R. Productivity losses associated with cardiovascular disease: A systematic review. Expert. Rev. Pharmacoecon Outcomes Res. 2016, 16, 759–769. [Google Scholar] [CrossRef]
- Cheng, X.; Ouyang, F.; Ma, T.; He, L.; Gong, L.; Yin, J.; Zhang, G.; Bai, Y. The individual and joint associations of depression and sleep duration with cardiometabolic diseases and mortality: A prospective cohort study. Atherosclerosis 2022, 361, 10–17. [Google Scholar] [CrossRef]
- Yang, Y.; Wang, Y.; Yang, L. Association between physical activity and sedentary behavior and depression in US adults with cardiovascular disease: NHANES 2007–2016. J. Affect. Disord. 2024, 367, 342–349. [Google Scholar] [CrossRef]
- Pérez-Stable, E.J.; Benowitz, N.L.; Marín, G. Is serum cotinine a better measure of cigarette smoking than self-report? Prev. Med. 1995, 24, 171–179. [Google Scholar] [CrossRef]
- Grizzell, J.A.; Iarkov, A.; Holmes, R.; Mori, T.; Echeverria, V. Cotinine reduces depressive-like behavior, working memory deficits, and synaptic loss associated with chronic stress in mice. Behav. Brain Res. 2014, 268, 55–65. [Google Scholar] [CrossRef]
- Brunetti, R.; Hicklin, H.; Rackley, J.; Ahmad, M.I.; Li, Y.; Soliman, E.Z. Serum cotinine and silent myocardial infarction in individuals free from cardiovascular disease. Am. J. Cardiol. 2019, 124, 666–670. [Google Scholar] [CrossRef]
- Orisakwe, O.E. The role of lead and cadmium in psychiatry. N. Am. J. Med. Sci. 2014, 6, 370–376. [Google Scholar] [CrossRef]
- Scinicariello, F.; Buser, M.C. Blood cadmium and depressive symptoms in young adults (aged 20–39 years). Psychol. Med. 2015, 45, 807–815. [Google Scholar] [CrossRef]
- Cybulska, A.M.; Grochans, S.; Kamińska, M.S.; Bosiacki, M.; Skonieczna-Żydecka, K.; Grochans, E. Are cadmium and lead levels linked to the development of anxiety and depression?—A systematic review of observational studies. Ecotoxicol. Environ. Saf. 2021, 216, 112211. [Google Scholar] [CrossRef]
- Tian, X.; Xue, B.; Wang, B.; Lei, R.; Shan, X.; Niu, J.; Luo, B. Physical activity reduces the role of blood cadmium on depression: A cross-sectional analysis with NHANES data. Environ. Pollut. 2022, 304, 119211. [Google Scholar] [CrossRef]
- Singh, M.; Singh, V.; Schurman, J.V.; Colombo, J.M.; Friesen, C.A. The relationship between mucosal inflammatory cells, specific symptoms, and psychological functioning in youth with irritable bowel syndrome. Sci. Rep. 2020, 10, 11988. [Google Scholar] [CrossRef]
- Ronkainen, J.; Aro, P.; Jones, M.; Walker, M.M.; Agréus, L.; Andreasson, A.; Talley, N.J. Duodenal eosinophilia and the link to anxiety: A population-based endoscopic study. Neurogastroenterol. Motil. 2021, 33, e14109. [Google Scholar] [CrossRef]
- Taft, T.H.; Guadagnoli, L.; Edlynn, E. Anxiety and depression in eosinophilic esophagitis: A scoping review and recommendations for future research. J. Asthma Allergy 2019, 12, 389–399. [Google Scholar] [CrossRef]
- Sadeghi, M.; Rahiminam, H.; Amerizadeh, A.; Masoumi, G.; Heidari, R.; Shahabi, J.; Mansouri, M.; Roohafza, H. Prevalence of return to work in cardiovascular patients after cardiac rehabilitation: A systematic review and meta-analysis. Curr. Probl. Cardiol. 2022, 47, 100876. [Google Scholar] [CrossRef]
Disclaimer/Publisher’s Note: The statements, opinions and data contained in all publications are solely those of the individual author(s) and contributor(s) and not of MDPI and/or the editor(s). MDPI and/or the editor(s) disclaim responsibility for any injury to people or property resulting from any ideas, methods, instructions or products referred to in the content. |
© 2025 by the authors. Licensee MDPI, Basel, Switzerland. This article is an open access article distributed under the terms and conditions of the Creative Commons Attribution (CC BY) license (https://creativecommons.org/licenses/by/4.0/).