Abstract
Background: Spirometry is one of the most important medical tests used to diagnose and monitor diseases affecting the respiratory system. There are several reference equations that can provide reference values to be referred to during the spirometer examination process. However, the equations of the Global Lung Function Initiative 2012 (GLI 2012) Committee were found not to apply to Iraqi populations. Furthermore, there is currently no equation derived from normal values specific to Iraqis. Objectives: The aim of this study was to establish a spirometric reference equation that can be used in the Iraqi population to diagnose and monitor respiratory diseases. Methods: Spirometry data were collected from healthy, non-smoking Iraqi adults. Generalized additive models of location, scale, and shape were used to construct the equations. Spirometry parameters, including predicted values, predicted percent, and Z-scores, were calculated based on the equations developed. A new spirometry dataset consisting of 344 participants, who were not involved in creating the equations, was used for equation validation. Results: The equations were constructed using spirometer data from 966 adults (33.1% women). The equations were evaluated by calculating Z-scores and predicted values, and the results showed that Z-scores for all variables calculated based on the present equation were less than ±0.5. Conclusions: To reduce the effect of ethnic and race on the normal values of spirometry parameters, the equations developed in this study can be used to evaluate and diagnose respiratory diseases in Iraqis.
1. Introduction
Spirometry is a non-invasive test that is essential for the management and diagnosis of many respiratory diseases [1]. The correct use of spirometers enables accurate diagnosis and facilitates specialized therapeutic interventions by healthcare providers. The interpretation of the results of the spirometry test relies on comparing the values of the different spirometric parameters with the predicted reference values [2]. Therefore, choosing the correct spirometric reference equation is crucial for the success of the test, as normal values vary between individuals depending on age, height, weight, race and other environmental factors [3]. This is crucial to improve the management of respiratory disease including asthma and COPD that have significant burden globally and in Iraq [4]. To reduce the error rate and ensure the appropriate selection of spirometric reference equations, the American Thoracic Society and the European Respiratory Society have approved the use of the Global Lung Function Initiative (GLI) 2012 equations for examining and evaluating lung function globally. The Global Lung Function Initiative 2012 equations are a comprehensive set of equations designed to provide uniform reference values for evaluating lung function across various ethnicities worldwide. The data used to develop the GLI equations were collected from 33 countries and included more than 74,000 participants. However, these equations lack data from the Arab world [5]. The suitability of these equations has been evaluated in several Arab and Asian countries and found to be inappropriate, prompting researchers to develop local versions for calculating lung function [6,7,8,9]. In Iraq, a study was conducted to determine the suitability of the GLI equations for the Iraqi population, revealing that they are inappropriate. The findings highlighted the need to establish a reference equation specifically for examining, diagnosing and monitoring respiratory diseases in Iraqis [10]. The present study aimed to establish a spirometric reference equation for evaluation lung function in adult Iraqis.
2. Materials and Methods
The present study was divided into two parts: the first part focused on creating the spirometric reference equations, while the second part evaluated the suitability of these equations for the Iraqi population. Ethical approval for the study was obtained from the Iraqi Ministry of Health (approval number 7/2022).
2.1. Participants
Participants were recruited through friends and various social media platforms, primarily Facebook, which is the most popular in Iraq [11]. The health status and smoking habits of the participants were assessed using a questionnaire, which included inquiries such as: “Are you currently a smoker?”, “Do you reside with someone who is smoker?”, “Are you a former smoker?”, and “Do you suffer from any chronic diseases?”. All Iraqis over the age of 18, regardless of sex, were eligible to participate, provided they did not meet any of the exclusion criteria. These criteria included the following: smokers, individuals living with smokers, those with chronic respiratory diseases such as asthma, or non-respiratory conditions such as hypertension, as well as individuals who had recently undergone surgery or those with acute respiratory symptoms. Pregnant women were excluded from this study because hormonal changes during pregnancy are known to affect respiratory system function, as demonstrated in previous studies [12,13].
The study was conducted across various regions of Iraq, including the northern, central, and southern regions. Data were collected from various locations, including markets, stadiums, colleges, hospitals, and pharmacies, after securing the necessary approvals from the relevant authorities. Individuals were informed about the primary objective of the study and asked to take part. After explaining the study and potential risks of participating, such as nausea and dizziness, written consent was obtained from participants. The inclusion and exclusion criteria were determined based on previous studies [14,15].
2.2. Measurement and Materials
Anthropometric and Lung function examinations were performed for the participants following the guidelines of the American Thoracic Society and the European Respiratory Society [16]. Participants’ heights were measured using a measuring tape attached to a wall, ensuring accurate readings in meters. The MIR Minispir device was used to perform lung function examinations for all participants. This device is known for its accuracy and ease of use, being a lightweight and portable instrument that connects to a computer. It is widely used in lung function research due to its simplicity and reliability [17]. It was developed by Medical International Research in Rome, Italy [18]. The equipment complies with ATS/ERS standards for spirometry [16]. It was operated using WinspiroPRO software (version 8.5) and has a volume accuracy of ±3% or 50 mL, and a flow accuracy of ±5% or 200 mL/s. The device has been employed in numerous previous studies to assess lung function [9,19].
2.3. Statistical Analysis
The data were analyzed using the Statistical Package for the Social Sciences (SPSS), version 23. To determine whether the anthropometric and respiratory data were normally distributed between the two sexes, the Kolmogorov–Smirnov was used, revealing that the data were not normally distributed. Generalized Additive Models for Location, Scale, and Shape (GAMLSS) is a versatile statistical method used for modeling and predicting the dispersion of a response variable. Unlike conventional regression models, which focus primarily on estimating the mean of the response variable, GAMLSS allows for the modeling of multiple distribution parameters, including location (mean), scale (variance), and shape (skewness and kurtosis) [20]. This method allows for the application of different link functions and data distributions, including the Box-Cox-Cole-Green (BCCG) distribution, normal distribution, and Box-Cox power exponential (BCPE). Additionally, smoothing splines can be incorporated into equations to improve data fit. In this study, various models were evaluated for each spirometric value by sex, and the best model was selected based on degrees of freedom (df) and the Schwarz Bayesian criterion (SBC). The models that produced the lowest SBC and df, while exhibiting an appropriate distribution of residuals, were deemed the most suitable for the data.
To determine whether the developed equations were suitable for application to Iraqi populations, data were collected from 344 healthy participants (164 males and 180 females) who were not included in the first phase of equation creation. This sample size exceeded the minimum number recommended by the GLI 2012 guidelines for validating spirometric reference equations in a given population (300 participants, with at least 150 females and 150 males) [21]. The predicted values and Z-scores for FEV1, FVC, FEF25–75%, and FEV1/FVC% were calculated for each participant using the present developed reference equations (referred to as Iraqi Spirometric Equation (ISE)) and different GLI equations including GLI other/mixed (GLI-O), GLI race-neutral (GLI-N), and (GLI Caucasians) GLI-C. The Mann–Whitney U test was applied to evaluate differences in spirometric parameters between the equation and validation data.
3. Results
3.1. Phase One: Formulating an Equation
Data from a total of 966 participants were analyzed, comprising 646 males and 320 females, out of an initial pool of 2060 participants. A total of 1094 individuals were excluded because they did not meet inclusion criteria (Figure 1).
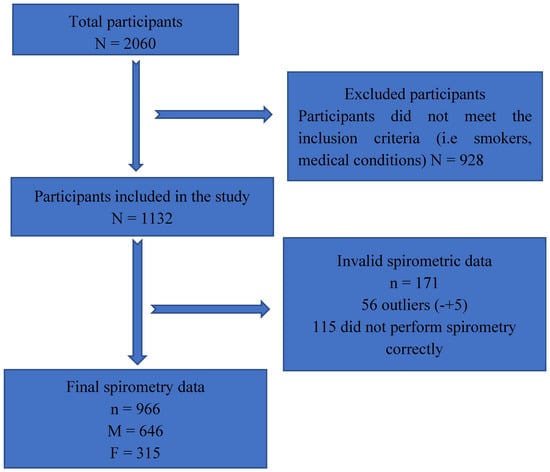
Figure 1.
Flowchart of the participant recruitment and data collection process.
As seen in Table 1, the pulmonary parameters (FVC, FEV1, and FEF25–75) were higher in males than in females, except for FEV1/FVC%, which was higher in females. Table A1 presents the models studied. Based on the SBC values and degrees of freedom (df), the models were compared, and the best model was selected to formulate the spirometric equations. The SBC values and degrees of freedom for the studied models are presented in Table A2 (males) and Table A3 (females). Spirometric equations were developed for both sexes and are presented in Table 2 (males) and Table 3 (females).

Table 1.
Descriptive analysis of males and females.
Table 2.
Spirometric reference equations for males.
Table 3.
Spirometric reference equations for females.
3.1.1. Spirometry Indices in Males
The majority of the data were concentrated within the younger age intervals, resulting in a positively skewed (right-skewed) distribution (Figure A1). FEV1 values change with age, increasing until about 26 years, after which they decreased with advancing age. Although the relationship between FEV1 and age was clearly inverse, applying a logarithmic transformation improved the linearity of the relationship (Figure A2). Applying a logarithmic transformation also improved the linearity of this relationship between height and FEV1 (Figure A3). Model 3 was selected to produce the predicted equation for FEV1 because it had the lowest SBC and an appropriate df compared to the other models (Table A1). Residual analysis was conducted to ensure that the chosen model was appropriate for the study data and did not overlook any influencing variables. The analysis demonstrated that the selected model accurately represented the data, with only minor discrepancies that did not indicate any significant issues.
The distribution of the residuals appeared balanced, which is a positive aspect. Most data points aligned with the reference line, suggesting that the residuals are approximately normally distributed. Although some irregularities were observed in the tails, these were typical and remained within acceptable limits (Figure A4). The Worm Plots depicted a favorable model fit, with deviations centered around zero in most panels. While some deviations were present, they were generally within acceptable limits. The symmetry around zero further indicated that the residuals were fairly normally distributed (Figure A5).
For FVC, after reviewing the different models, Model 2 was found to be the best fit for the study data. While Model 1 had a slightly lower SBC, its higher degrees of freedom made Model 2 the more suitable choice. Additionally, Model 2 exhibited good normality of residuals, favorable Worm Plots, and consistent centiles. After evaluating seven models to determine the most suitable for FEV1/FVC in men, Model 1 was identified as the best, as it had the lowest SBC among the other models.
Although Model 1 had the lowest SBC in FEF25–75%, indicating it might be the best fit, Model 2 was very close in performance and exhibited better df, making it the preferred model for the present data. Model 2 also exhibited good normality of residuals, favorable Worm Plots, and consistent centiles compared to Model 1.
3.1.2. Spirometry Parameters in Females
The female sample included in the study was negatively skewed towards the younger ages (Figure A6). Upon evaluating the GAMLSS models, Model 1 was identified as the best fit for calculating FEV1. Although both models had very similar values in terms of df and SBC (with Model 1 exhibiting a slightly lower SBC), Model 1 was superior in terms of residuals, which had a rate of −0.002, closer to zero than that of Model 2.
After evaluating different models for the FVC data for females, Model 1 was identified as the most suitable for the data, compared to the rest of the models, based on its SBC and df, which were lower compared to other models. The residuals of Model 1, along with its variance, skewness, and kurtosis, indicated a good fit for the data. In FEV1/FVC, Model 1 was identified as the most suitable based on its SBC and df, which were lower compared to the other models. Finally, in FEF25–75%, Model 1 was selected due to its lowest standardized SBC and acceptable df. Additionally, it demonstrated well-formed residual normality, making it the most suitable choice.
3.2. Equation Validation
The anthropometric and spirometric parameters for the participants in the second phase of the study are displayed in Table 4. Moreover, the Mann–Whitney U test indicated that there were no significant differences between the spirometric values of the samples used in phase one and phase two, except for FEF25–75% in males (p = 0.01) and FEV1/FVC% in females (p = 0.01).
Table 4.
Anthropometric parameters of participants in Phase Two.
The results of the validation study were compared against those of the GLI-O, GLI-C, and GLI-N equations, as shown in Table 5 and Table 6. For males, the results show that the ISE produced the best fit for all spirometric values. In FEV1, the ISE provided the Z-score closest to zero (0.06), indicating the best agreement with the observed FEV1 values. The GLI-C equation slightly overestimated FEV1, while the GLI-O and GLI-N equations slightly underestimated it. In FVC, similar to FEV1, the ISE showed the best alignment with the observed FVC values (Z-score = 0.08). The GLI-C equation overestimated FVC, while the GLI-O and GLI-N equations showed slight underestimations. In FEV1/FVC%, the ISE again provided the Z-score closest to zero (−0.05), indicating the most accurate prediction of the FEV1/FVC ratio. All GLI-based equations slightly underestimated the ratio. For FEF25–75%, the ISE produced the most accurate predictions, with a Z-score closest to zero (0.10). The GLI-C and GLI-O equations slightly underestimated the flow, with GLI-O demonstrating the largest deviation. Moreover, the standard deviation was closest to 1, and the predicted percent was closest to 100% when using the ISE.
Table 5.
Spirometric parameters of participants in Phase Two. Data presented as median (Q1–Q3).
Table 6.
Spirometric parameters and Z-score of studied equations (for males).
The results for females indicate that the ISE consistently generates Z-scores closest to zero across all spirometry parameters (Table 7), making it the most accurate and suitable equation for the Iraqi female population. However, for FEV1, the GLI-C equation had the lowest Z-score. Nonetheless, the ISE retained the closest standard deviation to 1 among all the studied equations for FEV1. The GLI-C equation tended to overestimate FEV1 and FVC but underestimated the FEV1/FVC ratio and FEF25–75%. Conversely, the GLI-O and GLI-N equations slightly underestimated FEV1 and FVC, while showing greater deviations in FEF25–75%. The ISE consistently provided a predicted percent closest to 100%, making it the most suitable equation for the Iraqi female population.
Table 7.
Spirometric parameters and Z-score of studied equations (for Females).
4. Discussion
Iraqi society lacks reference equations for calculating and evaluating lung function, as the GLI 2012 equations were found to be unsuitable for this population and may yield inaccurate results, potentially affecting the diagnosis and evaluation of lung conditions in Iraqis [22].
The GLI-2012 equations were created to establish globally applicable predictive formulas for spirometric reference values across broad age groups. However, limitations in these equations may restrict their utility and highlight the need for population-specific models tailored to distinct demographics. A key shortcoming is the GLI-2012’s failure to account for intra-ethnic diversity. For example, the GLI-C category pooled data from Europe, the Middle East (e.g., Israel), and North Africa, regions with significant demographic heterogeneity, raising concerns about the equations’ generalizability. Additionally, the GLI-2012 relies on data collected from 1978 onward, despite evidence of a global upward trend in average height over time [22], which may influence lung function metrics. A Japanese study highlighted how shifting anthropometrics can alter spirometric results. Furthermore, ethnic groups residing in different geographic regions exhibit variations in lung function, as seen in comparisons between Indian individuals born in the United States and those in India, with the former showing higher spirometric values even after adjusting for height and age [23]. These findings emphasize the necessity of refining predictive models to reflect evolving and region-specific population characteristics.
Several countries in the Middle East have recognised that globally derived spirometric reference values are not fully applicable to their populations, leading to the development of population-specific equations. Reference values established for adults in the region highlight the significant influence of ethnicity and geographic factors on lung function [24]. Similarly, spirometric norms developed for healthy adults in Jordan, Oman, and Saudi Arabia differ from Western and global equations, reinforcing the need for region-specific standards in clinical practice [6,24,25].
To address this issue for Iraqis, the present study developed population-specific reference equations to examine and monitor lung function. These equations were derived by analyzing spirometry data from 966 Iraqi adults and applying statistical methods to formulate the reference equations. The GAMLESS approach was used to construct the equations because it effectively handle non-linear data, overcoming the limitations of traditional models [26,27]. The LMS method, commonly used in growth and lung function modeling, captures the median (M), variability (S), and skewness (L) through the BCCG distribution. However, it is a special case within the broader GAMLSS framework, which enables more flexible modeling by allowing separate smooth functions for location, scale, skewness, and kurtosis [28]. This makes GAMLSS particularly suitable for data that are non-normal and heteroscedastic, as is often the case in spirometry across age groups [26]. For example, Lung volume increases until around the age of 30 due to natural growth and increased muscle mass. After this point, it begins to gradually decline, particularly in individuals over 30, due to muscle weakness, reduced lung elasticity, and frequent exposure to pollutants [29]. While recent studies in Japan and Korea [30,31,32] have utilized the LMS method, they were focused on homogeneous populations. For heterogeneous populations, studies like those from the GLI Network have used GAMLSS to develop robust multi-ethnic reference equations for different ethnicities [5,24].
To test the applicability of the spirometry reference equations developed in this study for the Iraqi population, data of 344 healthy, non-smoking Iraqi individuals (52.3% females) who were not included in the equation creation phase were analyzed. To evaluate suitability, the Z-score was calculated for all spirometric variables in this study based on the newly developed equations. Ideally, Z-scores should be normally distributed, with a mean close to zero and a standard deviation close to 1. However, achieving a mean Z-score of exactly zero is challenging due to physiological differences among individuals within the same environment, race, and society. To account for these variations, the GLI 2012 Committee adopted a Z-score cut-off point of less than ±0.5 instead of zero [5]. Z-scores are superior to predicted % as they are independent of changes in height, age, and race [26] and were therefore adopted to determine the suitability of the equations in the second phase of this study. In the present study, the Z-scores for all variables were less than ±0.5, confirming that the equations are suitable for application in the Iraqi population. Moreover, when comparing the Z-scores produced by the ISE with those from different GLI equations, the ISE produced the Z-scores closest to zero across all studied spirometric parameters in both sexes, except for FEV1 in females. Furthermore, many of the GLI equations exceeded the critical Z-score cut-off point, including GLI-O in FEV1 and FEF25–75% in males, as well as FEV1 and FEV1/FVC% in females. Additionally, GLI-C exceeded the cut-off point in FEV1/FVC% in females. These results confirm the superiority of ethnic-specific equations over ethnically diverse ones, a finding supported by several previous studies [6,7,8,9]. While international guidelines like GINA provide general spirometric reference values, national guidelines often use population-specific equations that consider local factors such as ethnicity, height, and weight. These locally derived equations can improve the accuracy of diagnosing and classifying conditions like asthma and COPD. For example, the KNHANES-VI equation used in South Korea showed greater sensitivity in detecting airway obstruction than the globally used GLI-2012 equation [33,34]. The integration of these reference values into national COPD and asthma guidelines would create a more precise foundation on which to base disease staging and treatment planning in patients from Iraq, ensuring that it is based on population-specific norms rather than on the possibly mismatched international equations.
4.1. Strengths and Limitations
This study is the first to provide a spirometric reference equation for Iraqi adults in accordance with the recommendations of the American Thoracic Society, the European Respiratory Society, and the GLI 2012 committee. This marks an important step in addressing the lack of population-specific reference equations for lung function in Iraq. The equations developed here provide a foundation for further validation through their application to patients with respiratory conditions, particularly those with COPD.
Despite its strengths, this study has several limitations that warrant discussion and suggest avenues for future research. First, it did not account for environmental, physical, biological, and nutritional factors that may affect respiratory rates and lung volume [35]. Future research should include these variables to evaluate their impact on spirometric parameters and to refine the equations accordingly. Although the present study did not specifically assess several risk factors, such as occupational exposure and biomass smoke exposure, it excluded participants with acute or chronic respiratory symptoms. Moreover, the study followed the selection criteria used in global and regional spirometric reference studies, including the GLI study [5], which also did not account for these exposures. While this limitation may have a minor impact on the study’s findings, future research should consider evaluating these exposures more closely to further refine population-specific reference standards.
Another limitation may be the young age of the study sample (in both phases), which had a median age of 32.5 years for females and 27.3 years for males. However, this is generally consistent with the demographics of the Iraqi population, which has a median age of 22.4 years [36]. Moreover, previously published equations have reported comparable or younger median ages [6,37,38]. Nevertheless, 187 females and 187 males in the total sample were aged 40 years or older. Expanding future studies to include older age groups would further enhance the reliability of the produced equations.
Finally, the internet-based recruitment method used in this study may have introduced selection bias, as individuals without internet access were less likely to be enrolled. Nevertheless, with the global rise in internet connectivity, the recent literature suggests that the socio-demographic characteristics of participants recruited online increasingly resemble those of the general population [39]. This is particularly relevant for Iraq, where internet access has reached approximately 81.7% as of early 2025 [40]. Moreover, excluding individuals under the age of 18 may further increase this proportion.
4.2. Future Directions
The application of population-specific reference values for adults in Iraq will improve the accuracy of spirometry interpretation, reducing the risk of underdiagnosing or misdiagnosing obstructive and restrictive lung diseases. This, in turn, will support clinicians in making more reliable treatment decisions based on the characteristics of the local population. Additionally, these reference equations may strengthen respiratory screening programmes in Iraq by improving the early detection of airway obstruction, particularly among asymptomatic individuals and those in rural or disadvantaged communities.
5. Conclusions
This study developed spirometric reference equations specifically for adult Iraqis, addressing a critical gap in population-specific tools for evaluating lung function. The suitability and applicability of these equations were validated, with Z-scores demonstrating a mean close to zero and a standard deviation near one, indicating that the equations are robust for use in this population.
The findings of this study support the application of these equations to larger samples of healthy Iraqis to further refine their accuracy and generalizability. Additionally, future research should focus on applying these equations to patients with chronic respiratory diseases, such as COPD, to assess their reliability in diagnosing and monitoring respiratory conditions. Expanding their use to such populations will help determine their potential for integration into clinical practice for managing chronic respiratory diseases in Iraq.
By providing the first spirometric reference equations tailored to the Iraqi population, this study represents a significant advancement in respiratory health assessment and paves the way for further research to enhance their applicability and clinical relevance.
Author Contributions
Investigation, Writing—original draft, Writing—review & editing, A.A.; investigation, data collection, writing—original draft, project administration, W.A.-Q.; validation, writing—reviewing and editing, data analysis, D.A.M.N.; reviewing and editing, supervision, J.E. All authors have read and agreed to the published version of the manuscript.
Funding
This research received no external funding.
Institutional Review Board Statement
Ethical approval for the study was obtained from the Iraqi Ministry of Health (approval number 7/2022, approval date 26 April 2022). Informed consent was obtained from all participants involved in the study. Our study was conducted in full compliance with the principles outlined in the Declaration of Helsinki.
Informed Consent Statement
Informed consent was obtained from all subjects involved in the study.
Data Availability Statement
All data studied here are available from H. Al-Sajri, A. (2024). Spirometric reference equation [Data set]. Zenodo. https://doi.org/10.5281/zenodo.14562300. Accessed on 27 December 2024.
Acknowledgments
We would like to thank Omar Al-Janabi, head of the Allergy and Asthma Center in Anbar, for his support and assistance in facilitating the research procedures.
Conflicts of Interest
The authors declare no conflicts of interest.
Abbreviations
The following abbreviations are used in this manuscript:
| FEV1 | Forced Expiratory Volume in one second |
| FVC | Forced Vital Capacity |
| FEF25–75% | Forced Expiratory Flow at 25% to 75% of FVC |
| GLI | Global Lung Function Initiative |
| GAMLSS | Generalized Additive Models for Location, Scale, and Shape |
| BCCG | Box-Cox-Cole-Green distribution |
| BCPE | Box-Cox power exponential distribution |
| SBC | Schwarz Bayesian Criterion |
| DF | Degrees of Freedom |
| SD | Standard Deviation |
| ISE | Iraqi Spirometric Equation |
Appendix A
Table A1.
List of models evaluated to determine the best fit for the present data.
Table A1.
List of models evaluated to determine the best fit for the present data.
| Model | Distribution | Link | Variability | Skewness | Kurtosis | Height (h) | Age (wt) |
|---|---|---|---|---|---|---|---|
| Model 1 | BCCG | Log | Spline log (age) | Log (age) | - | Log | Log |
| Model 2 | BCCG | Log | Spline log (age) | Vector stars at 1 | - | Log | Log |
| Model 3 | BCPE | Log | Spline log (age) | Log (age) | Log (age) | Log | Log |
| Model 4 | Normal | Log | Spline log (age) | - | - | Log | Log |
| Model 5 | BCCG | Identity | Spline log (age) | Log (age) | - | Log | Log |
| Model 6 | BCCG | Identity | Spline log (age) | Vector stars at 1 | - | Log | Log |
| Model 7 | BCCG | Log | Spline log (age) | Log (age) | - | Log | Identity |
Table A2.
Models fit for different spirometric parameters in males.
Table A2.
Models fit for different spirometric parameters in males.
| Models | FEV1(L) | FVC(L) | FEV1/FVC% | FEF25–75 (L/s) | ||||
|---|---|---|---|---|---|---|---|---|
| DF | SBC | DF | SBC | DF | SBC | DF | SBC | |
| Model 1 | 12.11 | −1945.10 | 16.29 | 1114.28 | 13.35 | −1952.10 | 10.87 | 1564.80 |
| Model 2 | 8.87 | 801.15 | 5.00 | 1120.00 | 13.32 | −1952.06 | 9.21 | 1572.32 |
| Model 3 | 8.79 | 801.19 | 11.51 | 1130.97 | 13.32 | −1952.05 | 9.21 | 1572.32 |
| Model 4 | 10.99 | 801.24 | 13.31 | 1137.62 | 11.81 | −1947.39 | 9.23 | 1572.43 |
| Model 5 | 9.45 | 804.70 | 9.06 | 1211.41 | 11.79 | −1947.25 | 9.20 | 1573.52 |
| Model 6 | 6.59 | 824.72 | 9.28 | 1214.30 | 12.11 | −1945.09 | 7.55 | 1706.23 |
| Model 7 | 6.63 | 825.09 | 8.92 | 1215.07 | 14.32 | −1963.42 | 9.99 | 1706.79 |
Abbreviations: FEF25–75, forced expiratory flow between 25% and 75% of forced vital capacity; FEV1, forced expiratory volume in the first second; FEV1/FVC, forced expiratory volume in the first second/forced vital capacity; FVC, forced vital capacity; SBC, Schwarz Bayesian criterion; DF, degree of freedom.
Table A3.
Model fit for different spirometric parameters in females.
Table A3.
Model fit for different spirometric parameters in females.
| Models | FEV1(L) | FVC(L) | FEV1/FVC% | FEF25–75 (L/s) | ||||
|---|---|---|---|---|---|---|---|---|
| DF | SBC | DF | SBC | DF | SBC | DF | SBC | |
| Model 1 | 10.49 | 220.06 | 5.00 | 358.73 | 6.02 | −782.85 | 9.02 | 688.03 |
| Model 2 | 10.67 | 222.20 | 8.95 | 366.22 | 6.03 | −782.81 | 8.33 | 700.74 |
| Model 3 | 10.65 | 222.61 | 10.09 | 366.79 | 8.21 | −775.34 | 9.40 | 703.19 |
| Model 4 | 12.88 | 228.55 | 11.15 | 373.21 | 8.24 | −775.25 | 9.40 | 703.20 |
| Model 5 | 6.80 | 237.22 | 6.23 | 424.03 | 8.24 | −775.19 | 5.00 | 711.18 |
| Model 6 | 7.88 | 239.75 | 6.11 | 425.16 | 7.7 | 240.76 | 5.01 | 711.53 |
| Model 7 | 7.78 | 240.76 | 6.54 | 430.85 | Model did not converge | 5.57 | 712.73 | |
Abbreviations: FEF25–75, forced expiratory flow between 25% and 75% of forced vital capacity; FEV1, forced expiratory volume in the first second; FEV1/FVC, forced expiratory volume in the first second/forced vital capacity; FVC, forced vital capacity; SBC, Schwarz Bayesian criterion; DF, degree of freedom.
Appendix B
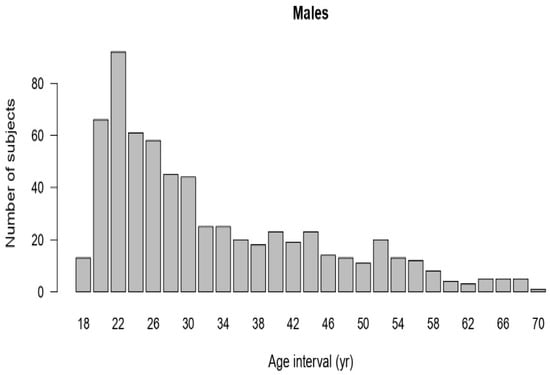
Figure A1.
Age distribution of male data.
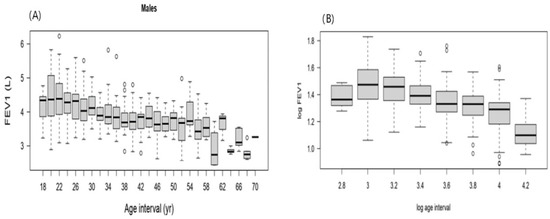
Figure A2.
(A) FEV1 of male participants versus corresponding age. (B) FEV1 of male participants versus the corresponding log age.
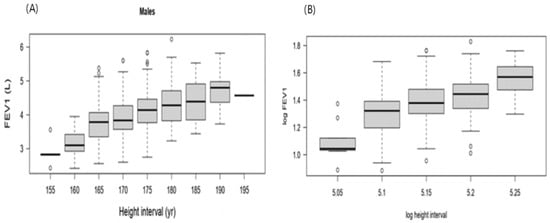
Figure A3.
(A) FEV1 versus the corresponding height. (B) FEV1 of male participants versus the corresponding log height.
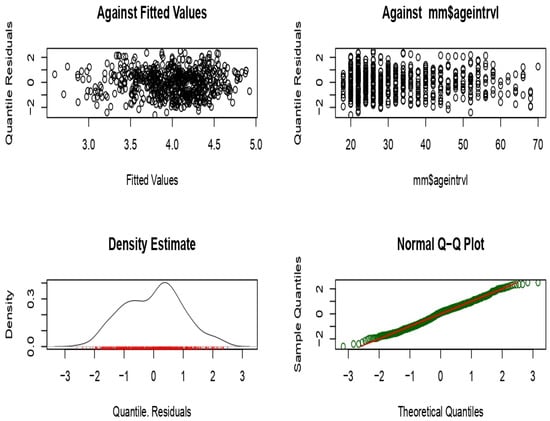
Figure A4.
Normality of the residuals for Model 1.
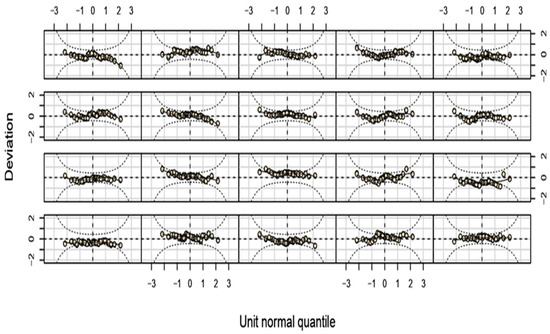
Figure A5.
Worm plots for Model 1.
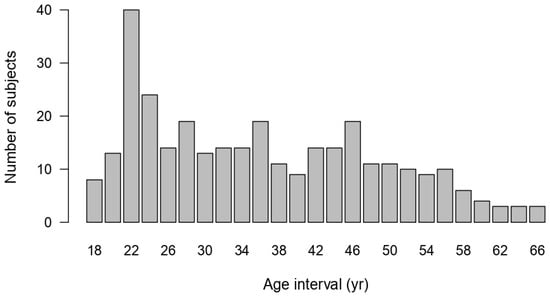
Figure A6.
Age distribution of females’ data.
References
- Pierce, R. Spirometry: An essential clinical measurement. Aust. Fam. Physician 2005, 34, 535–539. [Google Scholar] [PubMed]
- Haynes, J.M. Basic spirometry testing and interpretation for the primary care provider. Can. J. Respir. Ther. 2018, 54, 10-29390. [Google Scholar] [CrossRef] [PubMed]
- Stanojevic, S.; Rosenfeld, M. Selection and Appropriate Use of Spirometric Reference Equations for the Pediatric Population. In Diagnostic Tests in Pediatric Pulmonology: Applications and Interpretation; Davis, S., Eber, E., Koumbourlis, A., Eds.; Humana Press: New York, NY, USA, 2015; pp. 181–193. [Google Scholar]
- Vollset, S.E.; Ababneh, H.S.; Abate, Y.H.; Abbafati, C.; Abbasgholizadeh, R.; Abbasian, M.; Abbastabar, H.; Abd Al Magied, A.H.; Abd ElHafeez, S.; Abdelkader, A.; et al. Burden of disease scenarios for 204 countries and territories, 2022–2050: A forecasting analysis for the Global Burden of Disease Study 2021. Lancet 2024, 403, 2204–2256. [Google Scholar] [CrossRef] [PubMed]
- Quanjer, P.H.; Stanojevic, S.; Cole, T.J.; Baur, X.; Hall, G.L.; Culver, B.H.; Enright, P.L.; Hankinson, J.L.; Ip, M.S.; Zheng, J.; et al. Multi-ethnic reference values for spirometry for the 3–95-yr age range: The global lung function 2012 equations. Eur. Respir. Soc. 2012, 40, 1324–1343. [Google Scholar] [CrossRef]
- Belacy, N.A.; Altemani, A.H.; Abdelsalam, M.H.; El-Damarawi, M.A.; Elsawy, B.M.; Nasif, N.A.; El-Bassuoni, E.A. Reference Values for Lung Function Tests in Adult Saudi Population. Int. J. Intern. Med. 2014, 3, 43–52. [Google Scholar]
- Choi, H.S.; Park, Y.B.; Yoon, H.K.; Lim, S.Y.; Kim, T.H.; Park, J.H.; Lee, W.Y.; Park, S.J.; Lee, S.W.; Kim, W.J.; et al. Validation of previous spirometric reference equations and new equations. J. Korean Med. Sci. 2019, 34, e304. [Google Scholar] [CrossRef]
- Coates, A.L.; Wong, S.L.; Tremblay, C.; Hankinson, J.L. Reference equations for spirometry in the Canadian population. Ann. Am. Thorac. Soc. 2016, 13, 833–841. [Google Scholar] [CrossRef]
- Al-Qerem, W.A.; Jarab, A.S. Applicability of GLI 2012 spirometry equation among preschool aged Jordanian. Respir. Med. 2021, 182, 106397. [Google Scholar] [CrossRef]
- Al-Qerem, W.A.; Alsajri, A.; Ling, J. Applicability of GLI 2012 spirometry equation and a regional equation among Iraqi adults. J. Health Manag. 2024, 09720634241262632. [Google Scholar] [CrossRef]
- Simon, K. Digital 2024: Iraq. 2024. Available online: https://datareportal.com/reports/digital-2024-iraq (accessed on 24 December 2024).
- Ruhighira, J.J.; Mashili, F.L.; Tungu, A.M.; Mamuya, S. Spirometry profiles among pregnant and non-pregnant African women: A cross-sectional study. BMC Womens Health 2022, 22, 483. [Google Scholar] [CrossRef]
- Grindheim, G.; Toska, K.; Estensen, M.; Rosseland, L.A. Changes in pulmonary function during pregnancy: A longitudinal cohort study. BJOG 2012, 119, 94–101. [Google Scholar] [CrossRef] [PubMed]
- Agarwal, D.; Parker, R.A.; Pinnock, H.; Roy, S.; Ghorpade, D.; Salvi, S.; Khatavkar, P.; Juvekar, S.; Campbell, H.; Nair, H.; et al. Normal spirometry predictive values for the Western Indian adult population. Eur. Respir. J. 2020, 56, 1902129. [Google Scholar] [CrossRef]
- Al-Qerem, W.A.; Hammad, A.M.; AlQirem, R.A.; Ling, J. Do the global lung function initiative reference equations reflect a sample of adult Middle Eastern population? Clin. Respir. J. 2019, 13, 429–437. [Google Scholar] [CrossRef] [PubMed]
- Miller, M.R.; Hankinson, J.A.; Brusasco, V.; Burgos, F.; Casaburi, R.; Coates, A.; Crapo, R.; Enright, P.; Van Der Grinten, C.P.; Gustafsson, P.; et al. Standardisation of spirometry. Eur. Respir. J. 2005, 26, 319–338. [Google Scholar] [CrossRef]
- Degryse, J.; Buffels, J.; Van Dijck, Y.; Decramer, M.; Nemery, B. Accuracy of office spirometry performed by trained primary-care physicians using the MIR Spirobank hand-held spirometer. Respiration 2012, 83, 543–552. [Google Scholar] [CrossRef] [PubMed]
- Michailidis, C.; Smanis, I.; Stamatis, K.; Bergeles, C.; Kouris, A. Development of a smartphone-enabled spirometer for personalised respiratory health. In Proceedings of the 2014 4th International Conference on Wireless Mobile Communication and Healthcare-Transforming Healthcare Through Innovations in Mobile and Wireless Technologies (MOBIHEALTH), Athens, Greece, 3–5 November 2014; IEEE: Piscataway, NJ, USA, 2014; pp. 67–70. [Google Scholar]
- Al-Qerem, W.A. How applicable are GLI 2012 equations to a sample of Middle Eastern school-age children? Pediatr. Pulmonol. 2020, 55, 986–993. [Google Scholar] [CrossRef]
- Stasinopoulos, D.M.; Rigby, R.A. Generalized additive models for location scale and shape (GAMLSS) in R. J. Stat. Softw. 2008, 23, 1–46. [Google Scholar]
- Quanjer, P.H.; Stocks, J.; Cole, T.J.; Hall, G.L.; Stanojevic, S. Influence of secular trends and sample size on reference equations for lung function tests. Eur. Respir. J. 2011, 37, 658–664. [Google Scholar] [CrossRef]
- Stulp, G.; Barrett, L. Evolutionary perspectives on human height variation. Biol. Rev. 2016, 91, 206–234. [Google Scholar] [CrossRef]
- Fulambarker, A.; Copur, A.S.; Cohen, M.E.; Patel, M.; Gill, S.; Schultz, S.T.; Quanjer, P.H. Comparison of pulmonary function in immigrant vs US-born Asian Indians. Chest 2010, 137, 1398–1404. [Google Scholar] [CrossRef]
- Al-Qerem, W.; Hammad, A.M.; Gassar, E.S.; Al-Qirim, R.A.; Ling, J. Spirometry reference equations for an adult Middle Eastern population. Expert. Rev. Respir. Med. 2019, 13, 489–497. [Google Scholar] [CrossRef] [PubMed]
- Al-Rawas, O.A.; Baddar, S.; Al-Maniri, A.A.; Balaji, J.; Jayakrishnan, B.; Al-Riyami, B.M. Normal spirometric reference values for Omani adults. Lung 2009, 187, 245–251. [Google Scholar] [CrossRef]
- Cole, T.J.; Green, P.J. Smoothing reference centile curves: The LMS method and penalized likelihood. Stat. Med. 1992, 11, 1305–1319. [Google Scholar] [CrossRef]
- Rigby, R.A.; Stasinopoulos, D.M. Smooth centile curves for skew and kurtotic data modelled using the Box–Cox power exponential distribution. Stat. Med. 2004, 23, 3053–3076. [Google Scholar] [CrossRef]
- Rigby, R.A.; Stasinopoulos, D.M. Generalized additive models for location, scale and shape. J. R. Stat. Soc. Ser. C Appl. Stat. 2005, 54, 507–554. [Google Scholar] [CrossRef]
- Pride, N.B. Ageing and changes in lung mechanics. Eur. Respir. J. 2005, 26, 563–565. [Google Scholar] [CrossRef] [PubMed]
- Kubota, M.; Kobayashi, H.; Quanjer, P.H.; Omori, H.; Tatsumi, K.; Kanazawa, M. Reference values for spirometry, including vital capacity, in Japanese adults calculated with the LMS method and compared with previous values. Respir. Investig. 2014, 52, 242–250. [Google Scholar] [CrossRef] [PubMed]
- Pefura-Yone, E.W.; Balkissou, A.D.; Poka-Mayap, V.; Djenabou, A.; Massongo, M.; Ofimboudem, N.A.; Mayoh-Nguemfo, C.F.; Tsala, A.G.; Hadjara, H.; Amougou, F. Spirometric reference equations for Cameroonians aged 4 to 89 years derived using lambda, mu, sigma (LMS) method. BMC Pulm. Med. 2021, 21, 344. [Google Scholar] [CrossRef]
- Jo, B.S.; Myong, J.P.; Rhee, C.K.; Yoon, H.K.; Koo, J.W.; Kim, H.R. Reference Values for Spirometry Derived Using Lambda, Mu, Sigma (LMS) Method in Korean Adults: In Comparison with Previous References. J. Korean Med. Sci. 2018, 33, e16. [Google Scholar] [CrossRef]
- Lee, H.W.; Lee, J.K.; Hwang, Y.I.; Seo, H.; Ahn, J.H.; Kim, S.R.; Kim, H.J.; Jung, K.S.; Yoo, K.H.; Kim, D.K. Spirometric Interpretation and Clinical Relevance According to Different Reference Equations. J. Korean Med. Sci. 2024, 39, e20. [Google Scholar] [CrossRef]
- Tanabe, N. Is the Global Lung Function Initiative Race-Neutral Spirometry Reference Equation Ready for Clinical Use Around the World? Chest 2025, 167, 303–304. [Google Scholar] [CrossRef] [PubMed]
- Wilson, D.O.; Rogers, R.M.; Hoffman, R.M. Nutrition and chronic lung disease. Am. Rev. Respir. Dis. 1985, 132, 1347–1365. [Google Scholar]
- United Nations D of E and SAPD. World Population Prospects: The 2024 Revision. 2024. Available online: https://population.un.org/wpp/ (accessed on 24 December 2024).
- Al-Riyami, B.M.; Al-Rawas, O.A.; Hassan, M.O. Normal spirometric reference values for Omani children and adolescents. Respirology 2004, 9, 387–391. Available online: https://www.zuj.edu.jo/wp-content/uploads/2020/09/Abstract-1.pdf (accessed on 5 January 2025). [CrossRef]
- Aloosh, O.; Torkashvand, M.; Torkashvand, A.; Mohammadi, N. Evaluation of Spirometric Values in Healthy Population Referred to Spirometry Centers in Hamedan City, Iran. J. Iran. Med. Counc. 2022, 5, 661–667. [Google Scholar] [CrossRef]
- Im, E.O.; Chee, W. Recruitment of research participants through the Internet. Comput. Inf. Nurs. 2004, 22, 289–297. [Google Scholar] [CrossRef]
- DataReportal—Global Digital Insights. Digital 2025: Iraq. Available online: https://datareportal.com/reports/digital-2025-iraq?utm_source=chatgpt.com (accessed on 2 April 2025).
Disclaimer/Publisher’s Note: The statements, opinions and data contained in all publications are solely those of the individual author(s) and contributor(s) and not of MDPI and/or the editor(s). MDPI and/or the editor(s) disclaim responsibility for any injury to people or property resulting from any ideas, methods, instructions or products referred to in the content. |
© 2025 by the authors. Licensee MDPI, Basel, Switzerland. This article is an open access article distributed under the terms and conditions of the Creative Commons Attribution (CC BY) license (https://creativecommons.org/licenses/by/4.0/).