

Development and Psychometric Validation of the Patient Experience for Disease Management Scale (PEDMS) in Outpatient Settings in Najran, Saudi Arabia


Abstract
1. Introduction
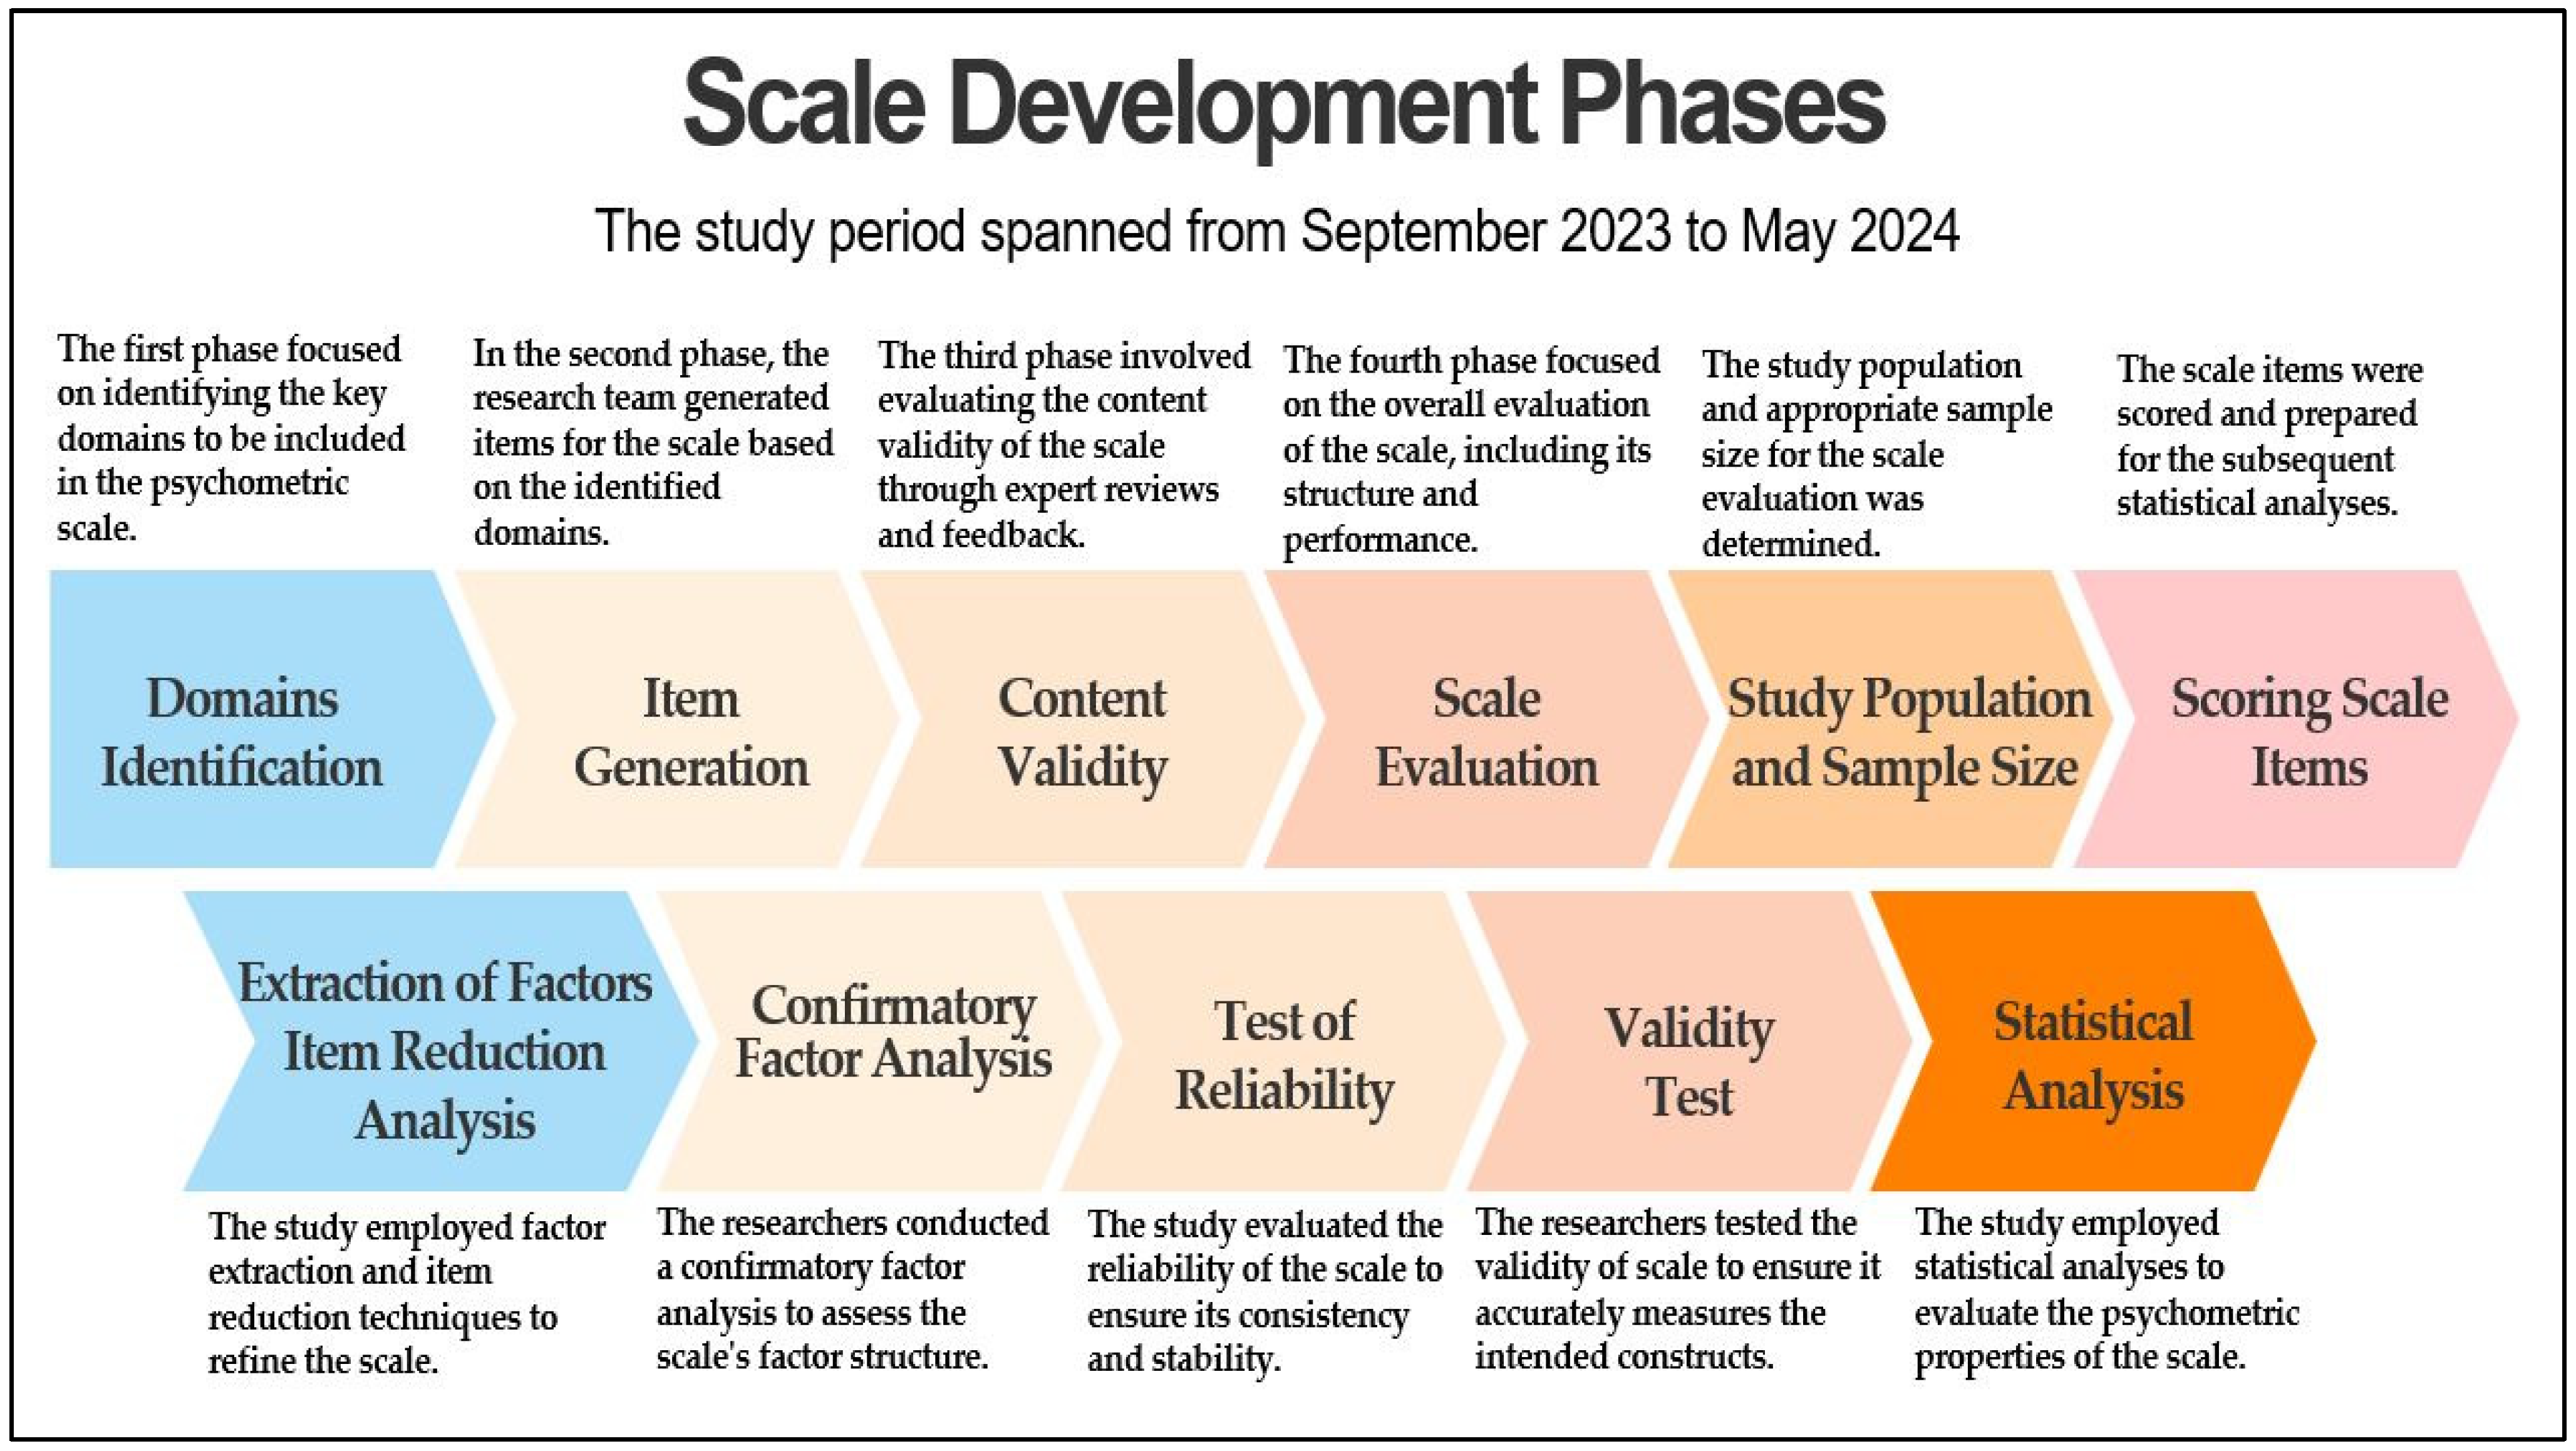
2. Methodology
2.1. Study Design, Setting, and Timing
2.2. Scale Development
2.3. Domain Identification
2.4. Item Generation
2.5. Content Validity
2.6. Scale Evaluation
2.6.1. Determining the Type of Data and Data Collection Design
2.6.2. Establishing the Study Population and Sample Size
2.6.3. Scoring Scale Items
2.7. Extraction of Factors and Item Reduction Analysis
2.8. Confirmatory Factor Analysis (CFA)
2.9. Test of Reliability
2.10. Validity Test
2.11. Statistical Analysis
3. Results
3.1. Characteristics of Study Sample
3.2. Domain Identification
3.3. Pre-Test Results (Pilot Study)
3.4. Content Validity Index at Item Level (I-CVI) Score
3.5. Exploratory Factor Analysis (EFA)
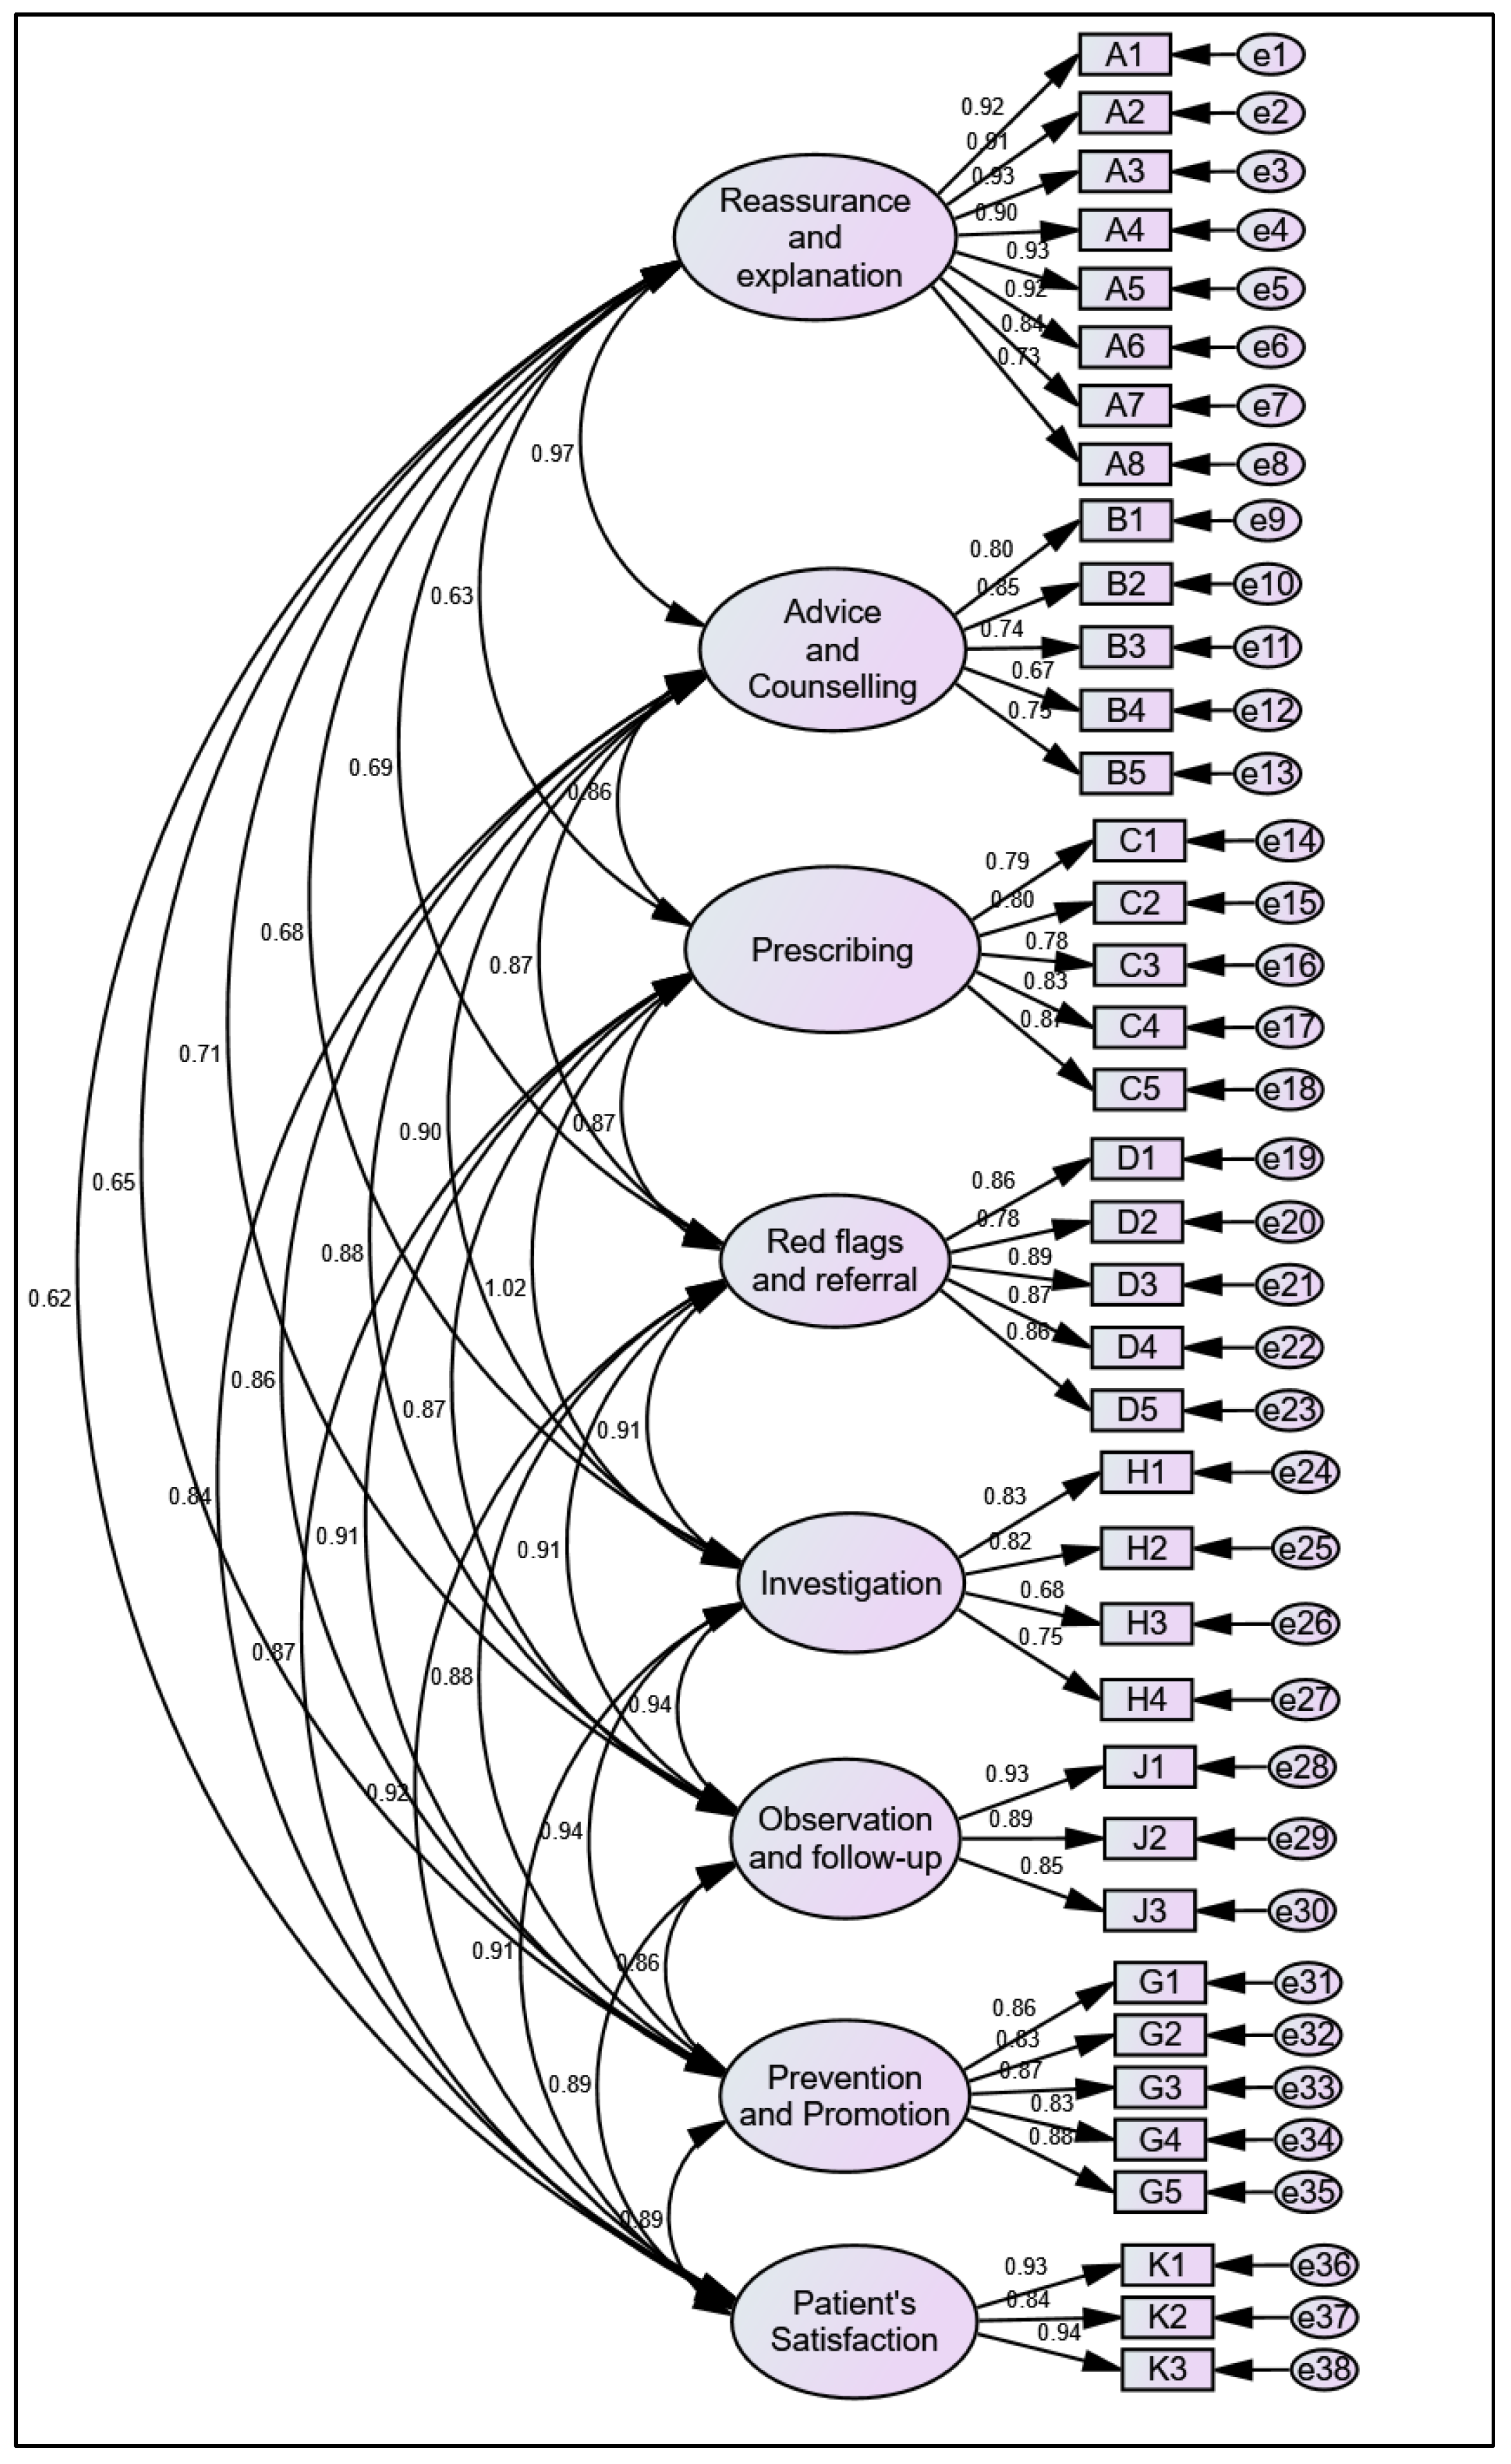
3.6. Confirmatory Factor Analysis (CFA)
3.7. Reliability Test
4. Discussion
5. Conclusions
- Routine Check-Ups: Standardized metrics will help capture patient feedback on routine visits, ensuring that aspects such as appointment scheduling, waiting times, and overall satisfaction are consistently monitored and improved.
- Chronic Disease Management: For patients managing chronic conditions, the PEDMS will provide insights into their ongoing care experiences, including the effectiveness of communication with healthcare providers, the coordination of care, and the support received for self-management.
- Specialized Treatments: In cases where patients receive specialized treatments (e.g., oncology and cardiology), the PEDMS will help assess the quality of care, patient-provider interactions, and the adequacy of information provided about treatment options and outcomes.
- Post-Treatment Follow-Ups: The scale will be used to evaluate patient experiences during follow-up visits, focusing on the continuity of care, the clarity of post-treatment instructions, and the overall support provided during recovery.
6. Strengths and Limitations
Funding
Institutional Review Board Statement
Informed Consent Statement
Data Availability Statement
Acknowledgments
Conflicts of Interest
References
- Benson, T.; Benson, A. Routine measurement of patient experience. BMJ Open Qual. 2023, 12, e002073. [Google Scholar] [CrossRef]
- Doyle, C.; Lennox, L.; Bell, D. A systematic review of evidence on the links between patient experience and clinical safety and effectiveness. BMJ Open 2013, 3, e001570. [Google Scholar] [CrossRef] [PubMed]
- Manary, M.P.; Boulding, W.; Staelin, R.; Glickman, S.W. The patient experience and health outcomes. N. Engl. J. Med. 2013, 368, 201–203. [Google Scholar] [CrossRef]
- Patel, N.J.; Datye, K.A.; Jaser, S.S. Importance of Patient–Provider Communication to Adherence in Adolescents with Type 1 Diabetes. Healthcare 2018, 6, 30. [Google Scholar] [CrossRef] [PubMed]
- Zolnierek, K.B.; Dimatteo, M.R. Physician communication and patient adherence to treatment: A meta-analysis. Med. Care 2009, 47, 826–834. [Google Scholar] [CrossRef]
- Anderson, S. Examining the relationship between patient experience and readmission rates: A profile deviation analysis. Health Serv. Manag. Res. 2021, 34, 234–240. [Google Scholar] [CrossRef] [PubMed]
- Tunsi, A.; Alhelal, R.; Mujalled, R.; Alhadrami, E.; Alsulami, R.; Alhofaian, A.; Alaamri, M.; Babkair, L. Chronic illness patients’ perceptions of quality of care during hospitalization: A qualitative study. SAGE Open Nurs. 2023, 9, 23779608221150706. [Google Scholar] [CrossRef]
- Onwumere, J.; Odilibe, A.; Elufioye, P.; Omaghomi, T.; Akomolafe, O. Patient experience and satisfaction in healthcare: A focus on managerial approaches—A review. Int. Med. Sci. Res. J. 2024, 4, 194–209. [Google Scholar] [CrossRef]
- Avlijas, T.; Squires, J.E.; Lalonde, M.; Backman, C. A concept analysis of the patient experience. Patient Exp. J. 2023, 10, 15–63. [Google Scholar] [CrossRef]
- Cadel, L.; Marcinow, M.; Singh, H.; Kuluski, K. The use of patient experience data for quality improvement in hospitals: A scoping review. Patient Exp. J. 2022, 9, 174–188. [Google Scholar] [CrossRef]
- Batbaatar, E.; Dorjdagva, J.; Luvsannyam, A.; Savino, M.M.; Amenta, P. Determinants of patient satisfaction: A systematic review. Perspect. Public Health 2017, 137, 89–101. [Google Scholar] [CrossRef]
- Beattie, M.; Murphy, D.J.; Atherton, I.; Lauder, W. Instruments to measure patient experience of healthcare quality in hospitals: A systematic review. Syst. Rev. 2015, 4, 97. [Google Scholar] [CrossRef] [PubMed]
- Ahmed, F.; Burt, J.; Roland, M. Measuring patient experience: Concepts and methods. Patient 2014, 7, 235–241. [Google Scholar] [CrossRef] [PubMed]
- Forestier, B.; Anthoine, E.; Reguiai, Z.; Fohrer, C.; Blanchin, M. A systematic review of dimensions evaluating patient experience in chronic illness. Health Qual. Life outcomes 2019, 17, 19. [Google Scholar] [CrossRef] [PubMed]
- Patient Management (General Practice). 20 August 2024. Available online: https://gpnotebook.com/pages/general-practice/patient-management-general-practice (accessed on 2 November 2024).
- Himmel, W.; Rogausch, A.; Kochen, M. 7.1 Principles of patient management. In Oxford Textbook of Primary Medical Care; Oxford University Press: Oxford, UK, 2004. [Google Scholar]
- McAvoy, B. Chapter 4—Patient management. In Clinical Method: A General Practice Approach, 2nd ed.; Fraser, R.C., Ed.; Butterworth Heinemann: Oxford, UK, 1992. [Google Scholar]
- Devellis, R.F. Scale Development: Theory and Applications; Sage Publications: New York, NY, USA, 2016; Available online: https://tms.iau.ir/file/download/page/1635238305-develis-2017.pdf (accessed on 2 November 2024).
- Boateng, G.O.; Neilands, T.B.; Frongillo, E.A.; Melgar-Quiñonez, H.R.; Young, S.L. Best Practices for Developing and Validating Scales for Health, Social, and Behavioral Research: A Primer. Front. Public Health 2018, 6, 149. [Google Scholar] [CrossRef] [PubMed]
- Anthoine, E.; Moret, L.; Regnault, A.; Sébille, V.; Hardouin, J.-B. Sample Size Used to Validate a Scale: A Review of Publications on Newly-Developed Patient Reported Outcomes Measures. Health Qual. Life Outcomes 2014, 12, 176. [Google Scholar] [CrossRef]
- Draxler, C.; Kubinger, K.D. Power and Sample Size Considerations in Psychometrics. In Springer Proceedings in Mathematics & Statistics; Springer International Publishing: Cham, Switzerland, 2018; pp. 39–51. ISBN 9783319760346. [Google Scholar]
- Kennedy, I. Sample Size Determination in Test-Retest and Cronbach Alpha Reliability Estimates. Br. J. Contemp. Educ. 2022, 2, 17–29. [Google Scholar] [CrossRef]
- Bartlett, M.S. Tests of significance in factor analysis. Br. J. Math. Stat. Psychol. 1950, 3, 77–85. [Google Scholar] [CrossRef]
- Hu, L.-T.; Bentler, P.M. Cutoff criteria for fit indexes in covariance structure analysis: Conventional criteria versus new alternatives. Struct. Equ. Model. 1999, 6, 1–55. [Google Scholar] [CrossRef]
- Nunnally, J.C. Psychometric Theory, 2nd ed.; Mc Graw Hill: New York, NY, USA, 1978. [Google Scholar]
- Hair, J., Jr.; Sarstedt, M.; Hopkins, L.; Kuppelwieser, V.G. Partial least squares structural equation modeling (PLS-SEM): An emerging tool in business research. Eur. Bus. Rev. 2014, 26, 106–121. [Google Scholar] [CrossRef]
- Osborne, J.W.; Costello, A.B.; Kellow, J.T. Exploratory factor analysis (EFA) is rightly described as both an art and a science, whereresearchers follow a series of ana-lytic steps involving judgments more reminis-cent of qualitative inquiry, an interesting irony given the mathematical sophistication underlying EFA models. In Best Practices in Quantitative Methods; Sage: London, UK, 2008. [Google Scholar]
- Osborne, J.W.; Fitzpatrick, D.C. Replication analysis in exploratory factor analysis: What it is and why it makes your analysis better. Pract. Assess. Res. Eval. 2012, 17, 2. [Google Scholar]
- Kaiser, H.F. An index of factorial simplicity. Psychometrika 1974, 39, 31–36. [Google Scholar] [CrossRef]
- Chin, W.W. How to Write up and Report PLS Analyses. In Handbook of Partial Least Squares; Springer: Berlin/Heidelberg, Germany, 2010; pp. 655–690. ISBN 9783540328254. [Google Scholar]
- Guetterman, T.C.; Fetters, M.D.; Creswell, J.W. Integrating Quantitative and Qualitative Results in Health Science Mixed Methods Research Through Joint Displays. Ann. Fam. Med. 2015, 13, 554–561. [Google Scholar] [CrossRef]
- Politi, M.C.; Dizon, D.S.; Frosch, D.L.; Kuzemchak, M.D.; Stiggelbout, A.M. Importance of clarifying patients’ desired role in shared decision making to match their level of engagement with their preferences. BMJ 2013, 347, f7066. [Google Scholar] [CrossRef]
- Traeger, A.C.; Hübscher, M.; Henschke, N.; Moseley, G.L.; Lee, H.; McAuley, J.H. Effect of Primary Care–Based Education on Reassurance in Patients With Acute Low Back Pain. JAMA Intern. Med. 2015, 175, 733. [Google Scholar] [CrossRef] [PubMed]
- Anderson, N.C.; Zhou, Y.; Humphris, G. How are emotional distress and reassurance expressed in medical consultations for people with long-term conditions who were unable to receive curative treatment? A pilot observational study with huntington’s disease and prostate cancer. Pilot Feasibility Stud. 2021, 7, 119. [Google Scholar] [CrossRef]
- Impact on Treatment Recommendations. Available online: https://www.euromedinfo.eu/impact-on-treatment-recommendations.html/ (accessed on 11 December 2024).
- NPS MedicineWise. Prescribing Competencies Framework: Embedding Quality Use of Medicines into Practice (2nd Edition). 2021. Available online: https://www.nps.org.au/assets/NPS/pdf/NPS-MedicineWise_Prescribing_Competencies_Framework.pdf (accessed on 11 December 2024).
- Van Tol, F.R.; Kamm, I.M.L.P.; Versteeg, A.L.; Suijkerbuijk, K.P.M.; Verkooijen, H.M.; Oner, C.; Verlaan, J.J. The use of red flags during the referral chain of patients surgically treated for symptomatic spinal metastases. Neuro-Oncol. Pract. 2023, 10, 301–306. [Google Scholar] [CrossRef]
- Starcevich, A.; Lombardo, P.; Schneider, M. Patient understanding of diagnostic ultrasound examinations in an Australian private radiology clinic. Australas. J. Ultrasound Med. 2021, 24, 82–88. [Google Scholar] [CrossRef]
- Cuzick, J. The importance of long-term follow up of participants in clinical trials. Br. J. Cancer 2023, 128, 432–438. [Google Scholar] [CrossRef]
- General Medical Council. Professional Standards for Doctors. 2024. Available online: https://www.gmc-uk.org/professional-standards/professional-standards-for-doctors (accessed on 15 December 2024).
- Renzi, P.; Franci, A. The Measurement of Patients’ Satisfaction as a Key Indicator of Quality of Life for the Elderly: Two Services Compared. Soc. Indic. Res. 2024. [Google Scholar] [CrossRef]
- Friedel, A.L.; Siegel, S.; Kirstein, C.F.; Gerigk, M.; Bingel, U.; Diehl, A.; Steidle, O.; Haupeltshofer, S.; Andermahr, B.; Chmielewski, W.; et al. Measuring Patient Experience and Patient Satisfaction-How Are We Doing It and Why Does It Matter? A Comparison of European and U.S. American Approaches. Healthcare 2023, 11, 797. [Google Scholar] [CrossRef] [PubMed]
- Ochieng, N.T.; Wilson, K.; Derrick, C.J.; Mukherjee, N. The use of focus group discussion methodology: Insights from two decades of application in conservation. Methods Ecol. Evol. 2018, 9, 20–32. [Google Scholar] [CrossRef]
- Bagheriyeh, F.; Ghahramanian, A.; Valizadeh, L.; Zamanzadeh, V. Improving the Face Validity of Self-Report Scales through Cognitive Interviews Based on Tourangeau Question and Answer Framework: A Practical Work on the Nursing Talent Identification Scale. Res. Sq. 2021. [Google Scholar] [CrossRef]
- Zamanzadeh, V.; Ghahramanian, A.; Rassouli, M.; Abbaszadeh, A.; Alavi-Majd, H.; Nikanfar, A.R. Design and Implementation Content Validity Study: Development of an instrument for measuring Patient-Centered Communication. J. Caring Sci. 2015, 4, 165–178. [Google Scholar] [CrossRef]
- Allen, M.S.; Robson, D.A.; Iliescu, D. Face Validity: A Critical but Ignored Component of Scale Construction in Psychological Assessment. Eur. J. Psychol. Assess. 2023, 39, 153–156. [Google Scholar] [CrossRef]
- Østerås, N.; Gulbrandsen, P.; Garratt, A.; Benth, J.S.; Dahl, F.A.; Natvig, B.; Brage, S. A randomised comparison of a four- and a five-point scale version of the Norwegian Function Assessment Scale. Health Qual. Life Outcomes 2008, 6, 14. [Google Scholar] [CrossRef]
- MacCallum, R.C.; Widaman, K.F.; Zhang, S.; Hong, S. Sample size in factor analysis. Psychol. Methods 1999, 4, 84–99. [Google Scholar] [CrossRef]
- Morgado, F.F.R.; Meireles, J.F.F.; Neves, C.M.; Amaral, A.C.S.; Ferreira, M.E.C. Scale development: Ten main limitations and recommendations to improve future research practices. Psicol. Refl. Crít. 2018, 30, 3. [Google Scholar] [CrossRef]

| n | % | ||
|---|---|---|---|
| Gender | Male | 243 | 40.5 |
| Female | 357 | 59.5 | |
| Age Mean (±SD) 33.74 (±14.69) | 20 years or less | 121 | 20.2 |
| 21–40 years | 281 | 46.8 | |
| Above 40 years | 198 | 33.0 | |
| Marital status | Single | 202 | 33.7 |
| Married | 386 | 64.3 | |
| Divorced | 8 | 1.3 | |
| Widow | 4 | 0.7 | |
| Nationality | Saudi | 336 | 56.0 |
| Non-Saudi | 264 | 44.0 | |
| Education | Illiterate | 29 | 4.8 |
| General education—primary/intermediate/secondary | 263 | 43.8 | |
| University education—diploma/bachelor | 292 | 48.7 | |
| Postgraduate education—master’s/Ph.D. | 6 | 1.0 | |
| Other | 10 | 1.7 | |
| Residency | Rural | 66 | 11.0 |
| Semiurban | 289 | 48.2 | |
| Urban | 245 | 40.8 | |
| Family type | Nuclear | 88 | 14.7 |
| Extended | 512 | 85.3 | |
| Family member number | <3 | 53 | 8.8 |
| From 3 to 7 | 445 | 74.2 | |
| From 8 to 14 | 91 | 15.2 | |
| >15 | 11 | 1.8 | |
| Employment | Nothing | 314 | 52.3 |
| Governmental | 138 | 23.0 | |
| Private | 136 | 22.7 | |
| Nonprofit | 1 | 0.2 | |
| Self-employed | 11 | 1.8 | |
| Economic status | Extremely low | 30 | 5.0 |
| Low | 176 | 29.3 | |
| Moderate | 338 | 56.3 | |
| Above moderate | 56 | 9.3 | |
| Domain | Description |
|---|---|
| Reassurance/explanation | Providing patients with clear, concise information about their health conditions and treatment plans, along with realistic hope and emotional support. |
| Advice/counseling | Tailoring recommendations based on individual patient needs, preferences, and circumstances enhances overall well-being and empowers patients to take an active role in their care. |
| Prescribing | Selecting appropriate medications, determining dosages, providing clear instructions for use, discussing potential side effects, and emphasizing the importance of adherence. |
| Red flags/referral | A proactive approach ensures that patients can identify warning manifestations that indicate potentially serious underlying conditions requiring further evaluation and that they understand the rationale for referral. |
| Investigation | Ensuring that patients understand the purpose and significance of the tests, imaging, and procedures being conducted. |
| Observation/follow-up | An ongoing process of monitoring a patient’s condition involves detecting any changes in health status and making necessary adjustments to the treatment plan. |
| Prevention/promotion | Proactive measures aimed at reducing the risk of other diseases and enhancing overall health and well-being include encouraging positive behaviors. |
| Patient’s wants/needs/satisfaction | Understanding and addressing individual preferences and requirements in the healthcare experience, along with considering patient satisfaction. |
| Items | Factor Loading | Cronbach’s Alpha | Cronbach’s Alpha If Item Deleted | |||||||
|---|---|---|---|---|---|---|---|---|---|---|
| 1 | 2 | 3 | 4 | 5 | 6 | 7 | 8 | |||
| Reassurance and Explanation | ||||||||||
| 1. The doctor treats my need for reassurance as the primary reason for seeking medical services. | 0.788 | 0.876 | 0.872 | |||||||
| 2. I receive appropriate reassurance that maintains the doctor’s credibility. | 0.789 | 0.871 | ||||||||
| 3. The doctor provides effective reassurance through thorough history taking and examination. | 0.907 | 0.874 | ||||||||
| 4. The doctor offers an appropriate degree of explanation regarding my illness. | 0.918 | 0.872 | ||||||||
| 5. The doctor explores my understanding and fears concerning the symptoms. | 0.919 | 0.873 | ||||||||
| 6. I trust the doctor due to effective communication. | 0.942 | 0.874 | ||||||||
| 7. The doctor considers my understanding, education, cultural background, medical experience, and personality. | 0.873 | 0.872 | ||||||||
| 8. I have a strong bond with the doctor based on continuity of care. | 0.927 | 0.874 | ||||||||
| Advice and Counseling | ||||||||||
| 1. The doctor’s advice is realistically adapted to my circumstances, lifestyle, and personality. | 0.766 | 0.835 | 0.828 | |||||||
| 2. The doctor helps me identify the physical, psychological, and social aspects of my illness. | 0.767 | 0.821 | ||||||||
| 3. The doctor assists me in implementing my own solutions for my condition by providing insights and identifying possible actions. | 0.729 | 0.819 | ||||||||
| 4. The doctor convinces me that I am not physically or psychologically ill; rather, I am facing challenges in adapting to or coping with everyday problems. | 0.631 | 0.815 | ||||||||
| 5. The doctor counsels me to recognize the need to modify unhealthy behaviors. | 0.633 | 0.821 | ||||||||
| Prescribing | ||||||||||
| 1. I believe the doctor considers any warnings regarding medication safety before prescribing. | 0.665 | 0.840 | 0.827 | |||||||
| 2. I think the doctor prescribes the most effective medication. | 0.599 | 0.828 | ||||||||
| 3. I believe the doctor takes into account the availability and affordability of medication before prescribing. | 0.740 | 0.827 | ||||||||
| 4. The doctor informs me about the possible adverse effects of medication prior to prescribing. | 0.660 | 0.824 | ||||||||
| 5. The doctor instructs me on the dosage, timing, and route of administration for the medication. | 0.730 | 0.827 | ||||||||
| Red Flags and Referral | ||||||||||
| 1. The doctor makes me aware of the signs that may indicate serious progression or complications that could occur. | 0.789 | 0.851 | 0.839 | |||||||
| 2. The doctor explains how I can manage if I encounter any potential serious progression or complications. | 0.876 | 0.835 | ||||||||
| 3. I believe the doctor arranges appropriate referrals when necessary. | 0.903 | 0.840 | ||||||||
| 4. The doctor details the referral process, including why, to whom, when, and where the referral will take place. | 0.765 | 0.840 | ||||||||
| 5. The doctor seeks feedback regarding the referral. | 0.773 | 0.839 | ||||||||
| Investigation | ||||||||||
| 1. I believe the doctor requests appropriate investigations | 0.757 | 0.836 | 0.821 | |||||||
| 2. I think the doctor considers the risks and costs justified by the value of the information likely to be gained from the tests. | 0.707 | 0.813 | ||||||||
| 3. I understand the purpose of the requested investigations. | 0.595 | 0.825 | ||||||||
| 4. The doctor discusses with me what is being looked for in the results. | 0.757 | 0.809 | ||||||||
| Observation and Follow-up | ||||||||||
| 1. The doctor encourages follow-up visits to monitor progress. | 0.774 | 0.879 | 0.873 | |||||||
| 2. I believe the doctor schedules appropriate appointments for follow-up. | 0.774 | 0.871 | ||||||||
| 3. The doctor effectively addresses any issues related to follow-up. | 0.779 | 0.864 | ||||||||
| Prevention and Promotion | ||||||||||
| 1. The doctor conducts a comprehensive assessment beyond my specific complaints. | 0.938 | 0.840 | 0.821 | |||||||
| 2. I believe the doctor evaluates my risk of developing high-prevalence diseases. | 0.863 | 0.818 | ||||||||
| 3. The doctor suggests the most recommended preventive care for me, such as smoking cessation, weight loss, vaccinations, etc. | 0.620 | 0.836 | ||||||||
| 4. The doctor has a high degree of certainty that the suggested interventions will result in more benefits than harm. | 0.725 | 0.826 | ||||||||
| 5. The doctor initiates the most appropriate interventions to enhance my health. | 0.534 | 0.831 | ||||||||
| Patient’s wants, needs, and satisfaction | ||||||||||
| 1. The doctor knows my wants and treat them. | 0.639 | 0.827 | 0.821 | |||||||
| 2. The doctor knows my need and replenishes it. | 0.839 | 0.812 | ||||||||
| 3. The doctor accomplishes my satisfaction. | 0.715 | 0.801 | ||||||||
| Criteria | CFA Model | Thresholds |
|---|---|---|
| CMIN | 1015.378 | -- |
| DF | 637 | -- |
| CMIN/DF | 1.594 | Between 1 and 3 |
| p-value | *** | Between 0.05 and 0.000 |
| CFI | 0.965 | >0.95 |
| NFI | 0.975 | >0.95 |
| TLI | 0.973 | >0.95 |
| GFI | 0.952 | >0.90 |
| AGFI | 0.938 | >0.90 |
| SRMR | 0.051 | <0.08 |
| RMSEA | 0.067 | <0.08 |
| Factor 1 | Factor 2 | Factor 3 | Factor 4 | Factor 5 | Factor 6 | Factor 7 | Factor 8 | |
|---|---|---|---|---|---|---|---|---|
| Factor 1 | 0.859 | |||||||
| Factor 2 | 0.767 *** | 0.869 | ||||||
| Factor 3 | 0.524 *** | 0.551 *** | 0.795 | |||||
| Factor 4 | 0.669 *** | 0.671 *** | 0.518 *** | 0.883 | ||||
| Factor 5 | 0.828 *** | 0.733 *** | 0.542 *** | 0.758 *** | 0.773 | |||
| Factor 6 | 0.651 *** | 0.608 *** | 0.615 *** | 0.623 *** | 0.620 *** | 0.848 | ||
| Factor 7 | 0.704 *** | 0.608 *** | 0.622 *** | 0.700 *** | 0.754 *** | 0.612 *** | 0.886 | |
| Factor 8 | 0.768 *** | 0.683 *** | 0.531 *** | 0.677 *** | 0.748 *** | 0.526 *** | 0.617 *** | 0.878 |
| CR | 0.894 | 0.903 | 0.837 | 0.914 | 0.815 | 0.885 | 0.936 | 0.910 |
| AVE | 0.738 | 0.756 | 0.631 | 0.779 | 0.598 | 0.719 | 0.786 | 0.771 |
Disclaimer/Publisher’s Note: The statements, opinions and data contained in all publications are solely those of the individual author(s) and contributor(s) and not of MDPI and/or the editor(s). MDPI and/or the editor(s) disclaim responsibility for any injury to people or property resulting from any ideas, methods, instructions or products referred to in the content. |
© 2025 by the author. Licensee MDPI, Basel, Switzerland. This article is an open access article distributed under the terms and conditions of the Creative Commons Attribution (CC BY) license (https://creativecommons.org/licenses/by/4.0/).
Share and Cite
Alqahtani, N.S. Development and Psychometric Validation of the Patient Experience for Disease Management Scale (PEDMS) in Outpatient Settings in Najran, Saudi Arabia. Healthcare 2025, 13, 1191. https://doi.org/10.3390/healthcare13101191
Alqahtani NS. Development and Psychometric Validation of the Patient Experience for Disease Management Scale (PEDMS) in Outpatient Settings in Najran, Saudi Arabia. Healthcare. 2025; 13(10):1191. https://doi.org/10.3390/healthcare13101191
Chicago/Turabian StyleAlqahtani, Nasser Saeed. 2025. "Development and Psychometric Validation of the Patient Experience for Disease Management Scale (PEDMS) in Outpatient Settings in Najran, Saudi Arabia" Healthcare 13, no. 10: 1191. https://doi.org/10.3390/healthcare13101191
APA StyleAlqahtani, N. S. (2025). Development and Psychometric Validation of the Patient Experience for Disease Management Scale (PEDMS) in Outpatient Settings in Najran, Saudi Arabia. Healthcare, 13(10), 1191. https://doi.org/10.3390/healthcare13101191