
Examining Age-Adjusted Associations between BMI and Comorbidities in Mongolia: Cross-Sectional Prevalence

 , , ,
, , ,
Abstract
1. Introduction
2. Materials and Methods
2.1. Study Design and Participants
2.2. Data Collection
- Demographic Information: The collected data encompassed age, gender, education, where education was categorized into two groups: “lower” and “above”. The “lower” category included individuals with no education and those with fewer than 6 years of education. Marital status was divided into “married or cohabitant” and “others”, including individuals who were divorced, widowed, or single. Living area was categorized as individuals residing in either urban areas (city) or rural areas (countryside).
- Lifestyle Factors: Information on lifestyle choices covered fruit and vegetable consumption, assessed using visual aids. These research materials are familiar to doctors because Mongolia has used the WHO STEPS approach to conduct studies, which have been conducted four times since 2005 [16]. Intake exceeding 5 units was considered to meet the criteria for sufficient consumption [17]. Physical inactivity was defined as not achieving 10,000 steps a day or engaging in no additional sports or leisure activity weekly [18]. Smoking categorization included daily smokers, ex-smokers within the last 6 months, or non-smokers [19]. Alcohol use during health check-ups was evaluated by recording self-reported consumption within the last 30 days [20]. For females, the criterion for presence was defined as having consumed 4 or more drinks on a single occasion in the past 30 days. For males, the criteria included having consumed 5 or more drinks on a single occasion in the past 30 days [20]. The assessment utilized standard pictures of drinks to ensure consistency in understanding and reporting.
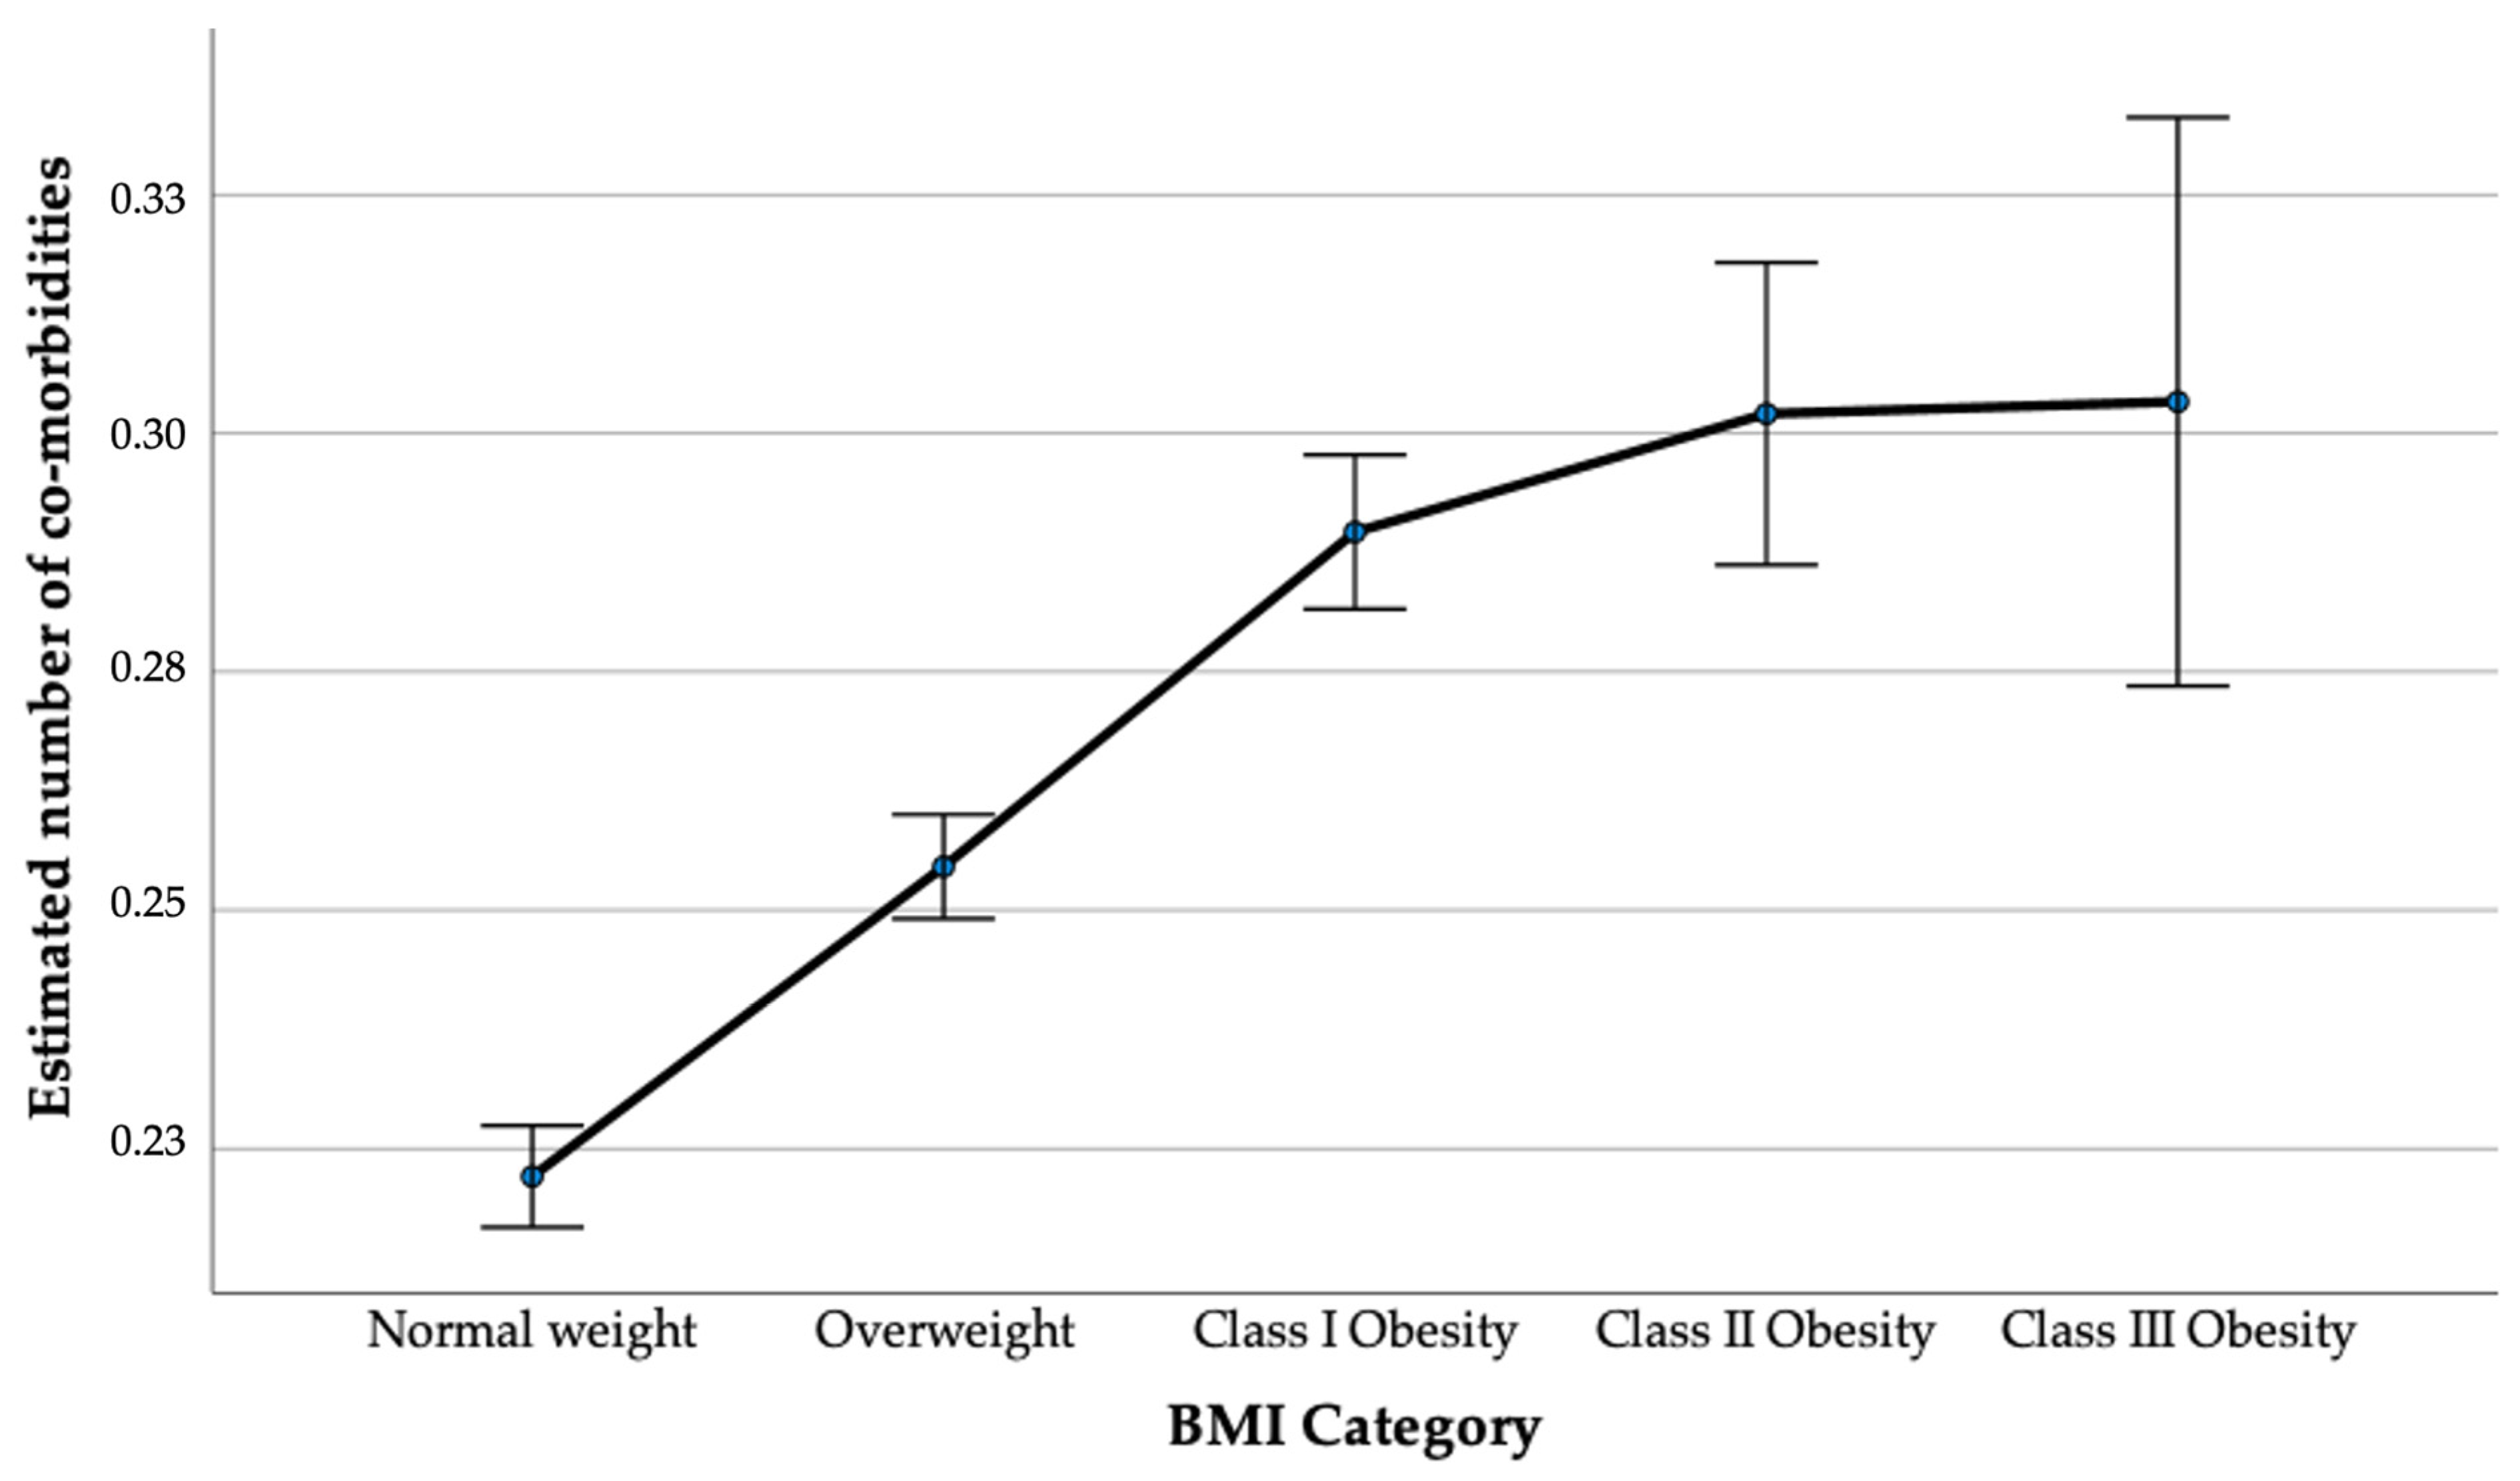
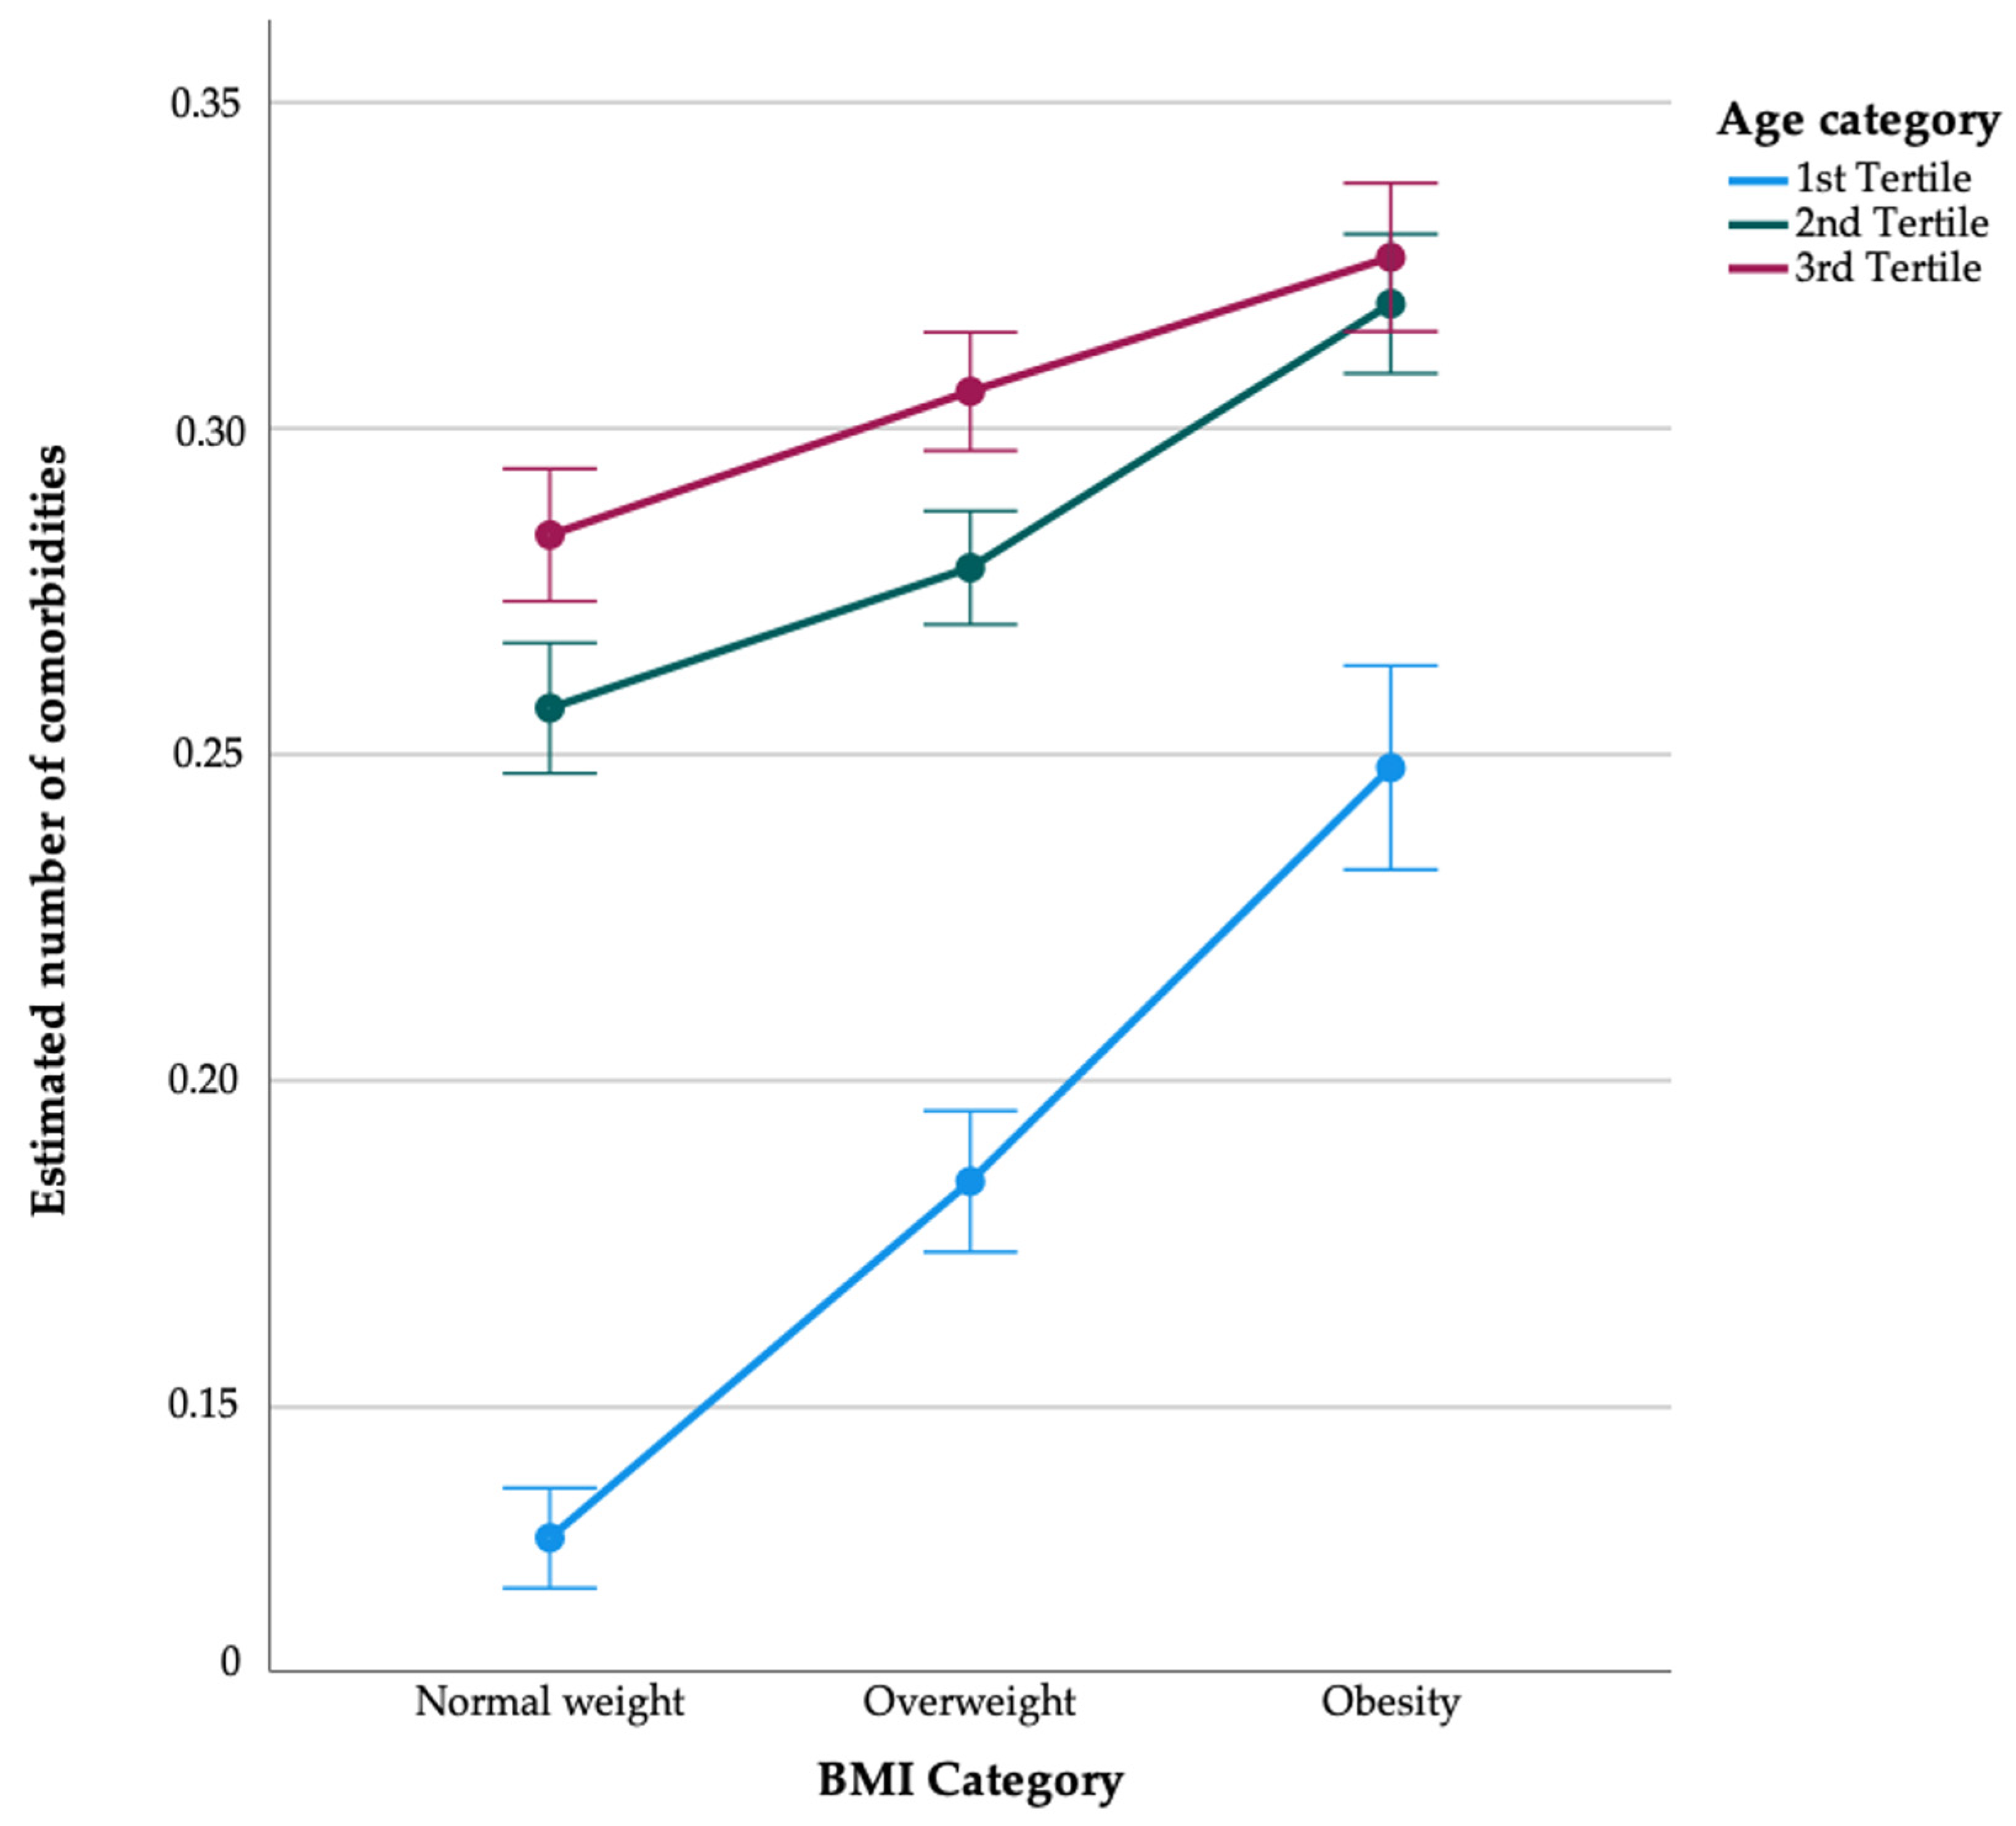
- BMI Measurements: BMI was calculated based on participants’ height and weight, categorizing individuals into normal weight (18.5–24.9 kg/m2), overweight (25–29.9 kg/m2), and three obesity categories (obese, Class I: 30–34.9 kg/m2; obese, Class II: 35–39.9 kg/m2; obese, Class III: ≥40 kg/m2) [1]. We further categorized normal and overweight individuals as non-obese, while those with a body mass index (BMI) exceeding 30 kg/m2 were classified as the obese group.
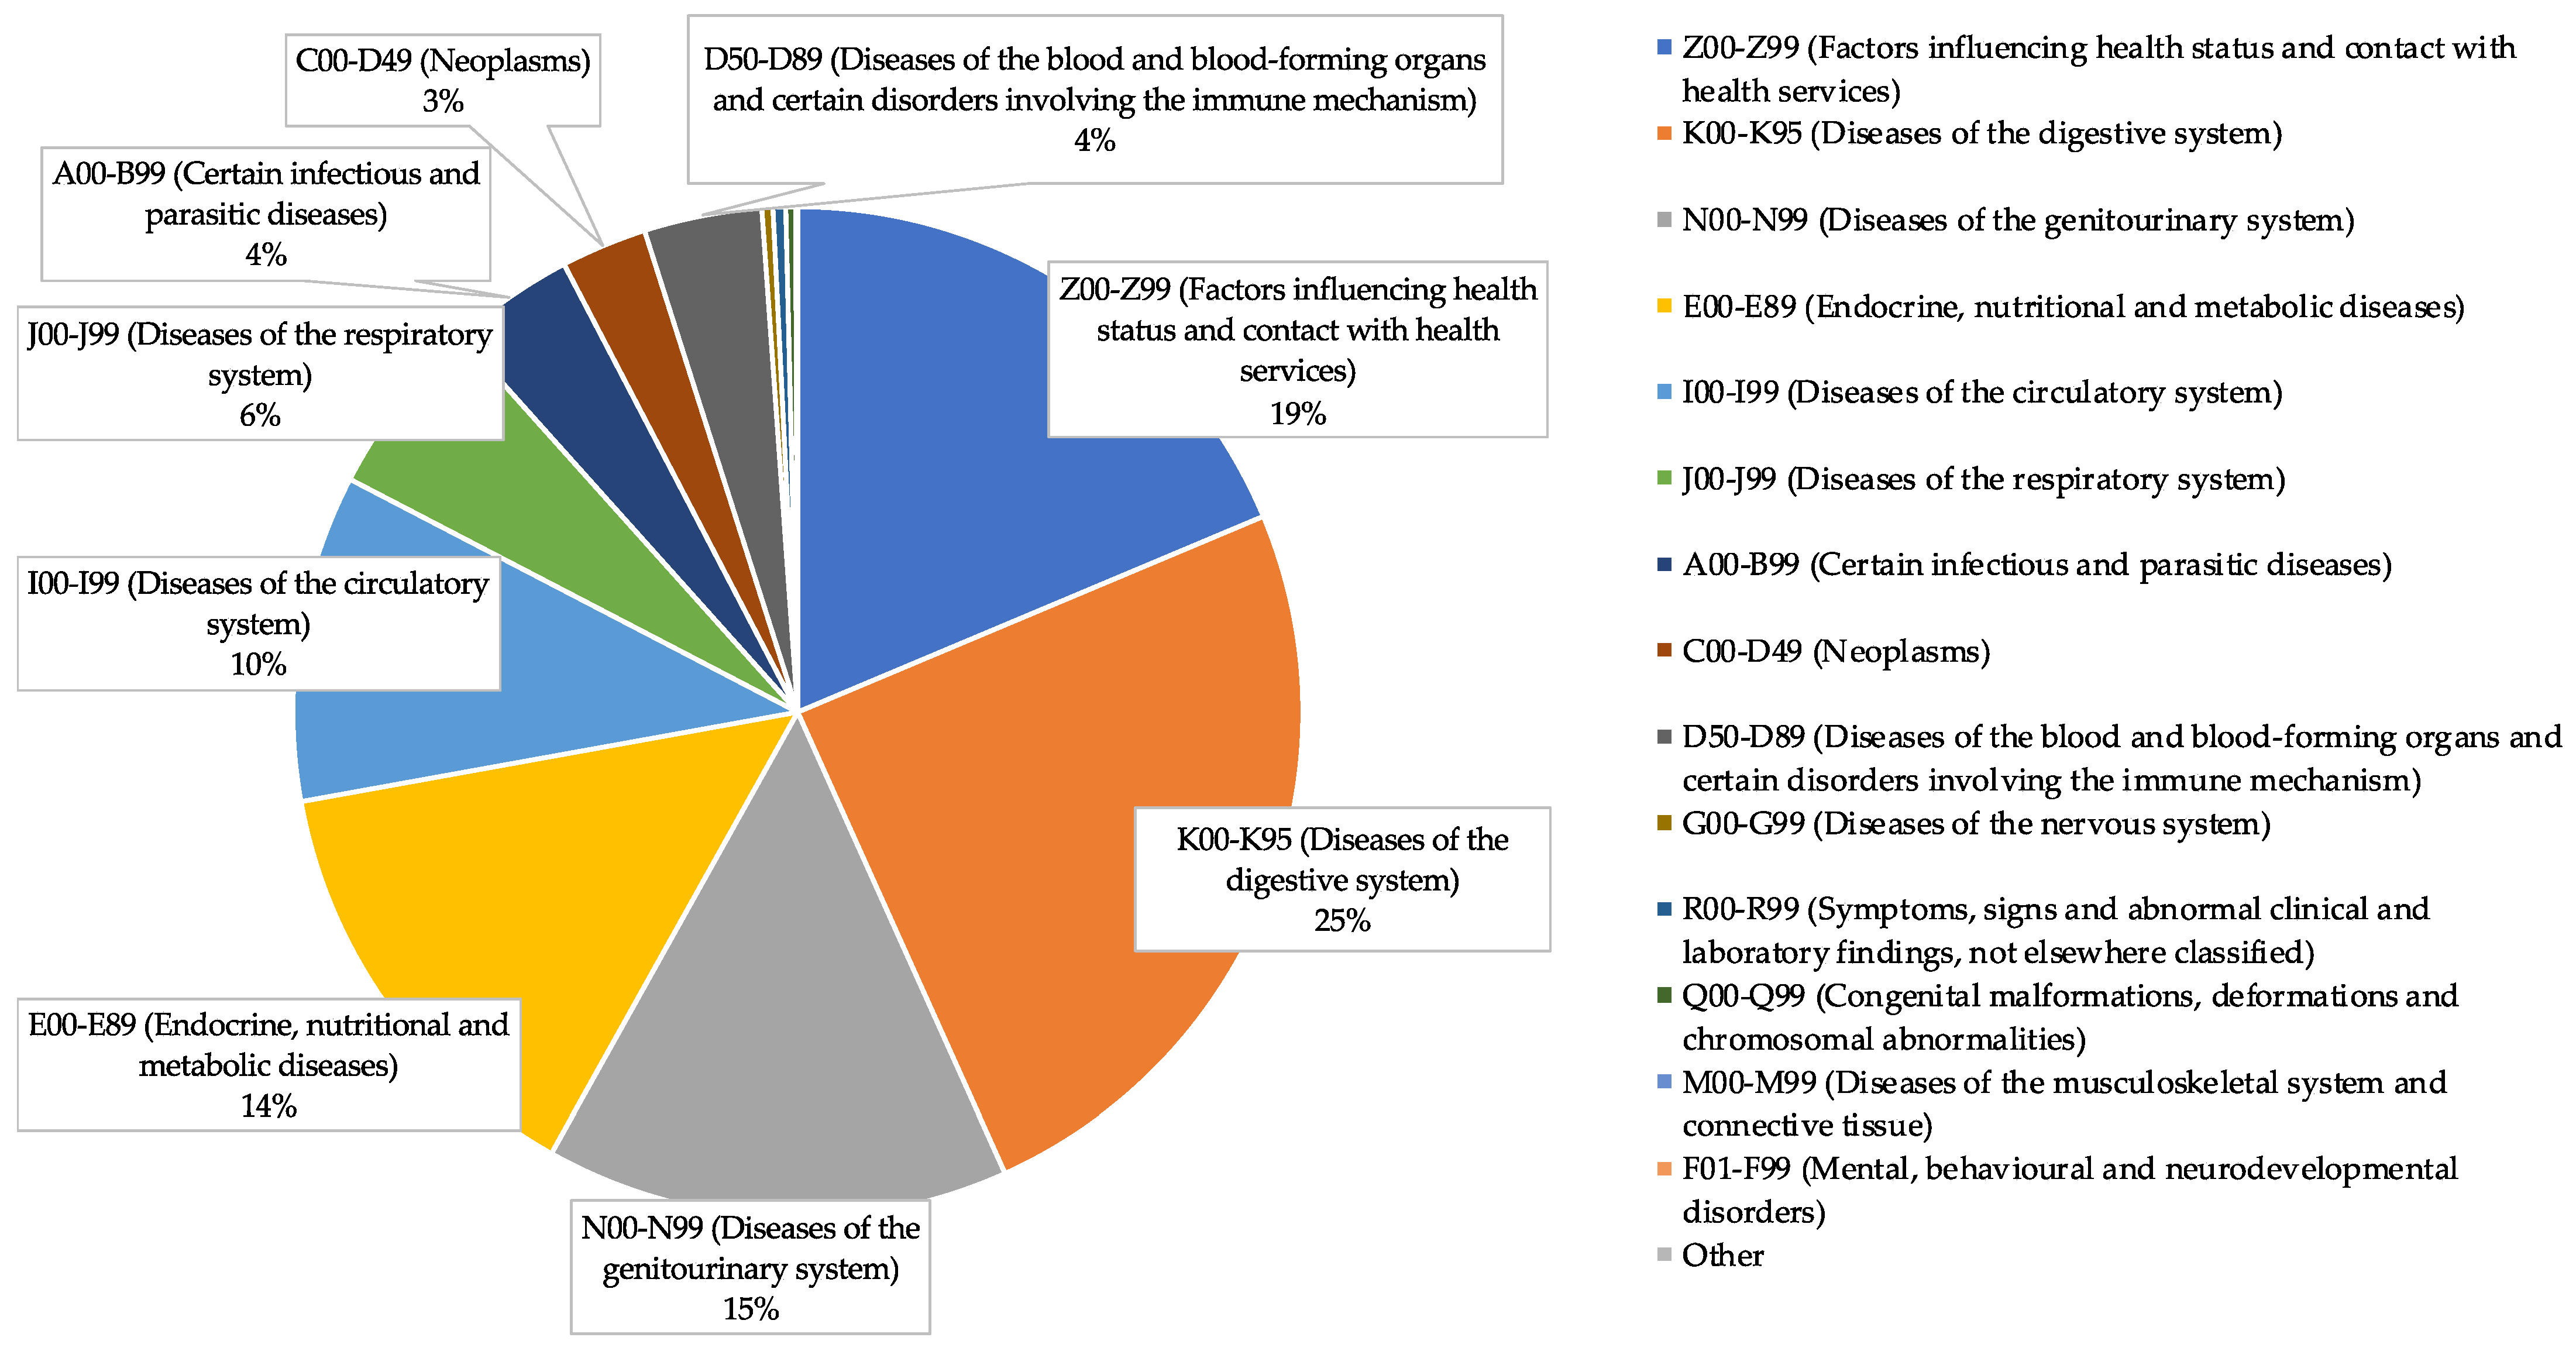
- Disease Diagnoses: Each participant was categorized based on ICD codes recorded by healthcare professionals using the ICD-10 classification system. Encounters falling within the Z00–Z99 range were considered indicative of no specific diseases, as these codes denote health examinations and administrative purposes and were not counted as specific diseases. To assess disease burden, participant health screening records underwent a thorough review to tally the total number of diagnosed conditions excluding those with Z codes. Participants were categorized as having multiple comorbidities if they reported three or more diagnosed conditions.
2.3. Statistical Analysis
3. Results
4. Discussion
5. Conclusions
Author Contributions
Funding
Institutional Review Board Statement
Informed Consent Statement
Data Availability Statement
Acknowledgments
Conflicts of Interest
References
- World Health Organization. The World Health Organization’s Classification of Body Mass Index; World Health Organization: Geneva, Switzerland, 1997. [Google Scholar]
- World Health Organization. Obesity and Overweight. 2022. Available online: https://www.who.int/news-room/fact-sheets/detail/obesity-and-overweight (accessed on 10 January 2024).
- Knight, J.A. Diseases and disorders associated with excess body weight. Ann. Clin. Lab. Sci. 2011, 41, 107–121. [Google Scholar]
- Zhang, X.; Ha, S.; Lau, H.C.H.; Yu, J. Excess body weight: Novel insights into its roles in obesity comorbidities. Semin. Cancer Biol. 2023, 92, 16–27. [Google Scholar] [CrossRef]
- Tsur, A.M.; Twig, G. The actual burden of obesity—Accounting for multimorbidity. Lancet Diabetes Endocrinol. 2022, 10, 233–234. [Google Scholar] [CrossRef]
- Wong, M.C.S.; Huang, J.; Wang, J.; Chan, P.S.; Lok, V.; Chen, X.; Leung, C.; Wang, H.H.; Lao, X.Q.; Zheng, Z.J. Global, regional and time-trend prevalence of central obesity: A systematic review and meta-analysis of 13.2 million subjects. Eur. J. Epidemiol. 2020, 35, 673–683. [Google Scholar] [CrossRef]
- Haththotuwa, R.N.; Wijeyaratne, C.N.; Senarath, U. Obesity and Obstetrics, 2nd ed.; Elsevier: Amsterdam, The Netherlands, 2020; pp. 3–8. [Google Scholar]
- The World Bank. Available online: https://www.worldbank.org/ (accessed on 10 January 2024).
- WHO. Mongolia Completes Its 4th Round of STEPS Survey on the Prevalence of NCD Risk Factors. 2020. Available online: https://www.who.int/mongolia/news/detail/29-06-2020-mongolia-completes-its-4th-round-of-steps-survey-on-the-prevalence-of-ncd-risk-factors (accessed on 10 January 2024).
- National Center for Public Health. The Problem of Nutrition of the Population of MONGOLIA. Report of the National Nutrition Survey V. Available online: https://www.unicef.org/mongolia/media/1121/file/NNS_V_Sedevchilsen_tailan_MN.pdf (accessed on 10 January 2024).
- Chimeddamba, O.; Gearon, E.; Stevenson, C.; Liviya Ng, W.; Baasai, B.; Peeters, A. Trends in adult overweight and obesity prevalence in Mongolia, 2005–2013. Obesity 2016, 24, 2194–2201. [Google Scholar] [CrossRef]
- Chimeddamba, O.; Gearon, E.; Brilleman, S.L.; Tumenjargal, E.; Peeters, A. Increases in waist circumference independent of weight in Mongolia over the last decade: The Mongolian STEPS surveys. BMC Obes. 2017, 4, 19. [Google Scholar] [CrossRef]
- Suvd, J.; Gerel, B.; Otgooloi, H.; Purevsuren, D.; Zolzaya, H.; Roglic, G.; King, H. Glucose intolerance and associated factors in Mongolia: Results of a national survey. Diabet. Med. 2002, 19, 502–508. [Google Scholar] [CrossRef]
- Yanjmaa, E.; Byambasukh, O.; Kannenberg, S.; Khasag, A.; Dambadarjaa, D.; Dalkh, T. Clinical And Laboratory Risk Factors of Newly Diagnosed with Type 2 Diabetes Adults. Malays. J. Nurs. 2018, 9, 93–98. [Google Scholar]
- Altankhuyag, I.; Byambaa, A.; Tuvshinjargal, A.; Bayarmunkh, A.; Jadamba, T.; Dagvajantsan, B.; Byambasukh, O. Association between hand-grip strength and risk of stroke among Mongolian adults: Results from a population-based study. Neurosci. Res. Notes 2021, 4, 8–16. [Google Scholar] [CrossRef]
- World Health Organization. WHO STEP Survey Methods. Available online: https://www.who.int/teams/noncommunicable-diseases/surveillance/systems-tools/steps/manuals (accessed on 8 June 2024).
- Kabwama, S.N.; Bahendeka, S.K.; Wesonga, R.; Mutungi, G.; Guwatudde, D. Low consumption of fruits and vegetables among adults in Uganda: Findings from a countrywide cross-sectional survey. Arch. Public Health 2019, 77, 4. [Google Scholar] [CrossRef]
- Tudor-Locke, C.; Craig, C.L.; Brown, W.J.; Clemes, S.A.; De Cocker, K.; Giles-Corti, B.; Hatano, Y.; Inoue, S.; Matsudo, S.M.; Mutrie, N.; et al. How many steps/day are enough? For adults. Int. J. Behav. Nutr. Phys. Act. 2011, 8, 79. [Google Scholar] [CrossRef]
- He, H.; Pan, L.; Cui, Z.; Sun, J.; Yu, C.; Cao, Y.; Wang, Y.; Shan, G. Smoking prevalence, patterns, and cessation among adults in Hebei province, central China: Implications from China national health survey (CNHS). Front. Public Health 2020, 8, 177. [Google Scholar] [CrossRef]
- Rehm, J.; Greenfield, T.K.; Rogers, J.D. Average volume of alcohol consumption, patterns of drinking, and all-cause mortality: Results from the US National Alcohol Survey. Am. J. Epidemiol. 2001, 153, 64–71. [Google Scholar] [CrossRef]
- Elagizi, A.; Kachur, S.; Carbone, S.; Lavie, C.J.; Blair, S.N. A Review of Obesity, Physical Activity, and Cardiovascular Disease. Curr. Obes. Rep. 2020, 9, 571–581. [Google Scholar] [CrossRef]
- Ward, Z.J.; Bleich, S.N.; Cradock, A.L.; Barrett, J.L.; Giles, C.M.; Flax, C.; Long, M.W.; Gortmaker, S.L. Projected U.S. state-level prevalence of adult obesity and severe obesity. N. Engl. J. Med. 2019, 381, 2440–2450. [Google Scholar] [CrossRef]
- de Mutsert, R.; Gast, K.; Widya, R.; de Koning, E.; Jazet, I.; Lamb, H.; le Cessie, S.; de Roos, A.; Smit, J.; Rosendaal, F.; et al. Associations of abdominal subcutaneous and visceral fat with insulin resistance and secretion differ between men and women: The Netherlands epidemiology of obesity study. Metab. Syndr. Relat. Disord. 2018, 16, 54–63. [Google Scholar] [CrossRef]
- Dorner, T.E.; Rieder, A. Obesity paradox in elderly patients with cardiovascular diseases. Int. J. Cardiol. 2012, 155, 56–65. [Google Scholar] [CrossRef]
- Johnson, J.G.; Cohen, P.; Kasen, S.; Brook, J.S. Childhood adversities associated with risk for eating disorders or weight problems during adolescence or early adulthood. Am. J. Psychiatry 2018, 175, 407–415. [Google Scholar] [CrossRef]
- Garcia-Poma, A.; Segami, M.I.; Mora, C.S.; Ugarte, M.F.; Terrazas, H.N.; Rhor, E.A.; García, E.; Ramos, M.P.; Alva, M.; Castañeda, I.; et al. Obesity is independently associated with impaired quality of life in patients with rheumatoid arthritis. Clin. Rheumatol. 2017, 36, 2723–2730. [Google Scholar] [CrossRef]
- Patel, K.; Trivedi, R.N.; Durgampudi, C.; Noel, P.; Cline, R.A.; DeLany, J.P.; Navina, S.; Singh, V.P. Lipolysis of Visceral Adipocyte Triglyceride by Pancreatic Lipases Converts Mild Acute Pancreatitis to Severe Pancreatitis Independent of Necrosis and Inflammation. Am. J. Pathol. 2015, 185, 808–819. [Google Scholar] [CrossRef]
- Twig, G.; Reichman, B.; Afek, A.; Derazne, E.; Hamiel, U.; Furer, A.; Gershovitz, L.; Bader, T.; Cukierman-Yaffe, T.; Kark, J.D.; et al. Severe obesity and cardio-metabolic comorbidities: A nationwide study of 2.8 million adolescents. Int. J. Obes. 2019, 43, 1391–1399. [Google Scholar] [CrossRef]
- Liu, N.; Birstler, J.; Venkatesh, M.; Hanrahan, L.; Chen, G.; Funk, L. Obesity and BMI Cut Points for Associated Comorbidities: Electronic Health Record Study. J. Med. Internet Res. 2021, 23, e24017. [Google Scholar] [CrossRef]
- Pantalone, K.M.; Hob, T.M. Prevalence and recognition of obesity and its associated comorbidities: Cross-sectional analysis of electronic health record data from a large US integrated health system. BMJ Open 2017, 7, e017583. [Google Scholar] [CrossRef]
- Gómez-Acebo, I.; Llorca, J.; Dierssen-Sotos, T. Obesity and Age-Related Comorbidities: A Population-Based Cross-Sectional Study. Front. Med. 2021, 8, 727388. [Google Scholar]
- Frontiers in Medicine. Association between Obesity and Comorbid Conditions Across Age Groups. Front. Med. 2021, 8, 704356. [Google Scholar]
- Song, X.; Wu, J.; Yu, C.; Dong, W.; Lv, J.; Guo, Y.; Bian, Z.; Yang, L.; Chen, Y.; Chen, Z.; et al. Association between multiple comorbidities and self-rated health status in middle-aged and elderly Chinese: The China Kadoorie Biobank study. BMC Public Health 2018, 18, 1–24. [Google Scholar] [CrossRef]
- Yang, Y.S.; Han, B.D.; Han, K.; Jung, J.H.; Son, J.W. Obesity Fact Sheet in Korea, 2021: Trends in obesity prevalence and obesity-related comorbidity incidence stratified by age from 2009 to 2019. J. Obes. Metab. Syndr. 2022, 31, 169. [Google Scholar] [CrossRef]
- Narayan, K.M.V.; Boyle, J.P.; Thompson, T.J.; Gregg, E.W.; Williamson, D.F. Effect of BMI on lifetime risk for diabetes in the US. Diabetes Care 2007, 30, 1562–1566. [Google Scholar] [CrossRef]
- Martin-Rodriguez, E.; Guillen-Grima, F.; Martí, A.; Brugos-Larumbe, A. Comorbidity associated with obesity in a large population: The APNA study. Obes. Res. Clin. Pract. 2015, 9, 435–447. [Google Scholar] [CrossRef]
- Misra, A.; Khurana, L. Obesity and the metabolic syndrome in developing countries. J. Clin. Endocrinol. Metab. 2008, 93 (Suppl. 1), s9–s30. [Google Scholar] [CrossRef]

| Findings | Total | Multiple Comorbidities | p-Value | |
|---|---|---|---|---|
| With | Without | |||
| Total | ||||
| Frequency, n | 181,080 | 7638 | 173,442 | - |
| Mean age ± SD, year | 47.0 ± 15.3 | 52.5 ± 11.9 | 46.8 ± 15.4 | <0.001 |
| Gender: male, % (n) | 42.0 (76,069) | 40.6 (3099) | 42.1 (72,970) | 0.005 |
| Education: lower level, % (n) | 7.8 (14,155) | 11.2 (854) | 7.7 (13,301) | <0.001 |
| Married or cohabitant, % (n) | 79.0 (143,086) | 87.2 (6657) | 78.7 (136,429) | <0.001 |
| Fruit and vegetables: sufficient, % (n) | 25.3 (45,863) | 29.1 (2222) | 25.2 (43,641) | <0.001 |
| Physical inactivity, % (n) | 66.2 (119,889) | 58.4 (4462) | 66.6 (115,427) | <0.001 |
| Smoking: smokers, % (n) | 19.0 (34,377) | 19.4 (1480) | 19.0 (32,897) | <0.001 |
| Alcohol use, % (n) | 7.6 (13,760) | 10.0 (764) | 7.5 (12,996) | <0.001 |
| BMI ± SD, kg/m2 | 26.8 ± 4.7 | 27.8 ± 4.8 | 26.7 ± 4.7 | <0.001 |
| Analysis and BMI Category | Association of BMI with Multi-Disease Risk | |||||||
|---|---|---|---|---|---|---|---|---|
| Unstandardized Beta Coefficient | 95% CI | p Value | Odds Ratio | 95% CI | p Value | |||
| Lower Bound | Upper Bound | Lower Bound | Upper Bound | |||||
| Unadjusted | ||||||||
| Normal weight (18.5–24.9) | 0 (reference) | - | - | - | 1.0 (reference) | - | - | - |
| Overweight (25–29.9) | 0.029 | 0.026 | 0.033 | <0.001 | 1.24 | 1.20 | 1.27 | <0.001 |
| Obese (≥30.0) | 0.049 | 0.045 | 0.053 | <0.001 | 1.40 | 1.35 | 1.44 | <0.001 |
| Adjusted for age | ||||||||
| Normal weight (18.5–24.9) | 0 (reference) | - | - | - | 1.0 (reference) | - | - | - |
| Overweight (25–29.9) | 0.017 | 0.013 | 0.021 | <0.001 | 1.15 | 1.11 | 1.18 | <0.001 |
| Obese (≥30.0) | 0.034 | 0.030 | 0.039 | <0.001 | 1.27 | 1.23 | 1.32 | <0.001 |
| Adjusted for age, gender | ||||||||
| Normal weight (18.5–24.9) | 0 (reference) | - | - | - | 1.0 (reference) | - | - | - |
| Overweight (25–29.9) | 0.017 | 0.013 | 0.020 | <0.001 | 1.15 | 1.11 | 1.18 | <0.001 |
| Obese (≥30.0) | 0.036 | 0.031 | 0.040 | <0.001 | 1.27 | 1.23 | 1.32 | <0.001 |
| Adjusted for age, gender, education, marital status, and lifestyle | ||||||||
| Normal weight (18.5–24.9) | 0 (reference) | - | - | - | 1.0 (reference) | - | - | - |
| Overweight (25–29.9) | 0.016 | 0.013 | 0.020 | <0.001 | 1.13 | 1.10 | 1.17 | <0.001 |
| Obese (≥30.0) | 0.035 | 0.030 | 0.039 | <0.001 | 1.27 | 1.23 | 1.32 | <0.001 |
Disclaimer/Publisher’s Note: The statements, opinions and data contained in all publications are solely those of the individual author(s) and contributor(s) and not of MDPI and/or the editor(s). MDPI and/or the editor(s) disclaim responsibility for any injury to people or property resulting from any ideas, methods, instructions or products referred to in the content. |
© 2024 by the authors. Licensee MDPI, Basel, Switzerland. This article is an open access article distributed under the terms and conditions of the Creative Commons Attribution (CC BY) license (https://creativecommons.org/licenses/by/4.0/).
Share and Cite
Enkhtugs, K.; Byambasukh, O.; Boldbaatar, D.; Tsedev-Ochir, T.-O.; Enebish, O.; Sereejav, E.; Dangaa, B.; Bayartsogt, B.; Yadamsuren, E.; Nyamdavaa, K. Examining Age-Adjusted Associations between BMI and Comorbidities in Mongolia: Cross-Sectional Prevalence. Healthcare 2024, 12, 1222. https://doi.org/10.3390/healthcare12121222
Enkhtugs K, Byambasukh O, Boldbaatar D, Tsedev-Ochir T-O, Enebish O, Sereejav E, Dangaa B, Bayartsogt B, Yadamsuren E, Nyamdavaa K. Examining Age-Adjusted Associations between BMI and Comorbidities in Mongolia: Cross-Sectional Prevalence. Healthcare. 2024; 12(12):1222. https://doi.org/10.3390/healthcare12121222
Chicago/Turabian StyleEnkhtugs, Khangai, Oyuntugs Byambasukh, Damdindorj Boldbaatar, Tumur-Ochir Tsedev-Ochir, Oyunsuren Enebish, Enkhbold Sereejav, Bayarbold Dangaa, Batzorig Bayartsogt, Enkhtur Yadamsuren, and Khurelbaatar Nyamdavaa. 2024. "Examining Age-Adjusted Associations between BMI and Comorbidities in Mongolia: Cross-Sectional Prevalence" Healthcare 12, no. 12: 1222. https://doi.org/10.3390/healthcare12121222
APA StyleEnkhtugs, K., Byambasukh, O., Boldbaatar, D., Tsedev-Ochir, T.-O., Enebish, O., Sereejav, E., Dangaa, B., Bayartsogt, B., Yadamsuren, E., & Nyamdavaa, K. (2024). Examining Age-Adjusted Associations between BMI and Comorbidities in Mongolia: Cross-Sectional Prevalence. Healthcare, 12(12), 1222. https://doi.org/10.3390/healthcare12121222