_MD__MPH_PhD.png)
Physician Workforce in Lithuania: Changes during Thirty Years of Independence


Abstract
1. Introduction
2. Materials and Methods
- World Health Organization (WHO) database for obtaining data on the number of physicians per 10,000 inhabitants of Lithuania [8].
- Institute of Hygiene information sources (published reports for 1991–1998; internal electronic database for 1999–2021) for obtaining information about the number of medical and residency students who graduated medical studies in Lithuanian universities (Lithuanian University of Health Sciences, and Vilnius University), the total number of all physicians and physicians by specialty and county, number of visits to physicians, and number of visits to physicians per one inhabitant [3,11].
- State Data Agency of Lithuania database for obtaining data on the number of population [17].
3. Results

| Year | Number of Visits to Physicians (Million) | The Number of Visits to Physicians Is per One Inhabitant |
|---|---|---|
| 1991 | 35.37 | 9.5 |
| 1994 | 28.90 | 7.8 |
| 1997 | 26.74 | 7.2 |
| 2000 | 22.46 | 6.4 |
| 2003 | 19.58 | 5.7 |
| 2006 | 20.94 | 6.4 |
| 2009 | 21.81 | 6.9 |
| 2012 | 22.52 | 7.5 |
| 2015 | 24.22 | 8.3 |
| 2018 | 25.44 | 9.1 |
| 1991–2018 (AAC [95% CI]) | −0.84 [−1.52; −0.17] * | 0.31 [−0.42; 1.03] |
| 2021 | 24.79 (7.74 †) | 8.8 (2.8 †) |
| 2022 | 26.40 (5.59 †) | 9.3 (2.0 †) |
4. Discussion
5. Conclusions
Author Contributions
Funding
Institutional Review Board Statement
Informed Consent Statement
Data Availability Statement
Conflicts of Interest
Appendix A
| Vilnius | Kaunas | Klaipėda | Šiauliai | Panevėžys | Alytus | Marijampolė | Tauragė | Telšiai | Utena | |
|---|---|---|---|---|---|---|---|---|---|---|
| 1995 | 43.7 (3921) | 44.6 (3372) | 34.5 (1435) | 23.6 (947) | 25.4 (821) | 26.4 (534) | 21.1 (419) | 19.1 (248) | 17.8 (326) | 21.8 (442) |
| 1996 | 44.5 (3980) | 44.2 (3338) | 33.8 (1405) | 23.0 (926) | 24.5 (792) | 26.7 (541) | 20.7 (410) | 18.1 (235) | 17.6 (321) | 20.3 (410) |
| 1997 | 44.5 (3980) | 43.4 (3272) | 33.3 (1384) | 23.3 (936) | 24.4 (786) | 24.9 (504) | 20.7 (411) | 17.8 (231) | 18.1 (330) | 21.6 (435) |
| 1998 | 43.9 (3927) | 42.1 (3173) | 33.3 (1384) | 23.0 (924) | 24.7 (793) | 24.5 (496) | 20.7 (411) | 17.6 (229) | 17.4 (317) | 21.3 (427) |
| 1999 | 43.2 (3865) | 43.0 (3237) | 33.3 (1384) | 22.9 (918) | 24.5 (787) | 24.7 (499) | 21.9 (435) | 17.3 (224) | 18.0 (329) | 21.1 (422) |
| 2000 | 43.7 (3716) | 44.6 (3131) | 33.9 (1310) | 23.8 (882) | 25.3 (761) | 25.9 (486) | 22.8 (430) | 17.4 (233) | 19.0 (342) | 22.6 (421) |
| 2001 | 44.3 (3756) | 44.4 (3107) | 33.4 (1284) | 24.1 (891) | 25.6 (766) | 25.9 (486) | 21.8 (411) | 17.8 (238) | 19.1 (343) | 22.6 (417) |
| 2002 | 44.2 (3744) | 43.5 (3025) | 33.0 (1265) | 23.9 (876) | 26.1 (775) | 25.7 (478) | 23.5 (441) | 17.5 (233) | 18.3 (328) | 22.7 (415) |
| 2003 | 43.4 (3680) | 43.3 (2993) | 32.5 (1245) | 23.7 (864) | 26.3 (776) | 25.8 (476) | 22.1 (413) | 17.5 (232) | 18.1 (323) | 22.8 (413) |
| 2004 | 43.1 (3660) | 43.5 (2985) | 31.8 (1214) | 23.0 (831) | 26.6 (779) | 24.2 (443) | 20.9 (388) | 18.1 (238) | 17.9 (317) | 22.8 (408) |
| 2005 | 43.7 (3709) | 44.1 (3004) | 31.9 (1214) | 23.1 (824) | 26.8 (776) | 23.8 (431) | 20.6 (379) | 19.2 (249) | 18.3 (321) | 22.7 (401) |
| 2006 | 44.7 (3793) | 45.4 (3072) | 32.5 (1234) | 23.3 (825) | 26.2 (752) | 24.8 (444) | 21.5 (393) | 17.3 (222) | 18.1 (316) | 23.2 (406) |
| 2007 | 45.7 (3877) | 45.8 (3082) | 31.9 (1209) | 23.4 (820) | 27.6 (785) | 25.1 (445) | 21.7 (394) | 17.5 (223) | 18.3 (318) | 23.7 (409) |
| 2008 | 48.4 (4110) | 51.4 (3443) | 33.1 (1251) | 23.2 (803) | 28.1 (790) | 24.3 (425) | 20.7 (373) | 16.3 (206) | 17.6 (304) | 23.0 (392) |
| 2009 | 49.1 (4177) | 52.6 (3507) | 33.0 (1242) | 22.9 (783) | 27.1 (753) | 23.6 (409) | 20.7 (369) | 16.4 (205) | 17.9 (306) | 23.1 (388) |
| 2010 | 50.2 (4207) | 56.7 (3670) | 33.6 (1233) | 24.2 (795) | 26.9 (728) | 25.1 (420) | 21.2 (368) | 16 (193) | 18.3 (305) | 23.7 (387) |
| 2011 | 43.5 (3629) | 44.2 (2819) | 33.8 (1224) | 24.8 (799) | 27.5 (730) | 25.5 (419) | 21.5 (368) | 15.7 (186) | 18.1 (296) | 24.1 (386) |
| 2012 | 46.4 (3740) | 47.6 (2823) | 36.8 (1221) | 27.1 (787) | 30.9 (748) | 28.2 (429) | 23.8 (373) | 19.0 (202) | 19.2 (284) | 26.1 (380) |
| 2013 | 46.2 (3723) | 47.4 (2786) | 39.1 (1287) | 28.2 (807) | 30.8 (735) | 28.8 (432) | 26.9 (414) | 19.2 (201) | 20.7 (301) | 24.8 (353) |
| 2014 | 46.9 (3785) | 47.7 (2784) | 38.4 (1258) | 28.7 (808) | 30.7 (722) | 28.6 (423) | 23.7 (359) | 19.9 (205) | 21.4 (307) | 25.1 (352) |
| 2015 | 47.0 (3781) | 48.7 (2811) | 39.3 (1276) | 28.7 (793) | 30.4 (702) | 28.8 (418) | 23.8 (354) | 19.4 (196) | 21.0 (297) | 25.9 (355) |
| 2016 | 48.5 (3905) | 50.9 (2898) | 39.2 (1257) | 28.5 (770) | 31.3 (704) | 29.8 (422) | 24.1 (350) | 19.4 (191) | 20.9 (288) | 25.5 (340) |
| 2017 | 49.0 (3948) | 52.5 (2956) | 40.2 (1275) | 28.5 (756) | 32.5 (711) | 28.0 (387) | 23.9 (338) | 19.5 (187) | 21.2 (284) | 25.2 (327) |
| 2018 | 49.3 (3996) | 52.4 (2943) | 39.9 (1266) | 28.1 (738) | 31.8 (682) | 28.6 (388) | 23.9 (332) | 19.3 (181) | 20.9 (276) | 25.0 (318) |
| 2019 | 47.7 (3917) | 53.0 (2982) | 38.5 (1231) | 28.0 (731) | 31.7 (669) | 28.0 (376) | 24.3 (332) | 20.6 (189) | 20.4 (266) | 25.4 (317) |
| 2020 | 45.9 (3808) | 51.6 (2919) | 37.5 (1206) | 26.4 (686) | 31.6 (657) | 27.9 (369) | 23.8 (321) | 20.1 (181) | 19.5 (252) | 24.5 (303) |
| 2021 | 45.8 (3743) | 54.0 (3074) | 36.2 (1173) | 25.3 (661) | 30.4 (646) | 24.8 (337) | 21.9 (299) | 20 (182) | 19.1 (252) | 23.2 (291) |
| 2022 | 45.2 (3846) | 50.6 (2937) | 39.0 (1309) | 24.1 (631) | 30.2 (640) | 26.2 (355) | 21.7 (295) | 18.4 (167) | 19.0 (250) | 22.3 (280) |
| 1995–2022 (AAC; 95% CI) | 0.35 [0.17; 0.53] * (−0.01 [−0.19; 0.18]) * | 0.83 [0.57; 1.09] * (−0.45 [−0.75; −0.14]) * | 0.74 [0.47; 1.00] * (−0.39 [−0.59; −0.19]) * | 0.75 [0.45; 1.04] * (−1.19 [−1.35; −1.03]) * | 1.08 [0.92; 1.25] * (−0.77 [−0.90; −0.64]) * | 0.41 [0.13; 0.70] * (−1.38 [−1.56; −1.21]) * | 0.46 [0.18; 0.74] * (−1.19 [−1.43; −0.96]) * | 0.42 [0.11; 0.74] * (−1.25 [−1.47; −1.03]) * | 0.55 [0.32; 0.78] * (−0.98 [−1.17; −0.79]) * | 0.61 [0.39; 0.82] * (−1.48 [−1.70; −1.27]) * |
| Specialty (Long List) | Change from 2001 (or Since the Data is Available) to 2018 (or until Data Were Provided) | 2019 | 2020 | 2021 | 2022 | ||
|---|---|---|---|---|---|---|---|
| 2001 | 2018 | AAC [95% CI] | |||||
| Obstetrician-gynecologist | 933,061 | 580,050 | −3.01 [−3.34; −2.68] * | 549,128 | 439,450 | 484,371 | 468,639 |
| District pediatrician | 2,873,752 | 1,436,133 | −3.48 [−4.09; −2.87] * | 1,301,601 | 1,013,341 | 1,106,853 | 1,290,121 |
| District therapist | 3,845,129 | 1,044,286 | −6.83 [−7.60; −6.07] * | 973,362 | 822,948 | 830,209 | 877,188 |
| Surgeon | 950,423 | 384,026 | −5.28 [−5.67; −4.90] * | 342,918 | 230,409 | 240,058 | 241,873 |
| Medical doctor | 23,619 in 2006 | 17,627 | 0,49 [−4.97; 5.85] | 23,166 | 20,204 | 25,764 | 46,397 |
| Addiction psychiatrist | 49,701 | 46,581 | −4.67 [−6.89; −2.50] * | 92,742 | 37,043 | 37,377 | 48,339 |
| Psychiatrist | 498,296 | 738,864 | 2.24 [1.88; 2.60] * | 767,727 | 765,906 | 855,132 | 935,879 |
| General practitioners | 3,046,386 | 12,370,176 | 6.24 [4.47; 8.01] * | 12,481,890 | 12,485,477 | 14,006,471 | 14,660,402 |
| Child and adolescent psychiatrist | 19,568 | 32,145 | −0.63 [−2.25; 0.99] | 34,632 | 29,734 | 31,641 | 35,166 |
| Total of levels 1 | 12,216,316 | 16,649,888 | 1.50 [1.15; 1.85] * | 16,567,166 | 15,844,512 | 17,617,876 | 18,604,004 |
| Obstetrician-gynecologist | 185,644 | 444,991 | 4.83 [4.14; 5.51] * | 463,208 | 372,131 | 450,875 | 474,108 |
| Allergist | 48,755 | 55,852 | 0.83 [−1.30; 2.97] | 56,683 | 38,742 | 46,227 | 50,170 |
| Anesthesiologist-reanimatologist | 2741 | 46,487 | 17.11 [15.57; 18.65] * | 37,373 | 29,726 | 26,838 | 26,127 |
| Surgeon | 171,384 | 339,511 | 3.87 [3.21; 4.54] * | 353,398 | 255,207 | 285,013 | 310,967 |
| Occupational medicine doctor | 5351 | 15,657 | 5.06 [0.64; 9.48] * | 17,808 | 17,024 | 29,648 | 33,247 |
| Dermatovenerologists | 585,388 | 388,521 | −1.57 [−1.92; −1.21] * | 357,607 | 260,481 | 310,452 | 322,523 |
| Dietitian | 7194 in 2016 | 8175 | 6.39 [−53.67; 66.45] | 8898 | 7605 | 12,375 | 14,336 |
| Endocrinologist | 304,394 | 414,726 | 2.36 [1.91; 2.82] * | 421,179 | 312,297 | 382,416 | 398,235 |
| Physical medicine and rehabilitation doctor | 1,046,227 in 2017 | 1070,486 | - | 1,134,864 | 756,160 | 403,893 | 462,723 |
| Phthisiatrician | 202,052 | 659 | −31.71 [−34.62; −28.81] * | 365 | 238 | 83 | 36 |
| Gastroenterologist | 75,317 | 127,874 | 3.93 [3.33; 4.52] * | 129,505 | 96,520 | 132,217 | 155,127 |
| Geneticist | 2852 | 17,728 | 10.97 [9.71; 12.24] * | 19,976 | 18,664 | 21,513 | 22,688 |
| Geriatrician | 1173 in 2003 | 1727 | −3.58 [−16.53; 9.37] | 1668 | 1039 | 1202 | 2102 |
| Hematologist | 34,455 | 55,722 | 3.32 [2.68; 3.97] * | 60,524 | 50,015 | 53,439 | 59,122 |
| Infectious disease doctor | 57,760 | 75,489 | 2.20 [1.59; 2.81] * | 73,131 | 53,359 | 48,118 | 52,234 |
| Cardiologist | 289,145 | 521,260 | 3.94 [3.40; 4.48] * | 514,693 | 387,655 | 466,281 | 485,065 |
| Other | 554 in 2018 | 554 | - | 16,866 | 11,686 | 15,254 | 18,852 |
| Coloproctologist | 8039 | 9594 | 2.52 [0.67; 4.36] * | 8234 | 5507 | 6369 | 6673 |
| Vascular surgeon | 13,708 | 66,102 | 8.48 [7.57; 9.39] * | 69,981 | 47,563 | 61,423 | 69,065 |
| Chest surgeon | 6175 | 3839 | −0.40 [−2.12; 1.33] | 4772 | 3918 | 4629 | 4993 |
| Mammologist | 48,483 in 2006 | 109,784 | 7.66 [6.61; 8.71] * | 120,785 | 78,720 | 123,660 | 125,238 |
| Medical psychologist | 3768 | 65,732 in 2017 | 17.99 [14.78; 21.21] * | n.d. | n.d. | n.d. | n.d. |
| Nephrologist | 31,701 | 68,890 | 5.32 [4.73; 5.91] * | 70,695 | 55,128 | 64,465 | 69,722 |
| Neonatologist | 1432 | 3702 | 5.06 [3.99; 6.13] * | 3728 | 3325 | 3611 | 3566 |
| Neurosurgeon | 30,068 | 59,257 | 4.10 [3.51; 4.68] * | 60,064 | 43,515 | 49,223 | 53,145 |
| Neurologist | 831,852 | 619,683 | −1.09 [−1.71; −0.46] * | 612,075 | 438,572 | 539,081 | 569,488 |
| Ophthalmologist | 1,048,332 | 728,899 | −1.55 [−2.31; −0.80] * | 719,187 | 494,215 | 571,332 | 614,102 |
| Oncologist | 155,615 | 429 | −34.28 [−43.11; −25.45] * | 132 | 61 | 59 | 41 |
| Radiation oncologist | 12,346 | 32,422 | 2.00 [−2.03; 6.03] | 31,419 | 26,034 | 24,917 | 26,999 |
| Oncologist pharmacist | 45,114 | 159,408 | 9.46 [6.90; 12.03] * | 161,370 | 145,362 | 147,132 | 145,715 |
| Otorhinolaryngologist | 912,442 | 556,761 | −2.26 [−2.68; −1.84] * | 556,470 | 357,795 | 397,648 | 483,366 |
| Plastic and reconstructive surgeon | 4483 | 22,867 | 8.82 [7.23; 10.42] * | 22,657 | 15,160 | 16,642 | 16,822 |
| Psychiatrist | 45,936 | 52,858 | 2.11 [0.67; 3.56] * | 56,748 | 49,956 | 52,027 | 50,136 |
| Psychotherapist | 3502 | 23,381 | 5.47 [−0.34; 11.28] | 38,206 | 29,038 | 36,727 | 40,757 |
| Pulmonologist | 85,350 | 155,564 | 4.01 [2.27; 5.93] * | 156,397 | 108,213 | 124,080 | 137,853 |
| Rheumatologist | 79,751 | 130,486 | 3.33 [2.82; 3.84]* | 123,803 | 100,787 | 123,387 | 132,583 |
| Emergency medical assistance | 180,708 in 2006 | 411,271 | 4.72 [0.41; 9.04]* | 452,852 | 409,491 | 471,944 | 553,013 |
| Emergency medical doctor | 6379 in 2018 | 6379 | - | 24,493 | 32,824 | 52,052 | 68,339 |
| Sports medical doctor | 477 in 2016 | 1705 | 63.69 [−159.79; 287.17] | 1479 | 714 | 902 | 1517 |
| Monitoring service | 13,622 in 2007 | 164,970 | 20.56 [16.65; 24.47] * | 171,592 | 137,361 | 141,332 | 149,273 |
| Heart surgeon | 3518 | 1344 | −2.71 [−4.98; −0.43] * | 1372 | 1128 | 847 | 1046 |
| Toxicologist | 1987 | 4673 | 6.63 [4.87; 8.39] * | 4788 | 4737 | 4130 | 4484 |
| Orthopedic traumatologist | 547,792 | 638,393 | 1.29 [0.08; 2.49] * | 639,668 | 446,161 | 524,421 | 583,455 |
| Pediatric allergist | 16,534 in 2004 | 23,189 | 1.63 [−0.91; 4.18] | 24,596 | 19,280 | 25,037 | 33,951 |
| Pediatric anesthesiologist | 80 in 2004 | 104 | −3.81 [−16.44; 8.82] | 122 | 167 | 146 | 750 |
| Pediatric surgeon | 30,776 | 67,113 | 3.52 [1.95; 5.08] * | 66,745 | 42,044 | 48,284 | 55,985 |
| Pediatric endocrinologist | 14,350 in 2004 | 34,378 | 5.14 [3.32; 6.96] * | 35,149 | 26,731 | 33,169 | 33,710 |
| Pediatric phthisiatrician | 8794 in 2004 | 1146 | −12.77 [−18.25; −7.30] * | 1109 | 606 | 686 | 631 |
| Pediatric gastroenterologist | 7188 in 2004 | 23,245 | 6.40 [4.35; 8.46] * | 22,722 | 15,829 | 20,669 | 24,657 |
| Pediatric hematologist | 3565 in 2004 | 13,321 | 7.79 [5.57; 10.02] * | 12,005 | 8452 | 10,651 | 12,665 |
| Pediatric infectious diseases specialist | n.d. | n.d. | - | n.d. | 4796 | 7158 | 6987 |
| Child and adolescent psychiatrist | 7253 | 7748 | 3.62 [1.54; 5.7] * | 7640 | 7588 | 10,721 | 12,796 |
| Pediatric cardiologist | n.d. | 71,349 | 0.58 [−0.95; 2.11] | 65,597 | 43,653 | 54,926 | 60,327 |
| Pediatric cardio-rheumatologist | 76,219 | 24,136 in 2004 | −34.75 [−105.13; 35.62] | n.d. | n.d. | n.d. | n.d. |
| Pediatrician | 89,141 | 108,521 | 3.27 [2.10; 4.35] * | 107,895 | 63,462 | 74,212 | 88,808 |
| Pediatric nephrologist | 6020 in 2004 | 11,360 | 3.26 [1.37; 5.14] 0.003 | 11,108 | 8174 | 10,896 | 10,274 |
| Pediatric neurosurgeon | 1961 in 2004 | 2061 | −2.11 [−4.05; −0.17] * | 2033 | 1564 | 1711 | 2071 |
| Pediatric neurologist | 64,928 in 2004 | 76,082 | −1.30 [−3.10; 0.51] | 71,366 | 51,508 | 62,833 | 64,245 |
| Pediatric ophthalmologist | 80,695 in 2004 | 96,455 | 0.08 [−1.66; 1.81] | 90,707 | 63,020 | 74,794 | 78,114 |
| Pediatric oncologist pharmacist | n.d. | n.d. | - | n.d. | 5 | 28 | 8 |
| Pediatric orthopedic traumatologist | 82,377 in 2004 | 72,680 | −1.67 [−3.60; 0.26] | 72,430 | 58,783 | 69,705 | 78,162 |
| Pediatric pulmonologist | 24,302 in 2004 | 50,053 | 3.06 [0.62; 5.50] * | 45,168 | 27,851 | 28,934 | 34,706 |
| Pediatric rheumatologist | 2221 in 2004 | 3579 | 1.35 [−0.03; 2.73] | 4669 | 3549 | 4472 | 5087 |
| Pediatric urologist | 1781 in 2004 | 5287 | 7.77 [2.91; 12.63] * | 4269 | 3254 | 4496 | 4485 |
| Pediatric urologist | 165,481 | 268,271 | 2.46 [1.76; 3.17] * | 267,051 | 193,464 | 227,409 | 244,914 |
| Maxillofacial surgeon | 5891 in 2007 | 8403 | −1.24 [−6.43; 3.95] | 11,182 | 8587 | 11,807 | 13,954 |
| Internal medicine | 191,897 | 225,009 | 3.76 [2.44; 5.07] * | 203,582 | 169,225 | 160,628 | 132,765 |
| Total of levels 2/3 | 6,398,916 | 8,787,434 | 2.05 [1.68; 2.42] * | 8,907,858 | 6,525,426 | 7,171,256 | 7,799,105 |
| TOTAL | 18,615,232 | 25,437,322 | 1.68 [1.43; 1.92] * | 25,475,024 | 22,369,938 | 24,789,132 | 26,403,109 |
| Total, remote | 0 | 0 | 0 | 175,508 | 6,092,501 | 7,741,371 | 5,586,155 |
References
- Rechel, B.; Dubois, C.-A.; McKee, M. (Eds.) The Health Care Workforce in Europe: Learning from Experience; European Observatory on Health Systems and Policies; World Health Organization: Copenhagen, Denmark, 2006; pp. 47–58. ISBN 9289022973. [Google Scholar]
- Lovkytė, L.; Padaiga, Z. Physician workforce reform in Lithuania: An inevitable transition. Cah. Sociol. Demogr. Medicales 2001, 41, 347–368. [Google Scholar]
- Health of Lithuanian Population and Activities of Healthcare Institutions, 1991–1996; Institute of Hygiene Reports; Institute of Health Information Centre: Vilnius, Lithuania, 1993–1997.
- World Health Organization, Regional Office for Europe. European Health for All database (HFA-DB); WHO, Regional Office for Europe: Copenhagen, Denmark, 2002. [Google Scholar]
- Central Intelligence Agency (US). The World Factbook 2023; CIA: Washington, DC, USA, 2013. Available online: https://www.cia.gov/the-world-factbook/countries/lithuania/ (accessed on 11 October 2023).
- Reamy, J.; Lovkytė, L.; Padaiga, Z. Physician workforce planning and the transition to primary health care in former socialist countries. Cah. Sociol. Demogr. Med. 2005, 45, 307–325. [Google Scholar] [PubMed]
- Stankūnas, M.; Sauliūnė, S.; Smith, T.; Avery, M.; Šumskas, L.; Czabanowska, K. Evaluation of Leadership Competencies of Executives in Lithuanian Public Health Institutions. Medicina 2012, 48, 581–587. [Google Scholar] [CrossRef] [PubMed]
- World Health Organization. Global Health Workforce Statistics Database. Available online: https://www.who.int/data/gho/data/themes/topics/health-workforce (accessed on 11 November 2023).
- Jankauskienė, D. Evaluation of the Healthcare System Reform in Lithuania in 1990–1998. Doctoral Thesis, Kaunas University of Medicine, Vilnius, Lithuania, 2000. [Google Scholar]
- Stankūnas, M.; Lovkytė, L.; Padaiga, Z. Lietuvos gydytojų ir rezidentų ketinimų dirbti Europos Sąjungos šalyse tyrimas [The survey of Lithuanian physicians and medical residents regarding possible migration to the European Union]. Medicina 2004, 40, 68–74. [Google Scholar] [PubMed]
- Health of Lithuanian Population and Activities of the Healthcare Institutions, 1997–2022; Institute of Hygiene Reports. Institute of Hygiene Health Information Centre: Vilnius, Lithuania, 1998–2023. Available online: https://sena.hi.lt/spec_info/met_ata.php (accessed on 11 November 2023).
- Starkienė, L. Planning the number of physicians: From research to health policy decisions. Health Policy Manag. 2012, 1, 337–343. [Google Scholar]
- OECD/European Observatory on Health Systems and Policies. Lithuania: Country Health Profile 2023, State of Health in the EU; OECD Publishing: Paris, France, 2023. [Google Scholar] [CrossRef]
- Zurn, P.; Dal Poz, M.R.; Stilwell, B.; Adams, O. Imbalance in the health workforce. Hum. Resour. Health 2004, 2, 13. [Google Scholar] [CrossRef] [PubMed]
- Government Strategic Analysis Center. Update of Healthcare Professionals’ Forecasts. Available online: https://strata.gov.lt/images/tyrimai/2021-metai/20210719-sveikatos-specialistu-poreikis.pdf (accessed on 14 November 2023).
- Haakenstad, A.; Yearwood, J.A.; Fullman, N.; Bintz, C.; Bienhoff, K.; Weaver, M.R.; Nandakumar, V.; Joffe, J.N.; LeGrand, K.E.; Knight, M.; et al. Assessment performance of the Healthcare access and quality Index, overall and by select age groups, for 204 countries and territories, 1990–2019: A systematic analysis from the Global burden of disease study 2019. Lancet Glob. Health 2022, 10, e1715–e1743. [Google Scholar] [CrossRef]
- Statistics Lithuania State Data Agency. Available online: https://www.stat.gov.lt/ (accessed on 11 November 2023).
- Ministry of Health of Republic of Lithuania. Order on List of Personal Healthcare Specialties and Sub-Specialties; Countries in the List 1999; 15: Document No. 404; Ministry of Health of Republic of Lithuania: Vilniaus, Lithuania, 1999. (In Lithuanian) [Google Scholar]
- Ministry of Health of Republic of Lithuania. Order On Remote Patient Consultations and Doctor Consultations by a Member of the Doctor and Family Doctor Team; Ministry of Health of Republic of Lithuania: Vilniaus, Lithuania, 2020. [Google Scholar]
- Government of the Republic of Lithuania. Resolution on the Declaration of Quarantine in the Territory of the Republic of Lithuania; Document No. 207; Government of the Republic of Lithuania: Vilnius, Lithuania, 2020. [Google Scholar]
- Data of the Annual Reports of the Health Information Centre of the Institute of Hygiene and the Information System of the Compulsory Health Insurance SVEIDRA. Available online: http://hi.lt/php/spiv1.php?dat_file=spiv1.txt (accessed on 11 November 2023).
- Health Statistics Portal of the Institute of Hygiene. Available online: https://stat.hi.lt/default.aspx?report_id=266 (accessed on 11 November 2023).
- Gaižauskienė, A.; Grabauskas, V.J.; Kučinskienė, Z.A.; Lovkytė, L.; Vaitkienė, R.; Padaiga, Ž. Development and Planning of the Number of Lithuanian Doctors in 1990–2015; Open Lithuania Foundation: Vilnius, Lithuania, 2003. [Google Scholar]
- World Health Organization. Global Strategy on Human Resources for Health: Workforce 2030, 2016, Geneva. Available online: https://www.who.int/news/item/02-06-2022-global-strategy-on-human-resources-for-health--workforce-2030 (accessed on 11 November 2023).
- OECD/European Observatory on Health Systems and Policies. Lithuania: Country Health Profile 2021, State of Health in the EU; OECD Publishing: Paris, France, 2021. [Google Scholar] [CrossRef]
- Lovkytė, L.; Reamy, J.; Padaiga, Z. Physicians resources in Lithuania: Change Comes Slowly. Croat. Med. J. 2003, 44, 207–213. [Google Scholar] [PubMed]
| Medical Doctor’s Practice | |
|---|---|
| Specialties | Sub-Specialties |
| General practitioners (GPs) | |
| Internal medicine | Allergology and clinical immunology; occupational medicine; dermatovenerology; endocrinology; geriatrics; hematology; infectology; cardiology; nephrology; neurology; pulmonology; rheumatology; clinical toxicology; oncology chemotherapy; oncology radiotherapy; intensive care medicine. |
| Pediatrics | Neonatology; pediatric endocrinology; pediatric gastroenterology; pediatric hematology; pediatric cardiology; pediatric nephrology; pediatric neurology; pediatric pulmonology; pediatric intensive care medicine. |
| Dietetics | |
| Surgery | Abdominal surgery; plastic and reconstructive surgery; vascular surgery; heart surgery; neurosurgery; chest surgery; urology. |
| Orthopedics traumatology | |
| Pediatric surgery | |
| Anesthesiology reanimation | |
| Obstetrics gynecology | |
| Ophthalmology | |
| Otorhinolaryngology | |
| Psychiatry | Child and adolescent psychiatry. |
| Genetics | |
| Forensic medicine | |
| Physical medicine and rehabilitation | Sports medicine. |
| Pathology | |
| Laboratory medicine | |
| Radiology | |
| General dental practice | Oral surgery; orthodontic dentistry, endodontology, orthopedic dentistry; periodontology; pediatric dentistry; maxillofacial surgery. |
| The Number of Active Physicians According to Specialties | (Per 10,000 Persons and (Natural Persons)) | AAC [95% CI] ** | ||||||
|---|---|---|---|---|---|---|---|---|
| 1991 | 1996 | 2001 | 2006 | 2011 | 2016 | 2021 | ||
| General practitioners | n.d. | 0.50 (181) | 2.58 (897) | 5.30 (1794) | 6.19 (1860) | 7.37 (2099) | 7.35 (2043) | 11.95 [9.22; 14.67] * (10.77 [8.00; 13.54]) * |
| Internal medicine | 12.71 (4757) | 12.98 (4656) | 10.77 (3744) | 9.31 (3151) | 9.75 (2930) | 9.88 (2813) | 9.41 (2561) | −1.16 [−1.46; −0.86] * (−2.33 [−2.58; −2.07]) * |
| Pediatrics | 4.49 (1681) | 5.22 (1873) | 19.76 † (1636) | 18.26 † (1270) | 20.42 † (1136) | 19.75 † (1008) | 17.64 † (856) | 5.08 [3.35; 6.81] * (−2.59 [−2.84; −2.33]) * |
| Dietetics | 0.06 (21) | 0.06 (20) | 0.07 (25) | 0.06 (19) | 0.07 (21) | 0.08 (22) | 0.08 (23) | 1.33 [0.74; 1.91] * (0.11 [−0.48; 0.71]) |
| Surgery | 2.45 (915) | 2.58 (927) | 2.38 (826) | 2.55 (864) | 2.76 (828) | 3.03 (862) | 3.25 (870) | 1.05 [0.84; 1.26] * (−0.07 [−0.22; 0.08]) |
| Orthopedics traumatology | 0.82 (307) | 0.88 (317) | 0.88 (305) | 0.97 (330) | 1.12 (336) | 1.44 (409) | 1.35 (377) | 2.44 [2.14; 2.73] * (1.24 [0.98; 1.49]) * |
| Pediatric surgery | n.d. | 0.18 (63) | 0.80 † (66) | 0.91 † (63) | 1.31 † (73) | 1.23 † (63) | 1.36 † (66) | 6.69 [4.40; 8.99] * (0.72 [−0.04; 1.48]) |
| Anesthesiology | 1.48 (552) | 1.61 (576) | 1.62 (562) | 1.77 (600) | 2.29 (687) | 2.71 (771) | 2.97 (823) | 2.54 [2.27; 2.81] * (1.36 [1.13; 1.58]) * |
| Obstetrics gynecology | 2.34 (877) | 2.36 (846) | 2.33 (810) | 2.37 (801) | 2.33 (699) | 2.27 (647) | 2.13 (587) | −0.25 [−0.35; −0.16] * (−1.38 [−1.50; −1.27]) * |
| Ophthalmology | 1.00 (376) | 1.01 (362) | 1.02 (355) | 1.00 (340) | 1.16 (348) | 1.28 (364) | 1.16 (319) | 0.90 [0.71; 1.09] * (−0.26 [−0.39; −0.12]) * |
| Otorhinolaryngology | 0.86 (323) | 0.88 (315) | 0.86 (300) | 0.86 (291) | 0.92 (275) | 0.96 (274) | 0.87 (239) | 0.33 [0.16; 0.50] * (−0.83 [−0.95; −0.70]) * |
| Psychiatry | 1.21 (454) | 1.41 (505) | 1.59 (553) | 1.75 (594) | 1.84 (553) | 1.95 (555) | 2.03 (562) | 1.72 [1.52; 1.92] * (0.53 [0.27; 0.78]) * |
| Genetics | n.d. | 0.02 (8) | 0.02 (8) | 0.03 (10) | 0.04 (13) | 0.06 (17) | 0.07 (19) | 7.70 [5.59; 9.81] * (6.02 [4.37; 7.68]) * |
| Forensic medicine | 0.16 (60) | 0.18 (65) | 0.22 (78) | 0.17 (57) | 0.17 (50) | 0.18 (51) | 0.19 (54) | 0.28 [−0.18; 0.74] (−0.89 [−1.37; −0.41]) * |
| Physical medicine and rehabilitation | 0.56 (211) | 0.76 (272) | 1.13 (394) | 1.19 (403) | 1.32 (396) | 1.46 (415) | 1.37 (375) | 3.17 [2.53; 3.80] * (2.03 [1.35; 2.70]) * |
| Pathology | 0.18 (68) | 0.19 (69) | 0.21 (74) | 0.19 (66) | 0.21 (64) | 0.26 (73) | 0.25 (70) | 0.68 [0.31; 1.05] * (−0.51 [−0.84; −0.18]) * |
| Laboratory medicine | n.d. | 0.43 (153) | 0.34 (118) | 0.26 (88) | 0.31 (93) | 0.30 (86) | 0.32 (87) | −0.88 [−1.60; −0.17] * (−2.07 [−2.70; −1.45]) * |
| Radiology | 1.23 (459) | 1.37 (493) | 1.30 (451) | 1.42 (481) | 1.54 (464) | 1.72 (489) | 1.79 (492) | 1.35 [1.16; 1.54] * (0.18 [0.03; 0.33]) * |
| Medical doctor’s practice | n.d. | n.d. | 0.48 (167) | 0.47 (160) | 0.47 (141) | 1.05 (300) | 1.45 (406) | 7.96 [6.11; 9.81] * (6.68 [4.80; 8.55]) * |
| Residency | n.d. | n.d. | 3.36 (1168) | 3.23 (1092) | 5.50 (1653) | 5.94 (1692) | 6.34 (1773) | 3.44 [2.73; 4.14] * (2.16 [1.55; 2.77]) * |
| Epidemiology and hygiene | 0.95 (355) | 0.99 (356) | 0.77 (267) | 0.89 (301) | 0.74 (222) | 0.66 (189) | 0.39 (109) | −2.84 [−3.58; −2.11] * (−3.98 [−4.73; −3.23]) * |
| Healthcare administrators and statisticians | n.d. | n.d. | 0.53 (185) | 0.90 (306) | 1.28 (383) | 1.26 (359) | 0.96 (268) | 4.76 [3.34; 6.18] * (3.48 [2.10; 4.85]) * |
| Other | 3.76 (1407) | 3.34 (1198) | 3.00 (1042) | 1.27 (429) | 0.34 (102) | 0.43 (123) | n.d. | −12.28 [−13.91; −10.66] * (−13.46 [−15.13; −11.79]) * |
| Number of Physicians (Persons) | Number of Physicians (per 10,000 Inhabitants) | |||||
|---|---|---|---|---|---|---|
| Estonia | Latvia | Lithuania | Estonia | Latvia | Lithuania | |
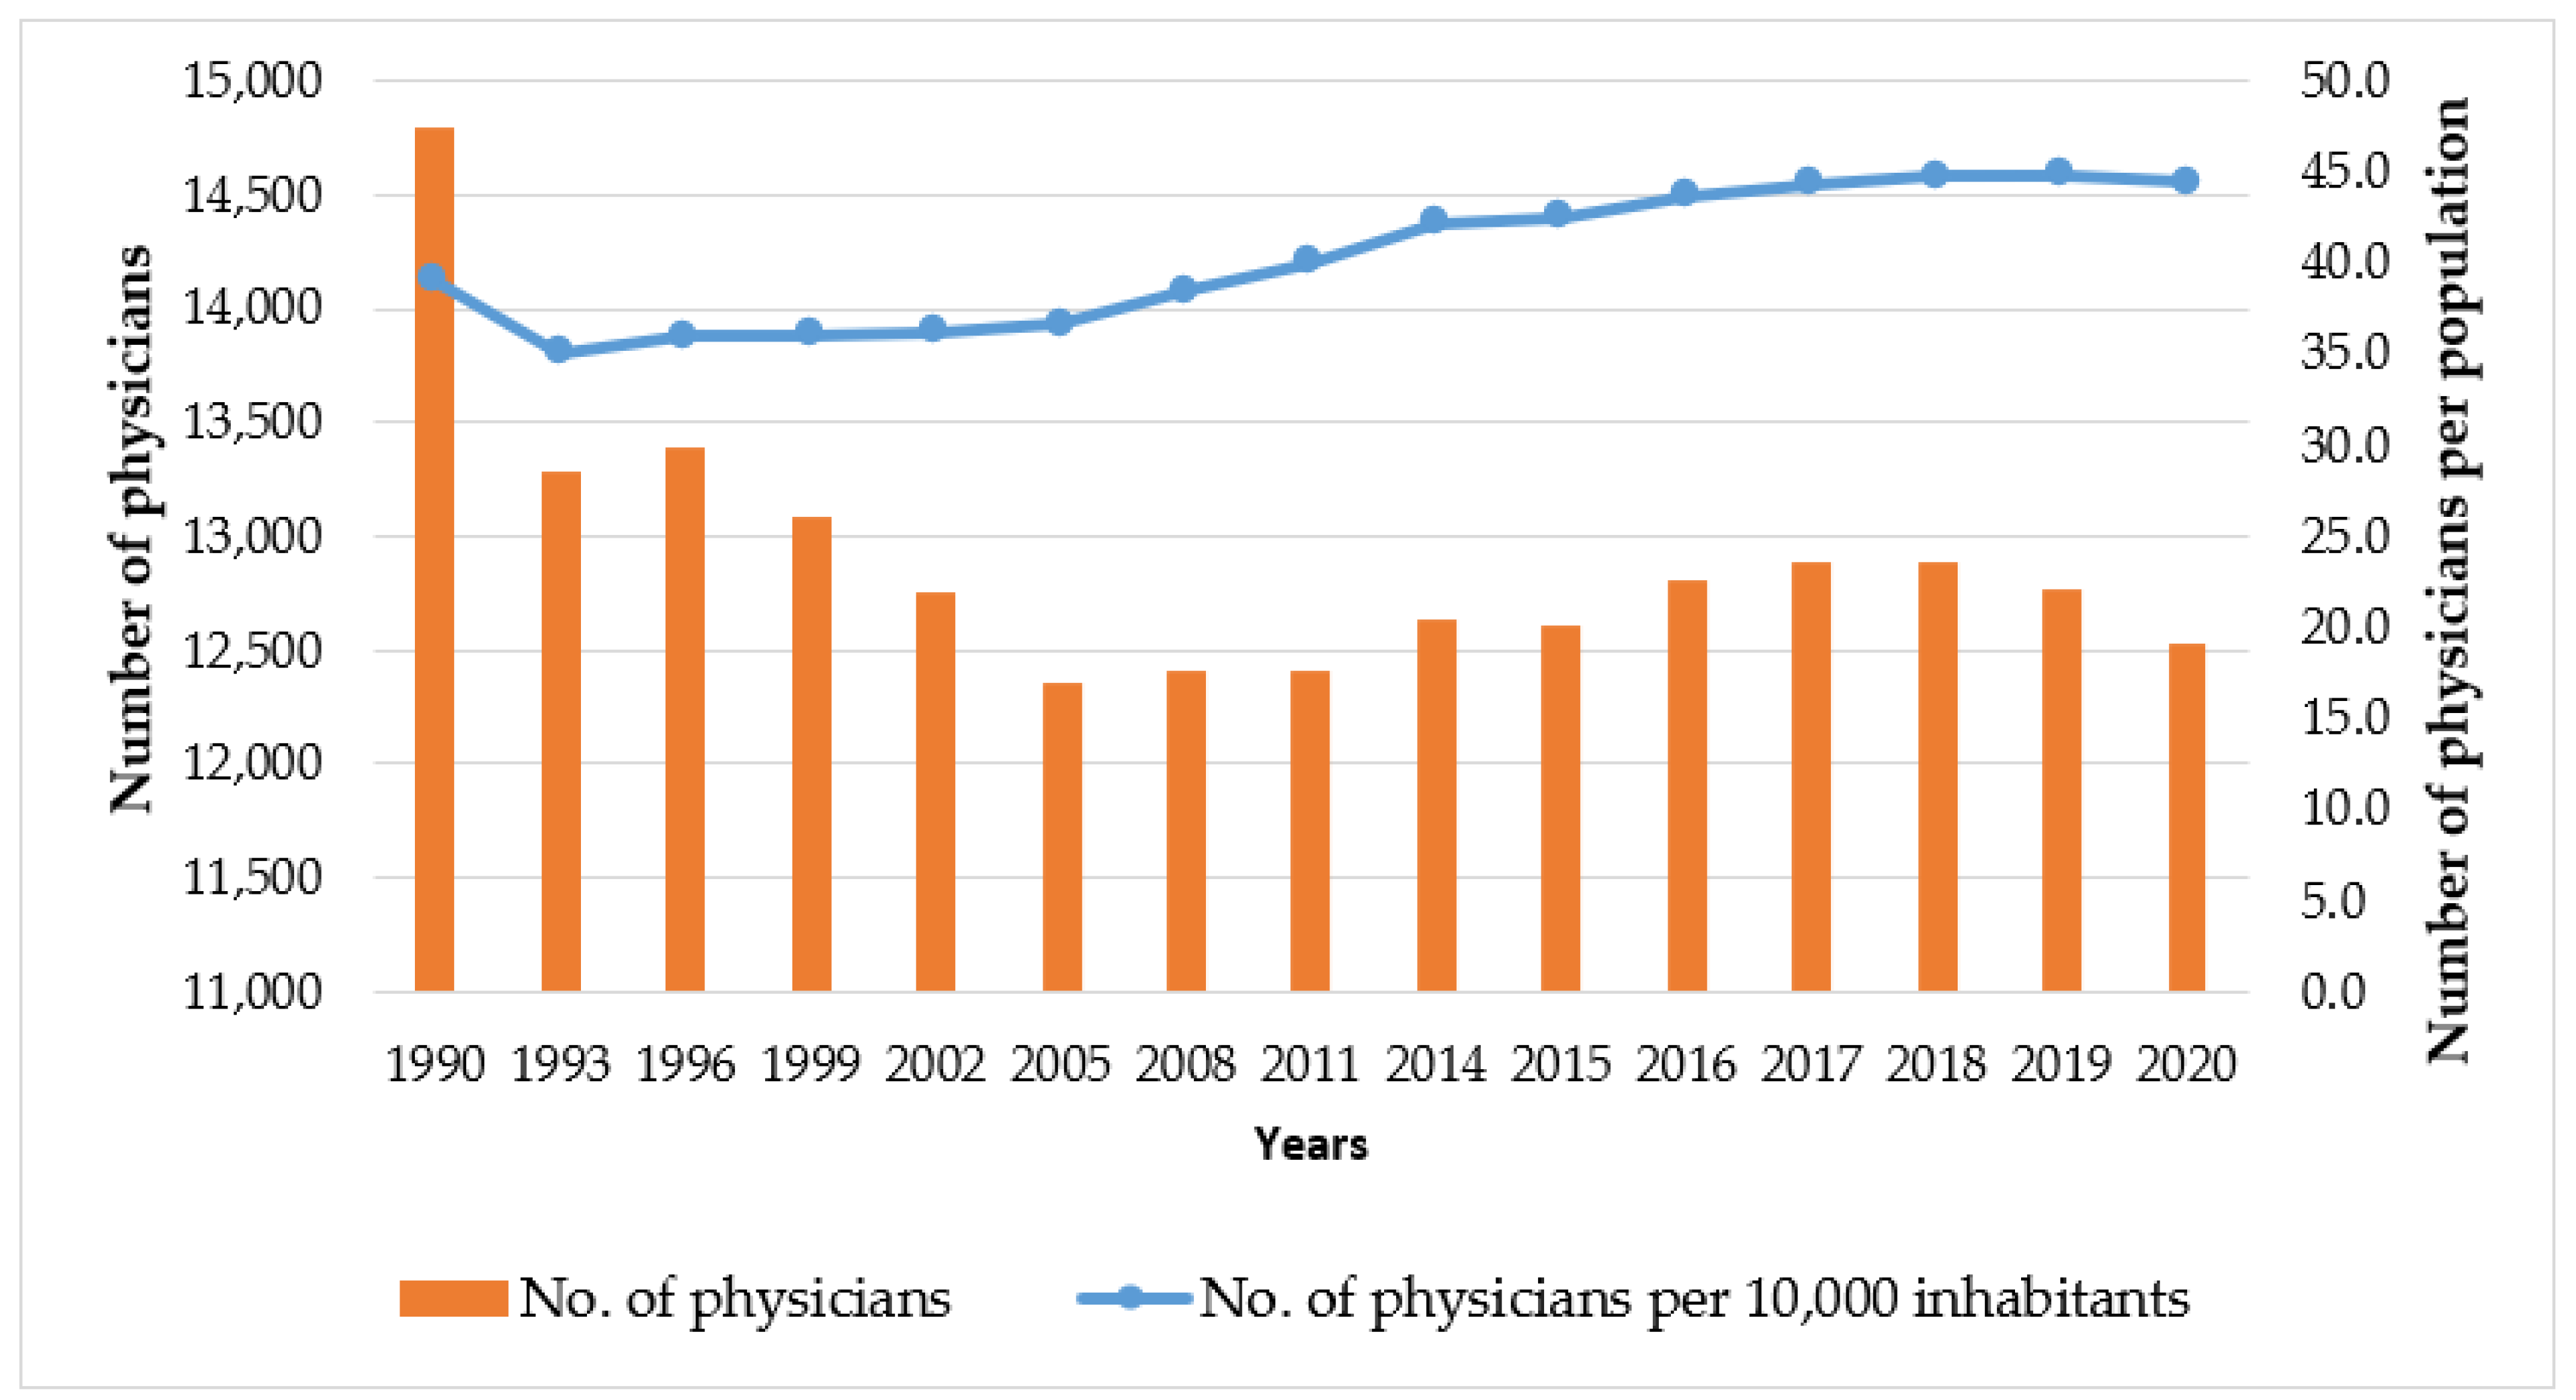
| 1990 | 5498 | 9439 | 14,795 | 35.0 | 35.1 | 39.1 |
| 1993 | 4792 | 7446 | 13,285 | 31.85 | 28.22 | 35.07 |
| 1996 | 4457 | 6966 | 13,389 | 31.07 | 27.49 | 35.97 |
| 1999 | 4200 | 6495 | 13,092 | 29.93 | 26.77 | 36.03 |
| 2002 | 4089 | 6443 | 12,749 | 29.65 | 27.7 | 36.26 |
| 2005 | 4257 | 6628 | 12,361 | 31.42 | 29.68 | 36.64 |
| 2008 | 4469 | 7040 | 12,413 | 33.43 | 32.74 | 38.5 |
| 2011 | 4372 | 6456 | 12,407 | 32.94 | 31.08 | 40.03 |
| 2014 | 4418 | 6412 | 12,631 | 33.61 | 31.89 | 42.18 |
| 2017 | 4569 | 6225 | 12,887 | 34.68 | 31.84 | 44.37 |
| 2020 | 5136 | 6346 | 12,529 | 38.63 | 33.45 | 44.42 |
Disclaimer/Publisher’s Note: The statements, opinions and data contained in all publications are solely those of the individual author(s) and contributor(s) and not of MDPI and/or the editor(s). MDPI and/or the editor(s) disclaim responsibility for any injury to people or property resulting from any ideas, methods, instructions or products referred to in the content. |
© 2024 by the authors. Licensee MDPI, Basel, Switzerland. This article is an open access article distributed under the terms and conditions of the Creative Commons Attribution (CC BY) license (https://creativecommons.org/licenses/by/4.0/).
Share and Cite
Šablinskas, L.; Stankūnas, M. Physician Workforce in Lithuania: Changes during Thirty Years of Independence. Healthcare 2024, 12, 1023. https://doi.org/10.3390/healthcare12101023
Šablinskas L, Stankūnas M. Physician Workforce in Lithuania: Changes during Thirty Years of Independence. Healthcare. 2024; 12(10):1023. https://doi.org/10.3390/healthcare12101023
Chicago/Turabian StyleŠablinskas, Linas, and Mindaugas Stankūnas. 2024. "Physician Workforce in Lithuania: Changes during Thirty Years of Independence" Healthcare 12, no. 10: 1023. https://doi.org/10.3390/healthcare12101023
APA StyleŠablinskas, L., & Stankūnas, M. (2024). Physician Workforce in Lithuania: Changes during Thirty Years of Independence. Healthcare, 12(10), 1023. https://doi.org/10.3390/healthcare12101023