
Exploring the Effectiveness of Self-Management Interventions in Type 2 Diabetes: A Systematic Review and Network Meta-Analysis

 , , , , ,
Abstract
:1. Introduction
2. Methods
2.1. Design
2.2. Search Strategy
2.3. Study Selection and Data Extraction
2.4. Risk of Bias Assessment
2.5. Statistical Analysis
2.5.1. Single-Effect Analysis (SEA)
2.5.2. Network Meta-Analysis (NMA)
2.5.3. Component Network Meta-Analysis
2.5.4. Visual Inspection of NMA Results Using a Series of Visualization Tools
2.6. Certainty of Evidence Assessment
3. Results
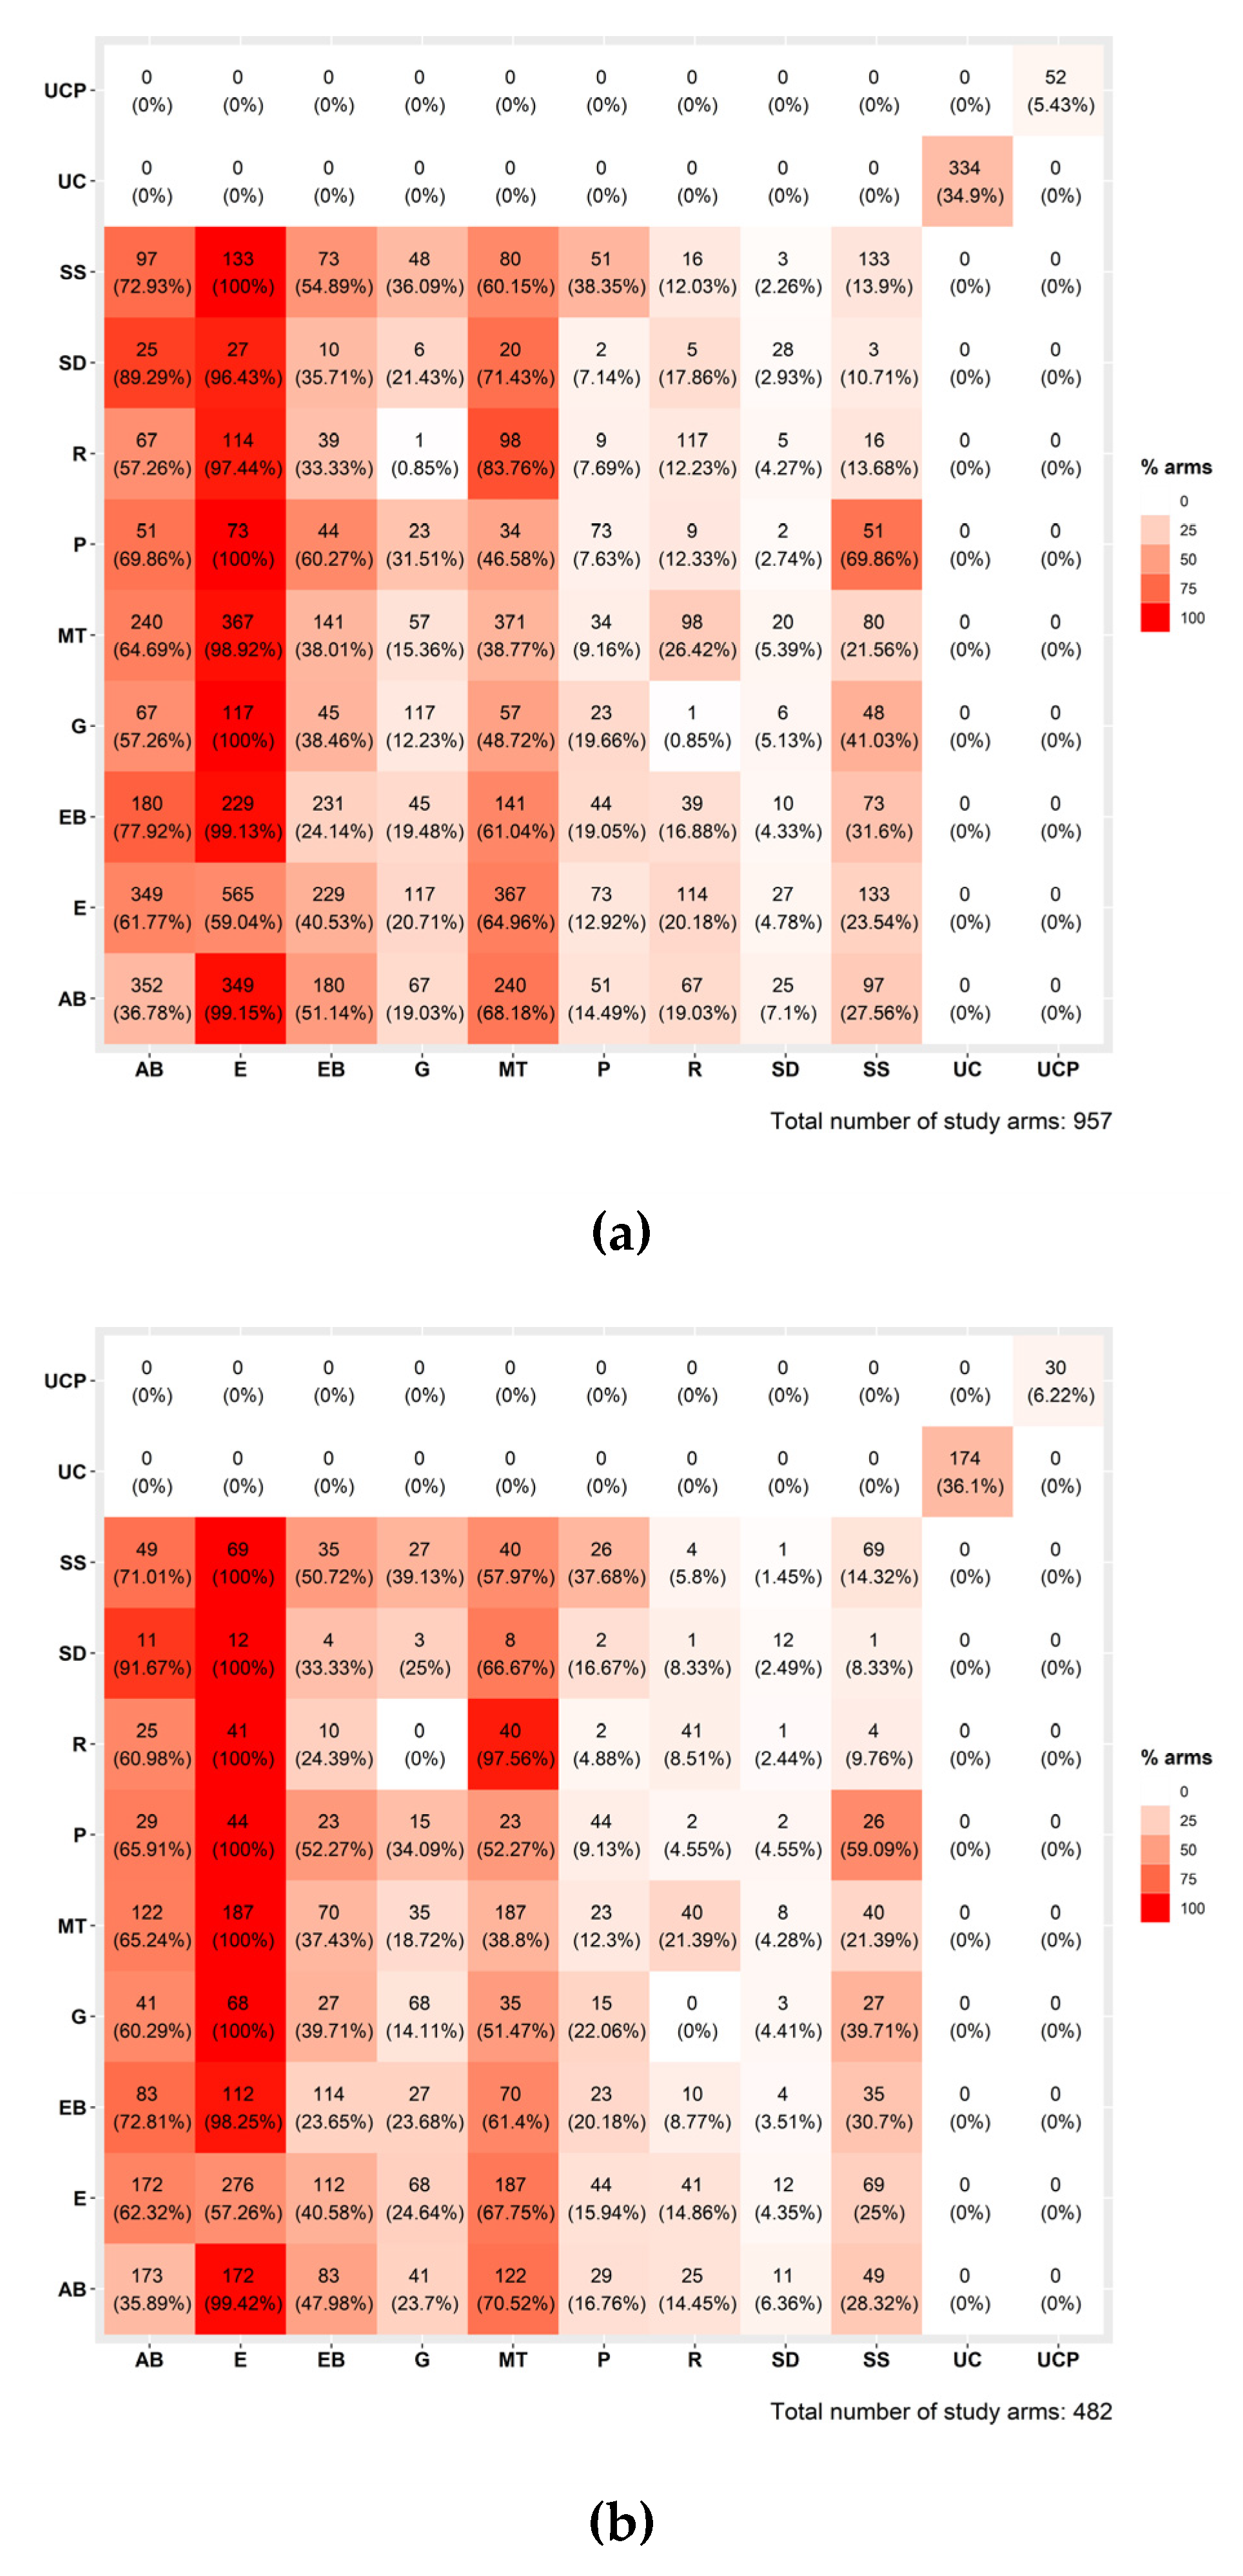
3.1. Interventions
3.2. Risk of Bias of Included Studies
3.3. Single Effect (Pairwise Meta-Analysis) Results
3.4. Network Meta-Analysis Results
3.5. CNMA Results
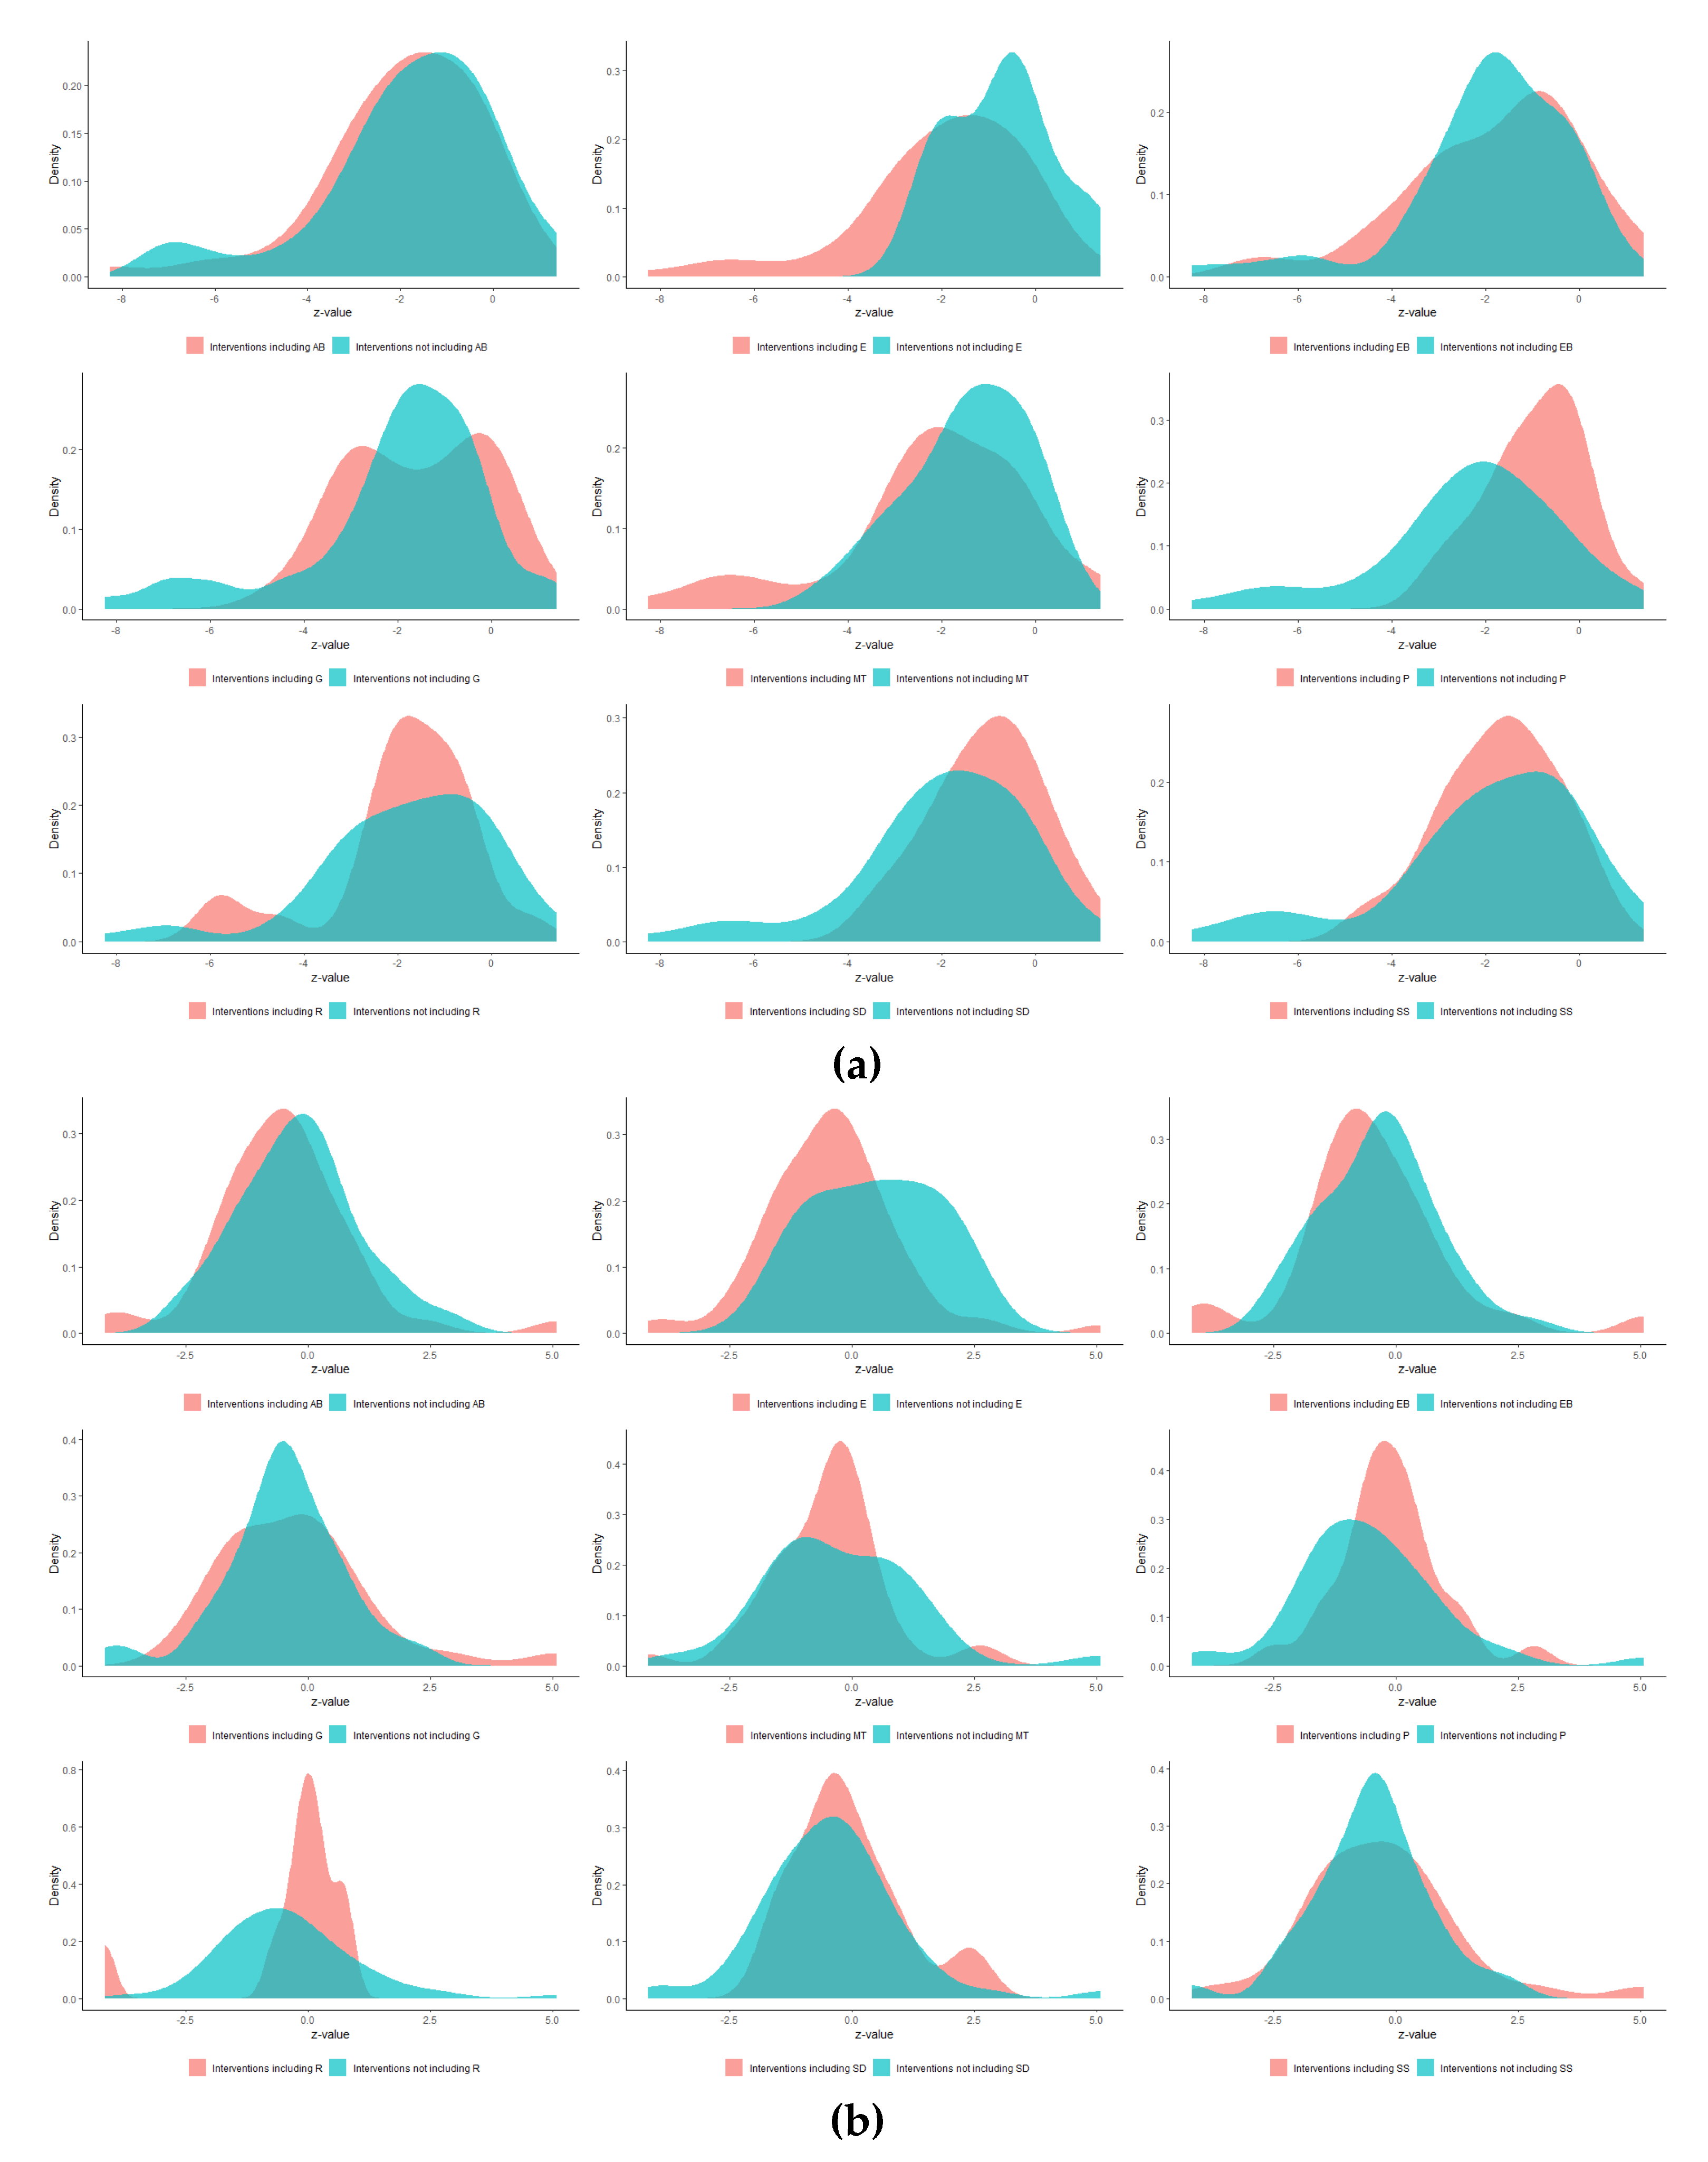
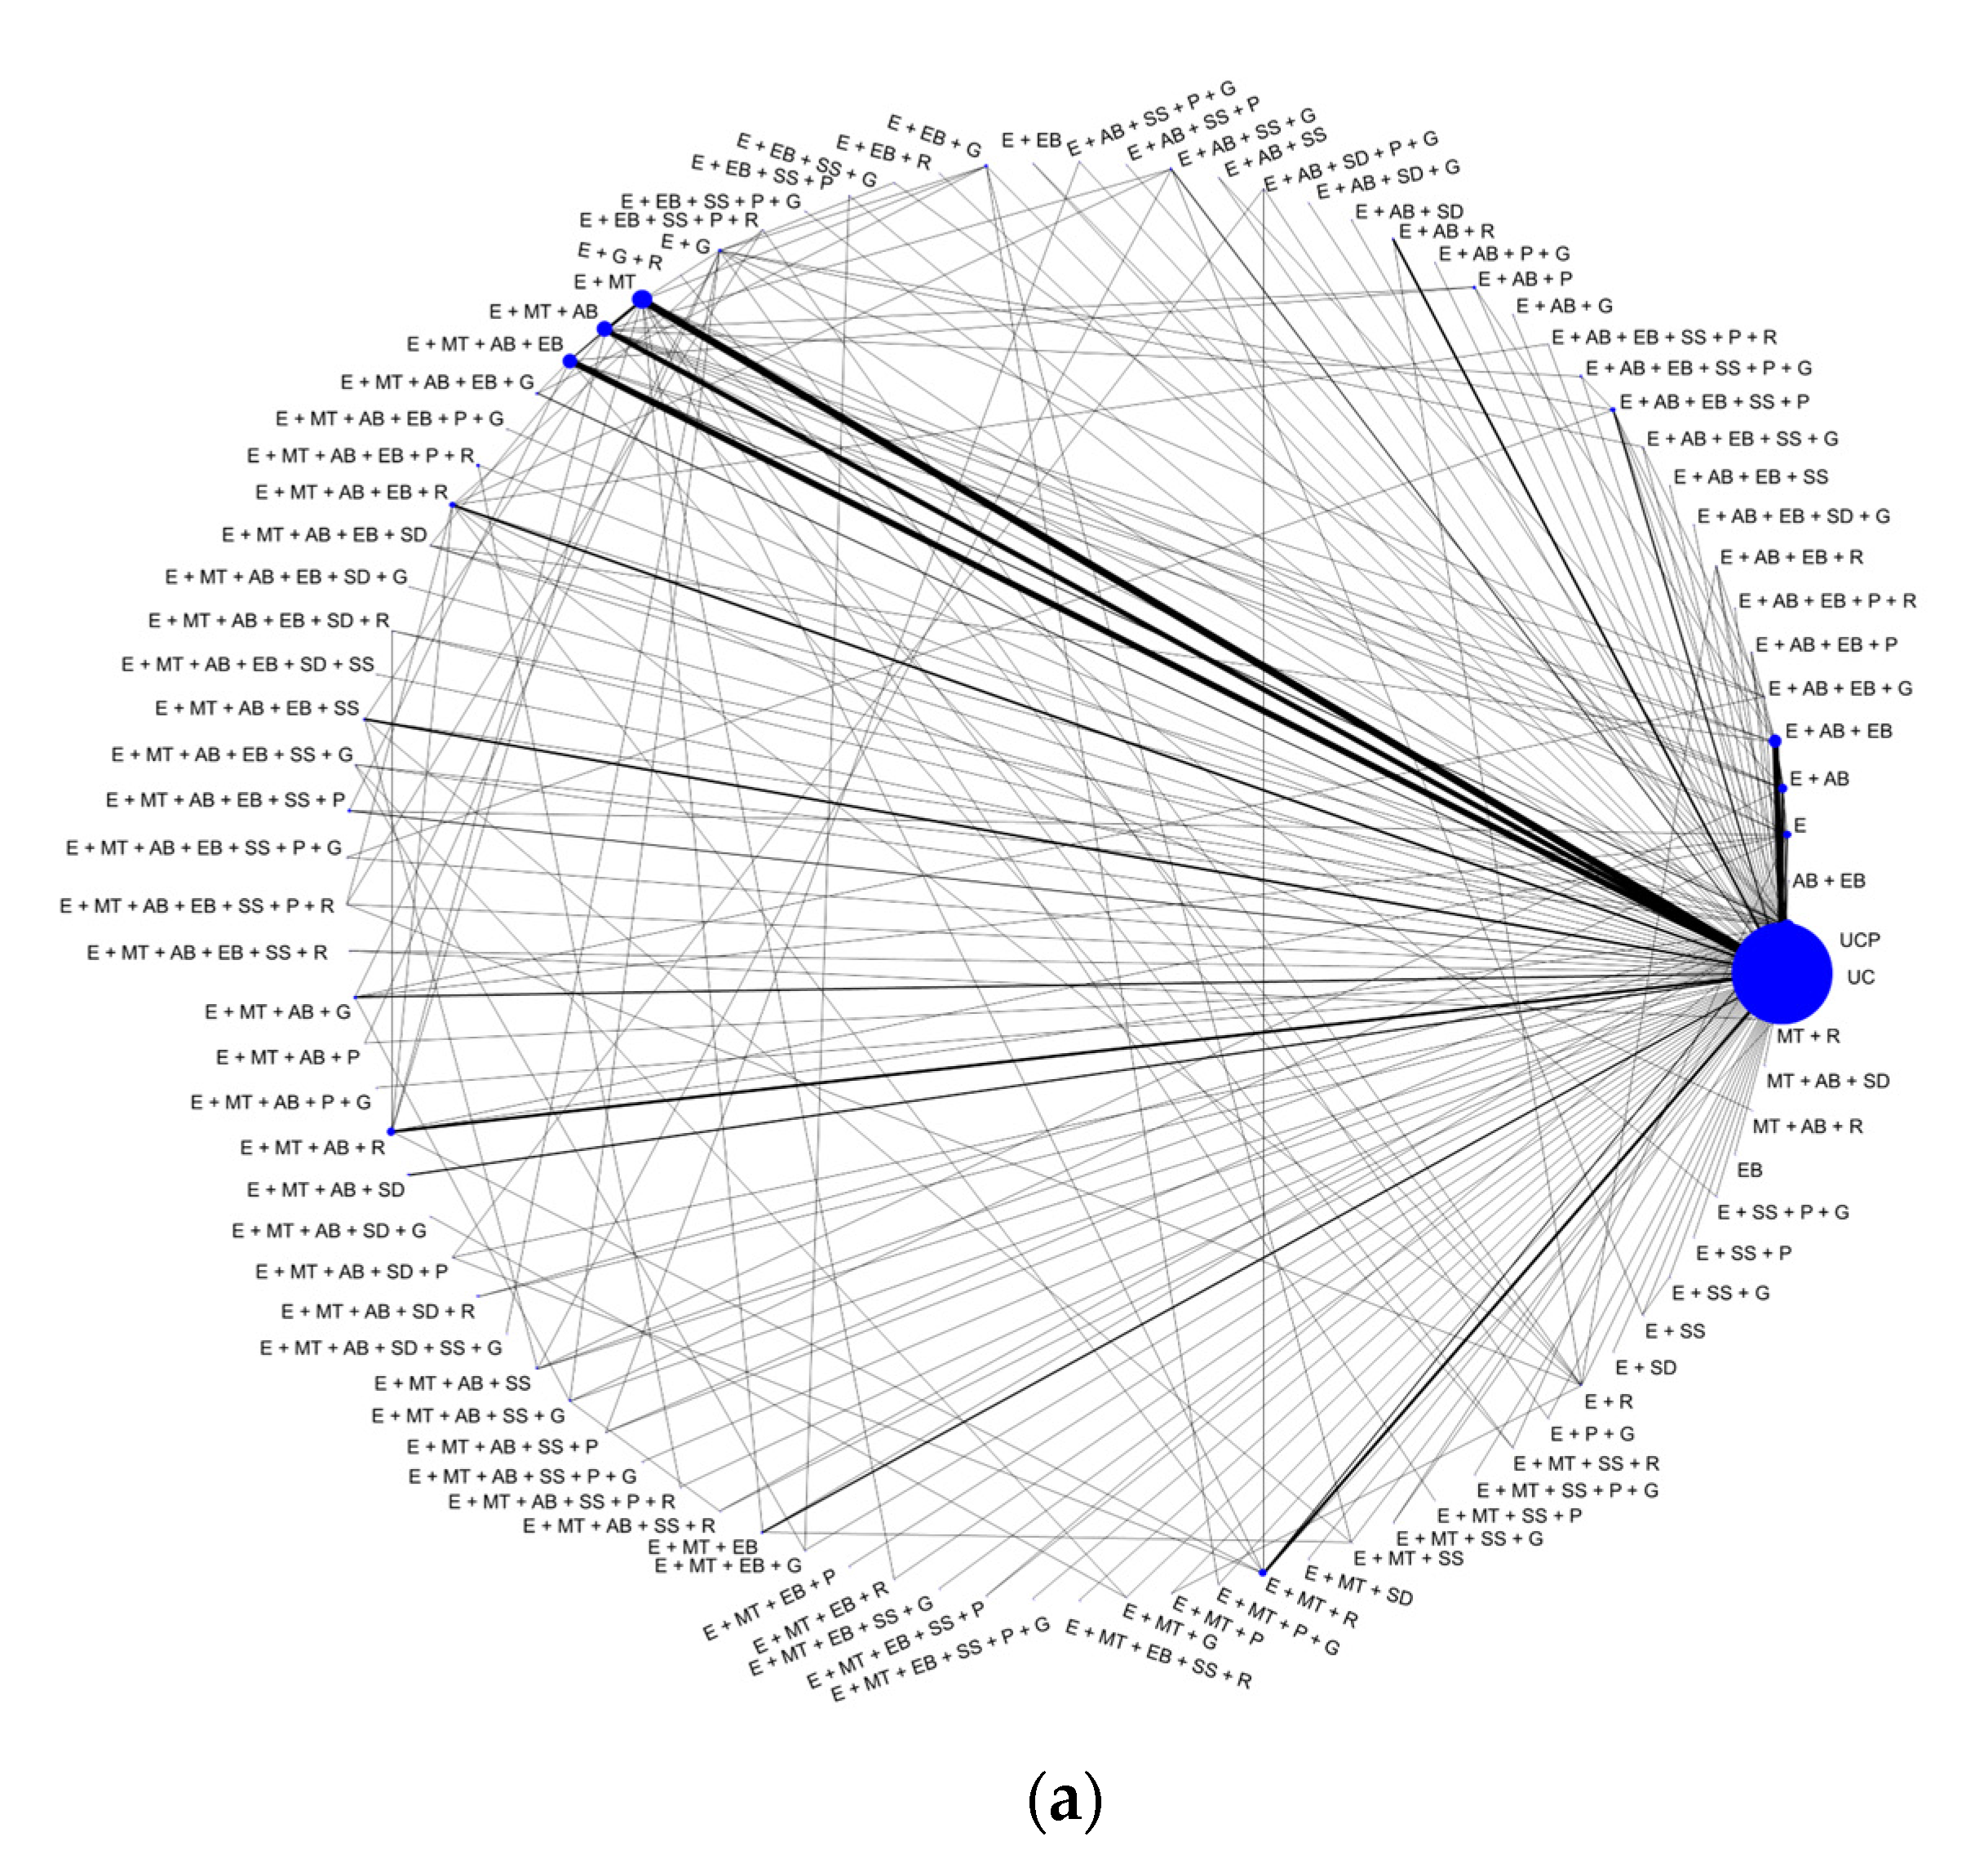
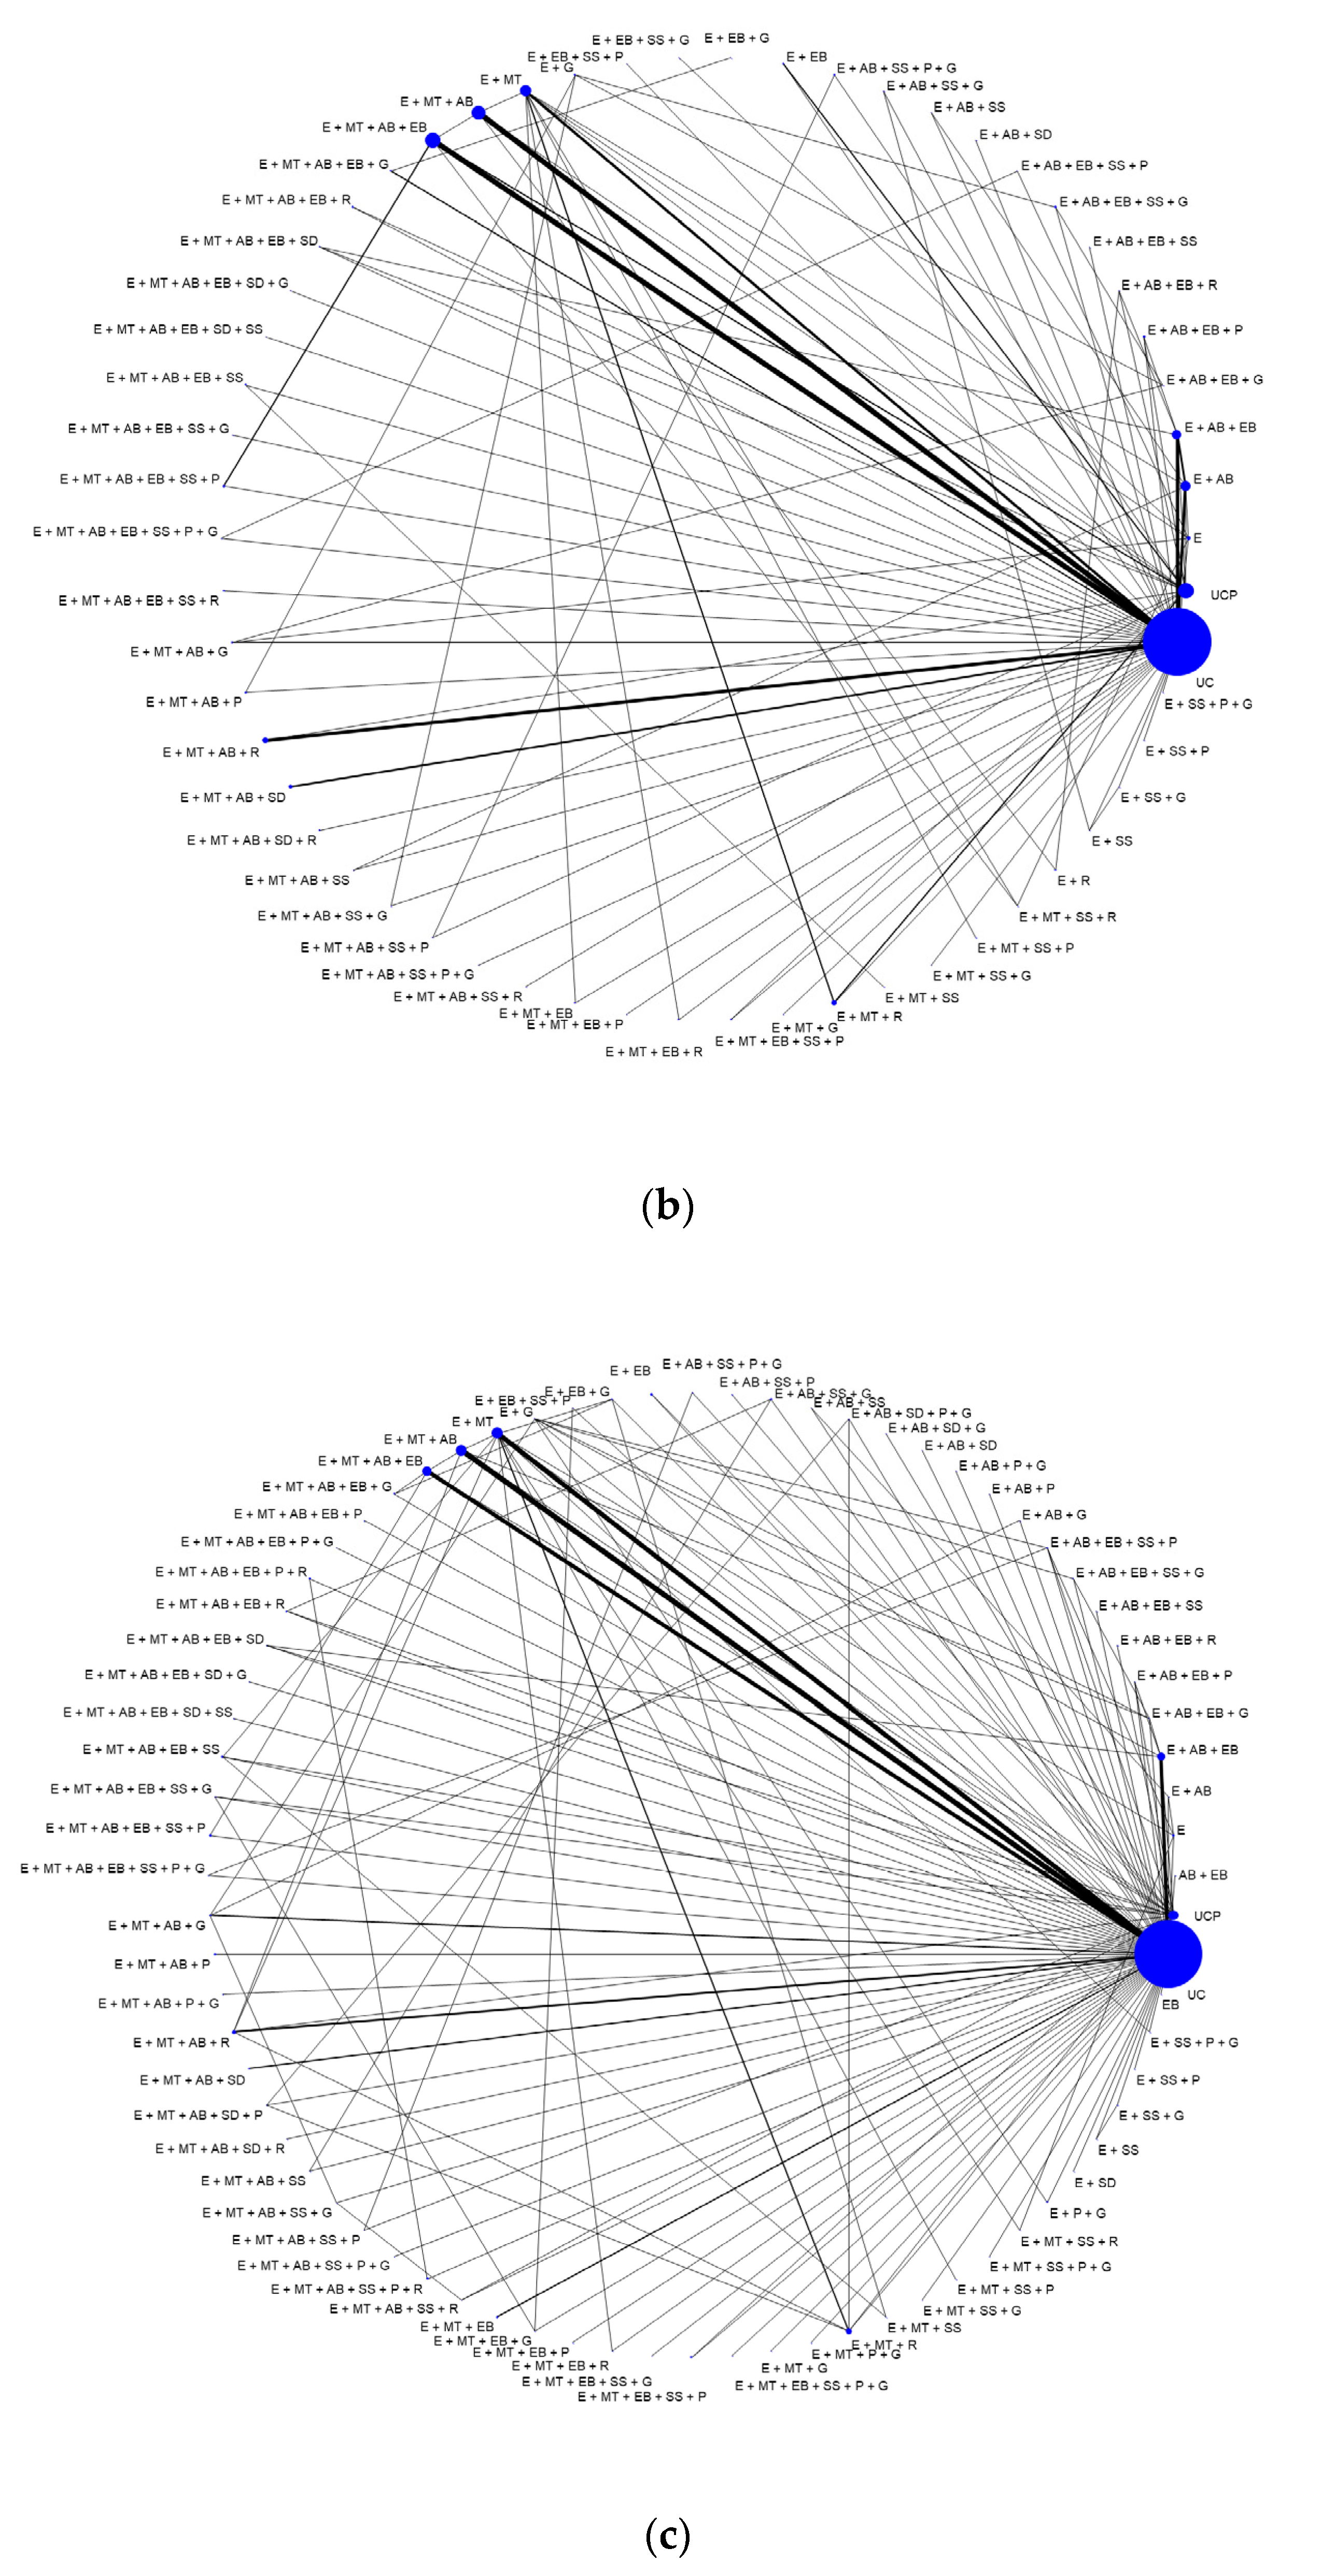
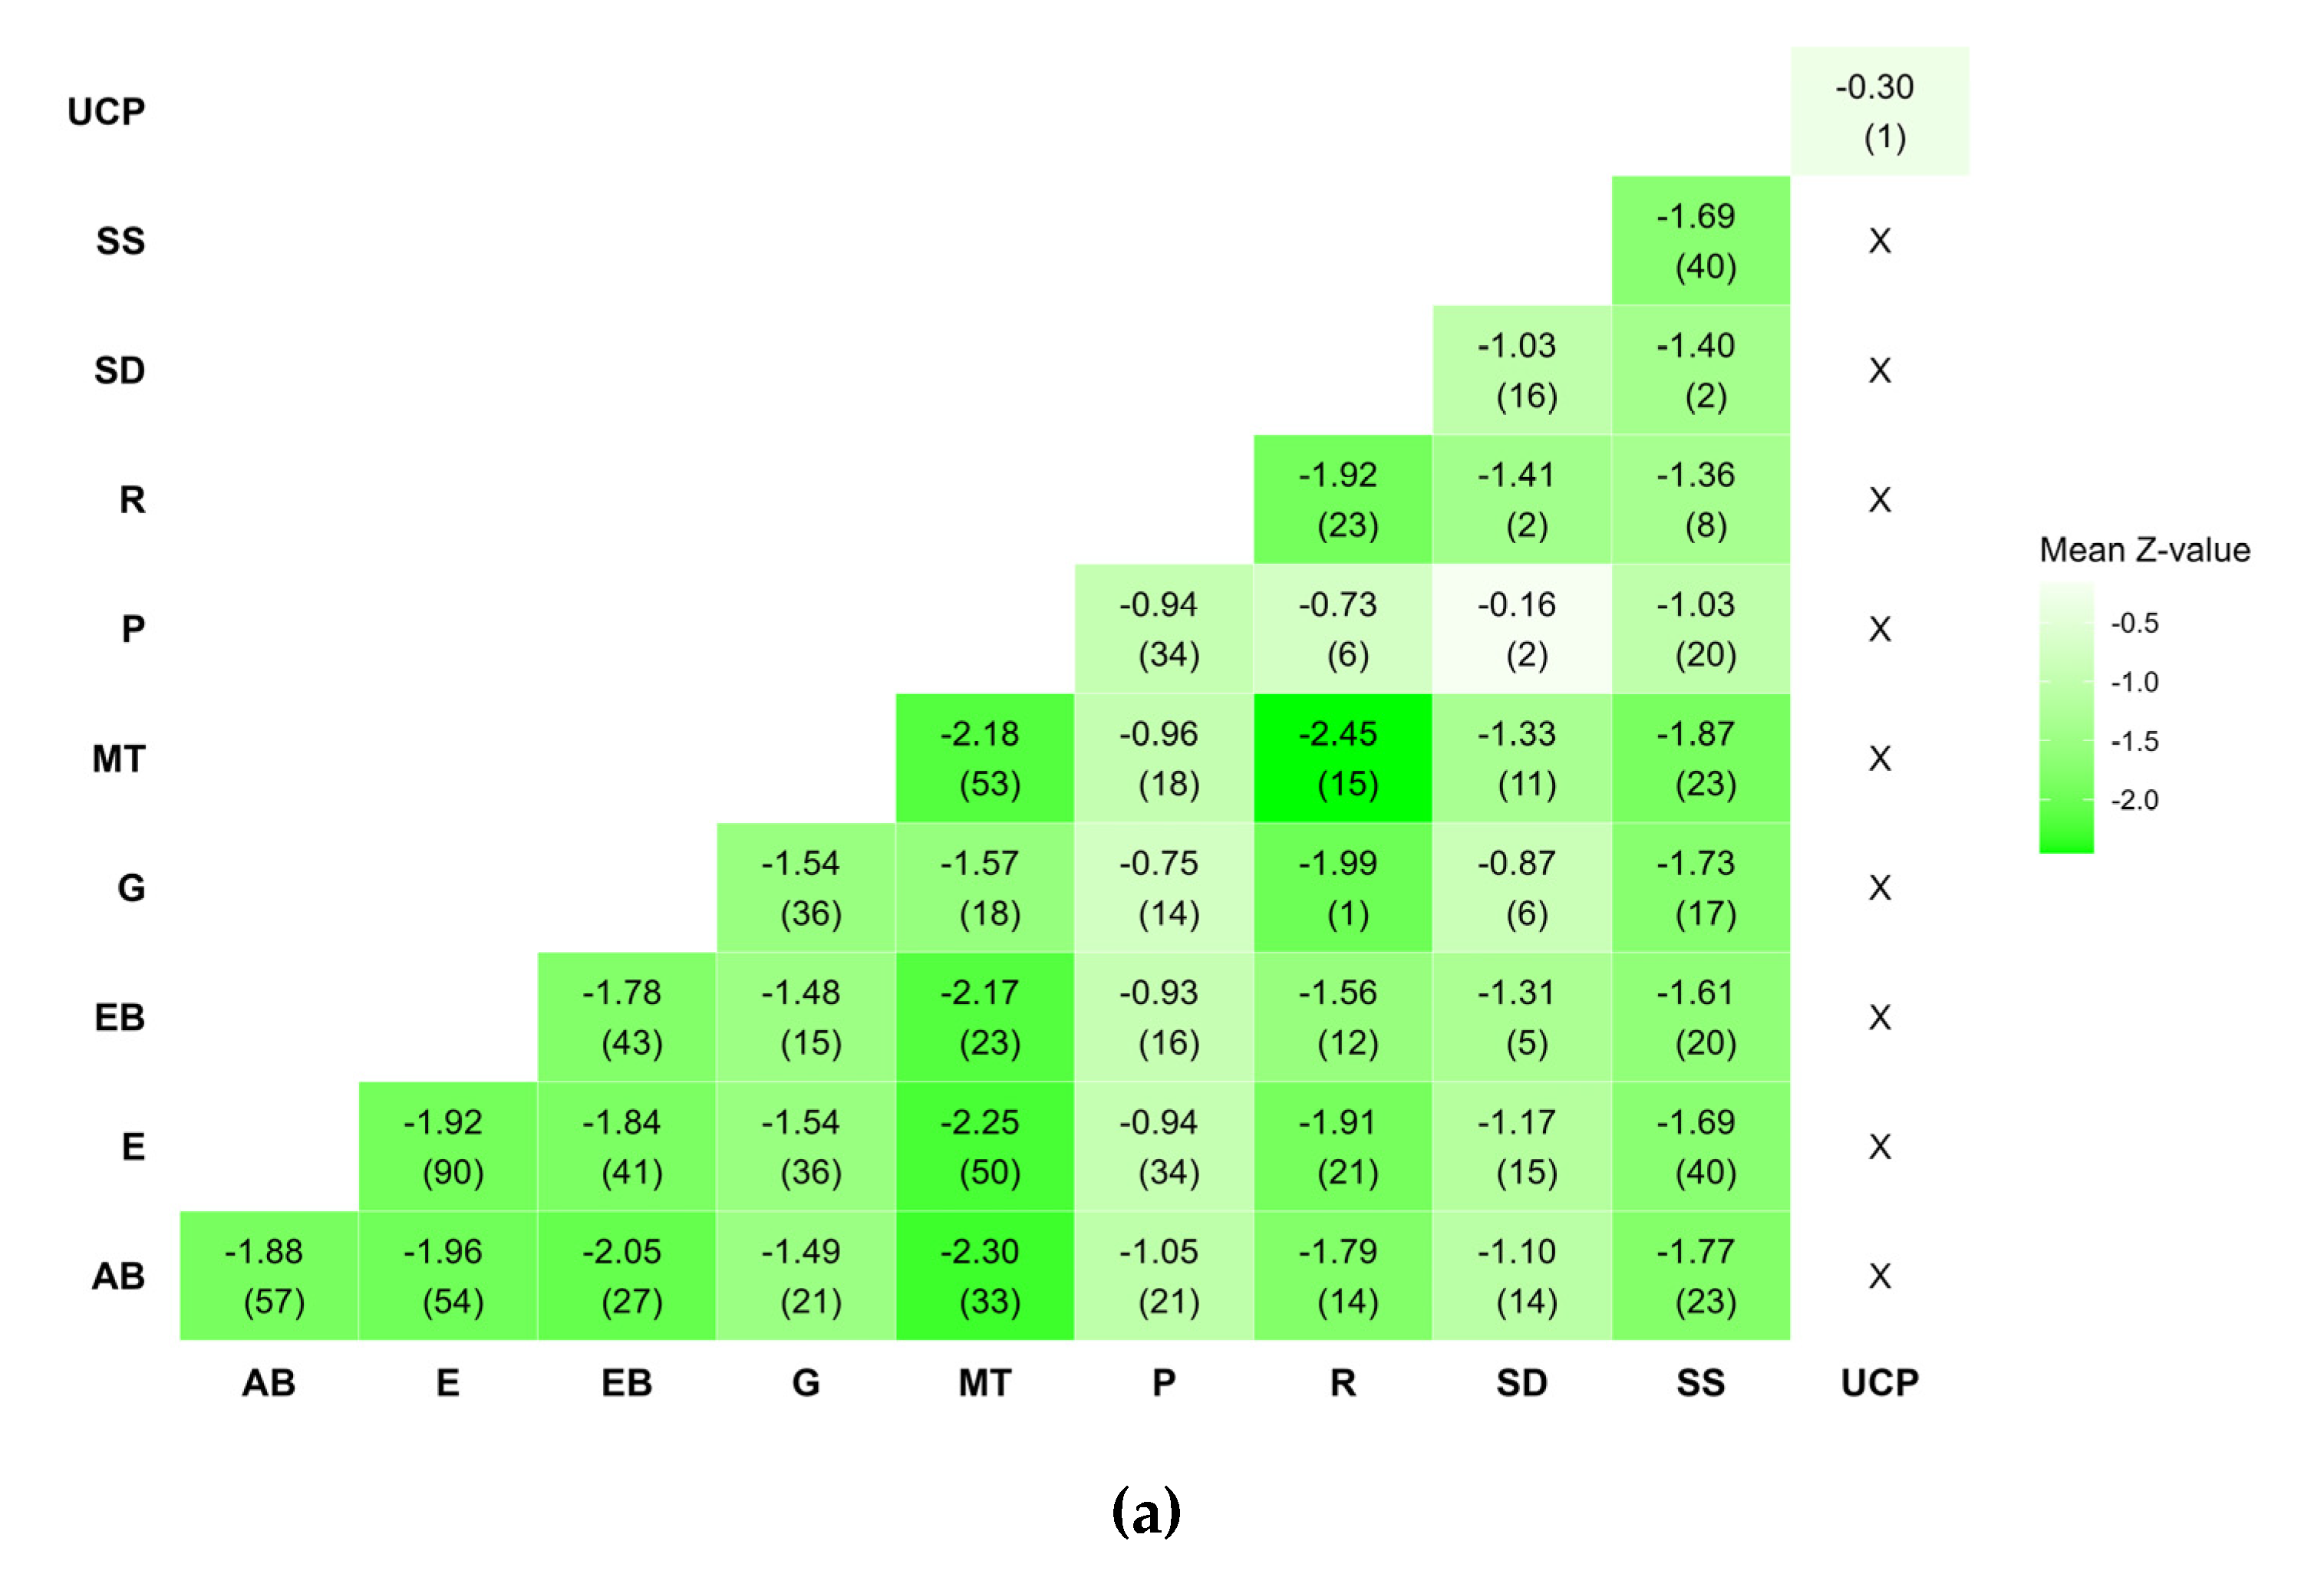
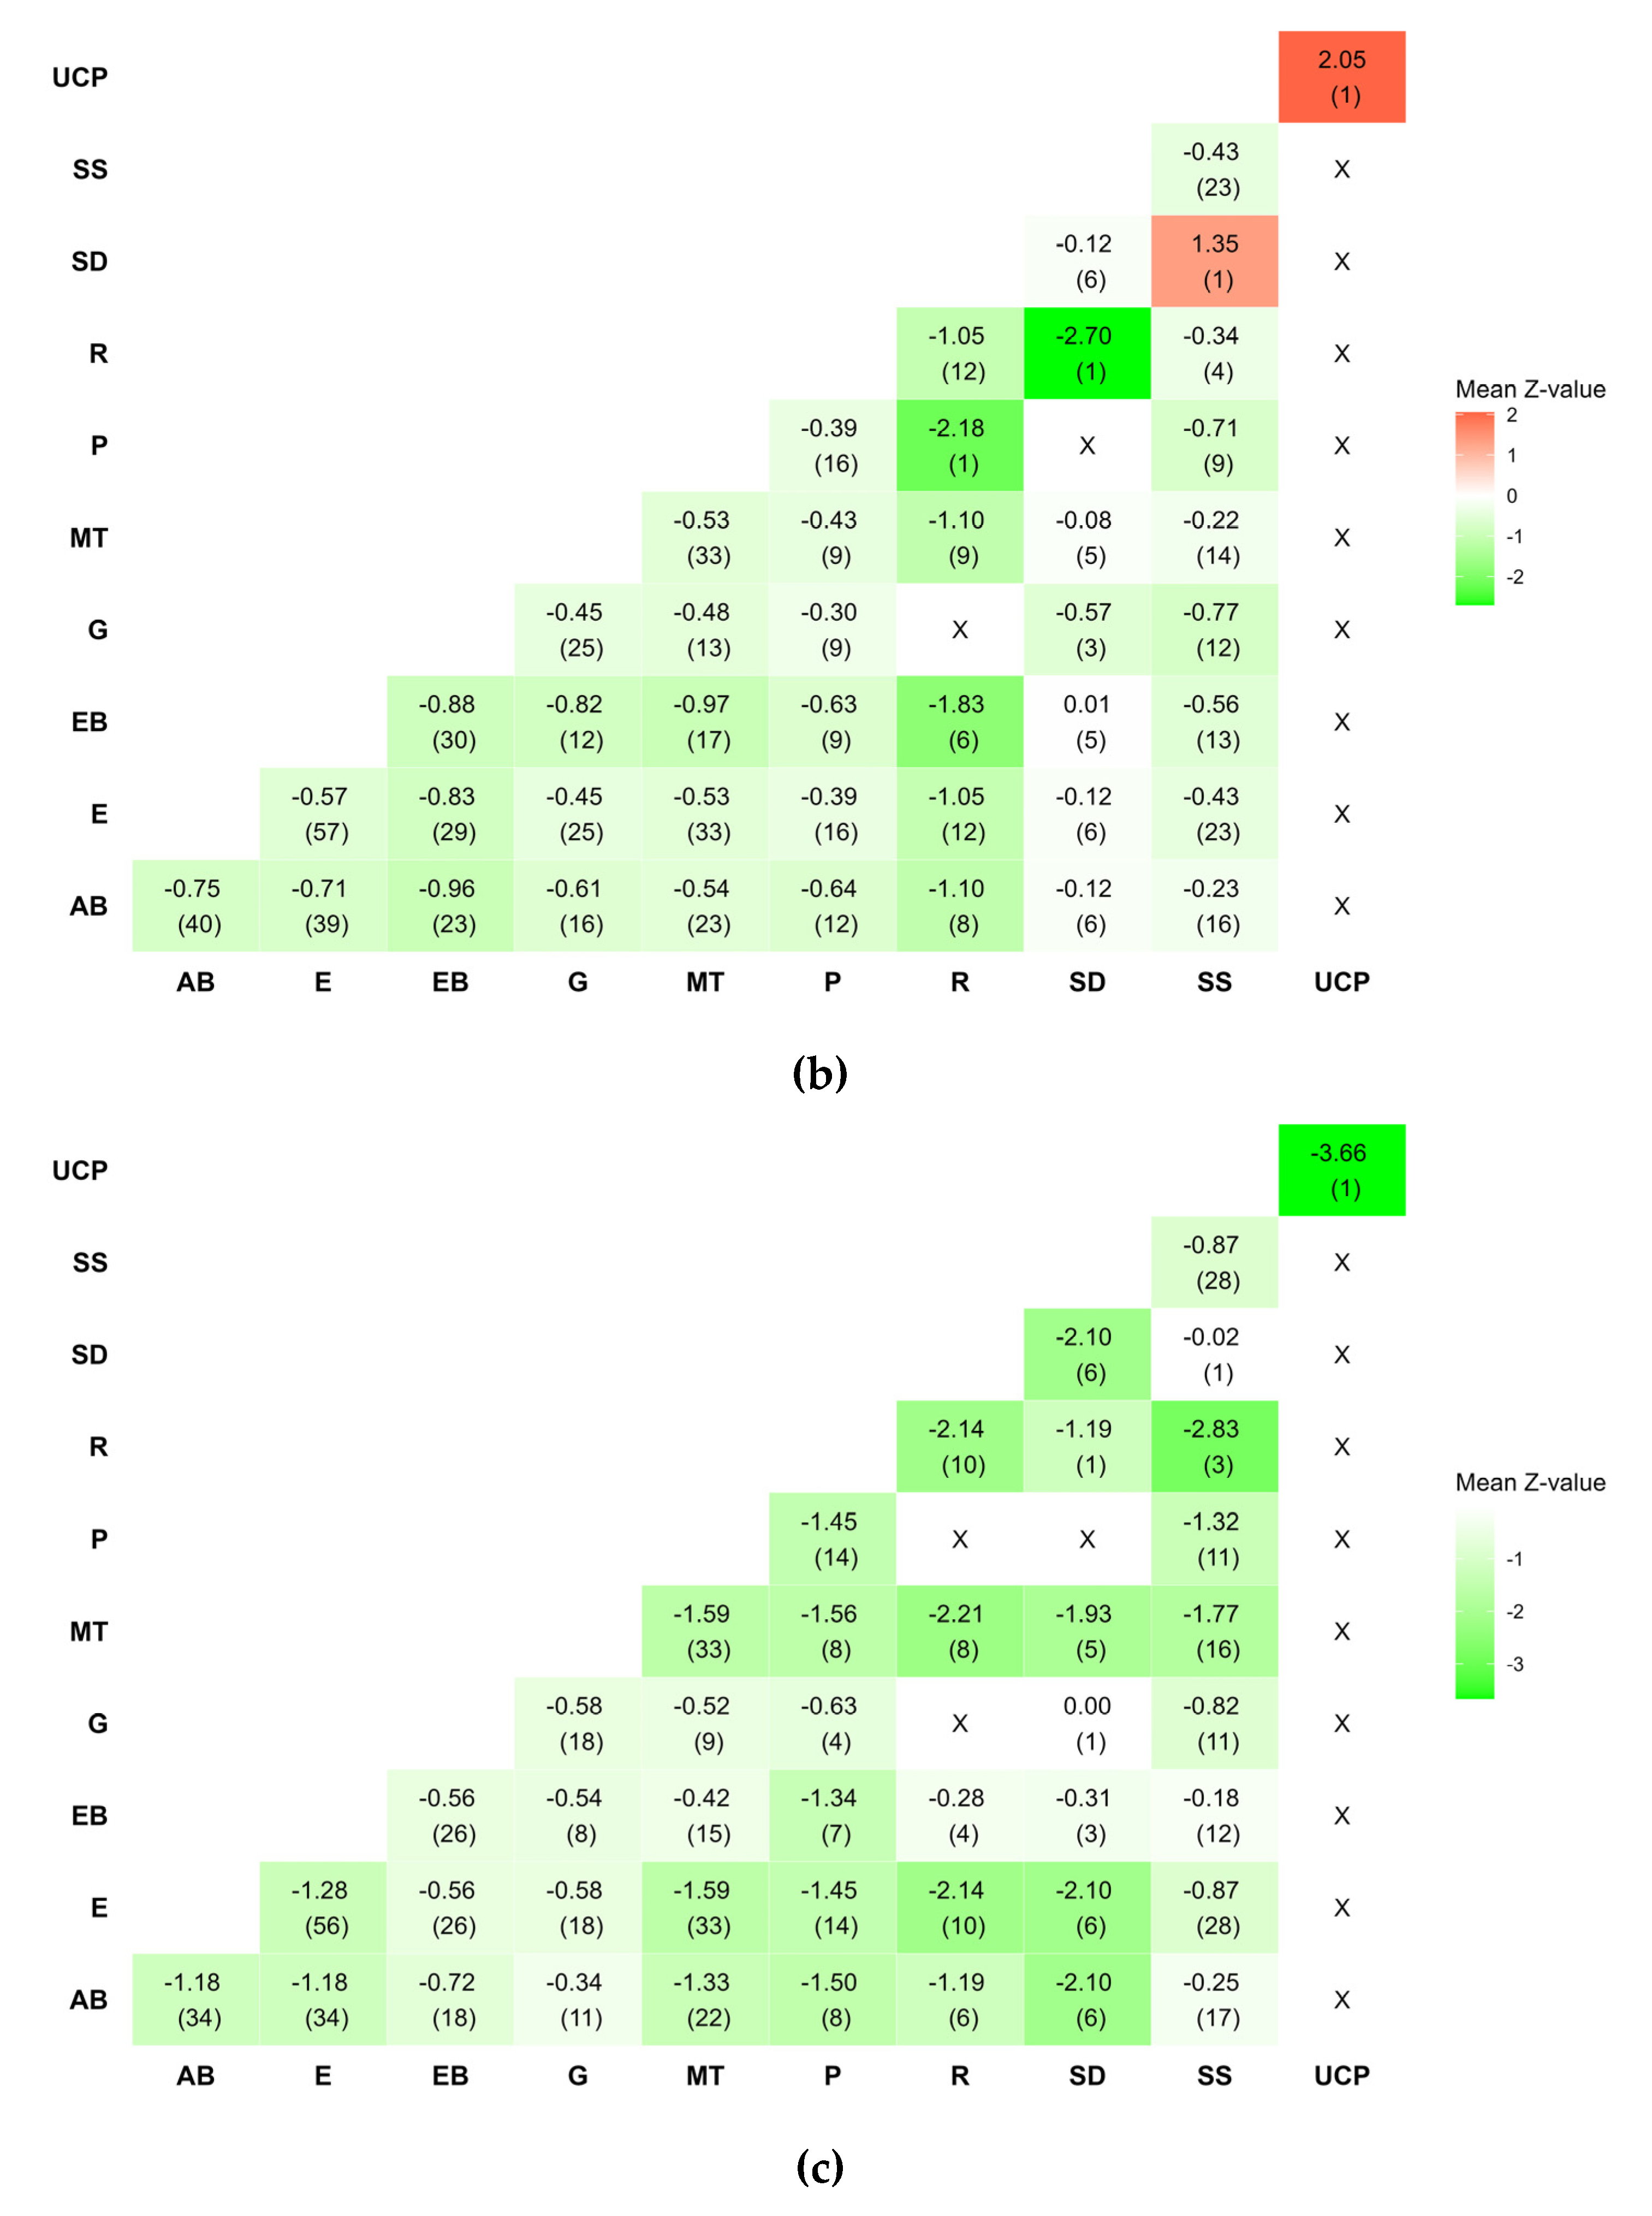
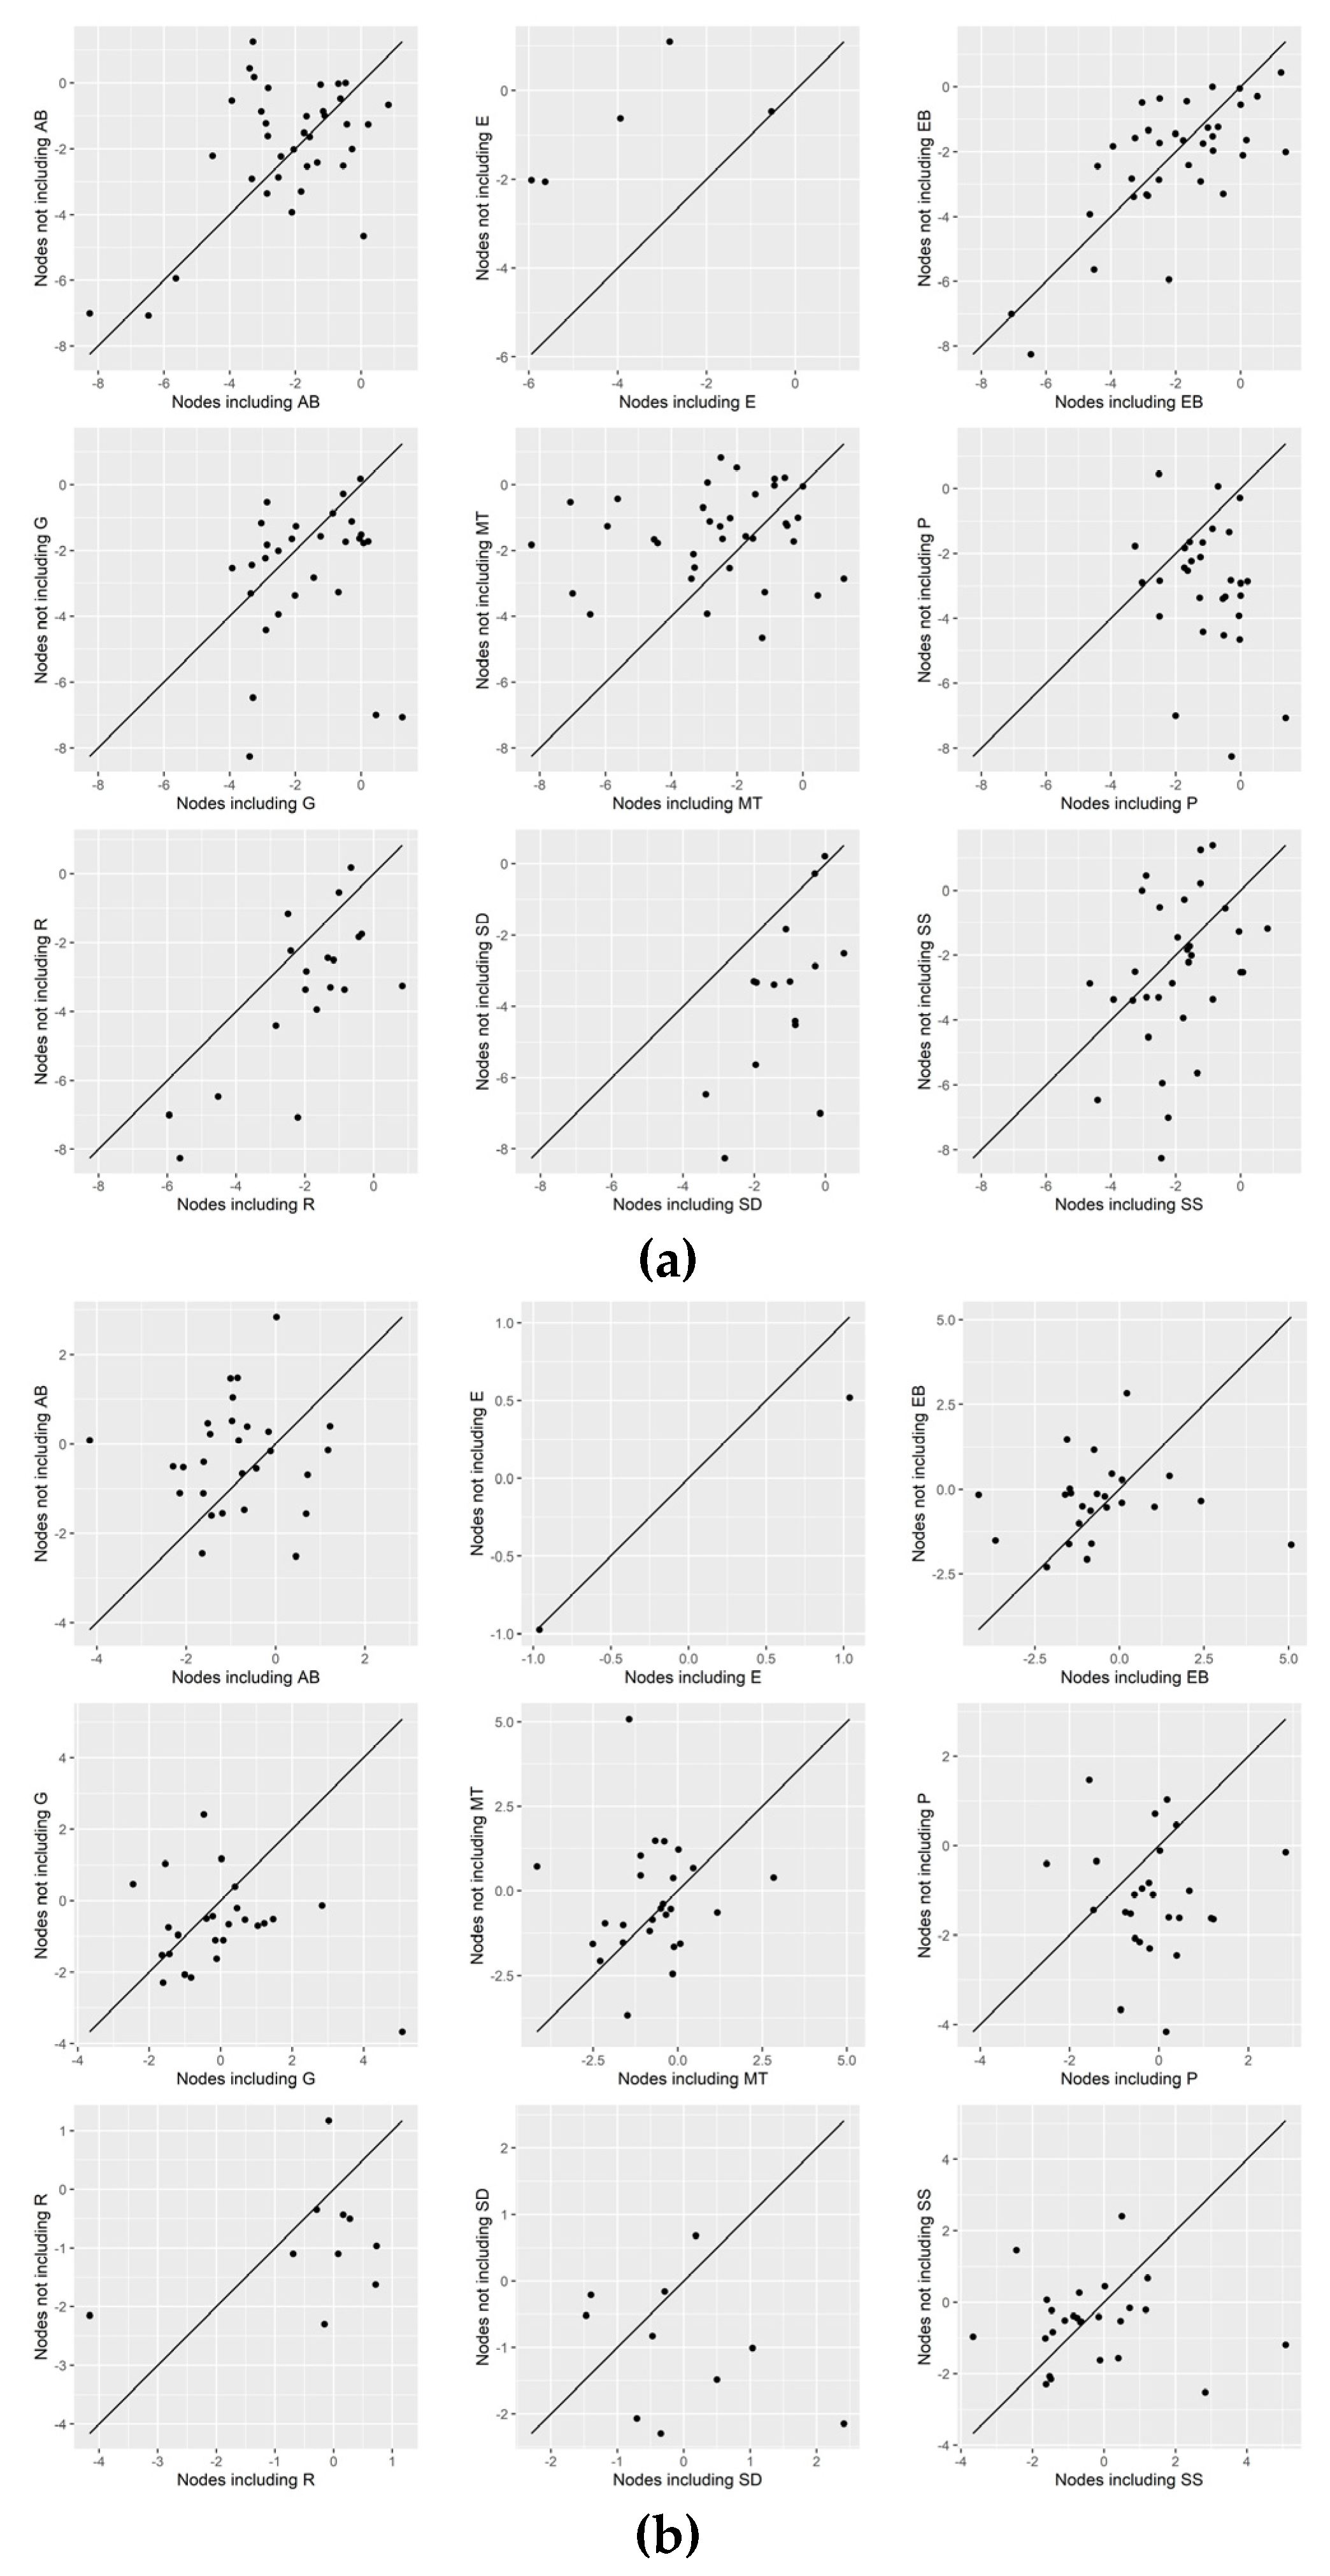
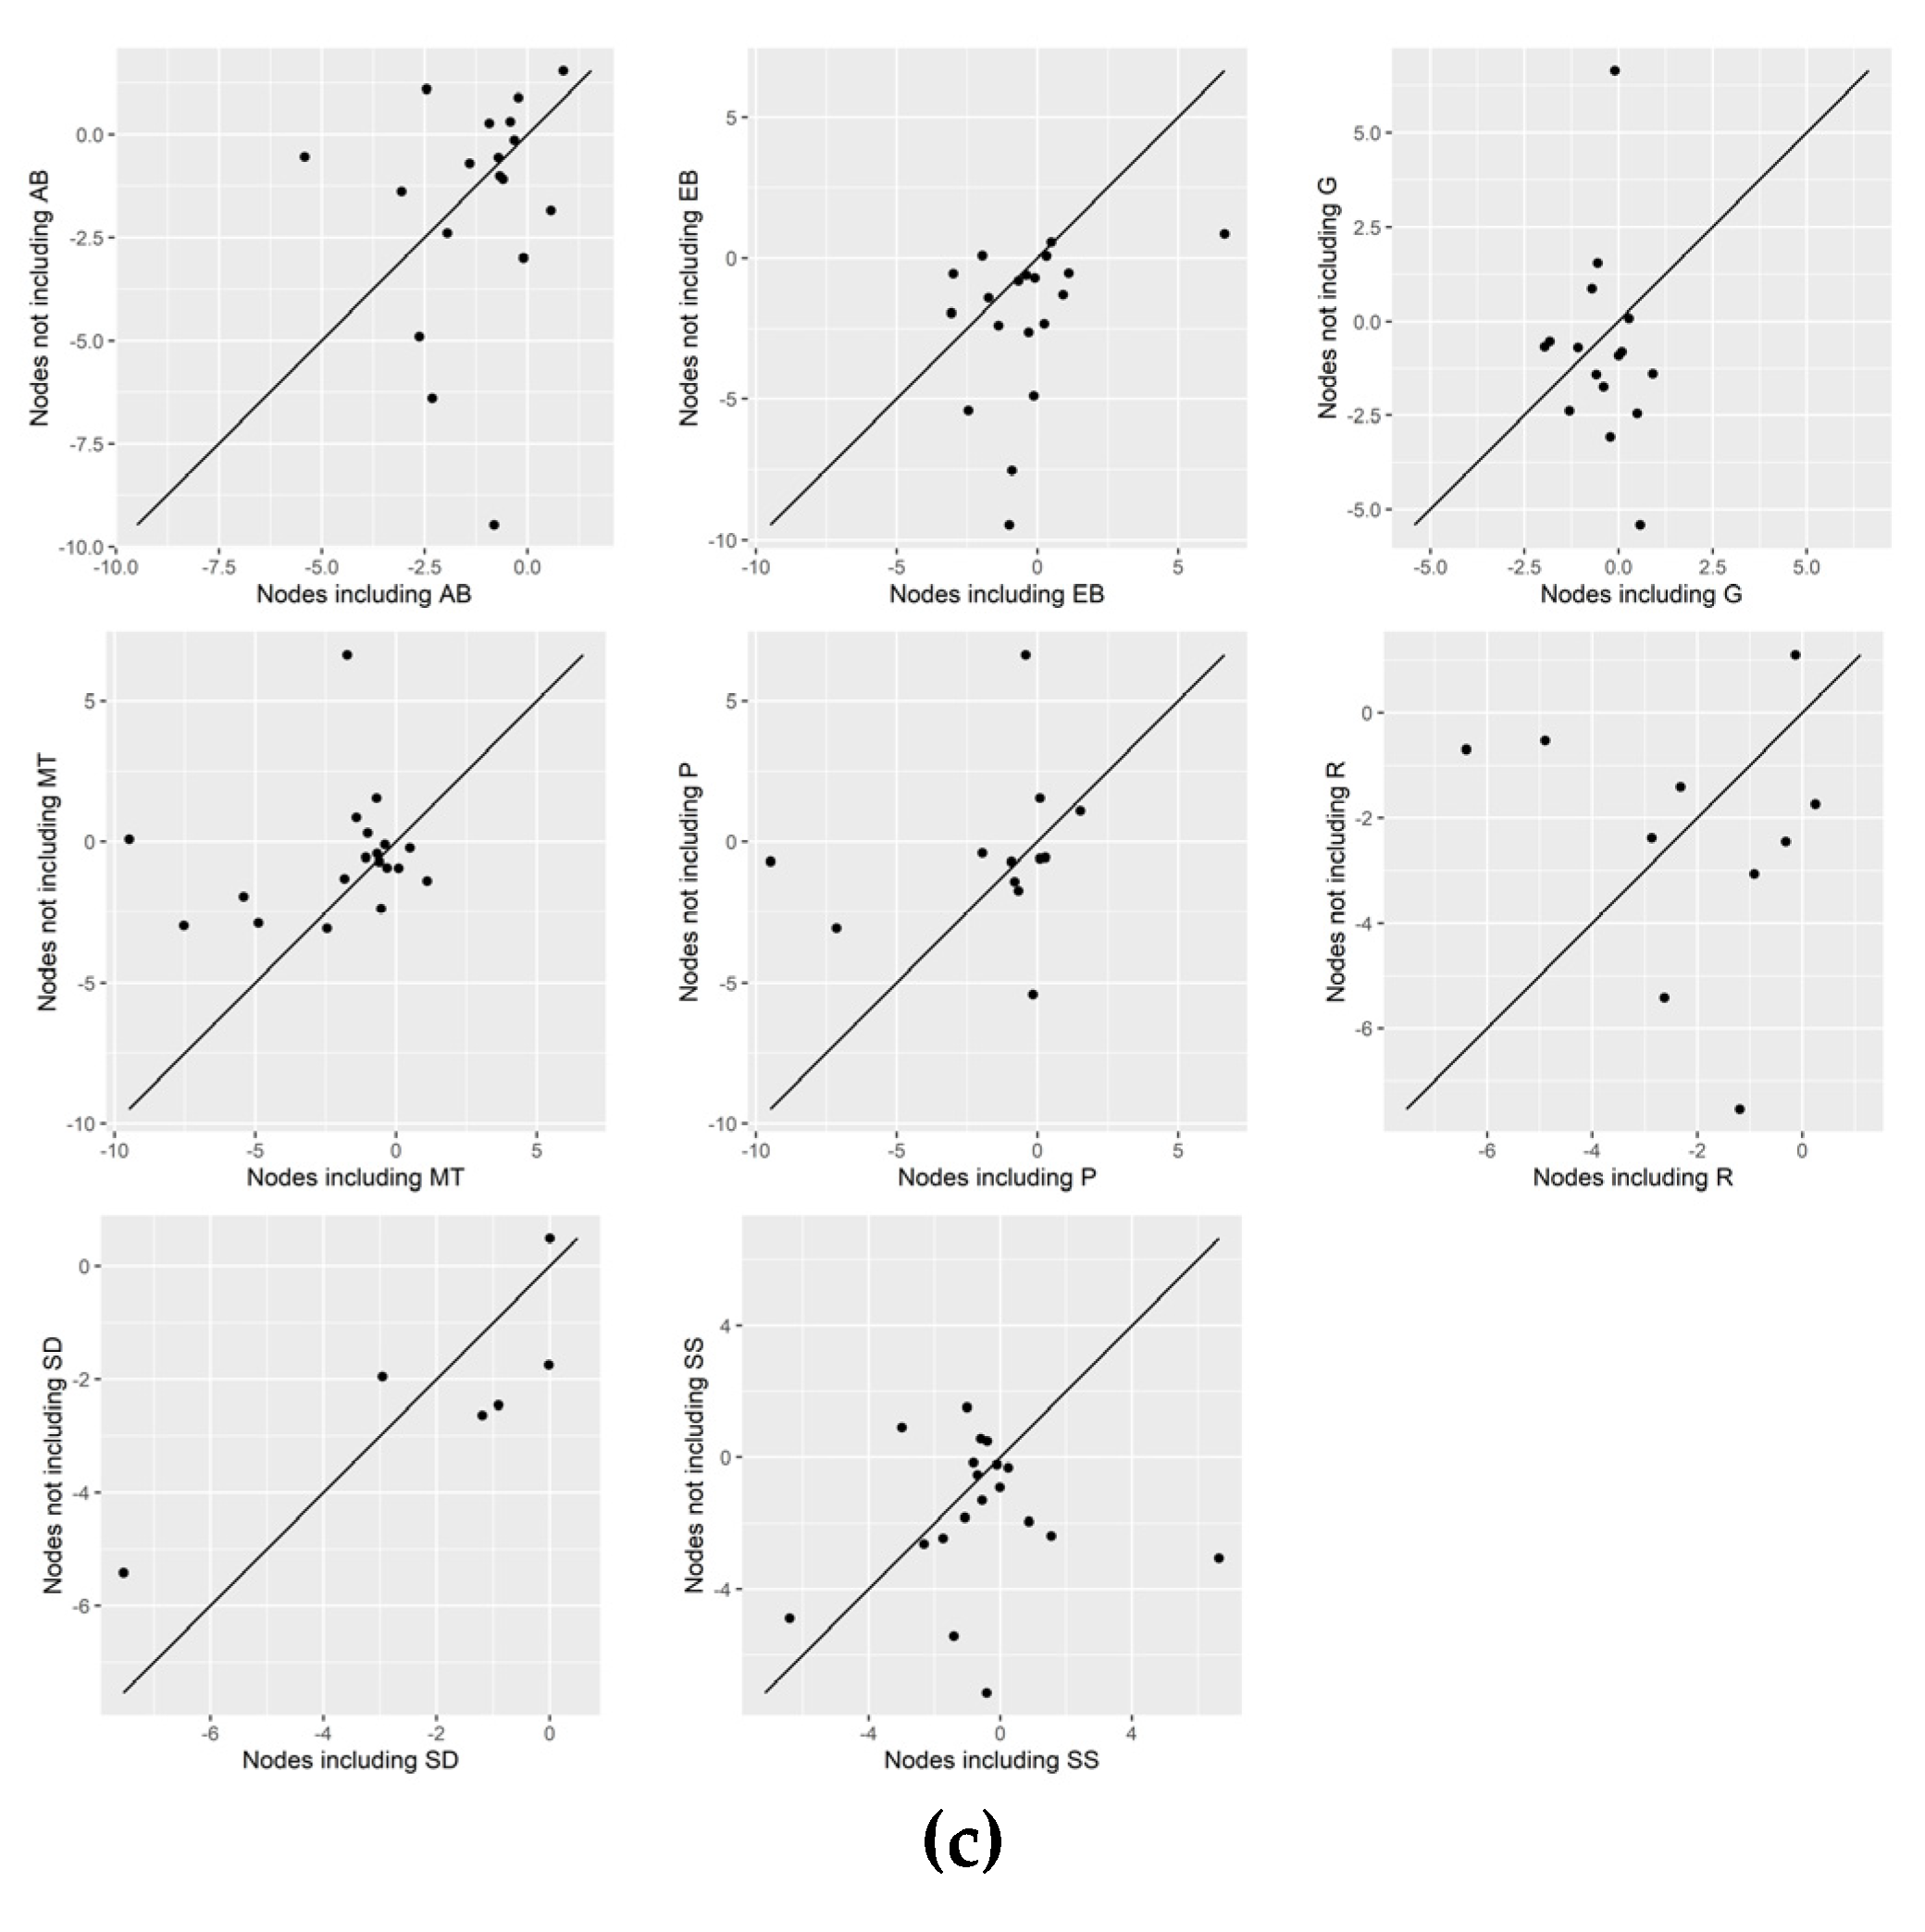
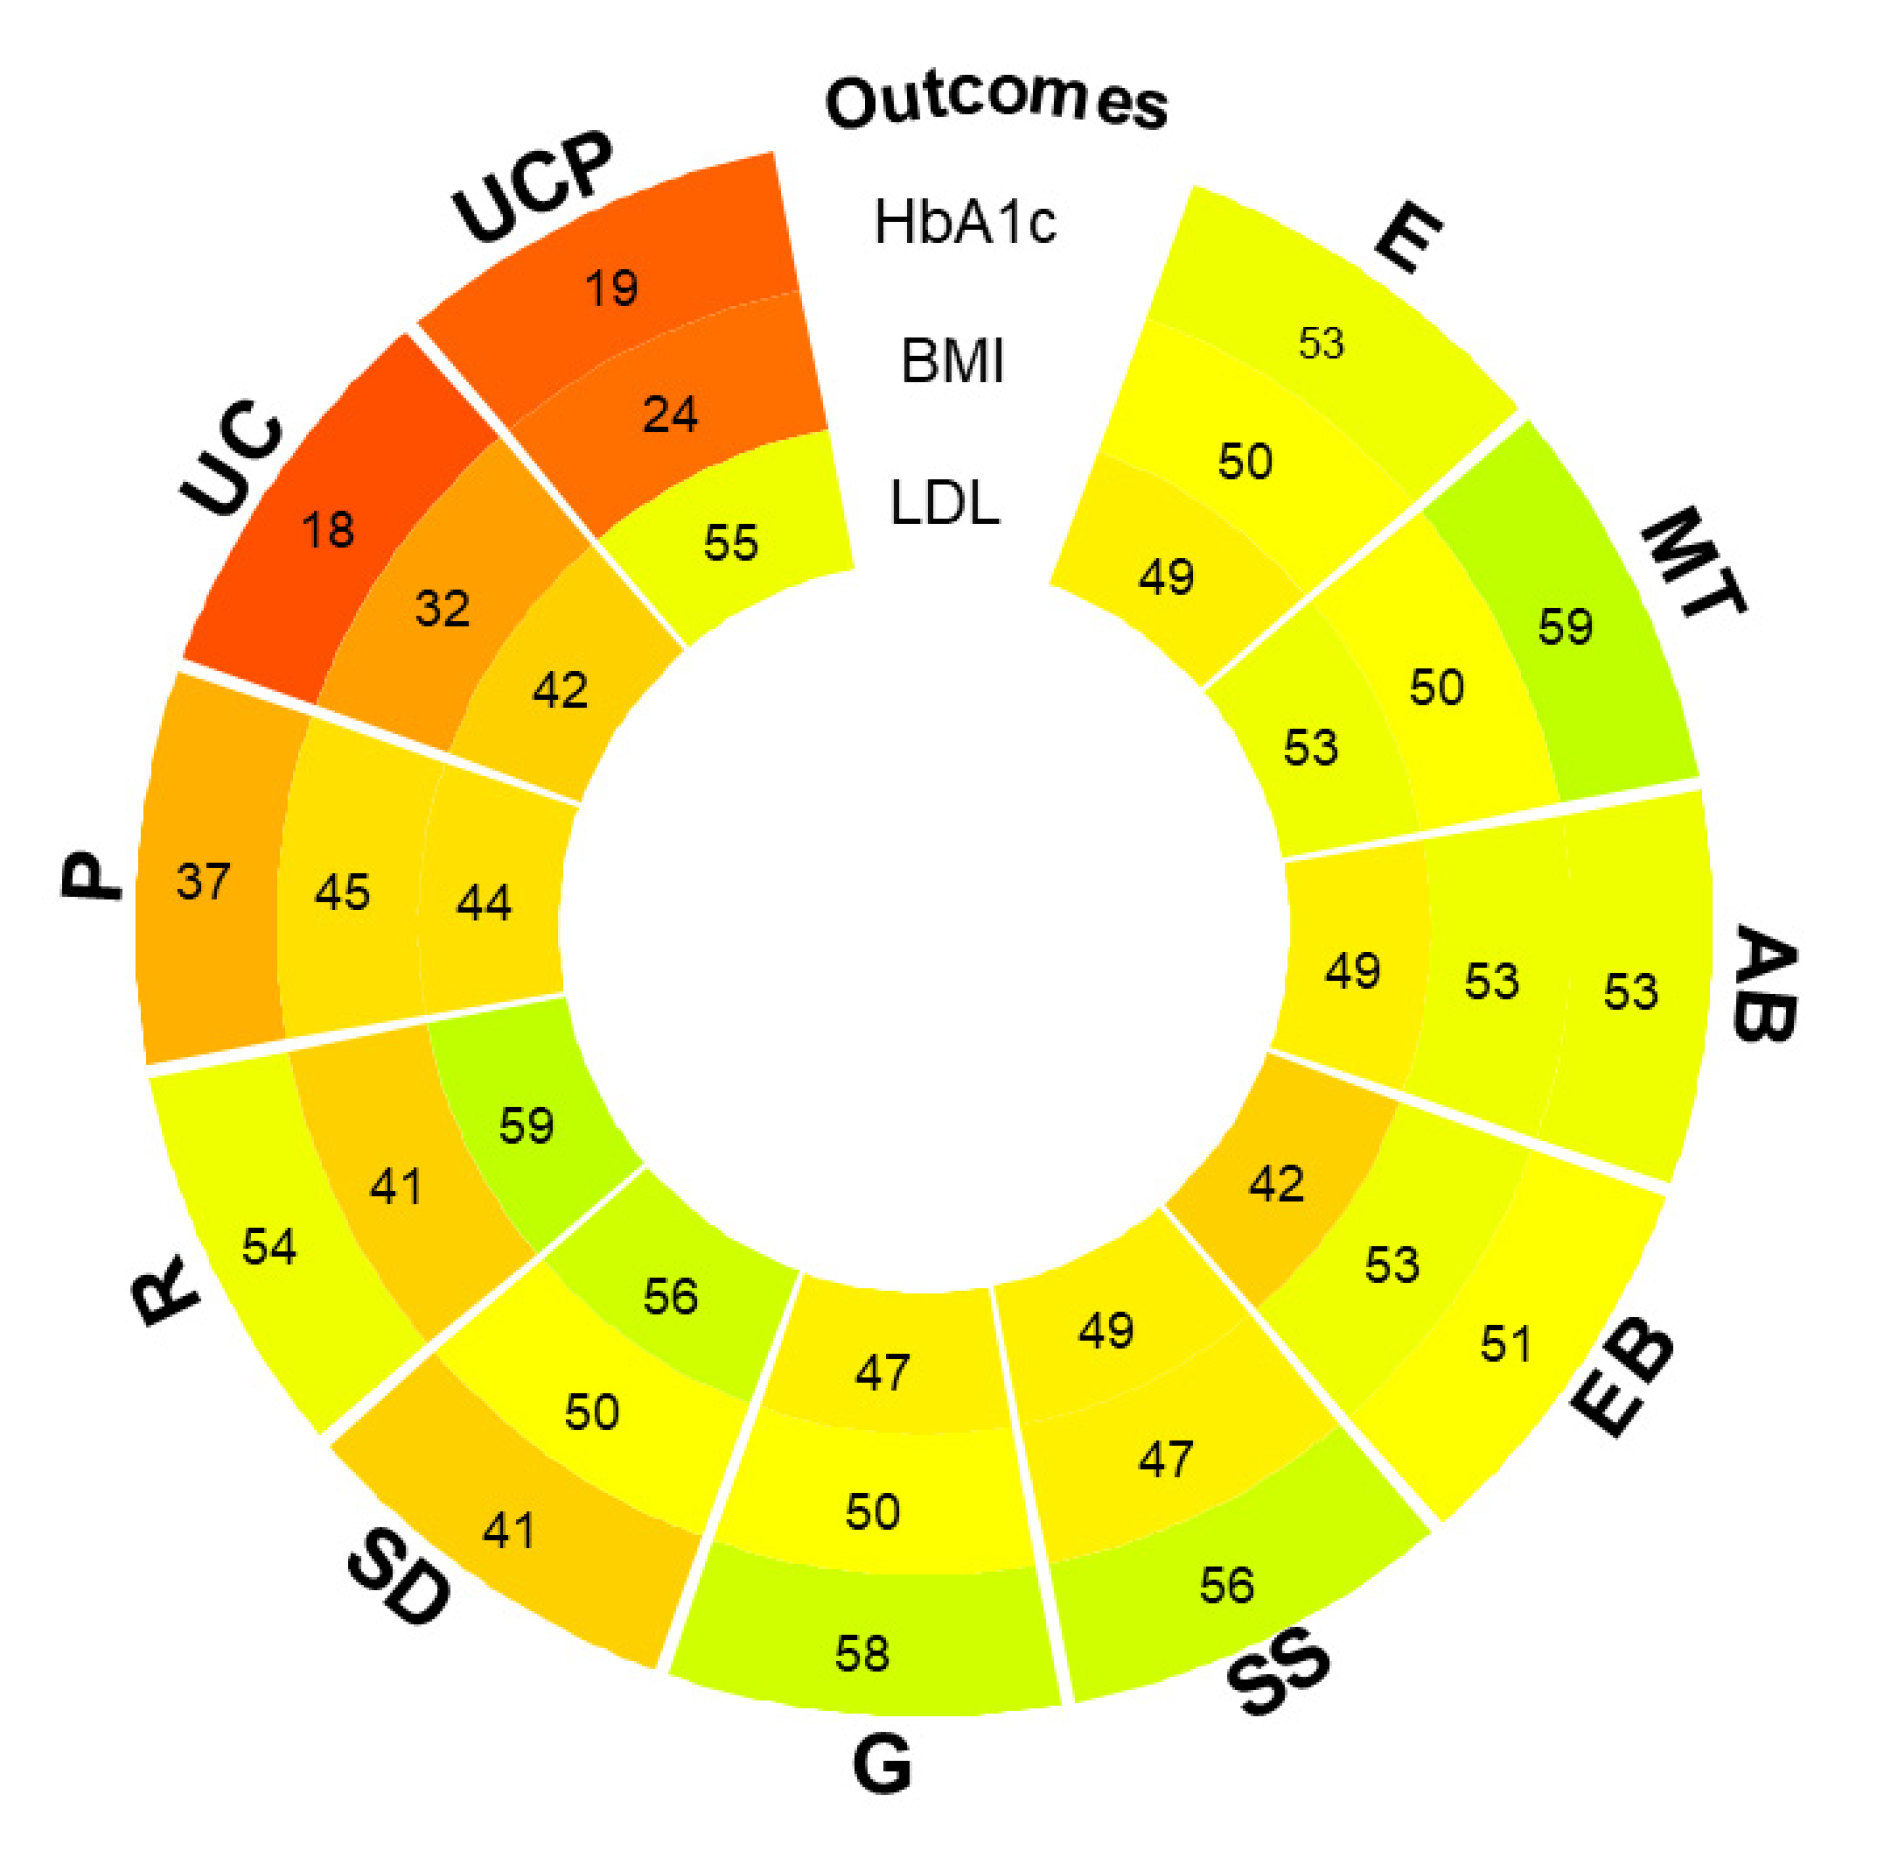
3.6. Visual Inspection of NMA Effects
3.7. Confidence in NMA Results
4. Discussion
5. Conclusions
Supplementary Materials
Author Contributions
Funding
Institutional Review Board Statement
Informed Consent Statement
Data Availability Statement
Acknowledgments
Conflicts of Interest
References
- WHO. Non Communicable Diseases. Available online: https://www.who.int/news-room/fact-sheets/detail/noncommunicable-diseases (accessed on 18 September 2023).
- Anderson, E.; Durstine, J.L. Physical activity, exercise, and chronic diseases: A brief review. Sports Med. Health Sci. 2019, 1, 3–10. [Google Scholar] [CrossRef]
- The Lancet. Patient Empowerment--Who Empowers Whom? Lancet 2012, 379, 1677. [Google Scholar] [CrossRef] [PubMed]
- International Diabetes Federation. IDF Diabetes Atlas, 10th ed.; International Diabetes Federation: Brussels, Belgium, 2021; Available online: https://www.diabetesatlas.org (accessed on 8 December 2023).
- Bodenheimer, T.; Lorig, K.; Holman, H.; Grumbach, K. Patient self-management of chronic disease in primary care. JAMA 2002, 288, 2469–2475. [Google Scholar] [CrossRef] [PubMed]
- World Health Organization. WHO Global Strategy on People-Centred and Integrated Health Services: Interim Report; WHO/HIS/SDS/2015.6; 2015. Available online: https://apps.who.int/iris/handle/10665/155002 (accessed on 8 December 2022).
- Valli, C.; Suñol, R.; Orrego, C.; de Guzmán, E.N.; Strammiello, V.; Adrion, N.; Immonen, K.; Ninov, L.; van der Gaag, M.; Ballester, M.; et al. The development of a core outcomes set for self-management interventions for patients living with obesity. Clin. Obes. 2021, 12, e12489. [Google Scholar] [CrossRef] [PubMed]
- Newman, S.; Steed, L.; Mulligan, K. Self-management interventions for chronic illness. Lancet 2004, 364, 1523–1537. [Google Scholar] [CrossRef] [PubMed]
- Self-Management. COMPAR-EU. Available online: https://self-management.eu/ (accessed on 18 September 2023).
- Michie, S.; Fixsen, D.; Grimshaw, J.M.; Eccles, M.P. Specifying and reporting complex behaviour change interventions: The need for a scientific method. Implement. Sci. 2009, 4, 40. [Google Scholar] [CrossRef] [PubMed]
- Seitidis, G.; Nikolakopoulos, S.; Hennessy, E.; Tanner-Smith, E.; Mavridis, D. Network Meta-Analysis Techniques for Synthesizing Prevention Science Evidence. Prev. Sci. 2021, 23, 415–424. [Google Scholar] [CrossRef]
- Salanti, G. Indirect and mixed-treatment comparison, network, or multiple-treatments meta-analysis: Many names, many benefits, many concerns for the next generation evidence synthesis tool. Res. Synth. Methods 2012, 3, 80–97. [Google Scholar] [CrossRef]
- Veroniki, A. Comparative Effectiveness of self-Management Interventions for Type 2 Diabetes: A Protocol for a Systematic Review and Network Meta-Analysis. 2022. Available online: https://osf.io/65zgr.
- Rücker, G.; Petropoulou, M.; Schwarzer, G. Network meta-analysis of multicomponent interventions. Biom. J. 2019, 62, 808–821. [Google Scholar] [CrossRef]
- Welton, N.J.; Caldwell, D.M.; Adamopoulos, E.; Vedhara, K. Mixed Treatment Comparison Meta-Analysis of Complex Interventions: Psychological Interventions in Coronary Heart Disease. Am. J. Epidemiol. 2009, 169, 1158–1165. [Google Scholar] [CrossRef]
- Tsokani, S.; Seitidis, G.; Mavridis, D. Component network meta-analysis in a nutshell. BMJ Evid.-Based Med. 2022, 28, 183–186. [Google Scholar] [CrossRef] [PubMed]
- Hutton, B.; Salanti, G.; Caldwell, D.M.; Chaimani, A.; Schmid, C.H.; Cameron, C.; Ioannidis, J.P.A.; Straus, S.; Thorlund, K.; Jansen, J.P.; et al. The PRISMA Extension Statement for Reporting of Systematic Reviews Incorporating Network Meta-analyses of Health Care Interventions: Checklist and Explanations. Ann. Intern. Med. 2015, 162, 777–784. [Google Scholar] [CrossRef] [PubMed]
- PRO-STEP. Available online: https://www.eu-patient.eu/projects/completed-projects/prostep/ (accessed on 18 September 2023).
- Higgins, J.P.T.; Altman, D.G.; Gøtzsche, P.C.; Jüni, P.; Moher, D.; Oxman, A.D.; Savović, J.; Schulz, K.F.; Weeks, L.; Sterne, J.A.C.; et al. The Cochrane Collaboration’s tool for assessing risk of bias in randomised trials. BMJ 2011, 343, d5928. [Google Scholar] [CrossRef] [PubMed]
- Petropoulou, M.; Efthimiou, O.; Rücker, G.; Schwarzer, G.; Furukawa, T.A.; Pompoli, A.; Koek, H.L.; Del Giovane, C.; Rodondi, N.; Mavridis, D. A review of methods for addressing components of interventions in meta-analysis. PLoS ONE 2021, 16, e0246631. [Google Scholar] [CrossRef] [PubMed]
- Seitidis, G.; Tsokani, S.; Christogiannis, C.; Kontouli, K.; Fyraridis, A.; Nikolakopoulos, S.; Veroniki, A.A.; Mavridis, D. Graphical tools for visualizing the results of network meta-analysis of multicomponent interventions. Res. Synth. Methods 2023, 14, 382–395. [Google Scholar] [CrossRef] [PubMed]
- Knapp, G.; Hartung, J. Improved tests for a random effects meta-regression with a single covariate. Stat. Med. 2003, 22, 2693–2710. [Google Scholar] [CrossRef] [PubMed]
- Sidik, K.; Jonkman, J.N. A simple confidence interval for meta-analysis. Stat. Med. 2002, 21, 3153–3159. [Google Scholar] [CrossRef]
- Riley, R.D.; Higgins, J.P.T.; Deeks, J.J. Interpretation of random effects meta-analyses. BMJ 2011, 342, d549. [Google Scholar] [CrossRef]
- Egger, M.; Smith, G.D.; Schneider, M.; Minder, C. Bias in meta-analysis detected by a simple, graphical test. BMJ 1997, 315, 629–634. [Google Scholar] [CrossRef]
- Rücker, G. Network meta-analysis, electrical networks and graph theory. Res. Synth. Methods 2012, 3, 312–324. [Google Scholar] [CrossRef]
- Rucker, G.; Krahn, U.; Konig, J.; Davies, A.; Papakonstantinou, T.; Schwarzer, G. Netmeta: Network Meta-Analysis Using Frequentist Methods. R package Version 2.1-0. 2022. Available online: https://CRAN.R-project.org/package=netmeta.
- Higgins, J.P.T.; Jackson, D.; Barrett, J.K.; Lu, G.; Ades, A.E.; White, I.R. Consistency and inconsistency in network meta-analysis: Concepts and models for multi-arm studies. Res. Synth. Methods 2012, 3, 98–110. [Google Scholar] [CrossRef]
- Rücker, G.; Schwarzer, G. Ranking treatments in frequentist network meta-analysis works without resampling methods. BMC Med. Res. Methodol. 2015, 15, 58. [Google Scholar] [CrossRef]
- Seitidis, G.; Tsokani, S.; Christogiannis, C.; Kontouli, K.M.; Fyraridis, A.; Nikolakopoulos, S.; Veroniki, A.A.; Mavridis, D. viscomp: Visualize Multi-Component Interventions in Network Meta-Analysis. 16 January 2023. Available online: https://cran.r-project.org/web/packages/viscomp/index.html.
- Nikolakopoulou, A.; Higgins, J.P.T.; Papakonstantinou, T.; Chaimani, A.; Del Giovane, C.; Egger, M.; Salanti, G. CINeMA: An approach for assessing confidence in the results of a network meta-analysis. PLoS Med. 2020, 17, e1003082. [Google Scholar] [CrossRef]
- Orrego, C.; Ballester, M.; Heymans, M.; Camus, E.; Groene, O.; de Guzman, E.N.; Pardo-Hernandez, H.; Sunol, R.; COMPAR-EU Group. Talking the same language on patient empowerment: Development and content validation of a taxonomy of self-management interventions for chronic conditions. Health Expect. 2021, 24, 1626–1638. [Google Scholar] [CrossRef]
- Pillay, J.; Armstrong, M.J.; Butalia, S.; Donovan, L.E.; Sigal, R.J.; Vandermeer, B.; Chordiya, P.; Dhakal, S.; Hartling, L.; Nuspl, M.; et al. Behavioral Programs for Type 2 Diabetes Mellitus. Ann. Intern. Med. 2015, 163, 848–860. [Google Scholar] [CrossRef] [PubMed]


| Subcategory | Main Category | #Studies | #Interventions |
|---|---|---|---|
| Basic empowerment measures | |||
| Self-management competences | Knowledge | 50 | 35 |
| Self-efficacy | 57 | 38 | |
| Adherence to Self-management behaviors | |||
| Self-management behaviors | 41 | 30 | |
| Adherence | 55 | 32 | |
| Foot care | 26 | 28 | |
| Glucose self-monitoring | 29 | 26 | |
| Dietary habits | 30 | 29 | |
| Consumption of fat | 14 | 12 | |
| Physical activity | 65 | 47 | |
| Clinical outcomes (and markers) | |||
| Glucose management | Glycated hemoglobin (HbA1c) | 461 | 97 |
| Weight management | Body mass index (BMI) | 230 | 76 |
| Waist size | 80 | 44 | |
| Weight | 143 | 60 | |
| Blood Pressure | Systolic blood pressure | 233 | 71 |
| Diastolic blood pressure | 211 | 68 | |
| Lipid profile | Low-density lipoprotein (LDL) cholesterol | 171 | 58 |
| High-density lipoprotein (HDL) cholesterol | 165 | 55 | |
| Triglycerides | 169 | 61 | |
| Total cholesterol | 176 | 68 | |
| Quality of life | |||
| Quality of life | 85 | 42 | |
| Psychological distress | 46 | 39 | |
| Outcome (N of Participants; N of Studies) | Anticipated Absolute Effect (95% CI) Difference | τ2 (Ι2) | Egger’s Test | Certainty * |
|---|---|---|---|---|
| HbA1c (N = 66,280; 386 RCTs) | MD 0.39% lower (0.45 lower to 0.34 lower) | 0.17 (99%) | <0.001 | ⨁◯◯◯ Very low |
| BMI (N = 33,574; 204 RCTs) | MD 0.28 kg/m2 lower (0.42 lower to 0.15 lower) | 0.51 (91%) | 0.03 | ⨁◯◯◯ Very low |
| LDL cholesterol (N = 25,580; 146 RCTs) | MD 1.78 mg/dL lower (3.02 lower to 0.53 lower) | 32.94 (90%) | 0.03 | ⨁◯◯◯ Very low |
| Outcome | Intensity | Number of Studies | MD [95% CI] | τ2 (Ι2) |
|---|---|---|---|---|
| HbA1c (%) | High | 134 | −0.40 [−0.47, −0.34] | 0.30 (89%) |
| Low | 246 | −0.36 [−0.43, −0.28] | 0.59 (99%) | |
| BMI (kg/m2) | High | 77 | −0.39 [−0.55, −0.23] | 0.50 (84%) |
| Low | 122 | −0.14 [−0.30, −0.02] | 0.67 (91%) | |
| LDL cholesterol (mg/dL) | High | 55 | −1.71 [−2.49, −0.92] | 1.08 (77%) |
| Low | 85 | −1.23 [−1.84, −0.62] | 1.17 (93%) |
| Treatment Comparison (Intervention vs. UC) | NMA Estimate MD [95% CI] (95% PI) | P-Score | % Direct Evidence |
|---|---|---|---|
| HbA1c (%) (461 studies, 97 interventions) | |||
| E + EB + SS + G | −1.42 [−2.02 −0.82] (−2.28, −0.57) | 0.98 | 0% |
| E + MT + EB | −0.78 [−1.00, −0.57] (−1.43, −0.14) | 0.87 | 71% |
| E + G + R | −0.91 [−1.80, −0.01] (−1.99, 0.18) | 0.83 | 0% |
| E + MT + P + G | −0.82 [−1.46, −0.18] (−1.71, 0.06) | 0.83 | 54% |
| MT + AB + R | −0.89 [−1.73, −0.04] (−1.93, 0.16) | 0.83 | 0% |
| E + AB + SS + P | −1.02 [−2.29, 0.25] (−2.43, 0.39) | 0.81 | 0% |
| E + SS + G | −0.69 [−1.04, −0.35] (−1.39, 0.00) | 0.81 | 96% |
| MT + R | −0.84 [−1.66, −0.02] (−1.86, 0.18) | 0.81 | 0% |
| Common within-network between-study variance τ2 = 0.09, Ι2 = 86.5% | |||
| Design-by-treatment interaction model for inconsistency X2 (d.f., p-value, τ2): 154.58 (128, 0.05, 0.32) | |||
| BMI (kg/m2) (230 studies, 76 interventions) | |||
| E + AB + EB + SS | −1.88 [−2.89, −0.88] (−3.26, −0.51) | 0.93 | 100% |
| E + MT + P + G | −1.70 [−3.03, −0.37] (−3.33, −0.07) | 0.90 | 100% |
| E + MT + EB + SS + G | −2.40 [−5.34, 0.54] (−5.50, 0.70) | 0.89 | 100% |
| E + MT + AB + EB + R | −1.28 [−1.88, −0.68] (−2.39, −0.16) | 0.87 | 88% |
| E + SD | −2.10 [−4.90, 0.70] (−5.07, 0.87) | 0.86 | 100% |
| E + MT + AB + SD + P | −1.83 [−4.40, 0.74] (−4.58, 0.92) | 0.84 | 76% |
| E + SS + G | −1.08 [−1.94, −0.22] (−2.35, 0.19) | 0.82 | 100% |
| AB + EB | −2.80 [−8.43, 2.83] (−8.54, 2.94) | 0.80 | 100% |
| Common within-network between-study variance τ2 = 0.22, Ι2 = 61.1% | |||
| Design-by-treatment interaction model for inconsistency X2 (d.f., p-value, τ2): 86.19 (64, 0.03, 0.44) | |||
| LDL cholesterol (mg/dL) (171 studies, 58 interventions) | |||
| E + MT + SS + P | −35.10 [−42.35, −27.84] (−42.75, −27.44) | 1 | 0% |
| E + MT + SS + R | −16.63 [−21.72, −11.54] (−22.24, −11.03) | 0.95 | 0% |
| E + AB + SD | −15.47 [−25.71, −5.23] (−26.05, −4.89) | 0.92 | 100% |
| E + MT + AB + SS + R | −14.99 [−27.66, −2.32] (−27.98, −2.01) | 0.89 | 0% |
| E + AB + EB + P | −11.44 [−14.58, −8.30] (−15.32, −7.57) | 0.88 | 88% |
| E + MT + G | −16.70 [−34.60, 1.20] (−34.91, 1.51) | 0.88 | 100% |
| E + EB + SS + G | −11.93 [−19.74, −4.12] (−20.13, −3.73) | 0.87 | 0% |
| E + R | −10.50 [−17.66, −3.33] (−18.07, −2.92) | 0.84 | 0% |
| E + MT + AB + SD | −8.77 [−11.05, −6.49] (−11.98, −5.56) | 0.82 | 100% |
| Common within-network between-study variance τ2 = 1.27, Ι2 = 70.8% | |||
| Design-by-treatment interaction model for inconsistency X2 (d.f., p-value, τ2): 104.97 (46, <0.001, 2.07) | |||
| Outcome | HbA1c (%) | BMI (kg/m2) | LDL Cholesterol (mg/dL) |
|---|---|---|---|
| Component | MD [95% CI] | ||
| AB | 0.00 [−0.08, 0.08] | −0.21 [−0.47, 0.05] | −0.47 [−1.74, 0.80] |
| E | −0.25 [−0.34, −0.16] | −0.13 [−0.44, 0.18] | −1.84 [−3.46, −0.23] |
| EB | −0.02 [−0.10, 0.05] | −0.07 [−0.31, 0.18] | 2.19 [1.06, 3.32] |
| G | −0.06 [−0.17, 0.04] | 0.01 [−0.29, 0.30] | −0.05 [−1.54, 1.44] |
| MT | −0.14 [−0.22, −0.06] | −0.03 [−0.29, 0.24] | 0.63 [−0.82, 2.08] |
| P | 0.12 [0.00, 0.24] | 0.11 [−0.22, 0.44] | −4.09 [−6.19, −1.98] |
| R | −0.02 [−0.11, 0.08] | 0.01 [−0.34, 0.36] | −2.76 [−4.17, −1.36] |
| SD | 0.03 [−0.13, 0.19] | 0.41 [−0.15, 0.98] | −4.06 [−6.30, −1.81] |
| SS | −0.06 [−0.16, 0.03] | 0.05 [−0.24, 0.35] | 1.19 [−0.44, 2.82] |
| UCP | 0.00 [−0.12, 0.13] | 0.12 [−0.28, 0.52] | −1.16 [−3.06, 0.75] |
| Common within-network between-study variance | τ2 = 0.13; Ι2 = 94.4% | τ2 = 0.48; Ι2 = 87.1% | τ2 = 2.61; Ι2 = 81.3% |
Disclaimer/Publisher’s Note: The statements, opinions and data contained in all publications are solely those of the individual author(s) and contributor(s) and not of MDPI and/or the editor(s). MDPI and/or the editor(s) disclaim responsibility for any injury to people or property resulting from any ideas, methods, instructions or products referred to in the content. |
© 2023 by the authors. Licensee MDPI, Basel, Switzerland. This article is an open access article distributed under the terms and conditions of the Creative Commons Attribution (CC BY) license (https://creativecommons.org/licenses/by/4.0/).
Share and Cite
Tsokani, S.; Seitidis, G.; Christogiannis, C.; Kontouli, K.-M.; Nikolakopoulos, S.; Zevgiti, S.; Orrego, C.; Ballester, M.; Suñol, R.; Heijmans, M.; et al. Exploring the Effectiveness of Self-Management Interventions in Type 2 Diabetes: A Systematic Review and Network Meta-Analysis. Healthcare 2024, 12, 27. https://doi.org/10.3390/healthcare12010027
Tsokani S, Seitidis G, Christogiannis C, Kontouli K-M, Nikolakopoulos S, Zevgiti S, Orrego C, Ballester M, Suñol R, Heijmans M, et al. Exploring the Effectiveness of Self-Management Interventions in Type 2 Diabetes: A Systematic Review and Network Meta-Analysis. Healthcare. 2024; 12(1):27. https://doi.org/10.3390/healthcare12010027
Chicago/Turabian StyleTsokani, Sofia, Georgios Seitidis, Christos Christogiannis, Katerina-Maria Kontouli, Stavros Nikolakopoulos, Stella Zevgiti, Carola Orrego, Marta Ballester, Rosa Suñol, Monique Heijmans, and et al. 2024. "Exploring the Effectiveness of Self-Management Interventions in Type 2 Diabetes: A Systematic Review and Network Meta-Analysis" Healthcare 12, no. 1: 27. https://doi.org/10.3390/healthcare12010027
APA StyleTsokani, S., Seitidis, G., Christogiannis, C., Kontouli, K.-M., Nikolakopoulos, S., Zevgiti, S., Orrego, C., Ballester, M., Suñol, R., Heijmans, M., Poortvliet, R., van der Gaag, M., Alonso-Coello, P., Canelo-Aybar, C., Beltran, J., González-González, A. I., de Graaf, G., Veroniki, A.-A., & Mavridis, D. (2024). Exploring the Effectiveness of Self-Management Interventions in Type 2 Diabetes: A Systematic Review and Network Meta-Analysis. Healthcare, 12(1), 27. https://doi.org/10.3390/healthcare12010027