
Validation of the Barthel Index as a Predictor of In-Hospital Mortality among COVID-19 Patients

 ,
,  ,
,  ,
,
Abstract
1. Introduction
2. Materials and Methods
2.1. Study Design
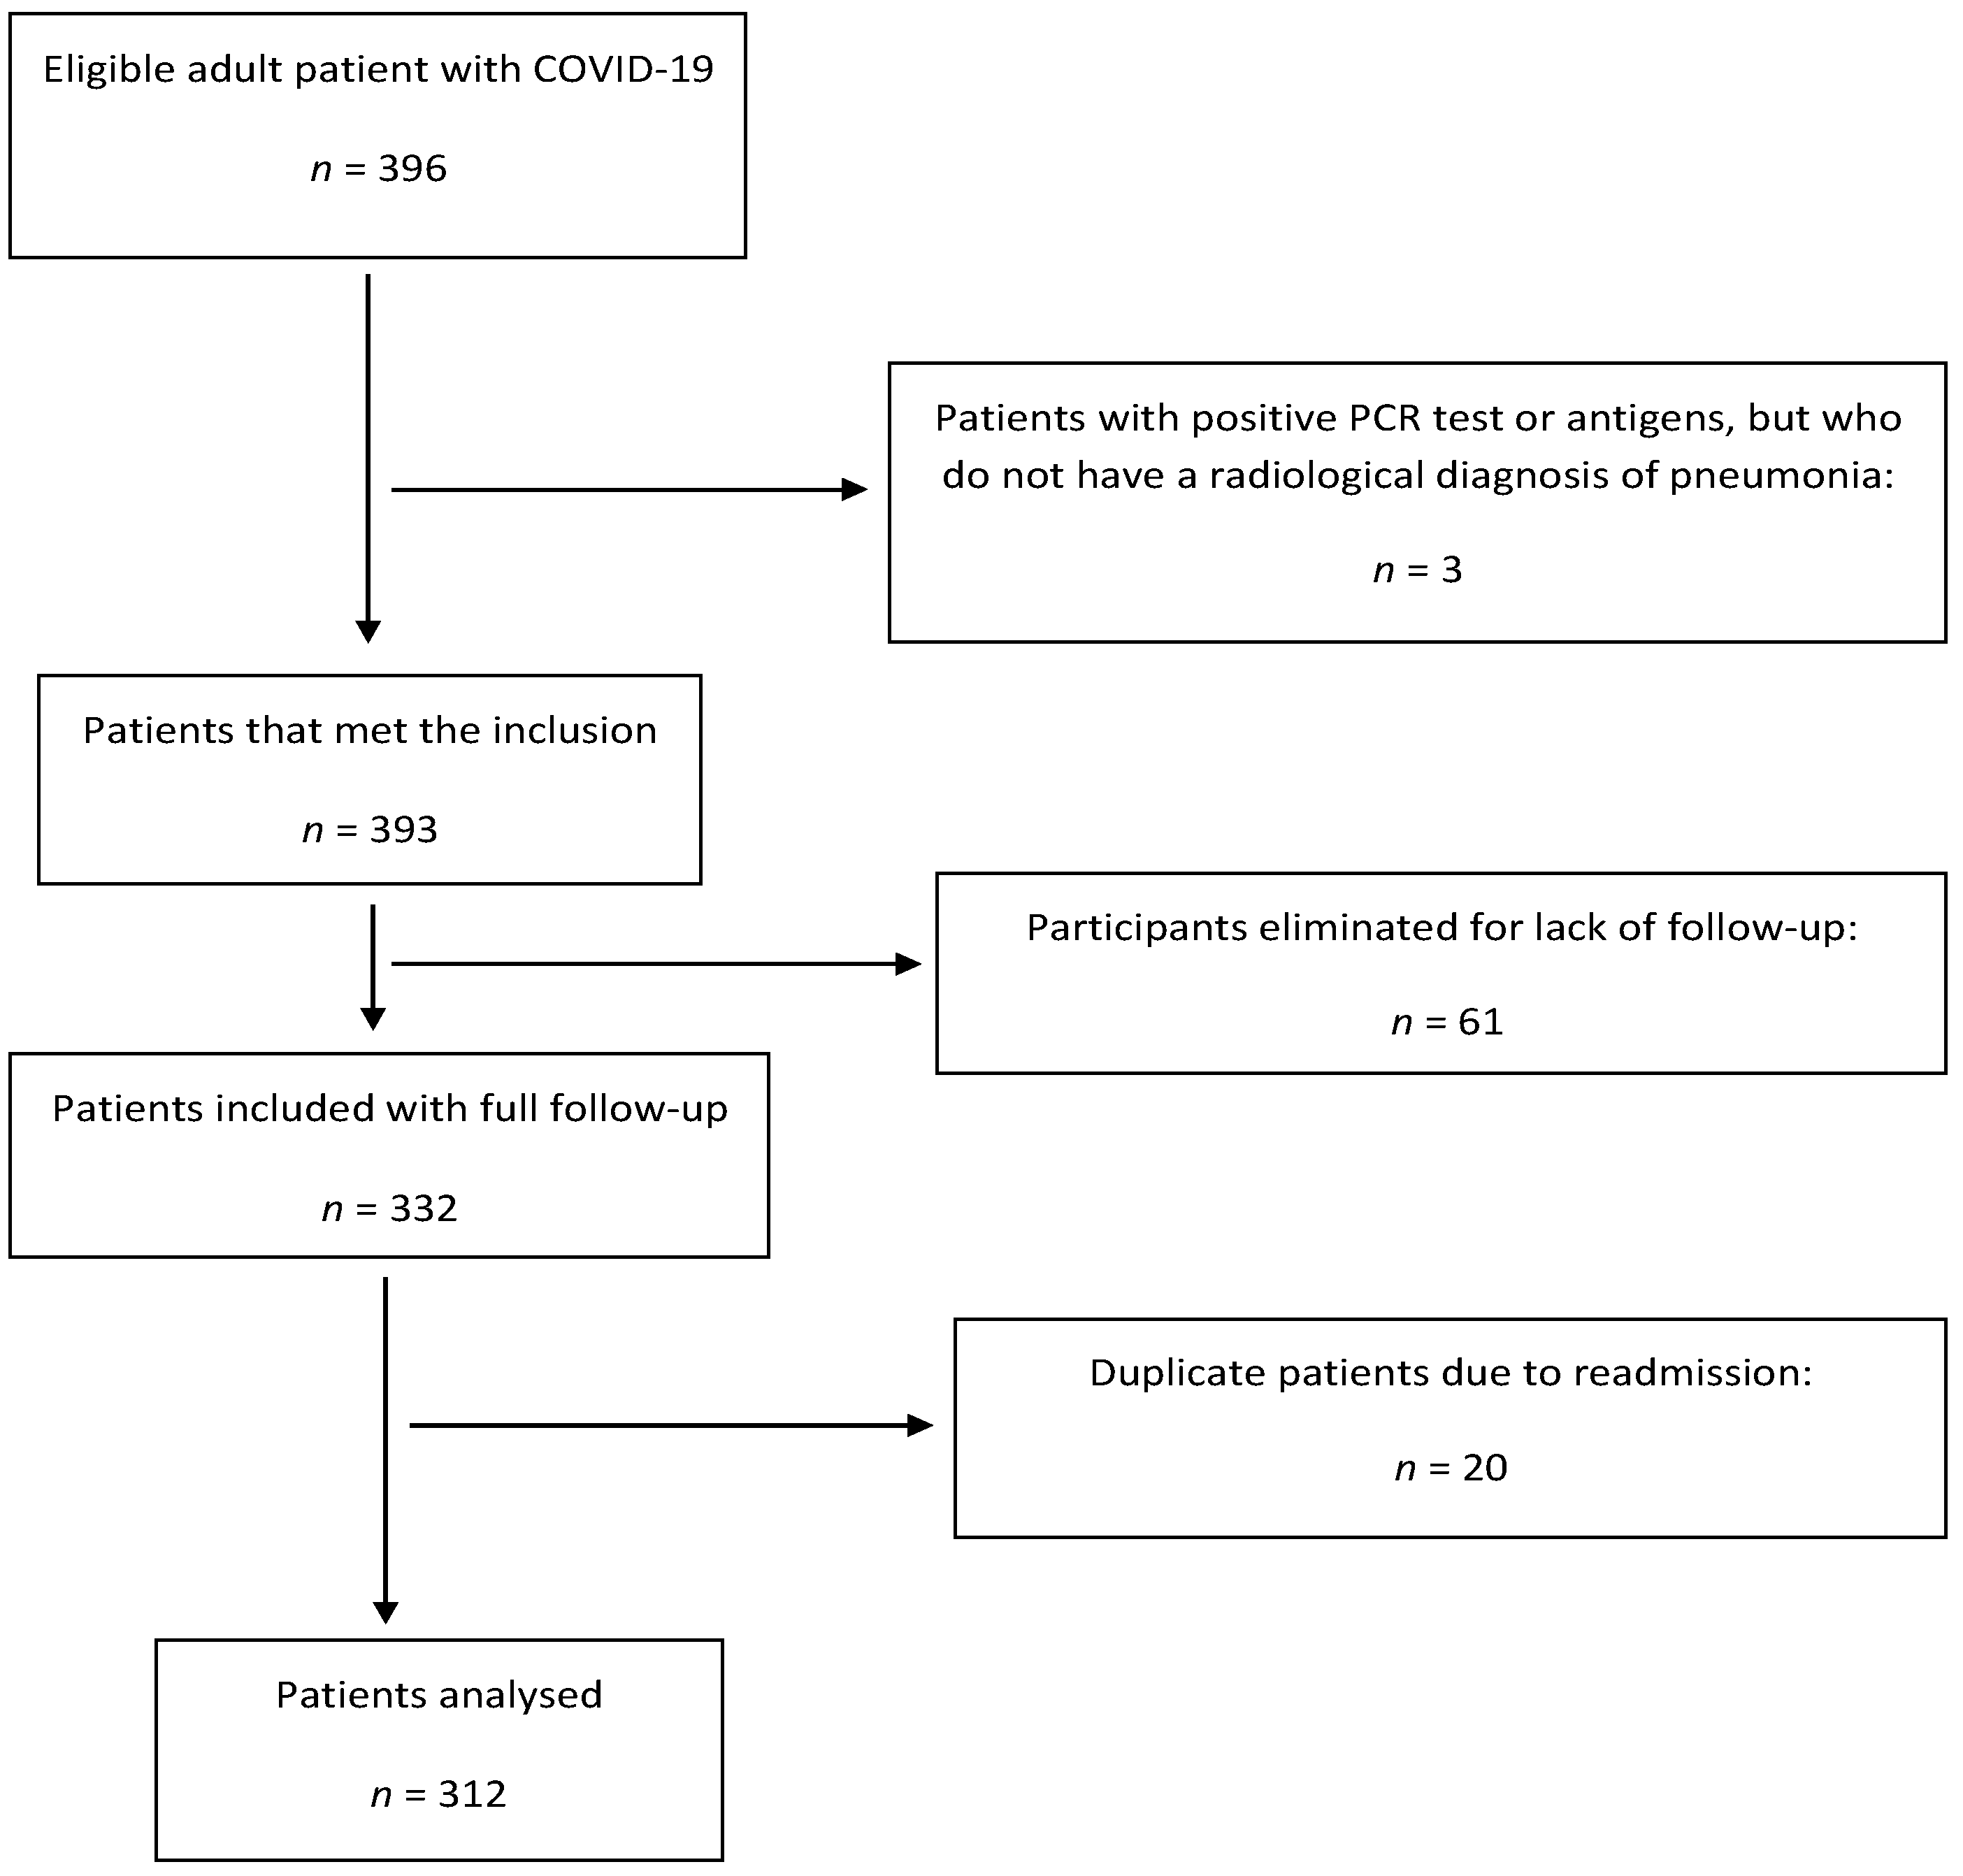
2.2. Sample/Participants
2.3. Data Collection
2.3.1. Primary Outcome
2.3.2. Secondary Outcome
2.3.3. Variables
2.4. Ethical Considerations
2.5. Data Analysis
2.6. Validity and Reliability/Rigour
3. Results
3.1. Patient Characteristics
3.2. Primary Outcome
3.3. Secondary Outcome
4. Discussion
4.1. Sample Characteristics
4.2. The BI as a Predictor of In-Hospital Mortality among COVID-19 Patients
4.3. Adjusting the BI for Prediction of In-Hospital Mortality Due to COVID-19
4.4. AUC, Sensitivity and Specificity of Models
4.5. The BI as a Screening Tool and Its Relationship with Other Prediction Models
5. Limitations
6. Conclusions
Author Contributions
Funding
Institutional Review Board Statement
Informed Consent Statement
Data Availability Statement
Acknowledgments
Conflicts of Interest
References
- Lu, H.; Stratton, C.W.; Tang, Y.W. Outbreak of pneumonia of unknown etiology in Wuhan, China: The mystery and the miracle. J. Med. Virol. 2020, 92, 401–402. [Google Scholar] [CrossRef] [PubMed]
- World Health Organization. Archived: WHO Timeline—COVID-19. 2021. Available online: https://www.who.int/news/item/27-04-2020-who-timeline---covid-19 (accessed on 6 March 2023).
- Adhanom Ghebreyesus, T. WHO Director-General’s Opening Remarks at the Media Briefing on COVID-19—11 March 2020. World Health Organization. 2020. Available online: https://www.who.int/director-general/speeches/detail/who-director-general-s-opening-remarks-at-the-media-briefing-on-covid-19---11-march-2020 (accessed on 6 March 2023).
- PAHO/WHO. Epidemiological Update: Coronavirus Disease (COVID-19). 2021. Available online: https://iris.paho.org/bitstream/handle/10665.2/54717/EpiUpdate21August2021_eng.pdf?sequence=1&isAllowed=y (accessed on 6 March 2023).
- World Health Organization. COVID-19—China. 2020. Available online: https://www.who.int/emergencies/disease-outbreak-news/item/2020-DON233 (accessed on 6 March 2023).
- Guan, W.J.; Ni, Z.Y.; Hu, Y.; Liang, W.H.; Ou, C.Q.; He, J.X.; Liu, L.; Shan, H.; Lei, C.L.; Hui, D.S.C.; et al. Clinical characteristics of Coronavirus disease 2019 in China. N. Engl. J. Med. 2020, 382, 1708–1720. [Google Scholar] [CrossRef] [PubMed]
- Zheng, Z.; Peng, F.; Xu, B.; Zhao, J.; Liu, H.; Peng, J.; Li, Q.; Jiang, C.; Zhou, Y.; Liu, S.; et al. Risk factors of critical & mortal COVID-19 cases: A systematic literature review and meta-analysis. J. Infect. 2020, 81, e16–e25. [Google Scholar] [CrossRef]
- Fan, G.; Tu, C.; Zhou, F.; Liu, Z.; Wang, Y.; Song, B.; Gu, X.; Wang, Y.; Wei, Y.; Li, H.; et al. Comparison of severity scores for COVID-19 patients with pneumonia: A retrospective study. Eur. Respir. J. 2020, 56, 2002113. [Google Scholar] [CrossRef]
- Fine, M.J.; Auble, T.E.; Yealy, D.M.; Hanusa, B.H.; Weissfeld, L.A.; Singer, D.E.; Coley, C.M.; Marrie, T.J.; Kapoor, W.N. A prediction rule to identify low-risk patients with community-acquired pneumonia. N. Engl. J. Med. 1997, 336, 243–250. [Google Scholar] [CrossRef]
- Lim, W.S.; van der Eerden, M.M.; Laing, R.; Boersma, W.G.; Karalus, N.; Town, G.I.; Lewis, S.A.; Macfarlane, J.T. Defining community acquired pneumonia severity on presentation to hospital: An international derivation and validation study. Thorax 2003, 58, 377–382. [Google Scholar] [CrossRef] [PubMed]
- Miyashita, N.; Matsushima, T.; Oka, M.; Japanese Respiratory Society. The JRS guidelines for the management of community-acquired pneumonia in adults: An update and new recommendations. Intern. Med. 2006, 45, 419–428. [Google Scholar] [CrossRef]
- Klanidhi, K.B.; Chakrawarty, A.; Bhadouria, S.S.; George, S.M.; Sharma, G.; Chatterjee, P.; Kumar, V.; Vig, S.; Gupta, N.; Singh, V.; et al. Six-minute walk test and its predictability in outcome of COVID-19 patients. J. Educ. Health Promot. 2022, 11, 58. [Google Scholar]
- Bhaskar, S.; Bradley, S.; Chattu, V.K.; Adisesh, A.; Nurtazina, A.; Kyrykbayeva, S.; Sakhamuri, S.; Moguilner, S.; Pandya, S.; Schroeder, S.; et al. Telemedicine as the new outpatient clinic gone digital: Position paper from the pandemic health system REsilience PROGRAM (REPROGRAM) International Consortium (Part 2). Front. Public Health 2020, 8, 410. [Google Scholar] [CrossRef]
- Hewitt, J.; Carter, B.; Vilches-Moraga, A.; Quinn, T.J.; Braude, P.; Verduri, A.; Pearce, L.; Stechman, M.; Short, R.; Price, A.; et al. The effect of frailty on survival in patients with COVID-19 (COPE): A multicentre, European, observational cohort study. Lancet Public Health 2020, 5, e444–e451. [Google Scholar] [CrossRef]
- Mahoney, F.I.; Barthel, D.W. Functional evaluation: The Barthel Index. Md. State Med. J. 1965, 14, 61–65. [Google Scholar] [PubMed]
- Cid-Ruzafa, J.; Damián-Moreno, J. Disability evaluation: Barthel’s index. Rev. Esp. Salud Publica 1997, 71, 27–137. [Google Scholar]
- Matzen, L.E.; Jepsen, D.B.; Ryg, J.; Masud, T. Functional level at admission is a predictor of survival in older patients admitted to an acute geriatric unit. BMC Geriatr. 2012, 12, 32. [Google Scholar] [CrossRef] [PubMed]
- Murcia, J.; Llorens, P.; Sánchez-Payá, J.; Reus, S.; Boix, V.; Merino, E.; Laghzaoui, F.; Portilla, J. Functional status determined by Barthel Index predicts community acquired pneumonia mortality in general population. J. Infect. 2010, 61, 458–464. [Google Scholar] [CrossRef] [PubMed]
- Sanz, F.; Morales-Suárez-Varela, M.; Fernández, E.; Force, L.; Pérez-Lozano, M.J.; Martín, V.; Egurrola, M.; Castilla, J.; Astray, J.; Toledo, D.; et al. A composite of functional status and pneumonia severity index Improves the prediction of pneumonia mortality in older patients. J. Gen. Intern. Med. 2018, 33, 437–444. [Google Scholar] [CrossRef]
- Casas-Rojo, J.M.; Antón-Santos, J.M.; Millán-Núñez-Cortés, J.; Lumbreras-Bermejo, C.; Ramos-Rincón, J.M.; Roy-Vallejo, E.; Artero-Mora, A.; Arnalich-Fernández, F.; García-Bruñén, J.M.; Vargas-Núñez, J.A.; et al. Clinical characteristics of patients hospitalized with COVID-19 in Spain: Results from the SEMI-COVID-19 Registry. Rev. Clin. Esp. 2020, 220, 480–494. [Google Scholar] [CrossRef]
- Shah, S.; Vanclay, F.; Cooper, B. Improving the sensitivity of the Barthel Index for stroke rehabilitation. J. Clin. Epidemiol. 1989, 42, 703–709. [Google Scholar] [CrossRef]
- Collin, C.; Wade, D.T.; Davies, S.; Horne, V. The Barthel ADL Index: A reliability study. Int. Disabil. Stud. 1988, 10, 61–63. [Google Scholar] [CrossRef]
- Youden, W.J. Index for Rating Diagnostic Tests. Cancer 1950, 3, 32–35. [Google Scholar] [CrossRef]
- Laosa, O.; Pedraza, L.; Álvarez-Bustos, A.; Carnicero, J.A.; Rodriguez-Artalejo, F.; Rodriguez-Mañas, L. Rapid assessment at hospital admission of mortality risk from COVID-19: The role of functional status. J. Am. Med. Dir. Assoc. 2020, 21, 1798–1802.e2. [Google Scholar] [CrossRef]
- Docherty, A.B.; Harrison, E.M.; Green, C.A.; Hardwick, H.E.; Pius, R.; Norman, L.; Holden, K.A.; Read, J.M.; Dondelinger, F.; Carson, G.; et al. Features of 20 133 UK patients in hospital with covid-19 using the ISARIC WHO clinical characterisation protocol: Prospective observational cohort study. BMJ 2020, 369, m1985. [Google Scholar] [CrossRef] [PubMed]
- Richardson, S.; Hirsch, J.S.; Narasimhan, M.; Crawford, J.M.; McGinn, T.; Davidson, K.W.; Barnaby, D.P.; Becker, L.B.; Chelico, J.D.; Cohen, S.L.; et al. Presenting characteristics, comorbidities, and outcomes among 5700 patients hospitalized with COVID-19 in the New York City Area. JAMA 2020, 323, 2052–2059. [Google Scholar] [CrossRef] [PubMed]
- Onder, G.; Rezza, G.; Brusaferro, S. Case-fatality rate and characteristics of patients dying in relation to COVID-19 in Italy. JAMA 2020, 323, 1775–1776. [Google Scholar] [CrossRef]
- Her, A.Y.; Bhak, Y.; Jun, E.J.; Yuan, S.L.; Garg, S.; Lee, S.; Bhak, J.; Shin, E.S. Sex-specific difference of in-hospital mortality from COVID-19 in South Korea. PLoS ONE 2022, 17, e0262861. [Google Scholar] [CrossRef] [PubMed]
- Fernández-Martínez, N.F.; Ortiz-González-Serna, R.; Serrano-Ortiz, Á.; Rivera-Izquierdo, M.; Ruiz-Montero, R.; Pérez-Contreras, M.; Guerrero-Fernández de Alba, I.; Romero-Duarte, Á.; Salcedo-Leal, I. Sex Differences and Predictors of In-Hospital Mortality among Patients with COVID-19: Results from the ANCOHVID Multicentre Study. Int. J. Environ. Res. Public Health 2021, 18, 9018. [Google Scholar] [CrossRef] [PubMed]
- Maximiano-Sousa, F.; Roelens, M.; Fricker, B.; Thiabaud, A.; Iten, A.; Cusini, A.; Flury, D.; Buettcher, M.; Zukol, F.; Balmelli, C.; et al. Risk factors for severe outcomes for COVID-19 patients hospitalised in Switzerland during the first pandemic wave, February to August 2020: Prospective observational cohort study. Swiss Med. Wkly. 2021, 151, w20547. [Google Scholar] [CrossRef]
- Henkens, M.T.H.M.; Raafs, A.G.; Verdonschot, J.A.J.; Linschoten, M.; van Smeden, M.; Wang, P.; van der Hooft, B.H.M.; Tieleman, R.; Janssen, M.L.F.; Ter Bekke, R.M.A.; et al. Age is the main determinant of COVID-19 related in-hospital mortality with minimal impact of pre-existing comorbidities, a retrospective cohort study. BMC Geriatr. 2022, 22, 184. [Google Scholar] [CrossRef]
- Wang, H.; Paulson, K.R.; Pease, S.A.; Watson, S.; Comfort, H.; Zheng, P.; Aravkin, A.Y.; Bisignano, C.; Barber, R.M.; Alam, T.; et al. Estimating Excess Mortality Due to the COVID-19 Pandemic: A Systematic Analysis of COVID-19-Related Mortality, 2020–2021. Lancet 2022, 399, 1513–1536. [Google Scholar] [CrossRef]
- Swets, J.A. Measuring the accuracy of diagnostic systems. Science 1988, 240, 1285–1293. [Google Scholar] [CrossRef]
- Asuzu, D.; Nyström, K.; Schindler, J.; Wira, C.; Greer, D.; Halliday, J.; Sheth, K.N. TURN Score Predicts 90-day Outcome in Acute Ischemic Stroke Patients After IV Thrombolysis. Neurocrit. Care 2015, 23, 172–178. [Google Scholar] [CrossRef]
- Musa, K.I.; Keegan, T.J. The change of Barthel Index scores from the time of discharge until 3-month post-discharge among acute stroke patients in Malaysia: A random intercept model. PLoS ONE 2018, 13, e0208594. [Google Scholar] [CrossRef] [PubMed]
- Cabañero-Martínez, M.J.; Cabrero-García, J.; Richart-Martínez, M.; Muñoz-Mendoza, C.L. The Spanish versions of the Barthel index (BI) and the Katz index (KI) of activities of daily living (ADL): A structured review. Arch. Gerontol. Geriatr. 2009, 49, e77–e84. [Google Scholar] [CrossRef]
- Yang, M.; Ding, X.; Dong, B. The measurement of disability in the elderly: A systematic review of self-reported questionnaires. J. Am. Med. Dir. Assoc. 2014, 15, 150.e1–150.e9. [Google Scholar] [CrossRef]
- Wang, E.; Liu, A.; Wang, Z.; Shang, X.; Zhang, L.; Jin, Y.; Ma, Y.; Zhang, L.; Bai, T.; Song, J.; et al. The prognostic value of the Barthel Index for mortality in patients with COVID-19: A cross-sectional study. Front. Public Health 2023, 10, 978237. [Google Scholar] [CrossRef]
- da Costa, J.C.; Manso, M.C.; Gregório, S.; Leite, M.; Pinto, J.M. Barthel’s Index: A better predictor for COVID-19 mortality than comorbidities. Tuberc. Respir. Dis. 2022, 85, 349–357. [Google Scholar] [CrossRef]
- Fumagalli, C.; Ungar, A.; Rozzini, R.; Vannini, M.; Coccia, F.; Cesaroni, G.; Mazzeo, F.; D’Ettore, N.; Zocchi, C.; Tassetti, L.; et al. Predicting mortality risk in older hospitalized persons with COVID-19: A comparison of the COVID-19 mortality risk score with frailty and disability. J. Am. Med. Dir. Assoc. 2021, 22, 1588–1592.e1. [Google Scholar] [CrossRef] [PubMed]
- Satici, C.; Demirkol, M.A.; Sargin Altunok, E.; Gursoy, B.; Alkan, M.; Kamat, S.; Demirok, B.; Surmeli, C.D.; Calik, M.; Cavus, Z.; et al. Performance of pneumonia severity index and CURB-65 in predicting 30-day mortality in patients with COVID-19. Int. J. Infect. Dis. 2020, 98, 84–89. [Google Scholar] [CrossRef] [PubMed]
- García Clemente, M.M.; Herrero Huertas, J.; Fernández Fernández, A.; De La Escosura Muñoz, C.; Enríquez Rodríguez, A.I.; Pérez Martínez, L.; Gómez Mañas, S.; Iscar Urrutia, M.; López González, F.J.; Madrid Carbajal, C.; et al. Assessment of risk scores in COVID-19. Int. J. Clin. Pract. 2021, 75, e13705. [Google Scholar] [CrossRef] [PubMed]
- Artero, A.; Madrazo, M.; Fernández-Garcés, M.; Muiño Miguez, A.; González García, A.; Crestelo Vieitez, A.; García Guijarro, E.; Fonseca Aizpuru, E.M.; García Gómez, M.; Areses Manrique, M.; et al. Severity scores in COVID-19 pneumonia: A multicenter, retrospective, cohort study. J. Gen. Intern. Med. 2021, 36, 1338–1345. [Google Scholar] [CrossRef]
- Esteban Ronda, V.; Ruiz Alcaraz, S.; Ruiz Torregrosa, P.; Giménez Suau, M.; Nofuentes Pérez, E.; León Ramírez, J.M.; Andrés, M.; Moreno-Pérez, Ó.; Candela Blanes, A.; Gil Carbonell, J.; et al. Application of validated severity scores for pneumonia caused by SARS-CoV-2. Med. Clin. 2021, 157, 99–105. [Google Scholar] [CrossRef]


| Variables | Total (n = 312) | Survivors (n = 261) | Deaths (n = 51) | p |
|---|---|---|---|---|
| General | ||||
| Age in years, mean ± SD | 68.72 ± 15.87 | 66.63 ± 15.77 | 79.41 ± 11.57 | <0.001 f |
| Men, n (%) | 169 (54.2) | 137 (52.5) | 32 (62.7) | 0.170 g |
| Clinical history | ||||
| Charlson Index a, median [IR] | 1 [0–2] | 0 [0–1] | 1 [1–2] | <0.001 h |
| Nursing home resident, n (%) | 36 (11.5) | 20 (7.7) | 16 (31.4) | <0.001 g |
| Chronic diseases, n (%) b | ||||
| Hypertension | 168 (53.8) | 131 (50.2) | 37 (72.5) | 0.003 g |
| Cardiovascular disease | 87 (27.9) | 64 (24.5) | 23 (45.1) | 0.003 g |
| Diabetes | 73 (23.4) | 60 (23.0) | 13 (25.5) | 0.700 g |
| Dislipidaemia | 123 (39.4) | 98 (37.5) | 25 (49.0) | 0.120 g |
| Chronic obstructive pulmonary disease | 22 (7.1) | 21 (8.0) | 1 (2.0) | 0.145 g |
| Asthma | 39 (12.5) | 33 (12.6) | 6 (11.8) | 0.860 g |
| Active neoplasia | 14 (4.5) | 9 (3.4) | 5 (9.8) | 0.060 g |
| Liver disease | 9 (2.9) | 8 (3.1) | 1 (2.0) | 0.990 g |
| Nephropathy | 18 (5.8) | 12 (4.6) | 6 (11.8) | 0.910 g |
| Cerebrovascular disease | 29 (9.3) | 19 (7.3) | 10 (19.6) | 0.014 g |
| Clinical Variables on admission | ||||
| Temperature (°C), mean ± SD | 36.92 ± 0.96 | 36.91 ± 0.94 | 36.99 ± 1.10 | 0.600 f |
| Blood pressure (mmHg) | ||||
| Systolic, mean ± SD | 139.26 ± 27.32 | 138.33 ± 27.54 | 143.98 ± 25.92 | 0.180 f |
| Diastolic, mean ± SD | 77.36 ± 16.12 | 77.60 ± 16.80 | 76.00 ± 12.11 | 0.510 f |
| Heart rate (beats per minute), median [IR] | 92 [82–104] | 94 [82–104] | 87 [81–102] | 0.147 h |
| % Oxygen saturation, mean ± SD | 91.26 (5.93) | 91.82 (5.70) | 88.41 (6.26) | <0.001 g |
| Tachypnoea–RR ≥ 30, n (%) b | 71 (22.8) | 60 (23.0) | 11 (21.6) | 0.049 g |
| Pleural effusion, n (%) b | 17 (5.4) | 14 (5.4) | 3 (5.9) | 0.747 g |
| Patients with Confusion, n (%) c | 34 (10.9) | 23 (8.8) | 11 (21.6) | 0.007 g |
| Analytical values | ||||
| Lymphocytes (×10,000/µL), mean ± SD | 1.06 ± 0.88 | 1.09 ± 0.93 | 0.91 ± 0.59 | 0.180 f |
| Haematocrit %, mean ± SD | 39.80 ± 5.85 | 40.13 ± 5.70 | 38.13 ± 6.43 | 0.020 f |
| D-Dimer (ng/mL), mean ± SD d | 2892.04 ± 7559.34 | 2237.41 ± 4945.23 | 6537.18 ± 15,097.28 | 0.068 f |
| Glucose (mg/dL), mean ± SD | 154.15 ± 77.80 | 149.36 ± 64.92 | 178.67 ± 122.46 | 0.100 f |
| Urea (mg/dL), mean ± SD | 53.46 ± 38.73 | 48.07 ± 33.93 | 81.00 ± 49.18 | <0.001 f |
| Sodium (mmol/L), mean ± SD | 138.45 ± 4.90 | 138.37 ± 4.80 | 138.86 ± 5.40 | 0.510 f |
| Ferritin (ng/mL), mean ± SD e | 603.64 ± 558.20 | 584.98 ± 546.55 | 709.20 ± 617.92 | 0.230 f |
| C-Reactive Protein (mg/L), mean ± SD | 115.44 ± 165.38 | 112.29 ± 176.30 | 131.58 ± 90.37 | 0.450 f |
| pH (Arterial), mean ± SD | 7.46 ± 0.05 | 7.46 ± 0.48 | 7.46 ± 0.62 | 0.790 f |
| Arterial partial oxygen pressure pO2 (mmHg), mean ± SD | 68.68 ± 22.77 | 70.18 ± 23.46 | 61.17 ± 17.25 | 0.010 f |
| COVID-19 mortality risk indices | ||||
| Barthel index b, median [IR] | 100 [80–10] | 100 [90–100] | 75 [30–100] | <0.001 h |
| Independent (BI = 100) | 182 (58.3%) | 169 (92.9%) | 13 (7.1%) | <0.001 g |
| Slight dependence (BI = 91–99) | 19 (6.1%) | 17 (89.5%) | 2 (10.5%) | 0.479 g |
| Moderate dependence (BI = 61–90) | 44 (14.1%) | 32 (72.7%) | 12 (27.3%) | 0.035 g |
| Severe dependence (BI = 21–60) | 37 (11.9%) | 25 (67.6%) | 12 (32.4%) | 0.005 g |
| Total dependence (BI = 0–20) | 30 (9.6%) | 18 (60.0%) | 12 (40.0%) | <0.001 g |
| Pneumonia Severity Index (PSI), median [IR] | 84 [63–116] | 77 [61–105] | 122 [95–144] | <0.001 h |
| CURB-65, median [IR] | 2 [1–3] | 2 [1–2] | 2 [2–3] | 0.002 h |
| A-DROP, median [IR] | 1 [1–2] | 1 [0–2] | 2 [2–3] | <0.001 h |
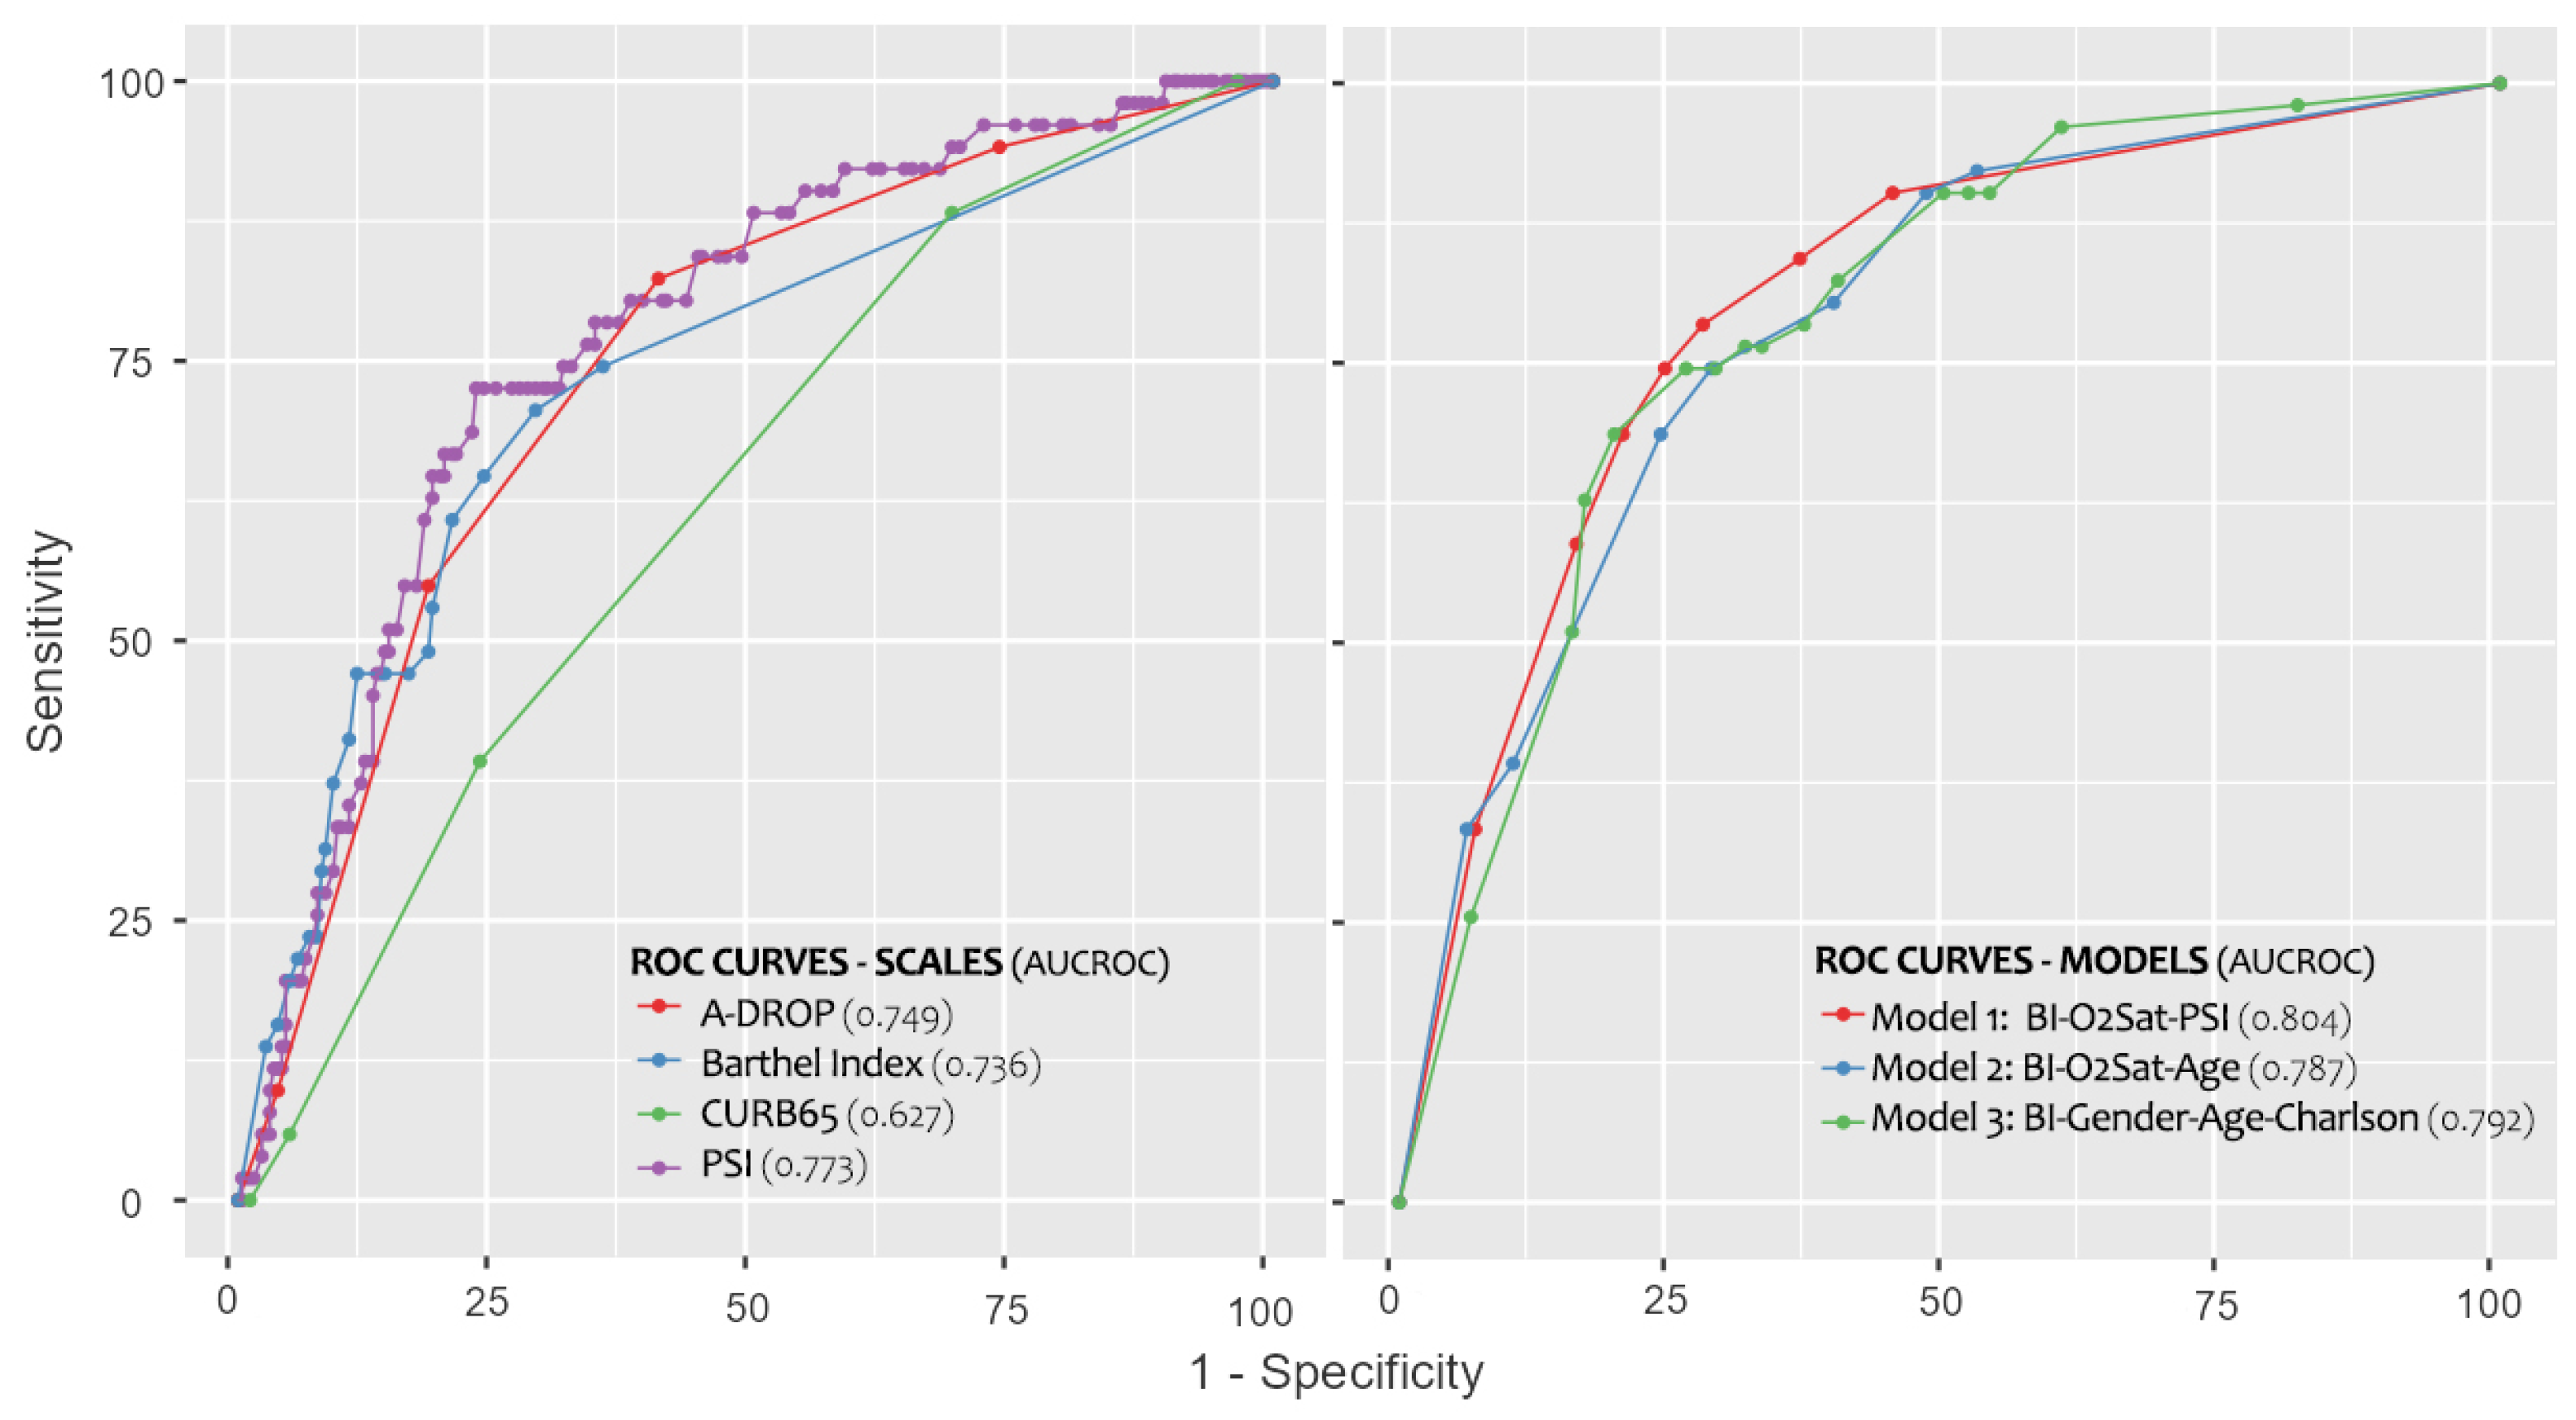
| Score | Cut-Off Point | AUC a (95% CI) | p | Sens b% (95% CI) | Spec c% (95% CI) | Correct Classification d% (95% CI) | LR+ e (95% CI) | LR− f (95% CI) | OR g (95% CI) |
|---|---|---|---|---|---|---|---|---|---|
| Barthel | 90 | 0.736 (0.657–0.816) | <0.001 | 70.6 (57–81) | 71.3 (65–76) | 71.2 (66–76) | 2.46 (1.89–3.19) | 0.41 (0.27–0.64) | 5.95 (3.08–11.51) |
| PSI h | 107 | 0.773 (0.705–0.840) | <0.001 | 72.5 (59–82) | 76.2 (71–81) | 75.6 (71–80) | 3.05 (2.32–4.02) | 0.36 (0.23–0.57) | 8.48 (4.31–16.71) |
| A-DROP | 2 | 0.749 (0.678–0.819) | <0.001 | 82.4 (70–90) | 59.4 (53–65) | 63.1 (58–68) | 2.03 (1.67–2.46) | 0.30 (0.16–0.55) | 6.82 (3.19–14.61) |
| CURB-65 | 2 | 0.627 (0.549–0.705) | 0.004 | 88.2 (77–94) | 31.0 (26–37) | 40.4 (36–46) | 1.28 (1.12–1.46) | 0.38 (0.17–0.82) | 3.38 (1.38–8.23) |
| Variable | Categories | Reference | p | OR a Exp (β) | 95% CI b OR Exp(β) | ||
|---|---|---|---|---|---|---|---|
| Lower | Upper | ||||||
| Model 1 | Barthel Index | >90 | Ref | ||||
| ≤90 | 0.012 | 2.65 | 1.24 | 5.66 | |||
| PSI c | <107 | Ref | |||||
| ≥107 | <0.001 | 4.20 | 1.93 | 9.15 | |||
| SatO2 | >90% | Ref | |||||
| ≤90% | 0.022 | 2.23 | 1.12 | 4.44 | |||
| Model 2 | Barthel Index | >90 | Ref | ||||
| ≤90 | 0.004 | 2.97 | 1.42 | 6.25 | |||
| Age | <75 years | Ref | |||||
| ≥75 years | 0.004 | 3.12 | 1.45 | 6.71 | |||
| SatO2 | >90% | Ref | |||||
| ≤90% | 0.001 | 3.06 | 1.57 | 5.95 | |||
| Model 3 | Barthel Index | >90 | Ref | ||||
| ≤90 | 0.001 | 3.44 | 1.62 | 7.32 | |||
| Gender | Women | Ref | |||||
| Men | 0.046 | 2.01 | 1.01 | 3.97 | |||
| Age | <75 years | Ref | |||||
| ≥75 years | 0.021 | 2.49 | 1.14 | 5.43 | |||
| Charlson Index | 0 | Ref | |||||
| ≥1 | 0.035 | 2.37 | 1.06 | 5.27 | |||
| Model | AUC a (95% CI) | p | Sens b% | Spec c% | Correct Classification d% | Hosmer Lesmeshow (p) |
|---|---|---|---|---|---|---|
| 1 | 0.804 (0.740–0.869) | <0.001 | 78.4% | 72.4% | 83.3% | 0.912 |
| 2 | 0.787 (0.721–0.853) | <0.001 | 74.5% | 71.6% | 84.0% | 0.724 |
| 3 | 0.792 (0.730–0.855) | <0.001 | 74.5% | 73.9% | 83.7% | 0.462 |
| Barthel | 0.736 (0.657–0.816) | <0.001 | 70.6% | 71.3% | 83.0% | - |
Disclaimer/Publisher’s Note: The statements, opinions and data contained in all publications are solely those of the individual author(s) and contributor(s) and not of MDPI and/or the editor(s). MDPI and/or the editor(s) disclaim responsibility for any injury to people or property resulting from any ideas, methods, instructions or products referred to in the content. |
© 2023 by the authors. Licensee MDPI, Basel, Switzerland. This article is an open access article distributed under the terms and conditions of the Creative Commons Attribution (CC BY) license (https://creativecommons.org/licenses/by/4.0/).
Share and Cite
Mateos-Arroyo, J.A.; Zaragoza-García, I.; Sánchez-Gómez, R.; Posada-Moreno, P.; Ortuño-Soriano, I. Validation of the Barthel Index as a Predictor of In-Hospital Mortality among COVID-19 Patients. Healthcare 2023, 11, 1338. https://doi.org/10.3390/healthcare11091338
Mateos-Arroyo JA, Zaragoza-García I, Sánchez-Gómez R, Posada-Moreno P, Ortuño-Soriano I. Validation of the Barthel Index as a Predictor of In-Hospital Mortality among COVID-19 Patients. Healthcare. 2023; 11(9):1338. https://doi.org/10.3390/healthcare11091338
Chicago/Turabian StyleMateos-Arroyo, Julio Alberto, Ignacio Zaragoza-García, Rubén Sánchez-Gómez, Paloma Posada-Moreno, and Ismael Ortuño-Soriano. 2023. "Validation of the Barthel Index as a Predictor of In-Hospital Mortality among COVID-19 Patients" Healthcare 11, no. 9: 1338. https://doi.org/10.3390/healthcare11091338
APA StyleMateos-Arroyo, J. A., Zaragoza-García, I., Sánchez-Gómez, R., Posada-Moreno, P., & Ortuño-Soriano, I. (2023). Validation of the Barthel Index as a Predictor of In-Hospital Mortality among COVID-19 Patients. Healthcare, 11(9), 1338. https://doi.org/10.3390/healthcare11091338