
Dynamic Trends in Sociodemographic Disparities and COVID-19 Morbidity and Mortality—A Nationwide Study during Two Years of a Pandemic

Abstract
1. Introduction
2. Methods
2.1. Data Collection
2.2. Data Analysis
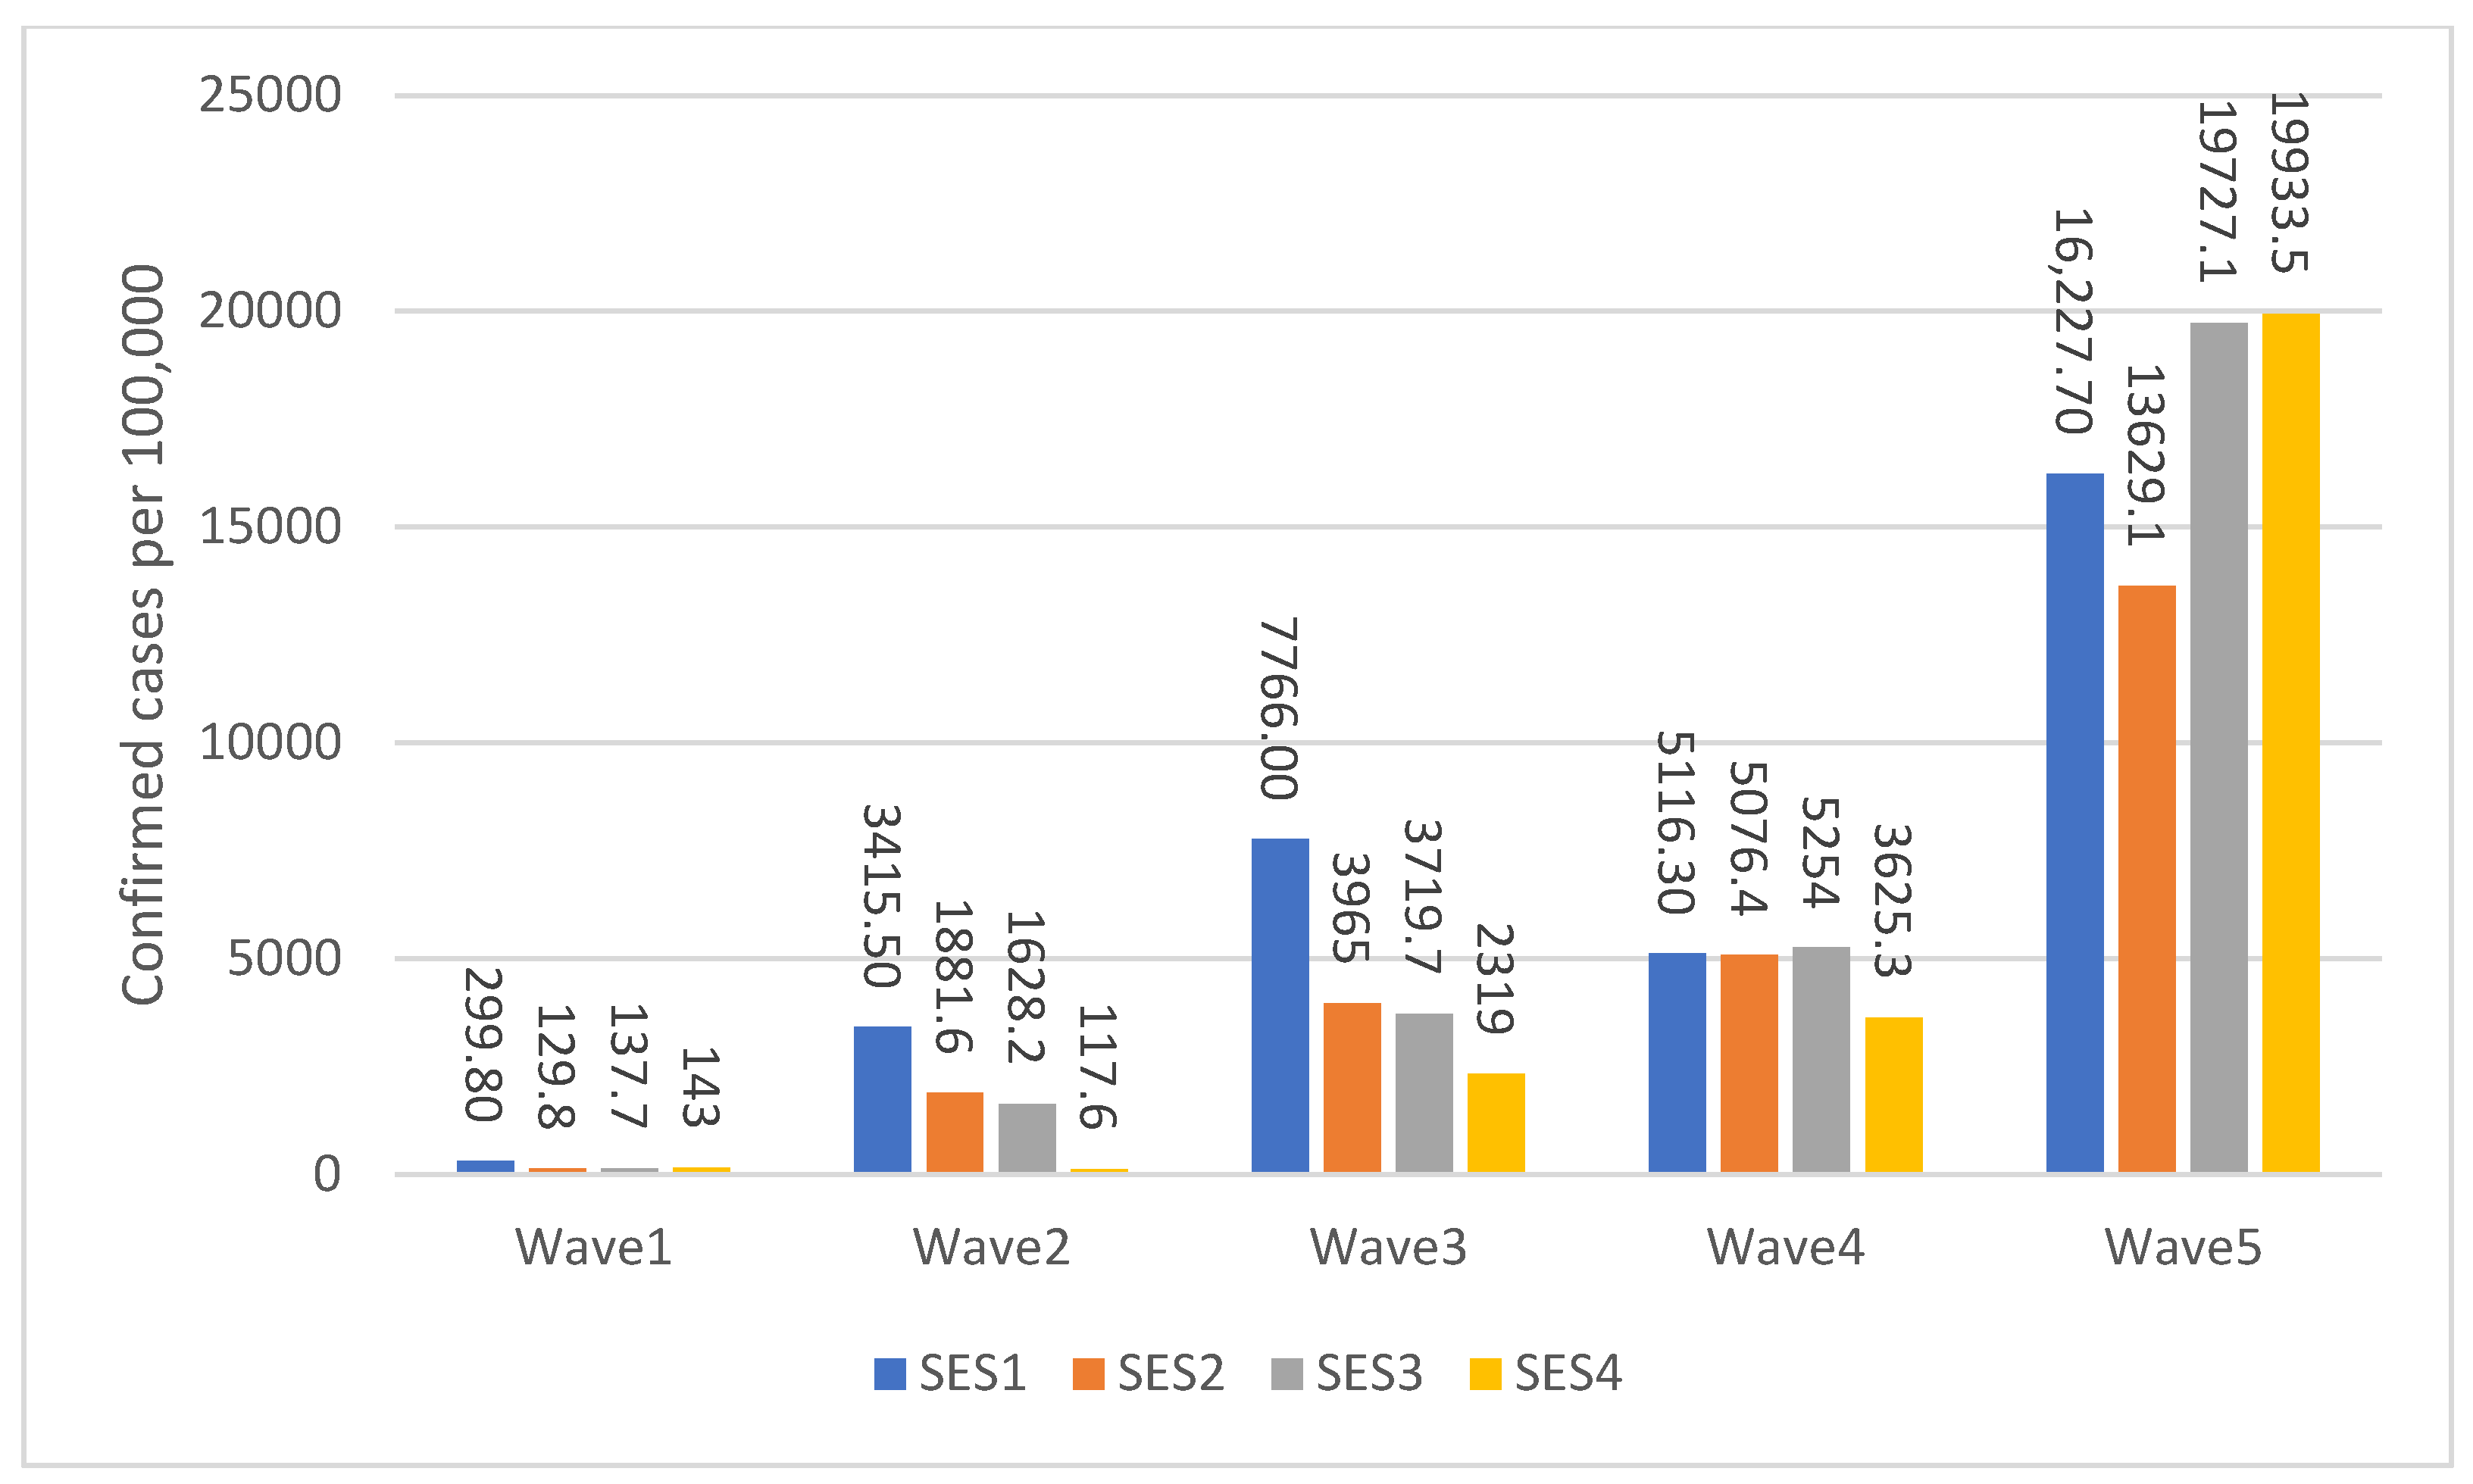
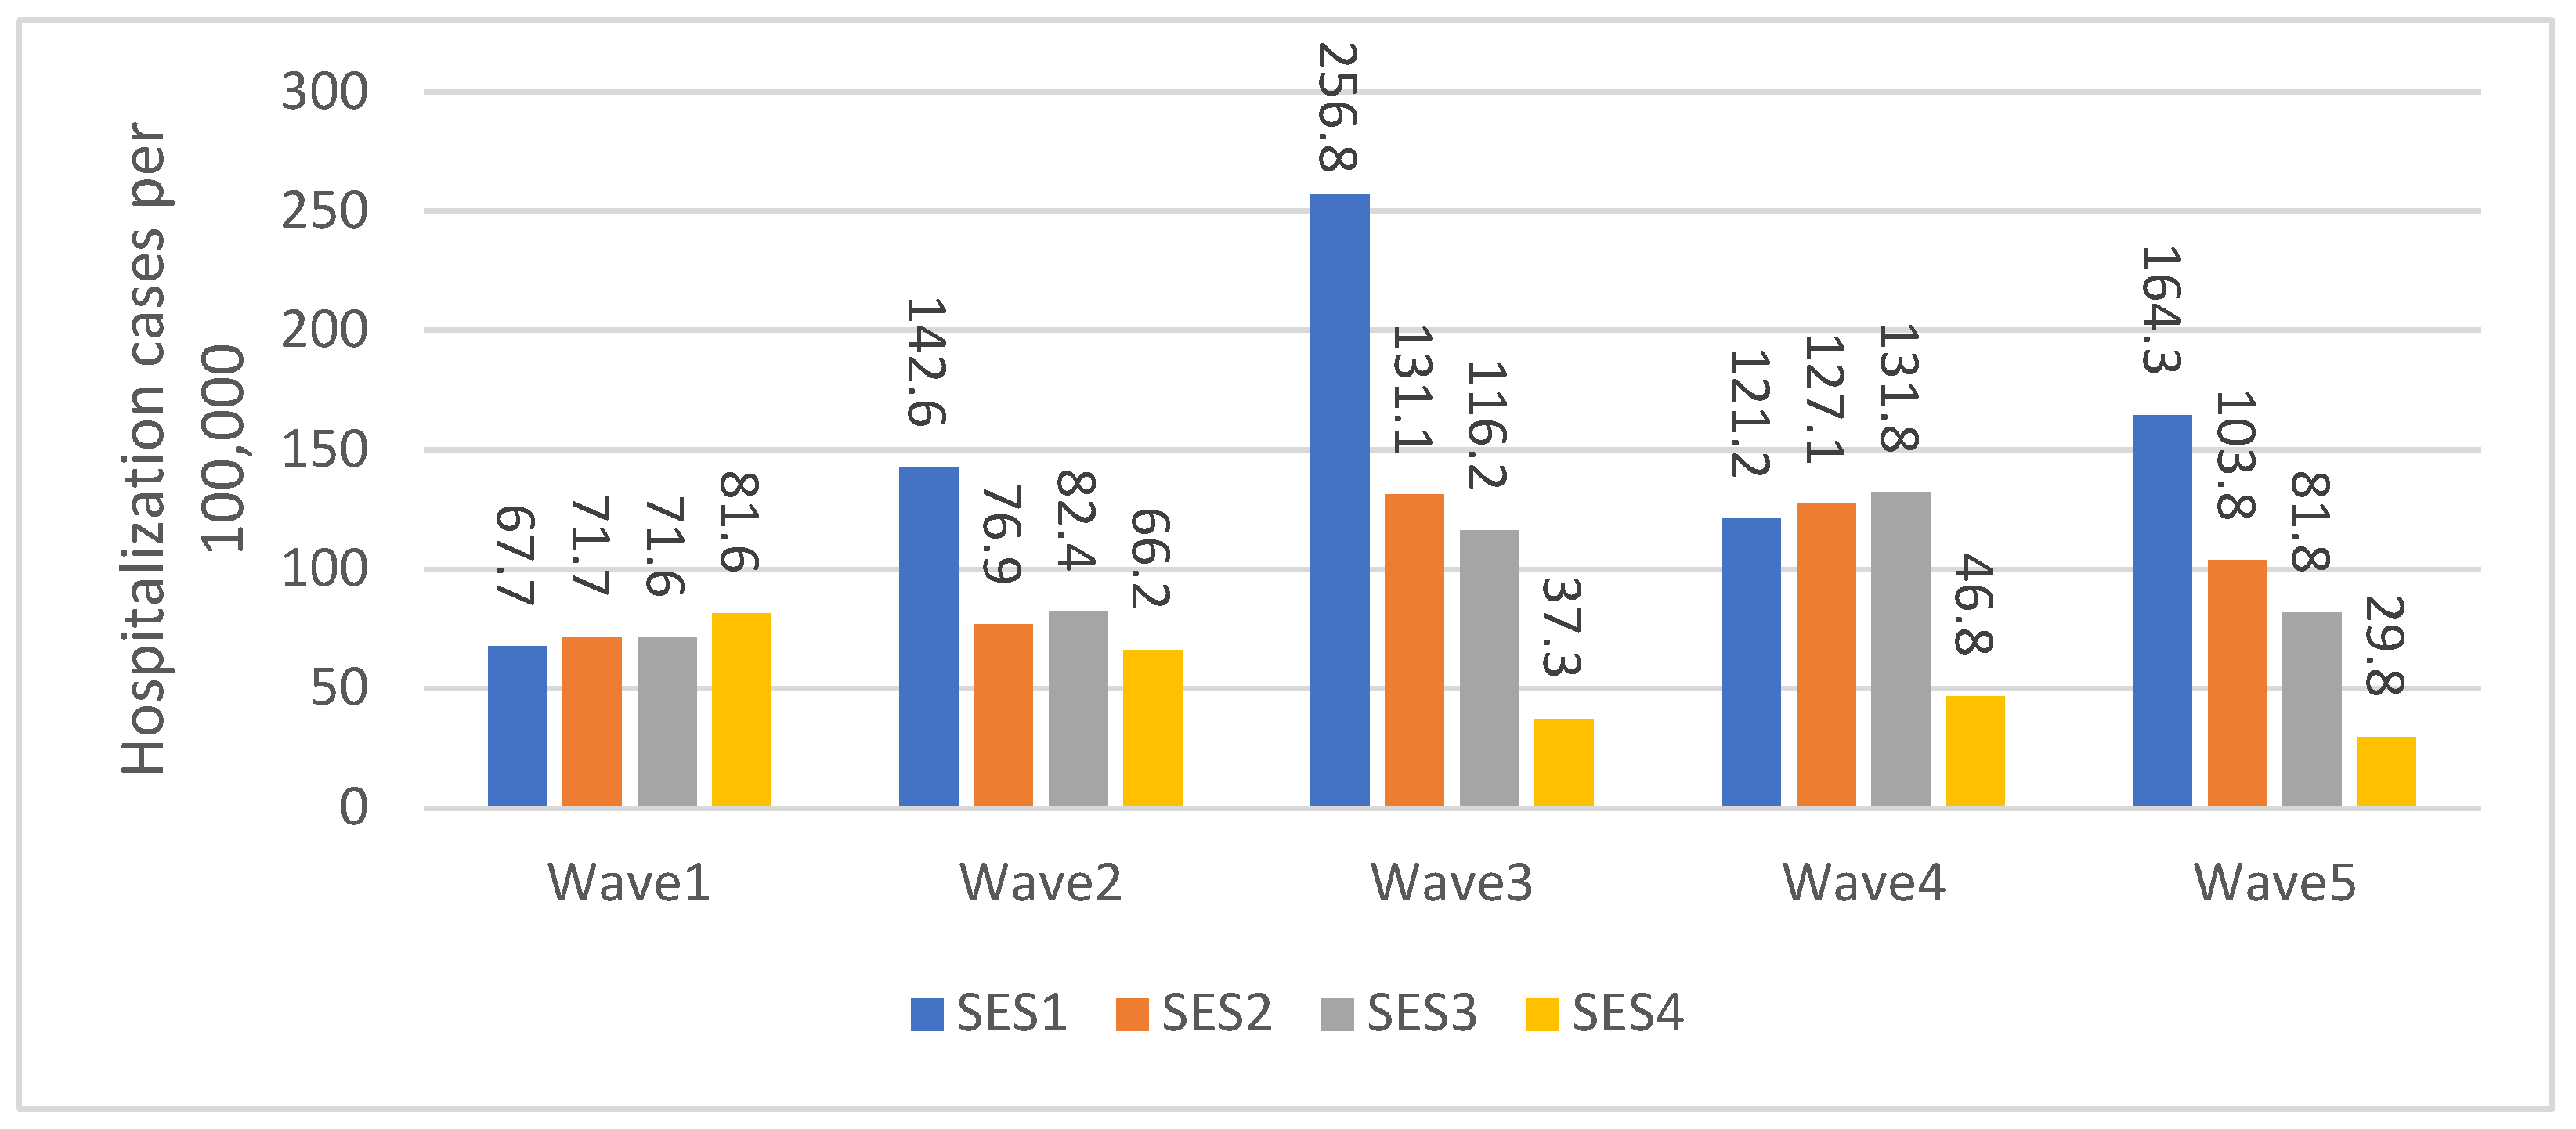
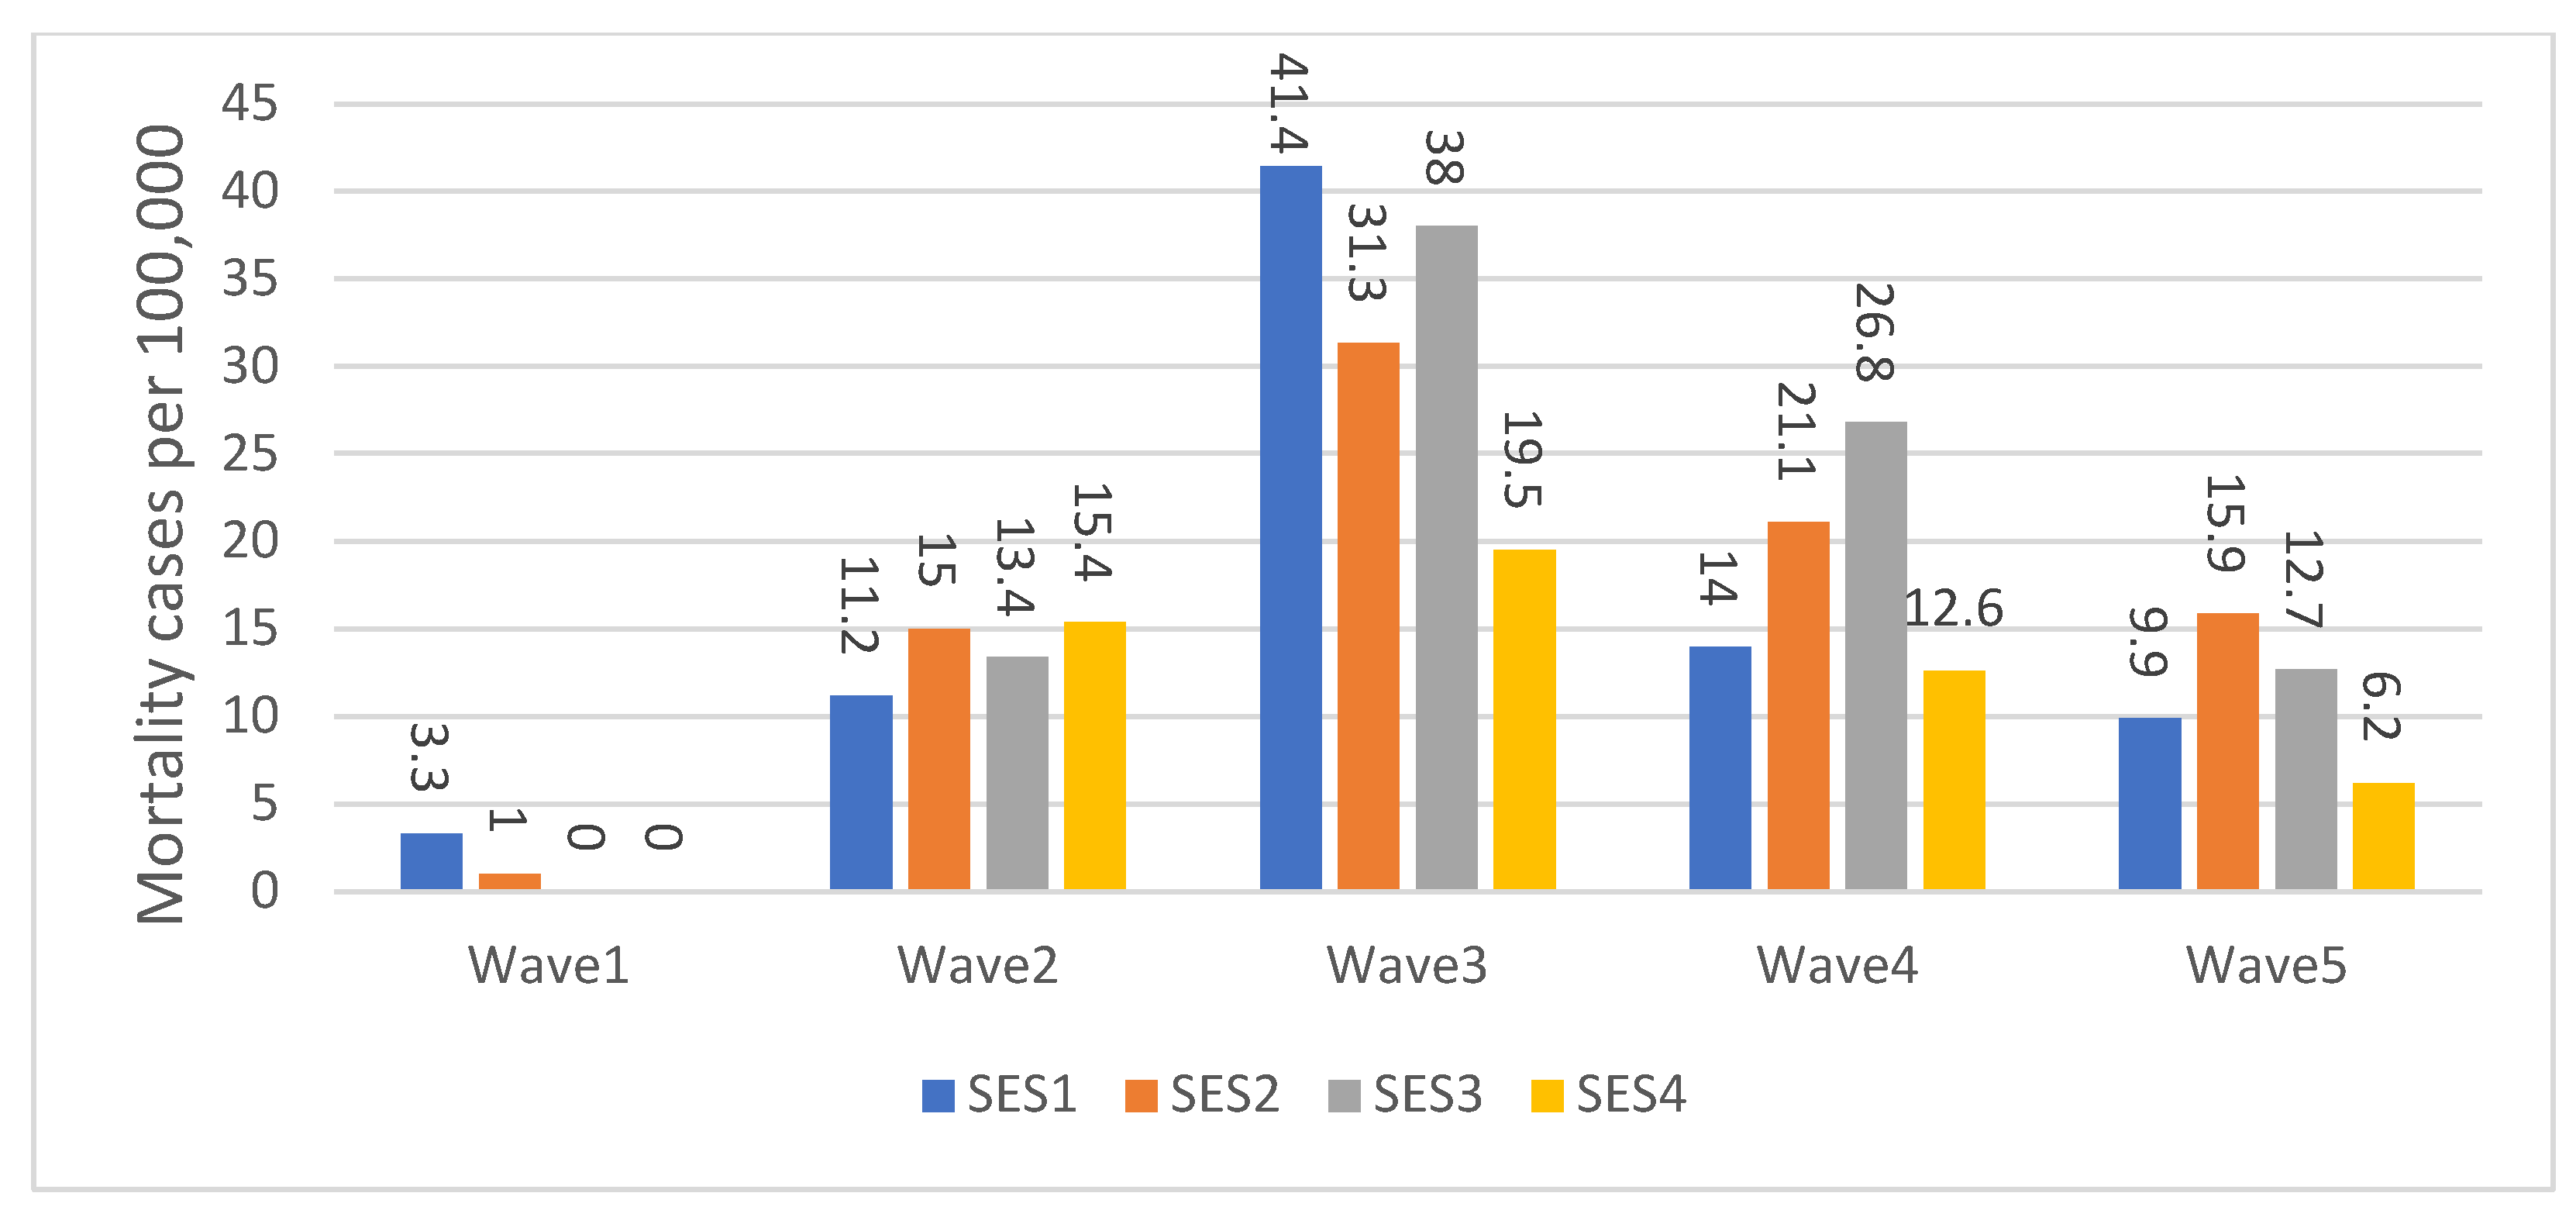
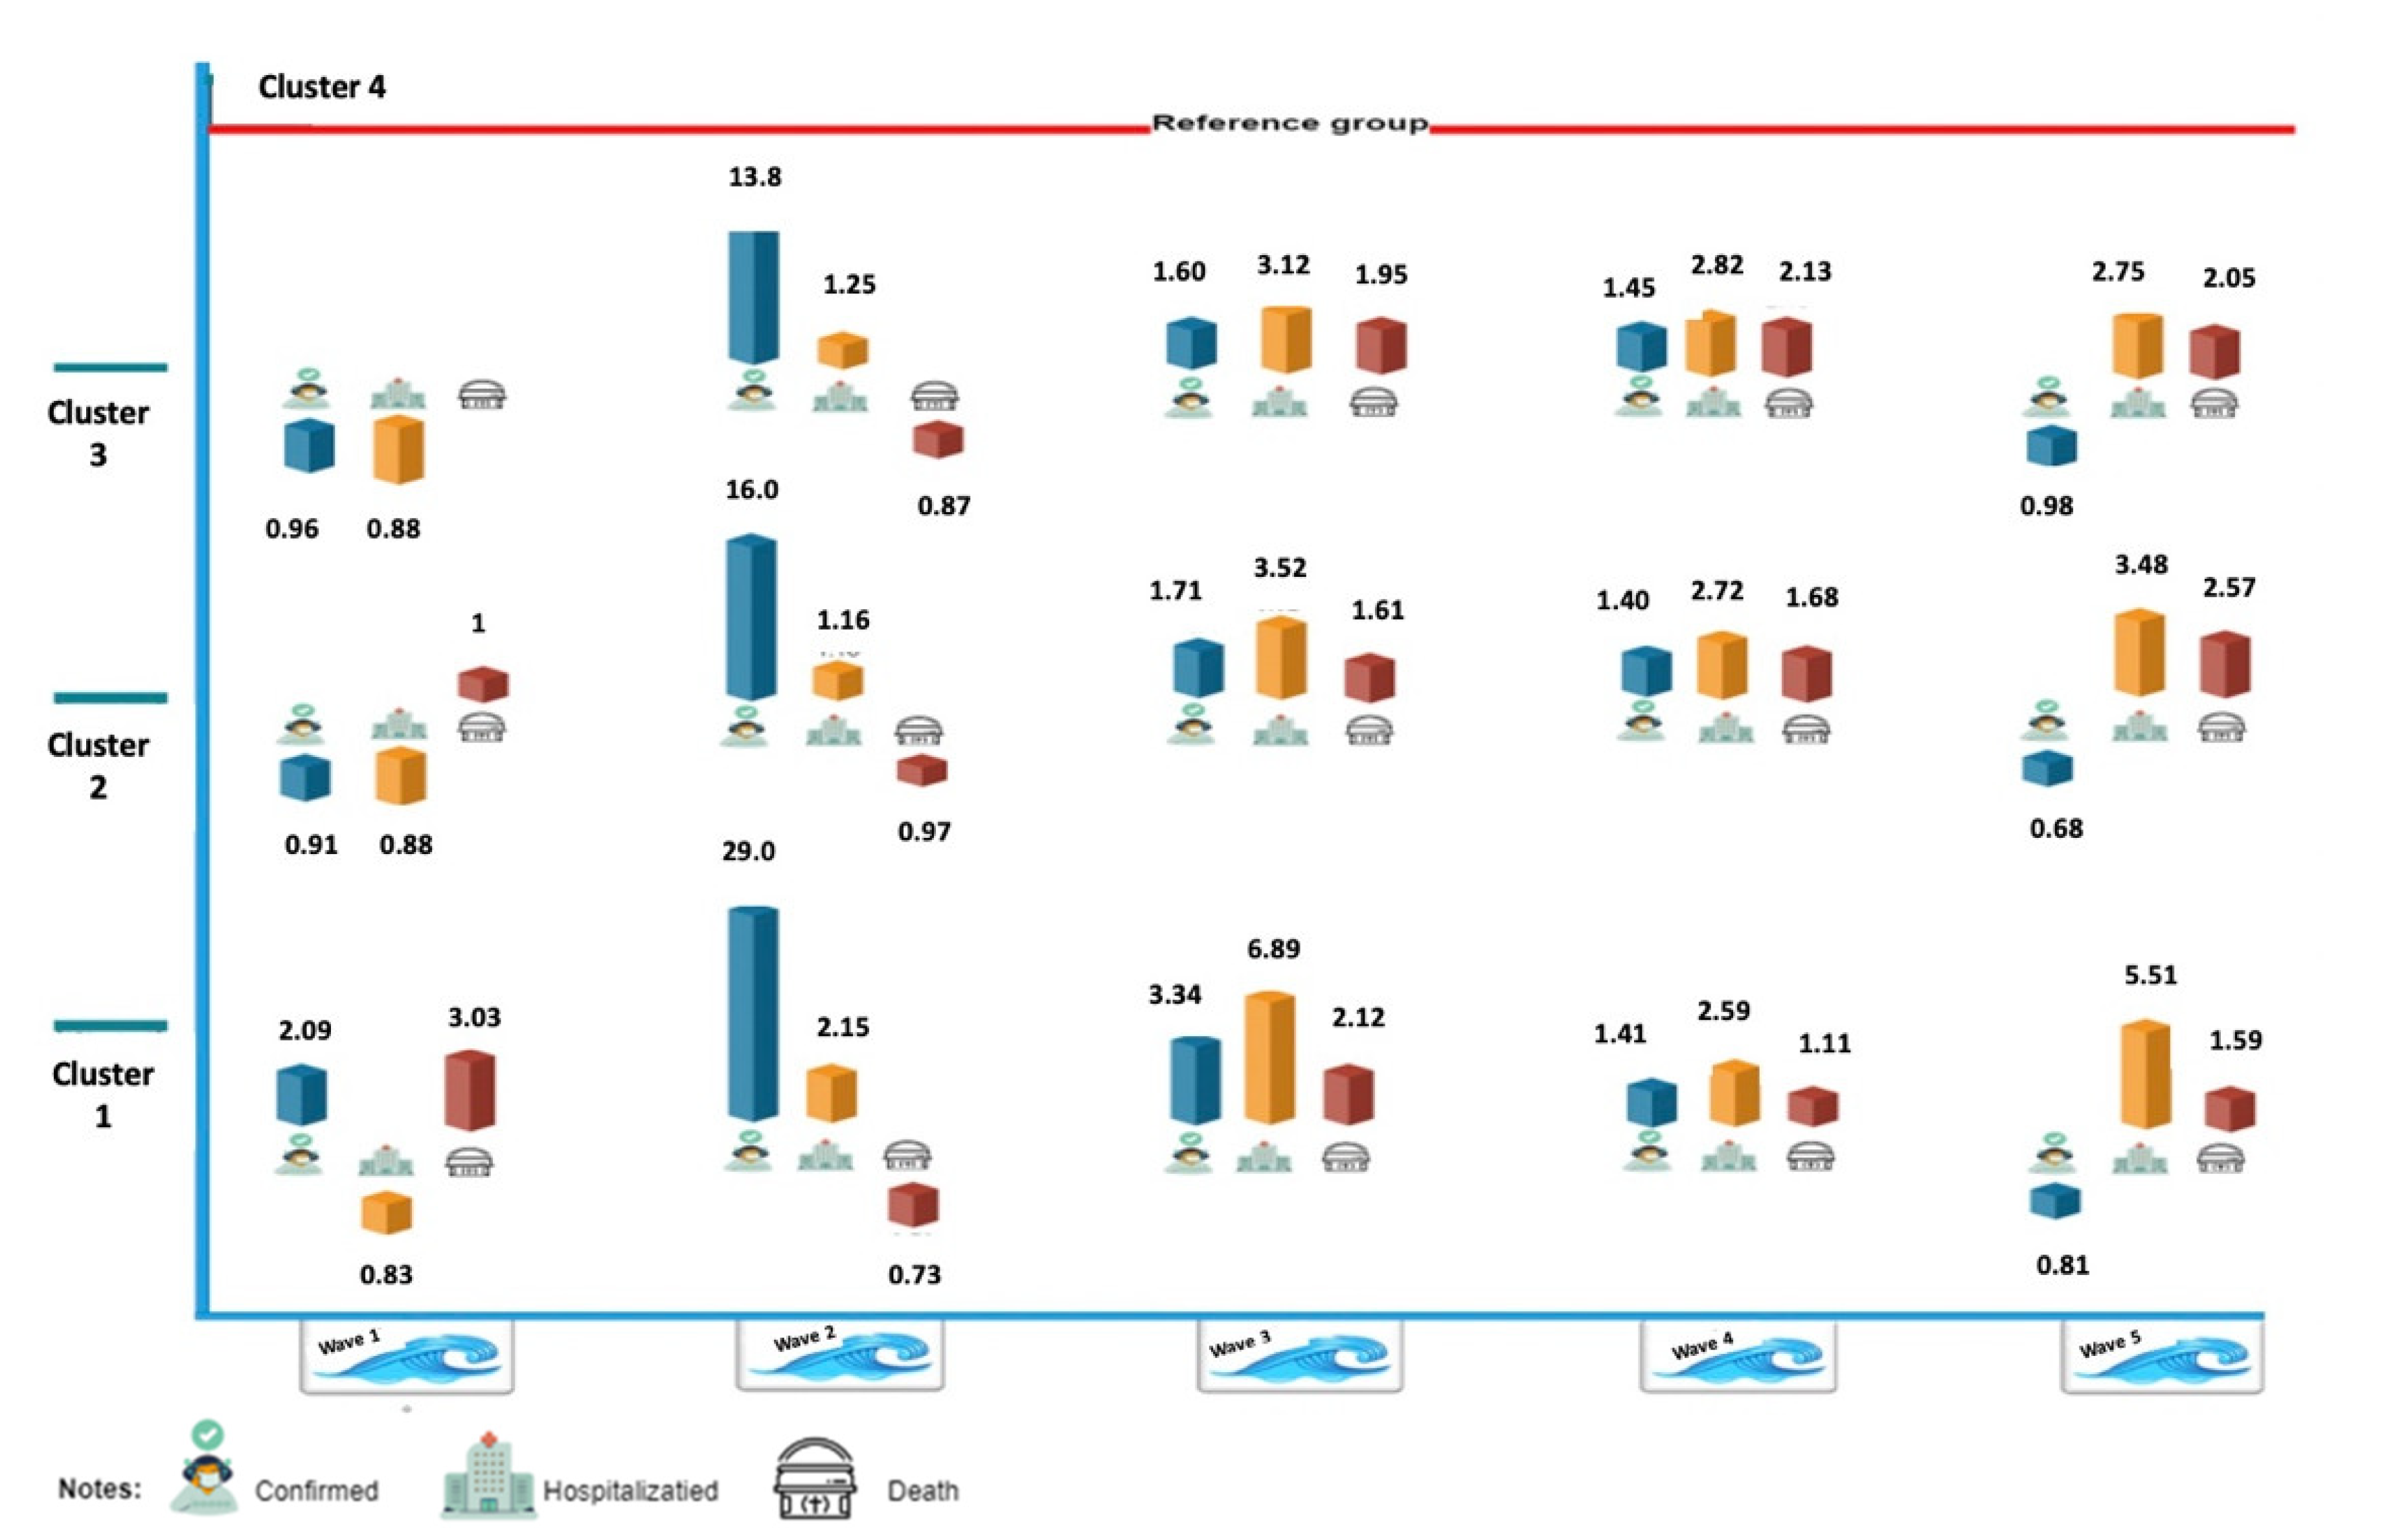
3. Results
4. Discussion
5. Conclusions
Author Contributions
Funding
Institutional Review Board Statement
Informed Consent Statement
Data Availability Statement
Conflicts of Interest
References
- Davies, J.M.; Sleeman, K.E.; Leniz, J.; Wilson, R.; Higginson, I.J.; Verne, J.; Maddocks, M.; Murtagh, F.E.M. Socioeconomic position and use of healthcare in the last year of life: A systematic review and meta-analysis. PLoS Med. 2019, 16, e1002782. [Google Scholar] [CrossRef]
- Frank, J.; Abel, T.; Campostrini, S.; Cook, S.; Lin, V.K.; McQueen, D.V. The social determinants of health: Time to re-think? Int. J. Environ. Res. Public Health 2020, 17, 5856. [Google Scholar] [CrossRef]
- Mackenbach, J.P.; Stirbu, I.; Roskam, A.J.; Schaap, M.M.; Menvielle, G.; Leinsalu, M.; Kunst, A.E. Socioeconomic inequalities in health in 22 European countries. N. Engl. J. Med. 2008, 358, 2468–2481. [Google Scholar] [CrossRef]
- Mielck, A.; Vogelmann, M.; Leidl, R. Health-related quality of life and socioeconomic status: Inequalities among adults with a chronic disease. Health Qual. Life Outcomes 2014, 12, 1–10. [Google Scholar] [CrossRef] [PubMed]
- Glover, J.D.; Tennant, S.K.; Hetzel, D.M. The socioeconomic gradient and chronic illness and associated risk factors in Australia. Aust. New Zealand Health Policy 2004, 1, 8. [Google Scholar] [CrossRef]
- Mamelund, S.E. A socially neutral disease? Individual social class, household wealth and mortality from Spanish influenza in two socially contrasting parishes in Kristiania 1918–19. Soc. Sci. Med. 2006, 62, 923–940. [Google Scholar] [CrossRef]
- Rutter, P.D.; Mytton, O.T.; Mak, M.; Donaldson, L.J. Socio-economic disparities in mortality due to pandemic influenza in England. Int. J. Public Health 2012, 57, 745–750. [Google Scholar] [CrossRef]
- Wachtler, B.; Michalski, N.; Nowossadeck, E.; Diercke, M.; Wahrendorf, M.; Santos-Hövener, C.; Lampert, T.; Hoebel, J. Socioeconomic inequalities and COVID-19–A review of the current international literature. J. Health Monit. 2020, 5 (Suppl. S7), 3–17. [Google Scholar] [CrossRef] [PubMed]
- Lupi, S.M.; Todaro, C.; Camassa, D.; Rizzo, S.; Storelli, S.; Rodriguez, Y.; Baena, R. Excess Mortality among Physicians and Dentists during COVID-19 in Italy: A Cross-Sectional Study Related to a High-Risk Territory. Healthcare 2022, 10, 1684. [Google Scholar] [CrossRef] [PubMed]
- Little, C.; Alsen, M.; Barlow, J.; Naymagon, L.; Tremblay, D.; Genden, E.; Trosman, S.; Iavicoli, L.; van Gerwen, M. The impact of socioeconomic status on the clinical outcomes of COVID-19; a retrospective cohort study. J Community Health 2021, 46, 794–802. [Google Scholar] [CrossRef]
- van Ingen, T.; Akingbola, S.; Brown, K.A.; Daneman, N.; Buchan, S.A.; Smith, B.T. Neighbourhood-level risk factors of COVID-19 incidence and mortality. MedRxiv 2021. [Google Scholar] [CrossRef]
- Lo, C.H.; Nguyen, L.H.; Drew, D.A.; Warner, E.T.; Joshi, A.D.; Graham, M.S.; Anyane-Yeboa, A.; Shebl, F.M.; Astley, C.M.; Figueiredo, J.C.; et al. Race, ethnicity, community-level socioeconomic factors, and risk of COVID-19 in the United States and the United Kingdom. EClinicalMedicine 2021, 38, 101029. [Google Scholar] [CrossRef]
- Do Lee, W.; Qian, M.; Schwanen, T. The association between socioeconomic status and mobility reductions in the early stage of England’s COVID-19 epidemic. Health Place 2021, 69, 102563. [Google Scholar] [CrossRef]
- Ehlert, A. The socio-economic determinants of COVID-19: A spatial analysis of German county level data. Socioecon. Plann. Sci. 2021, 78, 101083. [Google Scholar] [CrossRef] [PubMed]
- Macchia, A.; Ferrante, D.; Battistella, G.; Mariani, J.; de Quirós, F.G. COVID-19 among the inhabitants of the slums in the city of Buenos Aires: A population-based study. BMJ Open 2021, 11, e044592. [Google Scholar] [CrossRef]
- Mena, G.E.; Martinez, P.P.; Mahmud, A.S.; Marquet, P.A.; Buckee, C.O.; Santillana, M. Socioeconomic status determines COVID-19 incidence and related mortality in Santiago. Chile Sci. 2021, 372, eabg5298. [Google Scholar] [CrossRef] [PubMed]
- Jassat, W.; Ozougwu, L.; Munshi, S.; Mudara, C.; Vika, C.; Arendse, T.; Masha, M.; Welch, R.; Govender, N.; Ebonwu, J.; et al. The intersection of age, sex, race and socioeconomic status in COVID-19 hospital admissions and deaths in South Africa. South Afr. J. Sci. 2022, 118, 1–4. [Google Scholar] [CrossRef]
- Zhao, Z.; Li, X.; Liu, F.; Zhu, G.; Ma, C.; Wang, L. Prediction of the COVID-19 spread in African countries and implications for prevention and control: A case study in South Africa, Egypt, Algeria, Nigeria, Senegal and Kenya. Sci. Total Environ. 2020, 729, 138959. [Google Scholar] [CrossRef]
- Yoshikawa, Y.; Kawachi, I. Association of socioeconomic characteristics with disparities in COVID-19 outcomes in Japan. JAMA Netw. Open 2021, 4, e2117060. [Google Scholar] [CrossRef]
- Tantrakarnapa, K.; Bhopdhornangkul, B. Challenging the spread of COVID-19 in Thailand. One Health 2020, 11, 100173. [Google Scholar] [CrossRef]
- Liu, B.; Spokes, P.; He, W.; Kaldor, J. High risk groups for severe COVID-19 in a whole of population cohort in Australia. BMC Infect. Dis. 2021, 21, 1–9. [Google Scholar] [CrossRef] [PubMed]
- Muhsen, K.; Green, M.S.; Soskolne, V.; Neumark, Y. Inequalities in non-communicable diseases between the major population groups in Israel: Achievements and challenges. Lancet 2017, 389, 2531–2541. [Google Scholar] [CrossRef]
- Malach, G.; Cahaner, L. 2019 Statistical Report on Ultra-Orthodox Society in Israel: Highlights. The Israel Democracy Institute. Available online: https://en.idi.org.il/articles/29348 (accessed on 15 January 2023).
- Stein-Zamir, C.; Levine, H. The measles outbreak in Israel in 2018−19: Lessons for COVID-19 pandemic. Hum Vaccin Immunother. 2021, 17, 2085–2089. [Google Scholar] [CrossRef]
- DeRoo, S.S.; Pudalov, N.J.; Fu, L.Y. Planning for a COVID-19 vaccination program. JAMA 2020, 323, 2458–2459. [Google Scholar] [CrossRef]
- COVID dashboard. Available online: https://datadashboard.health.gov.il/COVID-19/general?utm_source=go.gov.il&utm_medium=referral (accessed on 7 March 2023).
- Clarfield, A.M.; Manor, O.; Nun, G.B.; Shvarts, S.; Azzam, Z.S.; Afek, A.; Basis, F.; Israeli, A. Health and health care in Israel: An introduction. Lancet 2017, 389, 2503–2513. [Google Scholar] [CrossRef]
- Central Bureau of Statistics (CBS) Characterization and classification of local authorities by the socio-economic level of the population. 2006. Available online: https://www.cbs.gov.il/en/publications/Pages/2021/socio-2017-e.aspx (accessed on 15 January 2023).
- Manor, O.; Shmueli, A.; Ben-Yehuda, A.; Paltiel, O.; Calderon, R.; Jaffe, D.H. National Program for Quality Indicators in Community Healthcare in Israel Report. 2011. Available online: https://www.semanticscholar.org/paper/Community-healthcare-in-Israel%3A-quality-indicators-Jaffe-Shmueli/6c8484d326b3cc203e326bed2b5479763aff973b (accessed on 15 January 2023).
- Onder, G.; Rezza, G.; Brusaferro, S. Case-fatality rate and characteristics of patients dying in relation to COVID-19 in Italy. JAMA 2020, 323, 1775–1776. [Google Scholar] [CrossRef]
- Politzer, E.; Shmueli, A.; Avni, S. The economic burden of health disparities related to socioeconomic status in Israel. Isr J Health Policy Res. 2019, 8, 1–16. [Google Scholar] [CrossRef]
- Baron-Epel, O.; Kaplan, G. Can subjective and objective socioeconomic status explain minority health disparities in Israel? Soc Sci Med. 2009, 69, 1460–1467. [Google Scholar] [CrossRef] [PubMed]
- Filc, D.; Davidovich, N.; Novack, L.; Balicer, R.D. Is socioeconomic status associated with utilization of health care services in a single-payer universal health care system? Int. J. Equity Health 2014, 13, 1–8. [Google Scholar] [CrossRef]
- Pareek, M.; Bangash, M.N.; Pareek, N.; Pan, D.; Sze, S.; Minhas, J.S.; Hanif, W.; Khunti, K. Ethnicity and COVID-19: An urgent public health research priority. Lancet 2020, 395, 1421–1422. [Google Scholar] [CrossRef] [PubMed]
- Horev, T.; Avni, S. Strengthening the capacities of a national health authority in the effort to mitigate health inequity—The Israeli model. Isr. J. Health Policy Res. 2016, 5, 1–2. [Google Scholar] [CrossRef] [PubMed]
- Menec, V.H.; Shooshtari, S.; Nowicki, S.; Fournier, S. Does the relationship between neighborhood socioeconomic status and health outcomes persist into very old age? A population-based study. J. Aging Health 2010, 22, 27–47. [Google Scholar] [CrossRef] [PubMed]
- Saban, M.; Myers, V.; Shachar, T.; Miron, O.; Wilf-Miron, R.R. Effect of socioeconomic and ethnic characteristics on COVID-19 infection: The case of the Ultra-Orthodox and the Arab communities in Israel. J. Racial Ethn. Health Disparities 2022, 9, 581–588. [Google Scholar] [CrossRef]
- Plümper, T.; Neumayer, E. The pandemic predominantly hits poor neighbourhoods? SARS-CoV-2 infections and COVID-19 fatalities in German districts. Eur. J. Public Health 2020, 30, 1176–1180. [Google Scholar] [CrossRef] [PubMed]
- Benderly, M.; Huppert, A.; Novikov, I.; Ziv, A.; Kalter-Leibovici, O. Fighting a pandemic: Sociodemographic disparities and coronavirus disease-2019 vaccination gaps—A population study. Int. J. Epidemiol. 2022, 51, 709–717. [Google Scholar] [CrossRef]
- Lamb, M.R.; Kandula, S.; Shaman, J. Differential COVID-19 case positivity in New York City neighborhoods: Socioeconomic factors and mobility. Influenza Other Respir. Viruses 2021, 15, 209–217. [Google Scholar] [CrossRef]
- Baum, C.F.; Henry, M. Socioeconomic factors influencing the spatial spread of COVID-19 in the United States. In Proceedings of the London Stata Conference, London, UK, 10–11 September 2020. [Google Scholar]


| Wave | 1 | 2 | 3 | 4 | 5 |
|---|---|---|---|---|---|
| Months | February–May 2020 | June–November 2020 | December 2020–April 2021 | May–November 2021 | December 2021–February 2022 |
| Total number of confirmed cases | 17,124 | 297,526 | 523,931 | 431,642 | 11,630,353 |
| Highest number of confirmed cases per day | 740 | 9078 | 10,114 | 11,333 | 85,141 |
| Deaths | 289 | 2281 | 3813 | 1618 | 1110 |
| Highest number of death cases per day | 13 | 47 | 76 | 36 | 59 |
| Case fatality Ratio (Ratio between death/confirmed cases) | 0.02 | 0.007 | 0.007 | 0.003 | 0.00009 |
| Severe illness | 643 | 7989 | 12,690 | 5403 | 3499 |
| Highest number of severe cases per day | 192 | 897 | 1190 | 767 | 1254 |
| Highest severe cases per day (accumulated) | 34 | 161 | 193 | 118 | 232 |
| Ratio between severe illness/confirmed cases | 0.03 | 0.02 | 0.02 | 0.01 | 0.0003 |
| The highest number of tests | 13,289 | 67,870 | 124,663 | 414,702 | 474,835 |
| The highest percentage of positive tests per day | 10.89% | 15.52% | 10.19% | 8.42% | 22.96% |
| Highest number of active cases per day | 9808 | 72,400 | 84,784 | 92,270 | 537,755 |
| Vaccination | No | No | Middle of Wave | Yes | Yes |
| Lockdown | 4.5.2020–25.3.2020 | 17.10.20–18.9.2020 | 7.2.2021–27.12.2020 | No | No |
| Cluster | Wave | 1 | 2 | 3 | 4 | 5 | |||||
|---|---|---|---|---|---|---|---|---|---|---|---|
| 1 | Confirmed Cases | 1.960–2.233 | <0.001 | 29.003–29.084 | <0.001 | 3.322–3.376 | <0.001 | 1.378–1.444 | <0.001 | 0.796–0.833 | <0.001 |
| Hospitalized Cases | 0.113–0.687 | <0.001 | −0.127–0.267 | <0.001 | 1.913–2.207 | <0.001 | 1.494–2.186 | <0.001 | 6.473–7.067 | <0.001 | |
| Death Cases | −2.195–2.195 | <0.001 | −1.121–1.171 | <0.001 | 0.0402–1.228 | <0.001 | 0.093–1.481 | 0.033 | 1.267–2.655 | 0.007 | |
| 2 | Confirmed Cases | 0.701–1.115 | 15.946–16.054 | 1.672–1.747 | 1.367–1.433 | 0.664–0.704 | |||||
| Hospitalized Cases | 0.693–1.247 | −0.198–0.338 | 1.855–2.265 | 1.603–2.277 | 4.717–5.463 | ||||||
| Death Cases | −3.802–3.802 | −0.921–1.043 | 0.256–1.622 | 0.502–1.890 | 3.057–4.445 | ||||||
| 3 | Confirmed Cases | 0.762–1.164 | 13.787–13.903 | 1.565–1.643 | 1.417–1.482 | 0.973–1.006 | |||||
| Hospitalized Cases | 0.633–1.187 | −0.170–0.350 | 1.707–2.413 | 1.609–2.271 | 2.350–3.190 | ||||||
| Death Cases | −0.992–1.118 | 0.598–1.832 | 0.774–2.162 | 3.010–4.492 | |||||||
Disclaimer/Publisher’s Note: The statements, opinions and data contained in all publications are solely those of the individual author(s) and contributor(s) and not of MDPI and/or the editor(s). MDPI and/or the editor(s) disclaim responsibility for any injury to people or property resulting from any ideas, methods, instructions or products referred to in the content. |
© 2023 by the authors. Licensee MDPI, Basel, Switzerland. This article is an open access article distributed under the terms and conditions of the Creative Commons Attribution (CC BY) license (https://creativecommons.org/licenses/by/4.0/).
Share and Cite
Kaim, A.; Saban, M. Dynamic Trends in Sociodemographic Disparities and COVID-19 Morbidity and Mortality—A Nationwide Study during Two Years of a Pandemic. Healthcare 2023, 11, 933. https://doi.org/10.3390/healthcare11070933
Kaim A, Saban M. Dynamic Trends in Sociodemographic Disparities and COVID-19 Morbidity and Mortality—A Nationwide Study during Two Years of a Pandemic. Healthcare. 2023; 11(7):933. https://doi.org/10.3390/healthcare11070933
Chicago/Turabian StyleKaim, Arielle, and Mor Saban. 2023. "Dynamic Trends in Sociodemographic Disparities and COVID-19 Morbidity and Mortality—A Nationwide Study during Two Years of a Pandemic" Healthcare 11, no. 7: 933. https://doi.org/10.3390/healthcare11070933
APA StyleKaim, A., & Saban, M. (2023). Dynamic Trends in Sociodemographic Disparities and COVID-19 Morbidity and Mortality—A Nationwide Study during Two Years of a Pandemic. Healthcare, 11(7), 933. https://doi.org/10.3390/healthcare11070933