
Disentangling the Cost of Orphan Drugs Marketed in the United States
 ,
, 

Abstract
:1. Introduction
2. Material and Methods
2.1. Data Sources
2.2. Data Analysis
2.3. Study Outcome: The Treatment Costs of New Approved Drugs at Market Entry
3. Results
3.1. Treatment Cost of New Approved Drugs at Market Entry
3.2. Factors Explaining Treatment Cost of New Approved Drugs at Market Entry
4. Discussion
5. Limitations
6. Conclusions
Author Contributions
Funding
Institutional Review Board Statement
Informed Consent Statement
Data Availability Statement
Conflicts of Interest
Appendix A

| Product Name (Non-Proprietary Name) | Approval Date | Therapeutic Area | Posology Type | Age Group | Units/Treatment | Adjusted WAC Cost Per Year/Treatment at Market Entry |
|---|---|---|---|---|---|---|
| Non-Orphan Drugs New Therapeutic Biologics | ||||||
| aducanumab-avwa | 7 Jun 2021 | Other | Chronic Use (1 year) | Adult | 9125 mg | $52,540.51 |
| amivantamab-vmjw | 21 May 2021 | Oncology | Cycles | Adult | 26,985 mg | $233,668.03 |
| anifrolumab-fnia | 30 Jul 2021 | Other | Cycles | Adult | 3900 mg | $60,644.32 |
| benralizumab | 14 Nov 2017 | Other | Chronic Use (1 year) | Pediatric | 195 mg | $35,684.60 |
| brodalumab | 15 Feb 2017 | Other | Cycles | Adult | 5460 mg | $33,131.85 |
| brolucizumab-dbll | 7 Oct 2019 | Genetic Disorders | Chronic Use (1 year) | Adult | 39 mg | $233,934.14 |
| cemiplimab-rwlc | 28 Sep 2018 | Oncology | Cycles | Adult | 6067 mg | $168,790.78 |
| dasiglucagon | 22 Mar 2021 | Other | Single-Use | Adult & Pediatric | 0.6 mg | $522.21 |
| dostarlimab-gxly | 22 Apr 2021 | Oncology | Cycles | Adult | 8667 mg | $117,686.30 |
| dupilumab | 28 Mar 2017 | Other | Short treatment course | Adult | 2400 mg | $6217.48 |
| durvalumab | 1 May 2017 | Oncology | Cycles | Adult | 18,200 mg | $138,311.22 |
| efgartigimod alfa-fcab | 17 Dec 2021 | Genetic Disorders | Cycles | Adult | 18,200 mg | $274,515.15 |
| enfortumab vedotin-ejfv | 18 Dec 2019 | Oncology | Cycles | Adult | 3150 mg | $350,189.92 |
| eptinezumab-jjmr | 21 Feb 2020 | Other | Cycles | Adult | 400 mg | $6148.56 |
| erenumab-aooe | 17 May 2018 | Other | Chronic Use (1 year) | Adult | 840 mg | $7383.70 |
| fam-trastuzumab deruxtecan-nxki | 20 Dec 2019 | Oncology | Cycles | Adult | 6552 mg | $158,518.55 |
| fremanezumab-vfrm | 14 Sep 2018 | Other | Chronic Use (1 year) | Adult | 2700 mg | $4922.47 |
| galcanezumab-gnlm | 27 Sep 2018 | Other | Chronic Use (1 year) | Adult | 1440 mg | $7383.70 |
| guselkumab | 13 Jul 2017 | Other | Cycles | Adult | 650 mg | $68,753.32 |
| margetuximab (anti-HER2 mAb) | 16 Dec 2020 | Oncology | Cycles | Adult | 18,249 mg | $153,735.33 |
| ocrelizumab | 28 Mar 2017 | Other | Cycles | Adult | 1200 mg | $70,996.82 |
| risankizumab-rzaa | 23 Apr 2019 | Other | Cycles | Adult | 750 mg | $155,429.21 |
| romosozumab-aqqg | 9 Apr 2019 | Other | Short treatment course | Adult | 2520 mg | $19,724.18 |
| sacituzumab govitecan-hziy | 22 Apr 2020 | Oncology | Cycles | Adult | 14,200 mg | $163,239.32 |
| sarilumab | 22 May 2017 | Other | Chronic Use (1 year) | Adult | 5200 mg | $37,366.74 |
| tezepelumab-ekko | 27 Dec 2021 | Other | Chronic Use (1 year) | Adult & Pediatric | 2730 mg | $23,808.22 |
| tildrakizumab-asmn | 20 Mar 2018 | Other | Cycles | Adult | 433 mg | $61,468.75 |
| tisotumab vedotin-tftv | 20 Sep 2021 | Oncology | Cycles | Adult | 1680 mg | $251,117.72 |
| tralokinumab-ldrm | 27 Dec 2021 | Other | Chronic Use (1 year) | Adult | 3000 mg | $16,121.70 |
| New Molecular Entities | ||||||
| abaloparatide | 28 Apr 2017 | Other | Chronic Use (1 year) | Adult | 28,800 mg | $16,383.88 |
| abemaciclib | 28 Sep 2017 | Oncology | Chronic Use (1 year) | Adult | 103,200 mg | $220,369.75 |
| air polymer-type A | 7 Nov 2019 | Other | Single-Use | Adult | 217.4 mg | $740.22 |
| alpelisib | 24 May 2019 | Oncology | Cycles | Adult | 99,000 mg | $288,748.34 |
| amisulpride | 26 Feb 2020 | Other | Single-use | Adult | 5 mg | $43.70 |
| angiotensin ii | 21 Dec 2017 | Other | Single use | Adult | 1 mg | $1605.15 |
| apalutamide | 14 Feb 2018 | Oncology | Chronic Use (1 year) | Adult | 86,400 mg | $140,226.19 |
| atogepant | 28 Sep 2021 | Other | Chronic Use (1 year) | Adult | 3600 mg | $2009.75 |
| avatrombopag | 21 May 2018 | Other | Short treatment course | Adult | 200 mg | $9630.92 |
| baloxavir marboxil | 24 Oct 2018 | Infectious disease | Single-Use | Adult & Pediatric | 80 mg | $165.33 |
| baricitinib | 31 May 2018 | Other | Chronic Use (1 year) | Adult | 720 mg | $26,384.87 |
| bempedoic acid | 21 Feb 2020 | Other | Chronic use (1 year) | Adult | 64,800 mg | $3392.97 |
| betrixaban | 23 Jun 2017 | Other | Short treatment course | Adult | 3360 mg | $688.12 |
| bictegravir, embitcitabine, tenofovir alafenamide | 7 Feb 2018 | HIV | Chronic Use (1 year) | Adult | 18,000 mg | $37,825.76 |
| bremelanotide | 21 Jun 2019 | Other | Single-use | Adult | 2 mg | $759.66 |
| brexanolone | 19 Mar 2019 | Other | Short treatment course | Adult | 126,000 mg | $49,458.10 |
| cabotegravir and rilpivirine | 21 Jan 2021 | HIV | Chronic Use (1 year) | Adult | 7200 mg | $36,138.96 |
| cefiderocol | 14 Nov 2019 | Infectious disease | Short treatment course | Adult | 84 mg | $15,834.14 |
| cenobamate | 21 Nov 2019 | Other | Chronic Use (1 year) | Adult | 72,000 mg | $12,153.21 |
| clascoterone | 26 Aug 2020 | Other | Short treatment course | Adult & Pediatric | 180 mg | $1394.25 |
| darolutamide | 30 Jul 2019 | Oncology | Chronic Use (1 year) | Adult | 432,000 mg | $146,050.77 |
| delafloxacin | 19 Jun 2017 | Infectious disease | Short treatment course | Adult | 12,600 mg | $3096.55 |
| difelikefalin | 23 Aug 2021 | Other | Chronic Use (1 year) | Adult | 5475 mg | $12,164.38 |
| doravirine | 30 Aug 2018 | HIV | Chronic Use (1 year) | Adult | 36,000 mg | $17,720.89 |
| drospirenone and estetrol | 15 Apr 2021 | Other | Chronic Use (1 year) | Adult | 365 mg | $2311.92 |
| elagolix sodium | 23 Jul 2018 | Other | Chronic Use (1 year) | Adult | 54,000 mg | $11,624.06 |
| eravacycline | 27 Aug 2018 | Infectious disease | Short treatment course | Adult | 1960 mg | $1835.23 |
| erdafitinib | 12 Apr 2019 | Oncology | Cycles | Adult | 1080 mg | $102,425.22 |
| ertugliflozin | 19 Dec 2017 | Other | Chronic Use (1 year) | Adult | 5400 mg | $10,332.05 |
| etelcalcetide | 7 Feb 2017 | Other | Chronic Use (1 year) | Adult | 780 mg | $55,718.30 |
| ferric maltol | 25 Jul 2019 | Other | Chronic use (1 year) | Adult | 21,600 mg | $6084.00 |
| finerenone | 9 Jul 2021 | Other | Chronic Use (1 year) | Adult | 7300 mg | $14,041.97 |
| flortaucipir F18 | 28 May 2020 | Oncology | Single use | Adult | 1.5ml | $1407.33 |
| fosnetupitant and palonosetron | 19 Apr 2018 | Other | Single-use | Adult | 235 mg | $545.75 |
| fostemsavir | 2 Jul 2020 | HIV | Chronic Use (1 year) | Adult | 432,000 mg | $94,387.79 |
| Gallium 68 PSMA-11 | 1 Dec 2020 | Oncology | Single-use | Adult | 6 mCi | $1140.75 |
| glecaprevir and pibrentasvir | 3 Aug 2017 | Infectious disease | Short treatment course | Adult | 18,000 mg | $30,895.32 |
| ibrexafungerp | 1 Jun 2021 | Infectious disease | Single-Use | Adult & Pediatric | 600 mg | $481.65 |
| imipenem, cilastatin, relebactam | 16 Jul 2019 | Infectious disease | Short treatment course | Adult | 70 mg | $19,252.87 |
| istradefylline | 27 Aug 2019 | Other | Chronic Use (1 year) | Adult | 7200 mg | $9483.82 |
| lasmiditan | 11 Oct 2019 | Other | Single-Use | Adult | 50 mg | $715.47 |
| latanoprostene bunod | 2 Nov 2017 | Other | Chronic Use (1 year) | Adult | 360 mg | $3774.85 |
| lefamulin | 19 Aug 2019 | Infectious disease | Short treatment course | Adult | 6000 mg | $1448.92 |
| lemborexant | 20 Dec 2019 | Other | Chronic Use (1 year) | Adult | 1800 mg | $1696.51 |
| lofexidine hydrochloride | 16 May 2018 | Other | Short treatment course | Adult | 30 mg | $3719.59 |
| lumateperone | 20 Dec 2019 | Other | Chronic Use (1 year) | Adult | 15,120 mg | $16,286.54 |
| lusutrombopag | 31 Jul 2018 | Other | Chronic Use (1 year) | Adult | 21 mg | $9095.87 |
| meropenem and vaborbactam | 29 Aug 2017 | Infectious disease | Short treatment course | Adult | 84 mg | $14,831.62 |
| naldemedine | 23 Mar 2017 | Other | Chronic Use (1 year) | Adult | 72 mg | $4541.48 |
| neratinib maleate | 17 Jul 2017 | Oncology | Cycles | Adult | 86,400 mg | $137,624.60 |
| netarsudil | 18 Dec 2017 | Other | Chronic Use (1 year) | Adult | 360 mg | $3528.77 |
| olanzapine and samidor- phan | 28 May 2021 | Other | Chronic use (1 year) | Adult | 3650 mg | $34,296.86 |
| oliceridine | 7 Aug 2020 | Other | Short treatment course | Adult | 27 mg | $485.82 |
| omadacycline | 2 Oct 2018 | Infectious disease | Short treatment course | Adult | 4200 mg | $5917.66 |
| opicapone | 24 Apr 2020 | Other | Chronic Use (1 year) | Adult | 18,000 mg | $7279.58 |
| ozanimod | 25 Mar 2020 | Other | Chronic Use (1 year) | Adult | 331 mg | $87,213.00 |
| ozenoxacin | 11 Dec 2017 | Infectious disease | Short treatment course | Adult & Pediatric | 50 mg | $524.40 |
| piflufolastat f 18 | 26 May 2021 | Oncology | Single-use | Adult | 9 mCi | $4498.92 |
| plazomicin | 25 Jun 2018 | infectious disease | Short treatment course | Adult | 7350 mg | $4955.11 |
| plecanatide | 19 Jan 2017 | Other | Chronic Use (1 year) | Adult | 1080 mg | $5385.55 |
| ponesimod | 18 Mar 2021 | Other | Chronic Use (1 year) | Adult | 7300 mg | $99,807.53 |
| pretomanid | 14 Aug 2019 | Infectious disease | Short treatment course | Adult | 35,400 mg | $3689.29 |
| prucalopride succinate | 14 Dec 2018 | Other | Chronic use (1 year) | Adult | 720 mg | $5360.25 |
| relugolix | 18 Dec 2020 | Oncology | Chronic Use (1 year) | Adult | 44,040 mg | $29,093.35 |
| remdesivir | 22 Oct 2020 | Infectious disease | Short treatment course | Adult & Pediatric | 600 mg | $3207.95 |
| remimazolam | 2 Jul 2020 | Other | Single Use | Adult | 5 mg | $395.46 |
| revefenacin | 9 Nov 2018 | Other | Chronic Use (1 year) | Adult | 63,000 mg | $4408.82 |
| ribociclib | 13 Mar 2017 | Oncology | Cycles | Adult | 168,000 mg | $191,363.72 |
| rifamycin SV MMX | 16 Nov 2018 | Infectious disease | Short treatment course | Adult | 2328 mg | $154.09 |
| rimegepant | 27 Feb 2020 | Other | Short treatment course | Adult | 1125 mg | $1638.67 |
| safinamide | 21 Mar 2017 | Other | Chronic Use (1 year) | Adult | 18,000 mg | $4390.22 |
| sarecycline | 1 Oct 2018 | Other | Short treatment course | Adult & Pediatric | 9000 mg | $2718.69 |
| secnidazole | 15 Sep 2017 | Infectious disease | Short treatment course | Adult | 2 gm/1 packet | $284.94 |
| segesterone acetate and ethinyl estradiol | 10 Aug 2018 | Other | Single-use | Adult | 0.013 mg | $2107.51 |
| selinexor | 3 Jul 2019 | Oncology | Cycles | Adult | 5504 mg | $199,370.90 |
| semaglutide | 5 Dec 2017 | Other | Chronic Use (1 year) | Adult | 52 mg | $12,798.36 |
| serdexmethylphenidate and dexmethylphenidate | 2 Mar 2021 | Other | Chronic Use (1 year) | Adult & Pediatric | 18,828 mg | $31,574.56 |
| siponimod | 26 Mar 2019 | Other | Chronic Use (1 year) | Adult | 363 mg | $46,405.16 |
| sodium zirconium cyclosilicate | 18 May 2018 | Other | Chronic Use (1 year) | Adult | 3600 mg | $8411.00 |
| sofosbuvir, velpatasvir and voxilaprevir | 18 Jul 2017 | Infectious disease | Short treatment course | Adult | 33,600 mg | $81,657.26 |
| talazoparib | 16 Oct 2018 | Oncology | Cycles | Adult | 360 mg | $187,225.07 |
| tenapanor | 12 Sep 2019 | Other | Chronic Use (1 year) | Adult | 36,000 mg | $17,331.04 |
| tirbanibulin | 14 Dec 2020 | Other | Short treatment course | Adult | 5 mg | $1003.86 |
| tivozanib | 10 Mar 2021 | Oncology | Cycles | Adult | 276 mg | $239,272.43 |
| trifarotene | 4 Oct 2019 | Other | Short treatment course | Adult & Pediatric | 45 gm | $740.55 |
| trilaciclib | 12 Feb 2021 | Oncology | Cycles | Adult | 2520 mg | $12,069.44 |
| ubrogepant | 23 Dec 2019 | Other | Single-use | Adult | 50 mg | $87.40 |
| upadacitinib | 16 Aug 2019 | Other | Chronic Use (1 year) | Adult | 5400 mg | $62,171.69 |
| valbenazine | 11 Apr 2017 | Other | Chronic Use (1 year) | Adult | 28,800 mg | $81,591.72 |
| vericiguat | 19 Jan 2021 | Other | Chronic Use (1 year) | Adult | 3650 mg | $28,677.06 |
| vibegron | 23 Dec 2020 | Other | Chronic Use (1 year) | Adult | 27,000 mg | $5577.81 |
| viloxazine | 2 Apr 2021 | Other | Chronic use (1 year) | Pediatric | 67,200 mg | $7198.85 |
| voclosporin | 22 Jan 2021 | Other | Chronic Use (1 year) | Adult | 17,064 mg | $154,284.16 |
| vosoritide | 19 Nov 2021 | Genetic Disorders | Chronic Use (1 year) | Pediatric | 168 mg | $382,866.12 |
| Orphan drugs New Biologics | ||||||
| asparaginase erwinia chrysanthemi (recombi- nant)-rywn | 30 Jun 2021 | Oncology | Short treatment course | Adult & Pediatric | 262.5 mg | $233,701.65 |
| avalglucosidase alfa-ngpt | 6 Aug 2021 | Oncology | Chronic Use (1 year) | Adult & Pediatric | 36,498 mg | $634,666.86 |
| avelumab | 23 Mar 2017 | Cycles | Adult & Pediatric | 18,200 mg | $149,490.89 | |
| belantamab mafodotin-blmf | 5 Aug 2020 | Oncology | Cycles | adult | 3041.5 mg | $258,737.92 |
| brexucabtagene autoleucel | 24 Jul 2020 | Oncology | Single-use | adult | 1 × 10⁶ CAR-positive viable T cells/kg body weight | $460,217.51 |
| burosumab-twza | 17 Apr 2018 | Genetic Disorders | Cycles | Adult & Pediatric | 770 mg | $280,152.74 |
| calaspargase pegol-mknl | 20 Dec 2018 | Oncology | Cycles | Adult & Pediatric | 76,042 mg | $511,422.87 |
| caplacizumab-yhdp | 6 Feb 2019 | Genetic Disorders | Short treatment course | Adult | 330 mg | $230,772.87 |
| cenegermin-bkbj | 22 Aug 2018 | Genetic Disorders | Short treatment course | adult | 360 mg | $92,771.30 |
| cerliponase alfa | 27 Apr 2017 | Genetic Disorders | Chronic Use (1 year) | Pedatric | 7800 mg | $810,995.23 |
| crizanlizumab-tmca | 15 Nov 2019 | Genetic Disorders | Cycles | Adult & Pediatric | 4900 mg | $121,708.92 |
| elapegademase-lvlr | 5 Oct 2018 | Genetic Disorders | Short treatment course | Adult & Pediatric | 336 mg | $393,751.93 |
| emapalumab-lzsg | 20 Nov 2018 | Genetic Disorders | Cycles | Adult & Pediatric | 6720 mg | $230,768.11 |
| emicizumab | 16 Nov 2017 | Genetic Disorders | Chronic Use (1 year) | Adult & Pediatric | 4830 mg | $523,352.19 |
| evinacumab-dgnb | 11 Feb 2021 | Genetic Disorders | Chronic Use (1 year) | Adult & Pediatric | 12,600 mg | $399,262.34 |
| ibalizumab-uiyk | 6 Mar 2018 | HIV | Chronic Use (1 year) | adult | 21,120 mg | $128,579.61 |
| inebilizumab-cdon | 11 Jun 2020 | Genetic Disorders | Cycles | adult | 600 mg | $269,277.83 |
| inotuzumab ozogamicin | 17 Aug 2017 | Oncology | Cycles | adult | 11.4 mg | $258,152.31 |
| lanadelumab | 23 Aug 2018 | Other | Cycles | Adult & Pediatric | 7800 mg | $614,046.02 |
| loncastuximab tesirine-lpyl | 23 Apr 2021 | Oncology | Cycles | adult | 73.5 mg | $168,218.08 |
| luspatercept-aamt | 8 Nov 2019 | Genetic Disorders | Cycles | Adult | 1213 mg | $175,989.95 |
| mogamulizumab-kpkc | 8 Aug 2018 | Genetic Disorders | Cycles | adult | 1820 mg | $369,067.53 |
| moxetumomab pasudotox-tdfk | 13 Sep 2018 | Oncology | Cycles | adult | 50.4 mg | $114,368.37 |
| naxitamab-gqgk | 25 Nov 2020 | Oncology | Cycles | Adult & Pediatric | 3780 mg | $1,005,223.62 |
| pegvaliase-pqpz | 24 May 2018 | Genetic Disorders | Chronic Use (1 year) | adult | 1344 mg | $280,740.01 |
| polatuzumab vedotin-piiq | 10 Jun 2019 | Oncology | Cycles | Adult | 756 mg | $85,354.35 |
| ravulizumab-cwvz | 21 Dec 2018 | Genetic Disorders | Chronic Use (1 year) | adult | 21,450 mg | $470,793.46 |
| ropeginterferon alfa-2b-njft | 12 Nov 2021 | Other | Chronic Use (1 year) | adult | 2607 mg | $36,945.53 |
| satralizumab-mwge | 14 Aug 2020 | Genetic Disorders | Chronic Use (1 year) | adult | 1800 mg | $225,320.67 |
| tafasitamab-cxix | 31 Jul 2020 | Oncology | Cycles | adult | 12,618 mg | $77,811.02 |
| tagraxofusp-erzs | 21 Dec 2018 | Oncology | Cycles | Adult & Pediatric | 50,400 mg | $527,034.73 |
| teprotumumab-trbw | 21 Jan 2020 | Other | Short treatment course | adult | 10,500 mg | $321,591.73 |
| vestronidase alfa-vjbk | 15 Nov 2017 | Genetic Disorders | Chronic Use (1 year) | Adult & Pediatric | 2600 mg | $600,633.06 |
| New Molecular Entities | ||||||
| acalabrutinib | 31 Oct 2017 | Oncology | Cycles | adult | 72,000 mg | $184,338.32 |
| amifampridine phosphate | 28 Nov 2018 | Genetic Disorders | Chronic use (1 year) | adult | 7200 mg | $131,934.10 |
| asciminib | 29 Oct 2021 | Oncology | Chronic use (1 year) | adult | 29,200 mg | $220,832.30 |
| avacopan | 7 Oct 2021 | Other | Chronic use (1 year) | adult | 21,900 mg | $178,244.98 |
| avapritinib | 9 Jan 2020 | Oncology | Chronic use (1 year) | adult | 109,500 mg | $400,148.23 |
| belumosudil | 16 Jul 2021 | transplant | Cycles | Adult & Pediatric | 11,560 mg | $30,281.42 |
| belzutifan | 13 Aug 2021 | Genetic Disorders | Chronic use (1 year) | adult | 43,800 mg | $325,696.80 |
| benznidazole | 29 Aug 2017 | Infectious disease | Short treatment course | Pediatric | 15,600 mg | $3604.42 |
| berotralstat | 3 Dec 2020 | Genetic Disorders | Chronic use (1 year) | Adult & Pediatric | 54,000 mg | $492,998.67 |
| binimetinib | 27 Jun 2018 | Oncology | Chronic use (1 year) | adult | 32,400 mg | $140,958.14 |
| brigatinib | 28 Apr 2017 | Oncology | Chronic use (1 year) | adult | 32,400 mg | $171,550.75 |
| brilliant blue g | 20 Dec 2019 | Other | Single-Use | adult | 0.5 mL | $236.60 |
| cannabidiol | 25 Jun 2018 | Genetic Disorders | Chronic Use (1 year) | Pediatric | 288,000 mg | $40,256.90 |
| capmatinib | 6 May 2020 | Oncology | Chronic use (1 year) | adult | 288,000 mg | $237,196.48 |
| casimersen | 25 Feb 2021 | Genetic Disorders | Chronic use (1 year) | Pediatric | 57,600 mg | $934,502.40 |
| copanlisib | 14 Sep 2017 | Oncology | Cycles | adult | 3120 mg | $238,549.30 |
| copper Cu 64 dotatate injection | 3 Sep 2020 | Other | Single-Use | adult | 4 mCi | $3597.22 |
| dacomitinib | 27 Sep 2018 | Oncology | Chronic use (1 year) | adult | 16,200 mg | $477,693.60 |
| decitabine and cedazuridine | 7 Jul 2020 | Oncology | Cycles | adult | 8100 mg | $92,438.35 |
| deflazacort | 9 Feb 2017 | Genetic Disorders | Chronic use (1 year) | Pediatric | 12,960 mg | $122,273.13 |
| deutetrabenazine | 3 Apr 2017 | Genetic Disorders | Short treatment course | adult | 1008 mg | $5484.97 |
| duvelisib | 24 Sep 2018 | Oncology | Cycles | adult | 16,800 mg | $151,526.48 |
| edaravone | 5 May 2017 | Genetic Disorders | Cycles | adult | 7200 mg | $1423.43 |
| elexacaftor, tezacaftor, ivacaftor | 21 Oct 2019 | Genetic Disorders | Chronic use (1 year) | Adult & Pediatric | 36,000 mg | $107,917.40 |
| enasidenib | 1 Aug 2017 | Oncology | Chronic use (1 year) | adult | 36,000 mg | $325,999.90 |
| encorafenib | 27 Jun 2018 | Oncology | Chronic Use (1 year) | adult | 162,000 mg | $140,958.14 |
| entrectinib | 15 Aug 2019 | Oncology | Chronic use (1 year) | Adult & Pediatric | 216,000 mg | $212,437.49 |
| fedratinib | 16 Aug 2019 | Other | Cycles | Adult | 144,000 mg | $265,546.86 |
| fish oil triglycerides | 27 Jul 2018 | Other | Short treatment course | Pediatric | 560 mg | $4563.54 |
| fosdenopterin | 26 Feb 2021 | Genetic Disorders | Chronic use (1 year) | Pediatric | 3285 mg | $480,314.73 |
| fostamatinib | 17 Apr 2018 | Other | Chronic use (1 year) | adult | 72,000 mg | $80,899.72 |
| gilteritinib | 28 Nov 2018 | Oncology | Chronic use (1 year) | adult | 43,200 mg | $288,927.58 |
| givosiran | 20 Nov 2019 | Genetic Disorders | Chronic use (1 year) | adult | 2100 mg | $456,627.56 |
| glasdegib | 21 Nov 2018 | Oncology | Cycles | adult | 33,600 mg | $202,848.56 |
| golodirsen | 12 Dec 2019 | Genetic Disorders | Chronic use (1 year) | Pediatric | 62,400 mg | $1,112,756.85 |
| inclisiran | 22 Dec 2021 | Genetic Disorders | Chronic use (1 year) | adult | 852 mg | $9903.94 |
| infigratinib | 28 May 2021 | Oncology | Cycles | adult | 31,500 mg | $81,753.72 |
| inotersen | 5 Oct 2018 | Genetic Disorders | Chronic use (1 year) | adult | 14,768 mg | $320,887.96 |
| isatuximab | 2 Mar 2020 | Oncology | Cycles | adult | 18,200 mg | $121,634.21 |
| ivosidenib | 20 Jul 2018 | Oncology | Chronic use (1 year) | adult | 180,000 mg | $347,577.05 |
| larotrectinib | 26 Nov 2018 | Oncology | Chronic use (1 year) | Adult & Pediatric | 67,200 mg | $421,192.21 |
| letermovir | 8 Nov 2017 | transplant | Short treatment course | adult | 48,000 mg | $21,299.04 |
| lonafarnib | 20 Nov 2020 | Genetic Disorders | Chronic use (1 year) | Pediatric | 40,800 mg | $1,272,021.04 |
| lonapegsomatropin-tcgd | 25 Aug 2021 | Other | Chronic use (1 year) | Pediatric | 473.2 mg | $24,194.24 |
| lorlatinib | 2 Nov 2018 | Oncology | Chronic use (1 year) | adult | 36,000 mg | $206,176.28 |
| lumasiran | 23 Nov 2020 | Genetic Disorders | Cycles | Adult & Pediatric | 450 mg | $538,575.32 |
| lurbinectedin | 15 Jun 2020 | Oncology | Cycles | adult | 97.3 mg | $165,886.45 |
| lutetium Lu 177 dotatate | 26 Jan 2018 | Oncology | Cycles | adult | 800 mg | $109,902.38 |
| macimorelin acetate | 20 Dec 2017 | Other | Single-Use | adult | 35 mg | $2527.44 |
| maralixibat | 29 Sep 2021 | Genetic Disorders | Chronic use (1 year) | Pediatric | 2357.9 mg | $390,095.94 |
| maribavir | 23 Nov 2021 | infectious disease | Short treatment course | adult | 48,000 mg | $54,103.80 |
| melphalan flufenamide | 26 Feb 2021 | Oncology | Cycles | Adult | 160 mg | $77,064.00 |
| midostaurin | 28 Apr 2017 | Oncology | Cycles | adult | 42,000 mg | $245,594.36 |
| migalastat | 10 Aug 2018 | Genetic Disorders | Chronic use (1 year) | adult | 20,664 mg | $259,499.77 |
| mobocertinib | 15 Sep 2021 | Oncology | Chronic use (1 year) | adult | 53,760 mg | $283,920.00 |
| nifurtimox | 6 Aug 2020 | Infectious disease | Short treatment course | Pediatric | 180 mg | $587.01 |
| niraparib | 27 Mar 2017 | Oncology | Chronic use (1 year) | adult | 108,000 mg | $253,639.89 |
| odevixibat | 20 Jul 2021 | Genetic Disorders | Chronic use (1 year) | Pediatric | 268,800 mg | $299,819.52 |
| osilodrostat | 6 Mar 2020 | Other | Chronic use (1 year) | adult | 5110 mg | $420,155.64 |
| patisiran | 10 Aug 2018 | Genetic Disorders | Cycles | adult | 364 mg | $370,041.32 |
| pegcetacoplan | 14 May 2021 | Genetic Disorders | Chronic use (1 year) | adult | 103,680 mg | $428,687.40 |
| pemigatinib | 17 Apr 2020 | Oncology | Cycles | adult | 2268 mg | $629,000.12 |
| pexidartinib | 2 Aug 2019 | Oncology | Cycles | Adult | 28,8000 mg | $250,372.75 |
| pitolisant | 14 Aug 2019 | Other | Chronic use (1 year) | Adult | 12,816 mg | $143,774.66 |
| pralsetinib | 4 Sep 2020 | Oncology | Chronic use (1 year) | adult | 144,000 mg | $237,332.85 |
| ripretinib | 15 May 2020 | Oncology | Chronic use (1 year) | adult | 54,000 mg | $473,789.61 |
| risdiplam | 7 Aug 2020 | Genetic Disorders | Chronic use (1 year) | Pediatric | 1800 mg | $339,668.66 |
| selpercatinib | 8 May 2020 | Oncology | Chronic use (1 year) | Adult & Pediatric | 115,200 mg | $254,066.72 |
| selumetinib | 10 Apr 2020 | Genetic Disorders | Cycles | Adult & Pediatric | 32,400 mg | $242,091.05 |
| setmelanotide | 25 Nov 2020 | Other | Chronic use (1 year) | Adult & Pediatric | 720 mg | $244,200.05 |
| solriamfetol | 20 Mar 2019 | Other | Chronic use (1 year) | Adult | 27,000 mg | $4172.88 |
| sotorasib | 28 May 2021 | Oncology | Chronic use (1 year) | adult | 292,032 mg | $180,003.02 |
| stiripentol | 20 Aug 2018 | Genetic Disorders | Chronic Use (1 year) | Pediatric | 720,000 mg | $81,491.71 |
| tafamidis meglumine | 3 May 2019 | Other | Chronic use (1 year) | Adult | 28,800 mg | $237,095.41 |
| tafenoquine | 20 Jul 2018 | Infectious disease | Single-Use | adult | 300 mg | $34.24 |
| tucatinib | 17 Apr 2020 | Oncology | Chronic use (1 year) | adult | 216,000 mg | $228,166.71 |
| umbralisib | 5 Feb 2021 | Oncology | Chronic use (1 year) | adult | 292,000 mg | $196,158.30 |
| viltolarsen | 12 Aug 2020 | Genetic Disorders | Chronic use (1 year) | Adult & Pediatric | 268,800 mg | $544,028.87 |
| voxelotor | 25 Nov 2019 | Genetic Disorders | Chronic use (1 year) | Adult & Pediatric | 540,000 mg | $131,723.88 |
| zanubrutinib | 14 Nov 2019 | Oncology | Chronic use (1 year) | Adult | 115,200 mg | $163,564.22 |
| Treatment Cost of New Drugs at Market Entry | Date of Market Entry | Application Type | Orphan | Priority Review | First in Class Drugs | Country of Incorporation | Therapeutic Intent | Treatment Duration | Therapeutic Area | Age Group | |
|---|---|---|---|---|---|---|---|---|---|---|---|
| Treatment Cost of New Drugs at Market Entry | 1 | 0.023 | 0.28 | 0.548 | 0.378 | 0.21 | −0.14 | 0.452 | 0.452 | 0.452 | 0.452 |
| Date of Market Entry | 1 | 0.045 | −0.007 | 0.116 | −0.146 | −0.036 | 0.852 | 0.08 | 0.83 | 0.535 | |
| Application Type | 1 | 0.05 | 0.007 | 0.186 | 0.198 | 0.103 | 0.133 | 0.238 | 0.179 | ||
| Orphan | 1 | 0.381 | 0.202 | 0.053 | 0.079 | 0.154 | 0.623 | 0.159 | |||
| Priority Review | 1 | 0.307 | 0.122 | 0.098 | 0.226 | 0.582 | 0.159 | ||||
| First in Class Drugs | 1 | 0.008 | 0.065 | 0.053 | 0.277 | 0.1 | |||||
| Country of Incorporation | 1 | 0.065 | 0.047 | 0.113 | 0.102 | ||||||
| Therapeutic Intent | 1 | 0.428 | 0.186 | 0.077 | |||||||
| Treatment Duration | 1 | 0.351 | 0.108 | ||||||||
| Therapeutic Area | 1 | 0.332 | |||||||||
| Age Group | 1 |
| Independent Variable | VIF | Increased SE | Tolerance |
|---|---|---|---|
| Year of Market Entry | 1.15 | 1.07 | 0.87 |
| Application Type | 1.24 | 1.11 | 0.81 |
| Orphan | 1.78 | 1.33 | 0.56 |
| Country of Incorporation | 1.08 | 1.04 | 0.92 |
| Priority.Review | 1.84 | 1.35 | 0.54 |
| First in Class Drugs | 1.34 | 1.16 | 0.75 |
| Intent | 1.81 | 1.34 | 0.55 |
| Therapeutic Area | 4.23 | 2.06 | 0.24 |
| Age Group | 1.47 | 1.21 | 0.68 |
| Treatment Duration | 2.24 | 1.5 | 0.45 |
References
- Waxman, H.A. H.R.5238-97th Congress (1981-1982): Orphan Drug Act. 1983. Available online: https://www.congress.gov/bill/97th-congress/house-bill/5238 (accessed on 2 November 2021).
- FAQs about Rare Diseases|Genetic and Rare Diseases Information Center (GARD)—An NCATS Program. Available online: https://rarediseases.info.nih.gov/diseases/pages/31/faqs-about-rare-diseases (accessed on 2 November 2021).
- US Food and Drug Administration. Orphan Drug Act-Relevant Excerpts. Available online: https://www.fda.gov/industry/designating-orphan-product-drugs-and-biological-products/orphan-drug-act-relevant-excerpts (accessed on 5 November 2021).
- Szydlo, R. Office of Orphan Products Development: Financial Incentives for CDER Medical Products. Available online: https://www.fda.gov/media/135236/download (accessed on 11 March 2021).
- Aitken, M.; Kleinrock, M.; Muñoz, E.; Porwal, U. Orphan Drugs in the United States: Rare Disease Innovation and Cost Trends Through 2019. IQVIA. Available online: https://rarediseases.org/wp-content/uploads/2021/03/orphan-drugs-in-theunited-states-NRD-2020.pdf (accessed on 5 November 2021).
- Jayasundara, K.; Hollis, A.; Krahn, M.; Mamdani, M.; Hoch, J.S.; Grootendorst, P. Estimating the clinical cost of drug development for orphan versus non-orphan drugs. Orphanet J. Rare Dis. 2019, 14, 12. [Google Scholar] [CrossRef] [PubMed]
- Orphan Drugs in the United States (Part Two). Available online: https://www.iqvia.com/insights/the-iqvia-institute/reports/orphan-drugs-in-the-united-states-exclusivity-pricing-and-treated-populations (accessed on 14 November 2021).
- Côté, A.; Keating, B. What Is Wrong with Orphan Drug Policies? Value Health 2012, 15, 1185–1191. [Google Scholar] [CrossRef] [PubMed]
- DeMartino, P.C.; Miljković, M.D.; Prasad, V. Potential Cost Implications for All US Food and Drug Administration Oncology Drug Approvals in 2018. JAMA Intern. Med. 2021, 181, 162–167. [Google Scholar] [CrossRef] [PubMed]
- Kesselheim, A.S.; Avorn, J.; Sarpatwari, A. The High Cost of Prescription Drugs in the United States: Origins and Prospects for Reform. JAMA 2016, 316, 858–871. [Google Scholar] [CrossRef]
- Rome, B.N.; Egilman, A.C.; Kesselheim, A.S. Trends in Prescription Drug Launch Prices, 2008-2021. JAMA 2022, 327, 2145–2147. [Google Scholar] [CrossRef]
- Chua, K.P.; Conti, R.M. Out-of-pocket Spending on Orphan Drug Prescriptions among Commercially Insured Adults in 2014. J. Gen. Intern. Med. 2019, 34, 338–340. [Google Scholar] [CrossRef]
- Chua, K.P.; Conti, R.M. Trends in Orphan Drug Spending and Out-Of-Pocket Spending Among US Children, 2013–2018. Health Aff. 2020, 39, 1811A–1811I. [Google Scholar] [CrossRef]
- US Food and Drug Administration. Drugs@FDA: FDA-Approved Drugs. Available online: https://www.accessdata.fda.gov/scripts/cder/daf/index.cfm (accessed on 10 November 2021).
- Curtiss, F.R.; Lettrich, P.; Fairman, K.A. What is the price benchmark to replace average wholesale price (AWP)? J. Manag. Care Pharm. 2010, 16, 492–501. [Google Scholar] [CrossRef] [PubMed]
- Lee, C.H.; Chang, J.; McCombs, J. Specialty Drug Price Trends in the Federal 340B Drug Discount Program. J. Manag. Care Spec. Pharm. 2019, 25, 178–187. [Google Scholar] [CrossRef]
- Miller, K.L.; Fermaglich, L.J.; Maynard, J. Using four decades of FDA orphan drug designations to describe trends in rare disease drug development: Substantial growth seen in development of drugs for rare oncologic, neurologic, and pediatric-onset diseases. Orphanet J. Rare Dis. 2021, 16, 265. [Google Scholar] [CrossRef]
- Consumer Price Index (CPI) Databases: US Bureau of Labor Statistics. Available online: https://www.bls.gov/cpi/data.htm (accessed on 10 November 2021).
- Pomeranz, K. Pharma Orphan Drug Report 2019. Evaluate.com. Available online: https://www.evaluate.com/sites/default/files/media/download-files/EvaluatePharma_Orphan_Drug_Report_2019.pdf (accessed on 2 March 2021).
- Karas, L.; Lu, C.Y.; Agrawal, P.B.; Asgari, M.M. The Impact of the Orphan Drug Act on FDA-Approved Therapies for Rare Skin Diseases and Skin-Related Cancers. J. Am. Acad. Dermatol. 2019, 81, 867–877. [Google Scholar] [CrossRef]
- Drummond, M.F.; Wilson, D.A.; Kanavos, P.; Ubel, P.; Rovira, J. Assessing the economic challenges posed by orphan drugs. Int. J. Technol. Assess Health Care. 2007, 23, 36–42. [Google Scholar] [CrossRef]
- Darrow, J.J.; Avorn, J.; Kesselheim, A.S. FDA Approval and Regulation of Pharmaceuticals, 1983–2018. JAMA 2020, 323, 164–176. [Google Scholar] [CrossRef]
- Kesselheim, A.S.; Wang, B.; Franklin, J.M.; Darrow, J.J. Trends in utilization of FDA expedited drug development and approval programs, 1987-2014: Cohort study. BMJ 2015, 351, h4633. [Google Scholar] [CrossRef] [PubMed]
- Orphan Drug Utilization and Pricing Patterns (2012–2014). AHIP. Available online: https://www.ahip.org/resources/orphan-drug-utilization-and-pricing-patterns-2012-2014 (accessed on 8 November 2021).
- Divino, V.; DeKoven, M.; Kleinrock, M.; Wade, R.L.; Kaura, S. Orphan Drug Expenditures In The United States: A Historical And Prospective Analysis, 2007–2018. Health Aff. 2016, 35, 1588–1594. [Google Scholar] [CrossRef] [PubMed]
- Murphy, S.M.; Puwanant, A.; Griggs, R.C. Unintended Effects of Orphan Product Designation for Rare Neurological Diseases. Ann. Neurol. 2012, 72, 481–490. [Google Scholar] [CrossRef]
- Bin Sawad, A.; Seoane-Vazquez, E.; Rodriguez-Monguio, R.; Turkistani, F. Price analysis of multiple sclerosis disease-modifying therapies marketed in the United States. Curr. Med. Res. Opin. 2016, 32, 1783–1788. [Google Scholar] [CrossRef] [PubMed]
- Conti, R.M.; Bach, P.B. The 340B Drug Discount Program: Hospitals Generate Profits By Expanding To Reach More Affluent Communities. Health Aff. Proj. Hope 2014, 33, 1786–1792. [Google Scholar] [CrossRef] [PubMed]
- Office USGA. Medicare Part B Drugs: Action Needed to Reduce Financial Incentives to Prescribe 340B Drugs at Participating Hospitals. Available online: https://www.gao.gov/products/gao-15-442 (accessed on 9 November 2021).
- Yang, Y.T.; Chen, B.; Bennett, C.L. Federal 340B Program Payment Scheme for Drugs Designated As Orphan Products: Congressional Clarification Needed to Close the Government-Industry Revolving Door. J. Clin. Oncol. 2016, 34, 4320–4322. [Google Scholar] [CrossRef] [PubMed]
- Lupkin SJT Sydney. Drugmakers Manipulate Orphan Drug Rules To Create Prized Monopolies. Kaiser Health News. 2017. Available online: https://khn.org/news/drugmakers-manipulate-orphan-drug-rules-to-create-prized-monopolies/ (accessed on 9 November 2021).
- Lupkin, S.; Elizabeth, L. Interactive: How Orphan Drugs Win The ‘Monopoly’ Game. Kaiser Health News. 2017. Available online: https://khn.org (accessed on 9 November 2021).
- Cohen, J.P.; Felix, A. Are payers treating orphan drugs differently? J. Mark Access Health Policy 2014, 2, 23513. [Google Scholar] [CrossRef]
- Danzon, P.M. Affordability Challenges to Value-Based Pricing: Mass Diseases, Orphan Diseases, and Cures. Value Health 2018, 21, 252–257. [Google Scholar] [CrossRef]
- Rodriguez-Monguio, R.; Spargo, T.; Seoane-Vazquez, E. Ethical imperatives of timely access to orphan drugs: Is possible to reconcile economic incentives and patients’ health needs? Orphanet J. Rare Dis. 2017, 12, 1. [Google Scholar] [CrossRef] [PubMed]
- Seoane-Vazquez, E.; Rodriguez-Monguio, R.; Szeinbach, S.L.; Visaria, J. Incentives for orphan drug research and development in the United States. Orphanet J. Rare Dis. 2008, 3, 33. [Google Scholar] [CrossRef] [PubMed]
- Grabowski, H.G.; DiMasi, J.A.; Long, G. The Roles Of Patents And Research And Development Incentives In Biopharmaceutical Innovation. Health Aff. 2015, 34, 302–310. [Google Scholar] [CrossRef]
- Worm, F.; Dintsios, C.M. Determinants of Orphan Drug Prices in Germany. PharmacoEconomics 2020, 38, 397–411. [Google Scholar] [CrossRef] [PubMed]
- Jarosławski, S.; Auquier, P.; Toumi, M. No correlation between the prices of oncology orphan drugs in the US and their patient population sizes. J. Cancer Policy 2017, 14, 1–4. [Google Scholar] [CrossRef]

| Drugs Characteristics | Non-Orphan | Orphan | ||||
|---|---|---|---|---|---|---|
| No. (%) | Median Cost (USD 2021) | p Value | No. (%) | Median Cost (USD 2021) | p Value | |
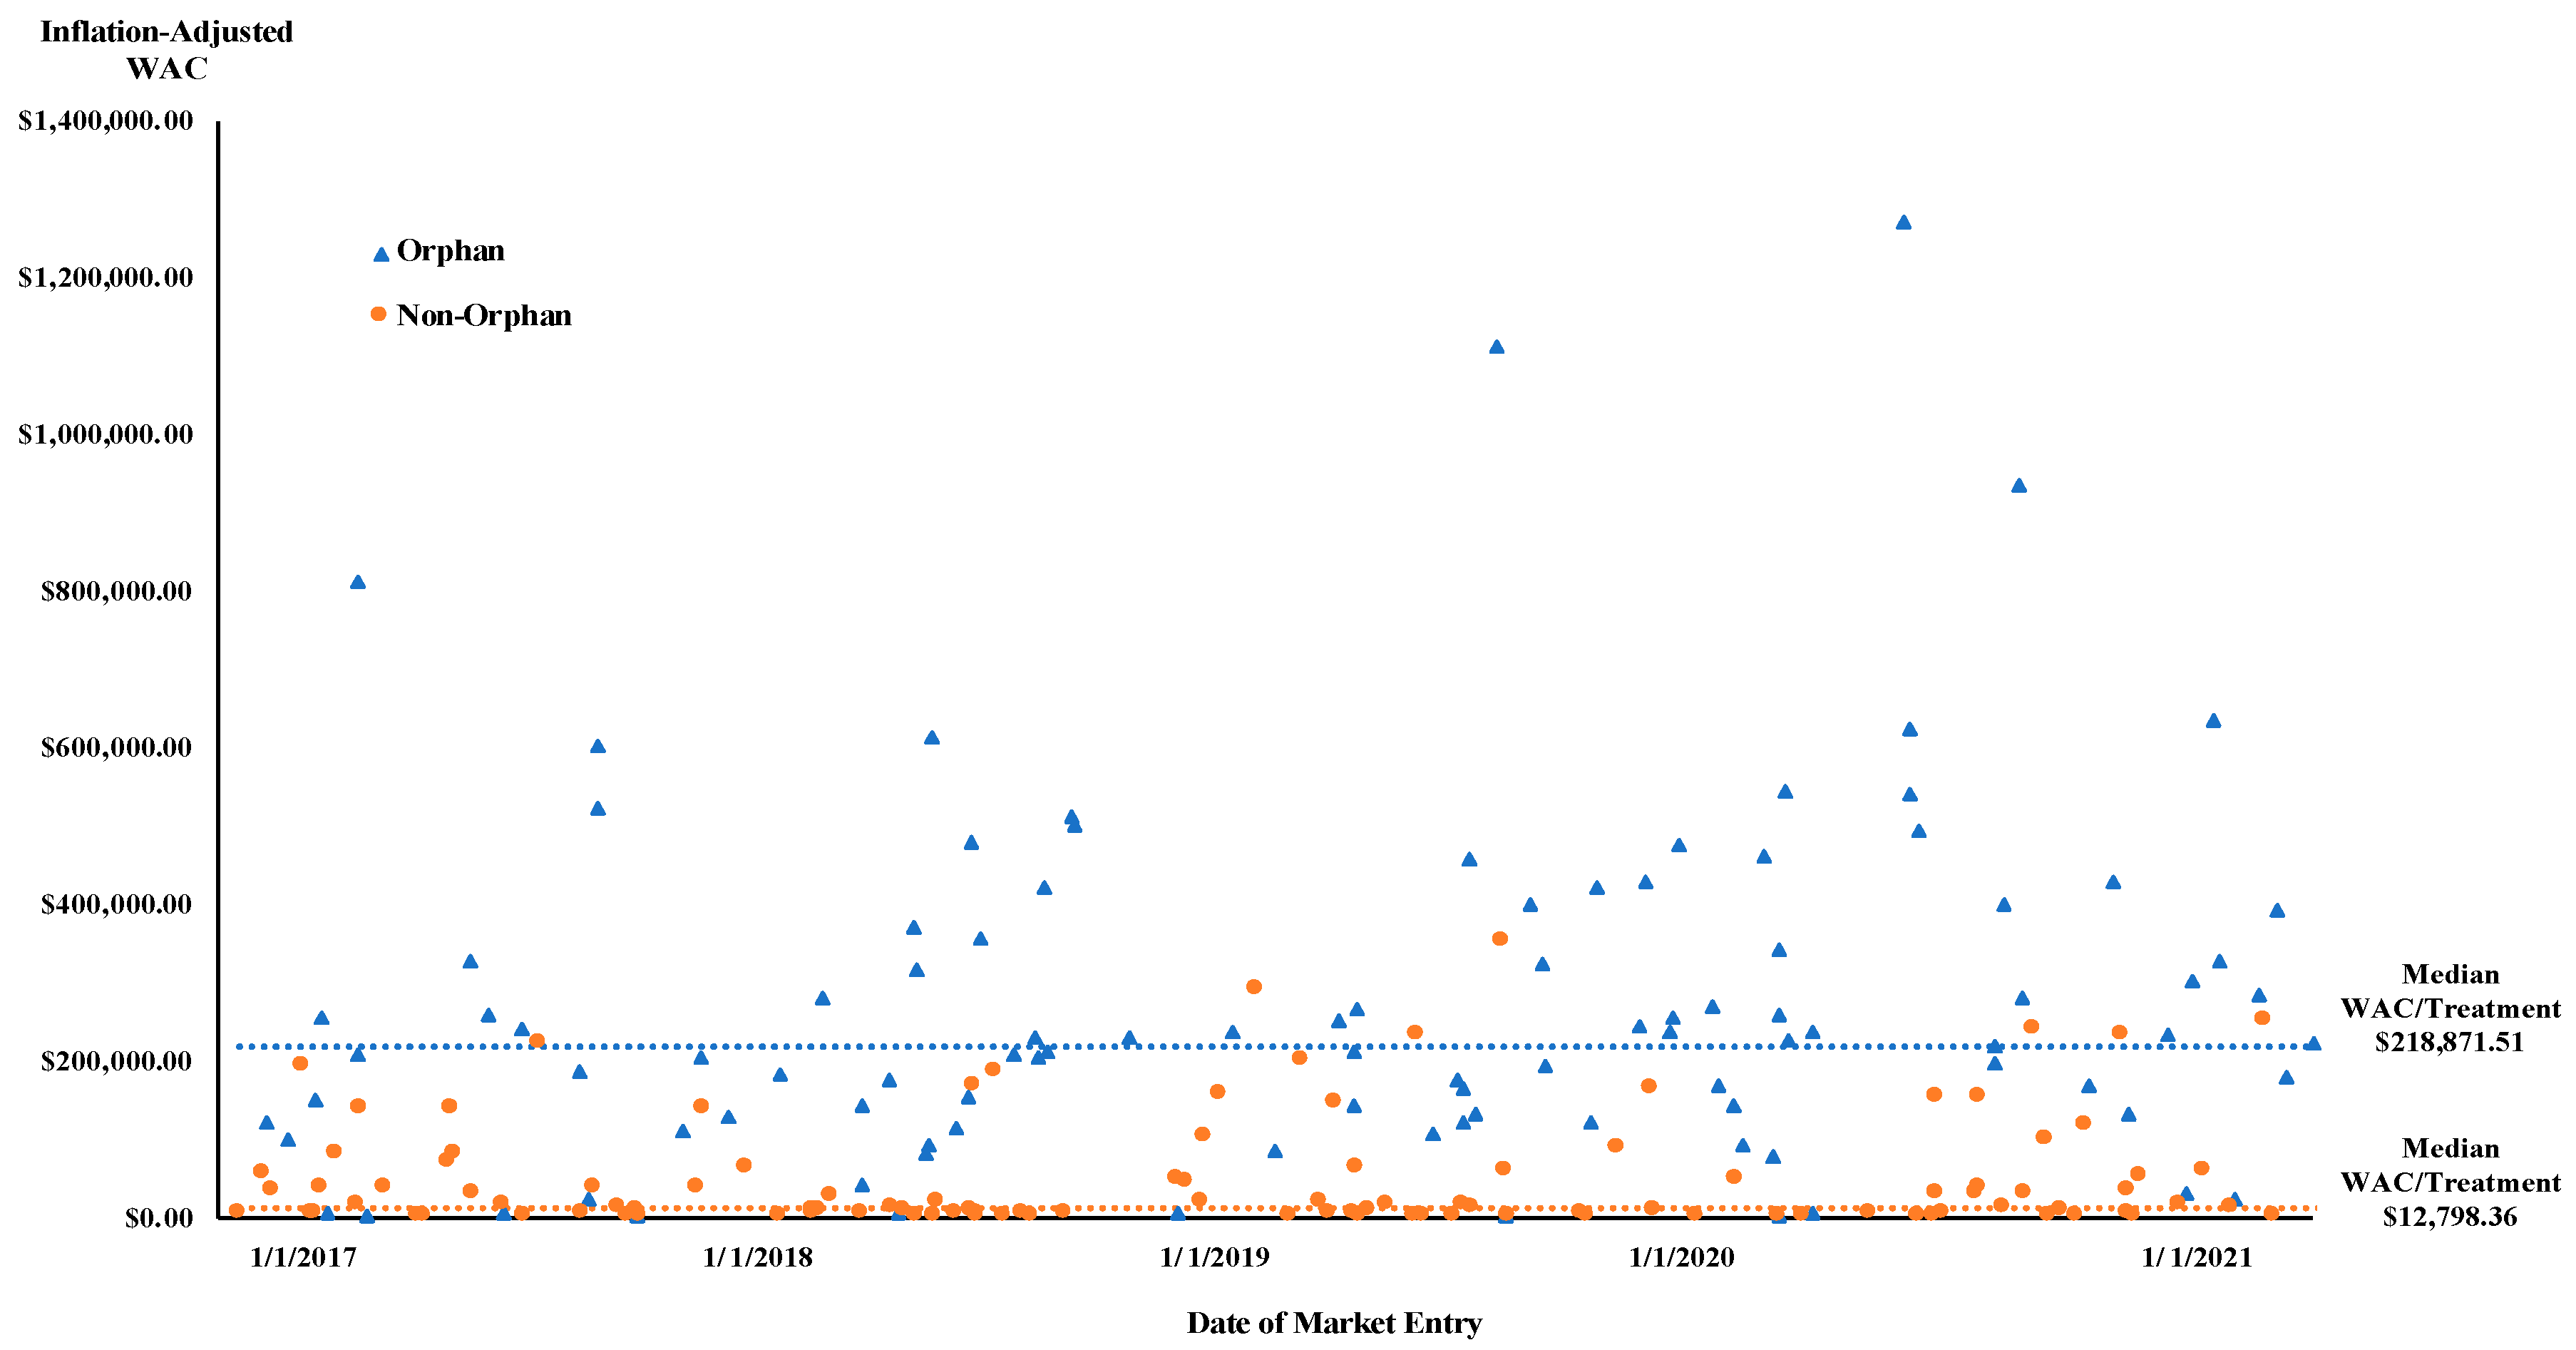
| Total | 124 (51.2%) | $12,798.36 | 118 (48.8%) | $218,871.51 | ||
| Application type | ||||||
| NDA | 95 (53.1%) | $8701.27 | <0.001 | 84 (46.9%) | $206,176.28 | 0.051 |
| BLA | 29 (46.8%) | $61,468.75 | 34 (54.0%) | $264,007.88 | ||
| Combination | ||||||
| Fixed-dose combination | 12 (85.7%) | $30,895.32 | 0.010 | 2 (14.3%) | $100,177.88 | <0.001 |
| Single active ingredient | 112 (49.1%) | $12,111.33 | 116 (50.9%) | $223,076.48 | ||
| Country of Incorporation | ||||||
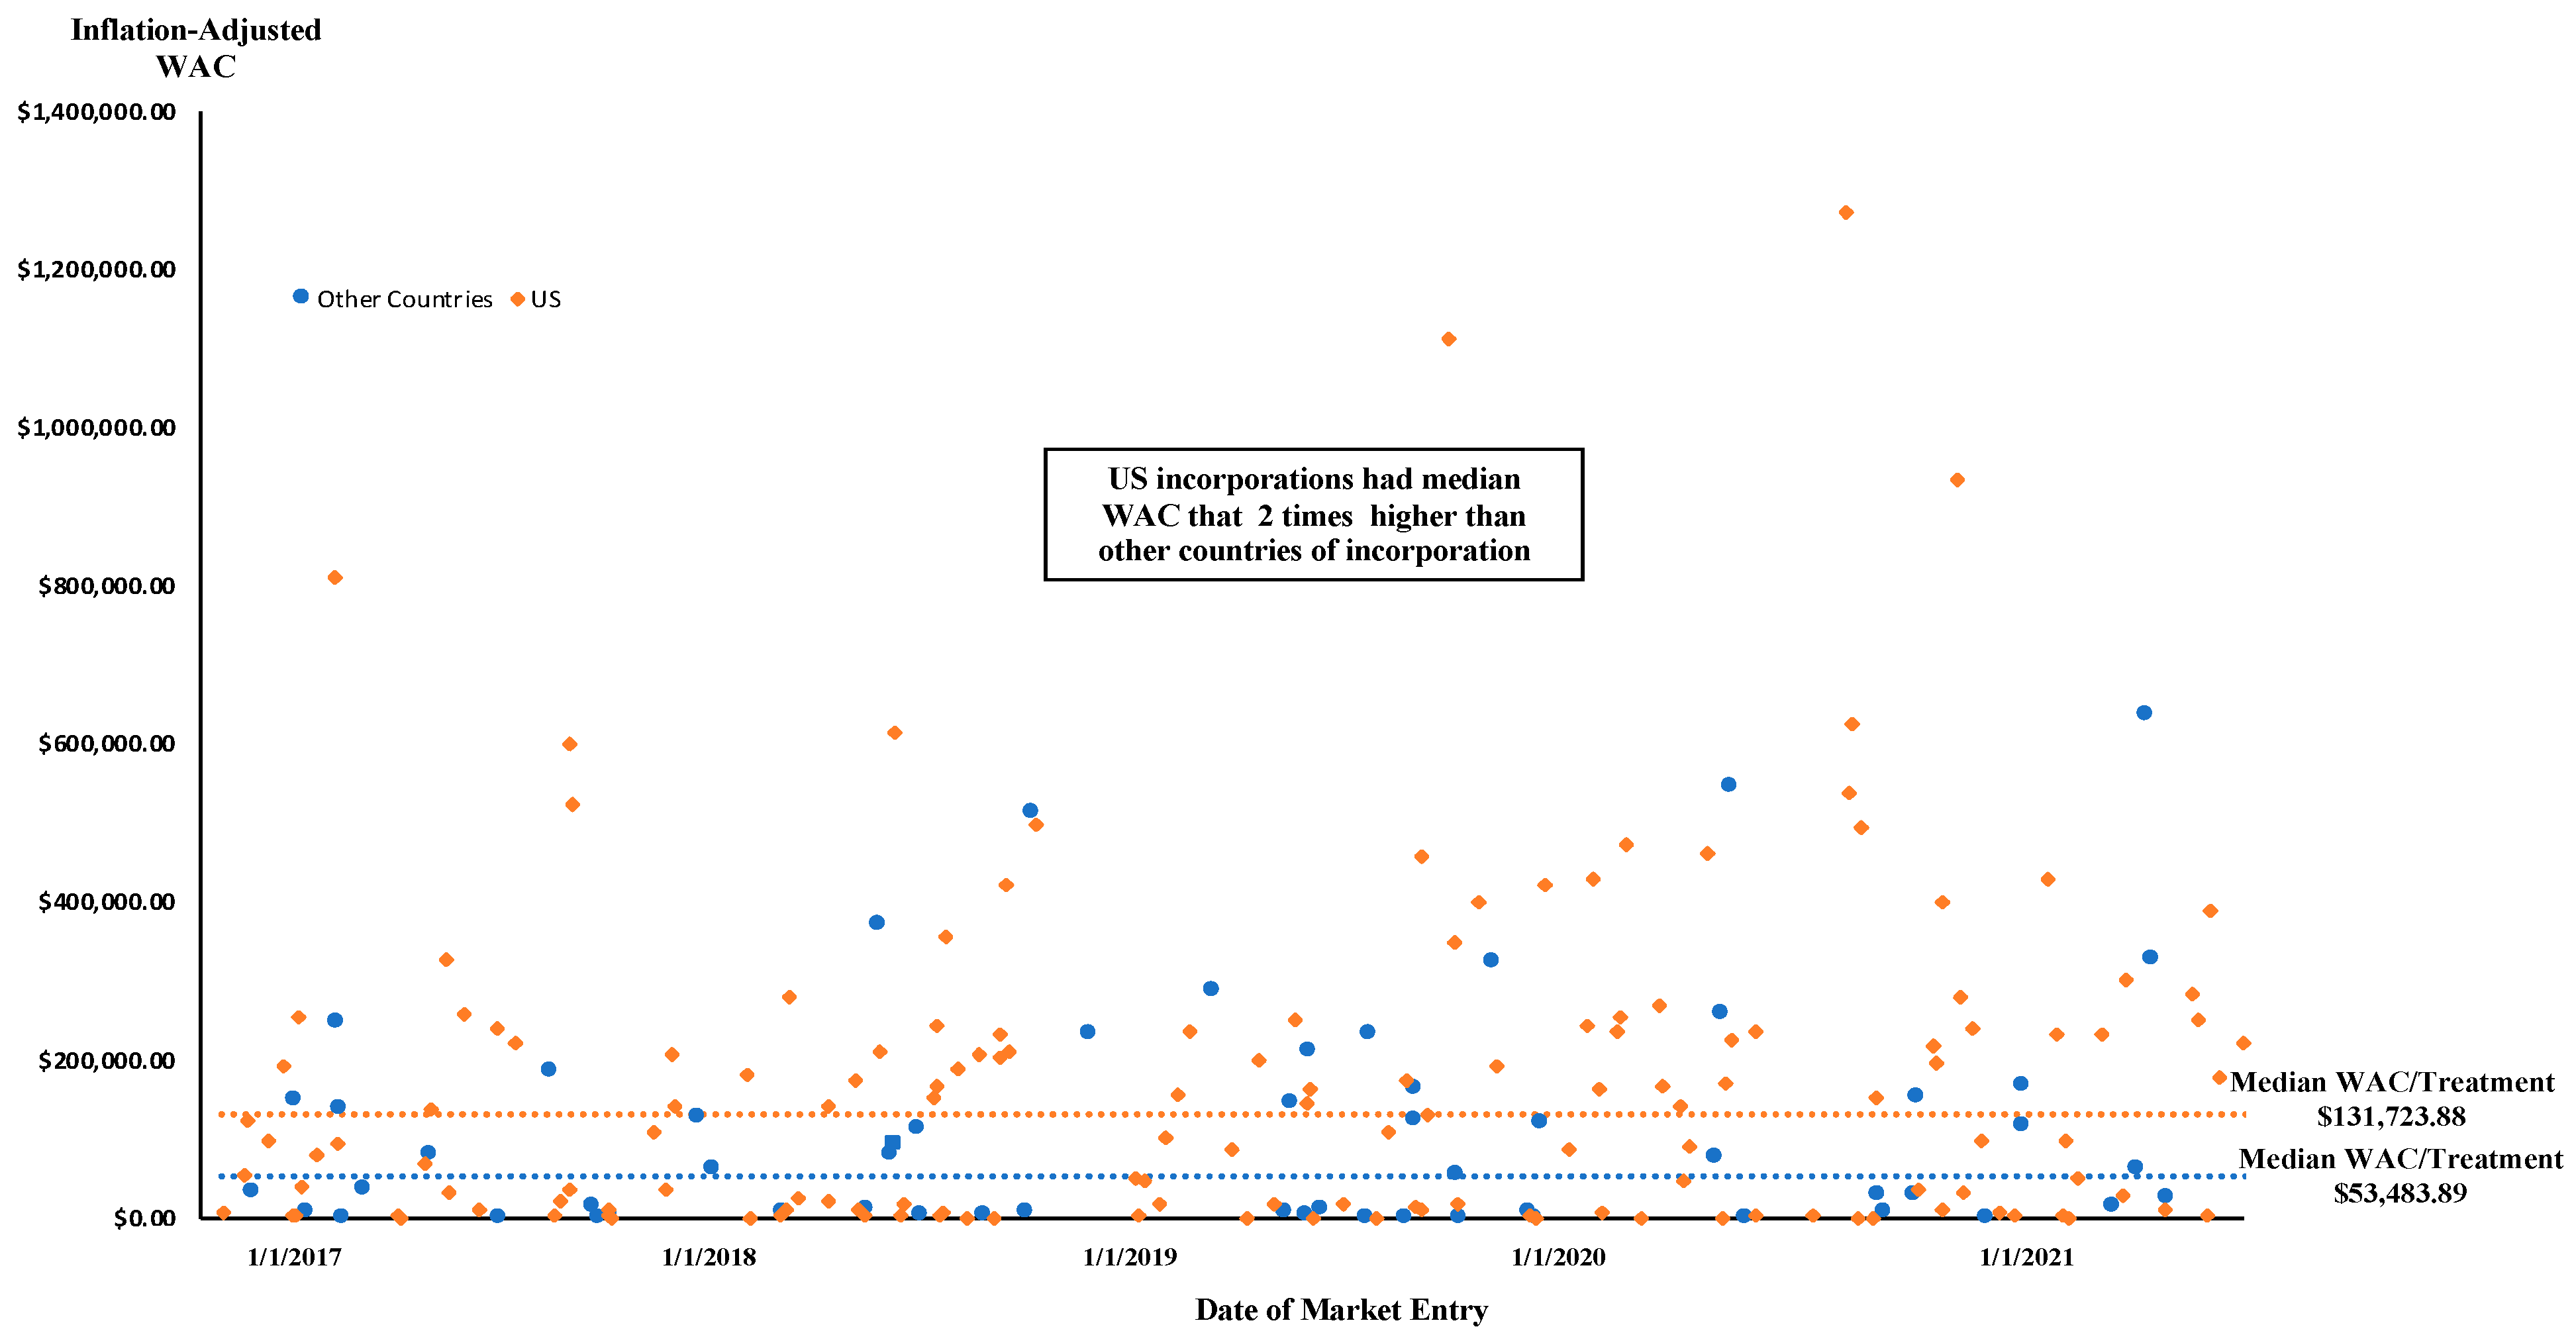
| US | 88 (49.7%) | $15,834.14 | 0.666 | 89 (50.3%) | $237,264.66 | 0.005 |
| Other Countries | 36 (55.4%) | $9483.82 | 29 (44.6%) | $128,579.61 | ||
| First in class | ||||||
| Yes | 40 (40.8%) | $19,252.87 | 0.041 | 58 (59.2%) | $239,593.23 | 0.322 |
| No | 84 (58.3%) | $9483.82 | 60 (41.7%) | $206,176.28 | ||
| FDA review | ||||||
| Priority review | 56 (36.6%) | $29,093.35 | 0.003 | 97 (63.4%) | $233,934.14 | 0.053 |
| Standard review | 68 (76.4%) | $7383.70 | 21 (23.6%) | $142,195.27 | ||
| FDA Designations and Pathways | ||||||
| Accelerated approval | 12 (26.1%) | $163,239.32 | <0.001 | 34 (73.9%) | $209,306.88 | 0.656 |
| Breakthrough therapy | 20 (25.6%) | $102,425.22 | 0.002 | 58 (74.4%) | $242,091.05 | 0.073 |
| Fast track | 35 (40.2%) | $28,677.06 | 0.325 | 52 (59.8%) | $232,237.26 | 0.667 |
| Therapeutic Intent | ||||||
| Diagnosis | 4 (57.1%) | $1274.04 | 0.123 | 3 (42.9%) | $2527.44 | 0.085 |
| Prevention | 11 (64.7%) | $2311.92 | 6 (35.3%) | $71,503.98 | ||
| Treatment | 108 (49.8%) | $18,486.88 | 109 (50.2%) | $230,768.11 | ||
| Therapeutic Area | ||||||
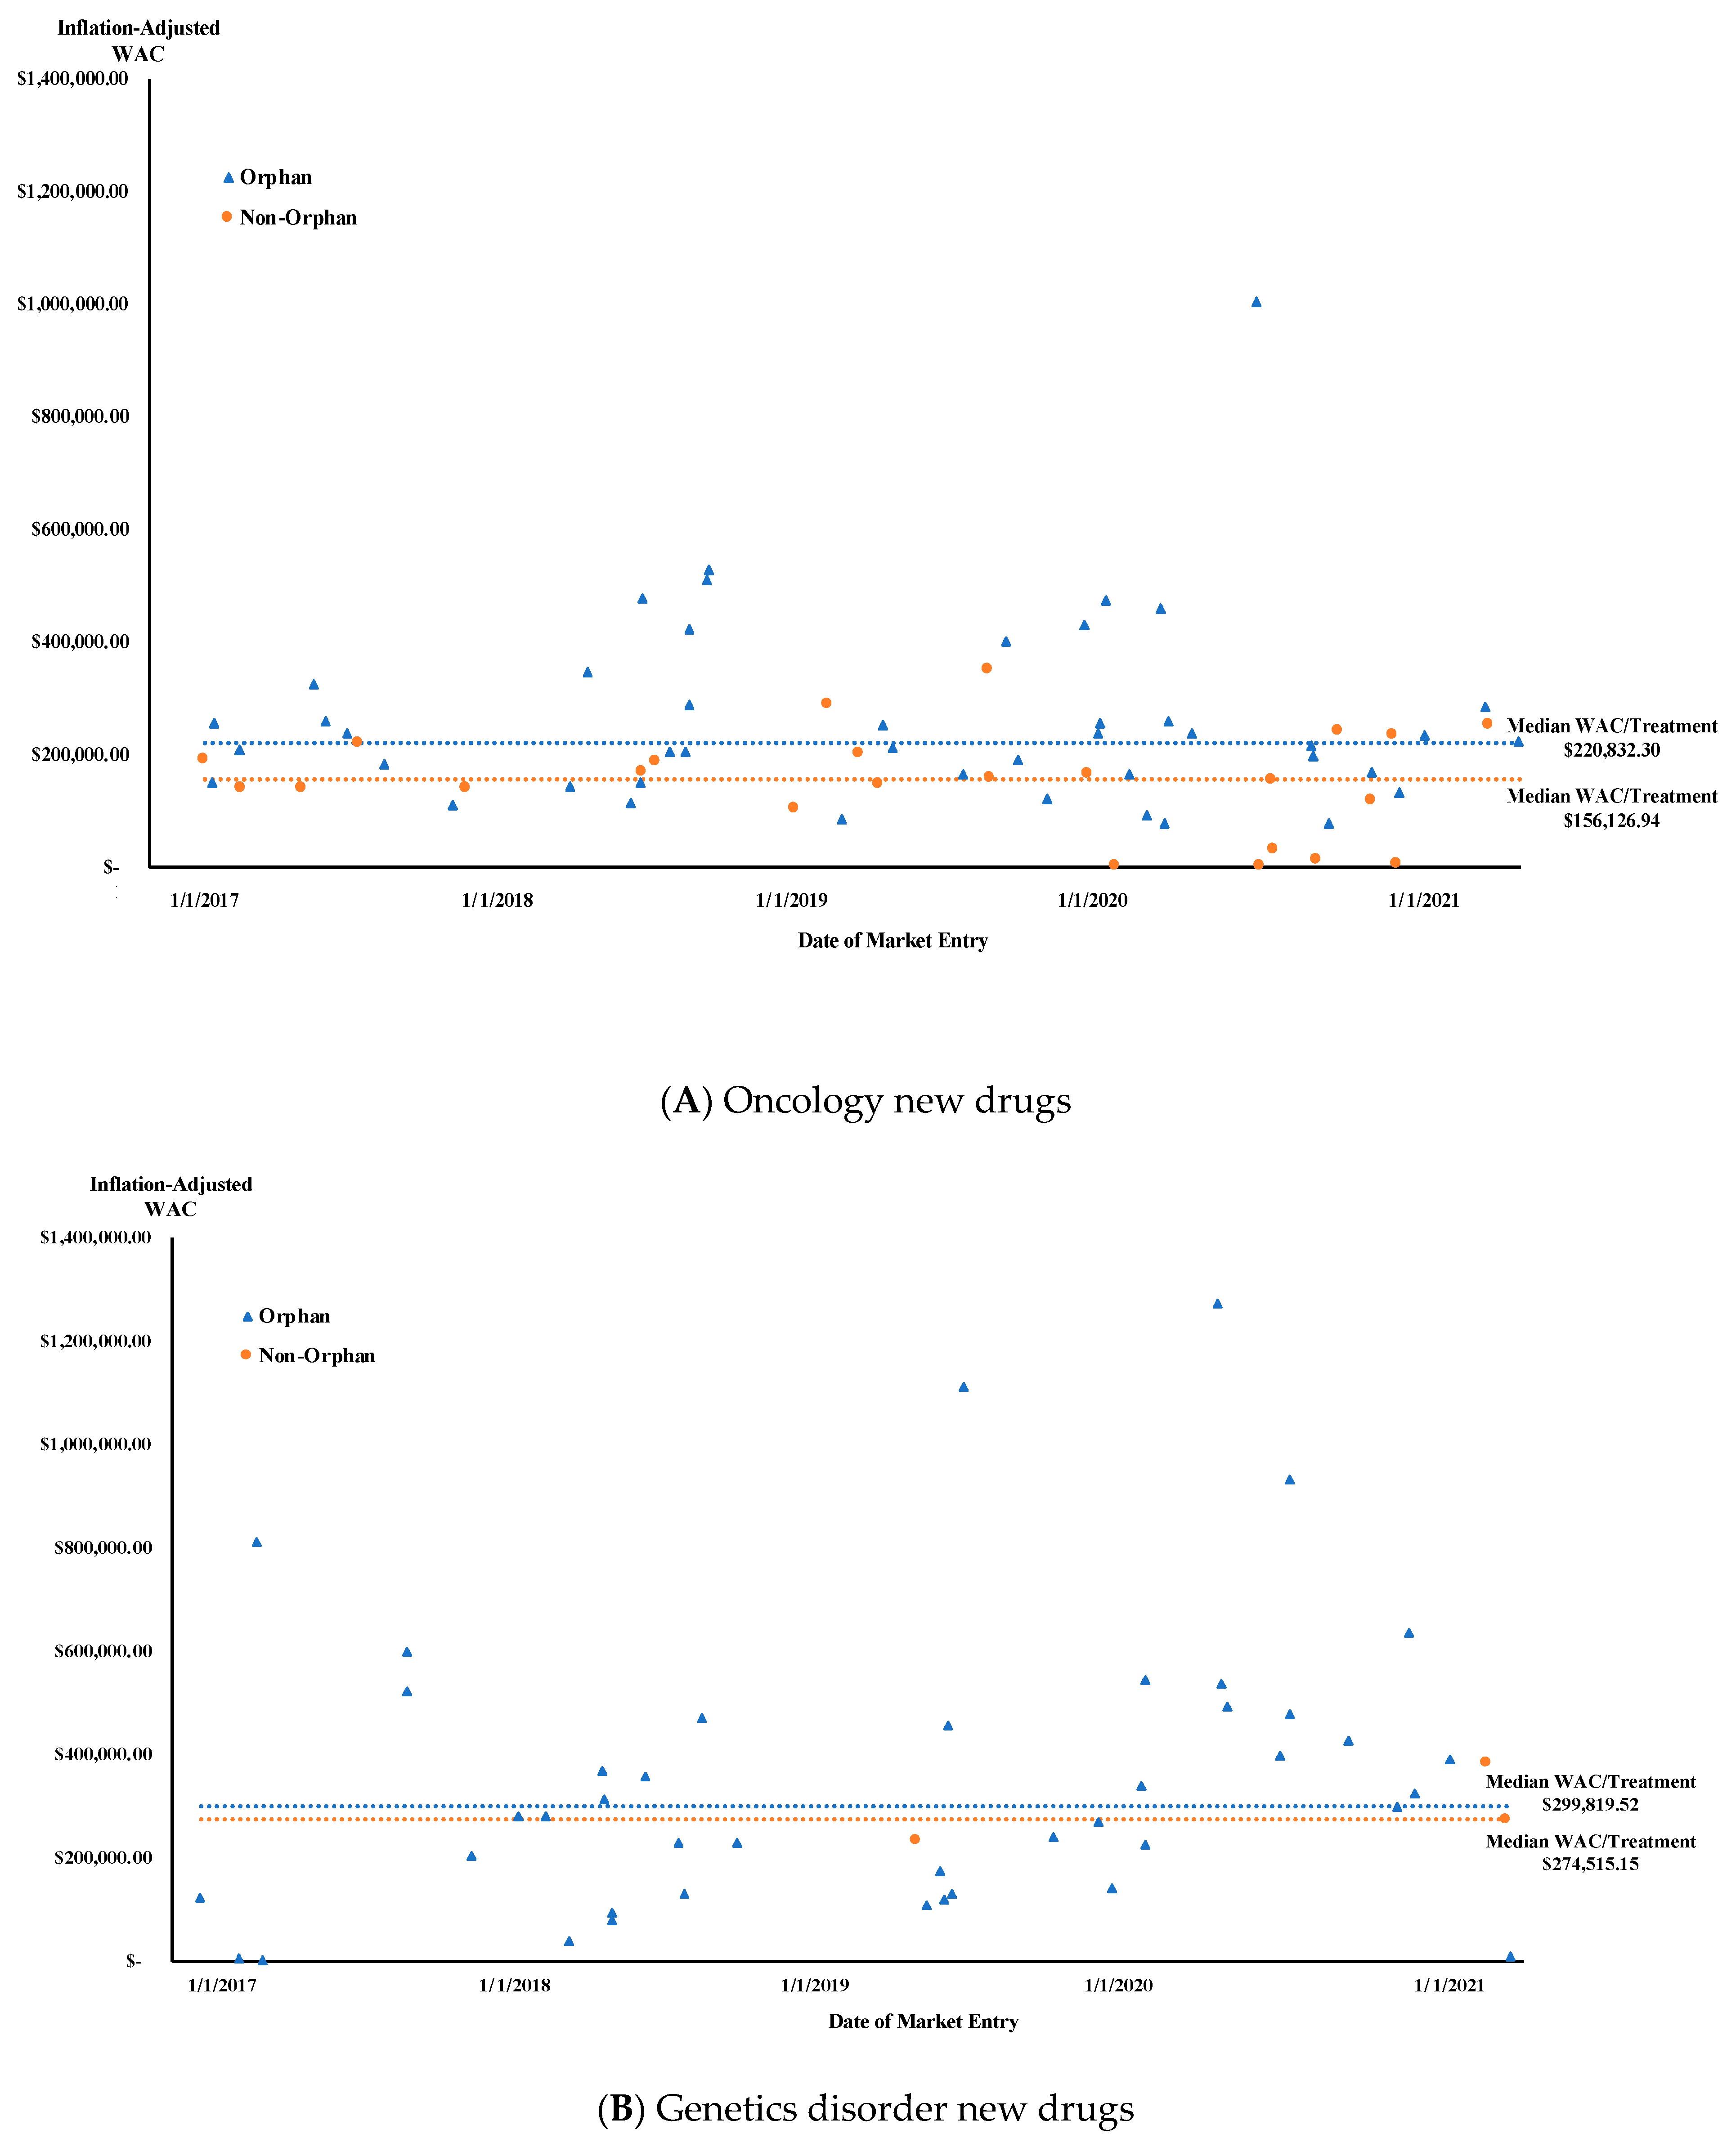
| Genetic disorders | 2 (4.9%) | $290,279.77 | <0.001 | 39 (95.1%) | $274,515.15 | 0.002 |
| HIV | 4 (80.0%) | $37,825.76 | 1 (20.0%) | $36,982.36 | ||
| Infectious diseases | 17 (77.3%) | $3152.25 | 5 (22.7%) | $3207.95 | ||
| Oncology | 27 (36.5%) | $199,370.90 | 47 (63.5%) | $156,126.94 | ||
| Transplant | 0 (0.0%) | $0.00 | 2 (100.0%) | $25,790.23 | ||
| Other | 74 (75.5%) | $9557.37 | 24 (24.5%) | $8411.00 | ||
| Age Group | ||||||
| Adult | 111 (59.7%) | $77,064.00 | 0.019 | 75 (40.3%) | $15,834.14 | <0.001 |
| Pediatric/Adult | 10 (26.3%) | $212,437.49 | 28 (73.7%) | $1067.40 | ||
| Pediatrics | 3 (16.7%) | $211,046.32 | 15 (83.3%) | $35,684.60 | ||
| Treatment Duration | ||||||
| Single use | 15 (75.0%) | $727.85 | 0.011 | 5 (25.0%) | $715.47 | 0.001 |
| Less than one year | 43 (52.4%) | $92,438.35 | 39 (47.6%) | $12,069.44 | ||
| One year or longer | 65 (46.8%) | $130,151.75 | 74 (53.2%) | $23,174.91 | ||
| Independent Variable | Treatment Cost of New Drugs at Market Entry | ||
|---|---|---|---|
| Ratio of Means a | 95% CI | p Value | |
| Date of Market Entry | 1.02 | 0.91–1.15 | 0.722 |
| Application Type (Reference: NDA) | |||
| BLA | 2.10 | 1.39–3.24 | <0.001 |
| Orphan drug (Reference: non-orphan) | |||
| Yes | 2.77 | 1.85–4.17 | <0.001 |
| Country of Incorporation (Reference: US) | |||
| Other Countries | −0.67 | 0.46–0.99 | 0.035 |
| FDA Regulatory Review Approval Pathway (Reference: Standard review) | |||
| Priority review | 1.34 | 0.86–2.07 | 0.188 |
| First in Class Drugs (Reference: non-First in class drug) | |||
| Yes | 1.28 | 0.88–1.87 | 0.187 |
| Intent (Reference: Treatment) | |||
| Diagnosis | −0.30 | 0.09–1.12 | 0.049 |
| Prevention | −0.39 | 0.21–0.80 | 0.005 |
| Therapeutic Area (Reference: Infectious diseases) | |||
| Genetic disorders | 7.08 | 2.86–17.15 | <0.001 |
| HIV | 2.48 | 0.74–10.89 | 0.164 |
| Oncology | 7.98 | 3.81–16.22 | <0.001 |
| Transplant | 1.05 | 0.21–12.55 | 0.961 |
| Other | 2.06 | 0.95–4.29 | 0.047 |
| Patient Population Indication (Reference: Pediatrics) | |||
| Adults | −0.86 | 0.38–1.79 | 0.653 |
| Pediatric/Adult | −0.73 | 0.33–1.54 | 0.402 |
| Treatment Duration (Reference: one year or longer) | |||
| Less than 1 year | −0.77 | 0.51–1.18 | 0.189 |
| Single use | −0.08 | 0.04–0.20 | <0.001 |
Disclaimer/Publisher’s Note: The statements, opinions and data contained in all publications are solely those of the individual author(s) and contributor(s) and not of MDPI and/or the editor(s). MDPI and/or the editor(s) disclaim responsibility for any injury to people or property resulting from any ideas, methods, instructions or products referred to in the content. |
© 2023 by the authors. Licensee MDPI, Basel, Switzerland. This article is an open access article distributed under the terms and conditions of the Creative Commons Attribution (CC BY) license (https://creativecommons.org/licenses/by/4.0/).
Share and Cite
Althobaiti, H.; Seoane-Vazquez, E.; Brown, L.M.; Fleming, M.L.; Rodriguez-Monguio, R. Disentangling the Cost of Orphan Drugs Marketed in the United States. Healthcare 2023, 11, 558. https://doi.org/10.3390/healthcare11040558
Althobaiti H, Seoane-Vazquez E, Brown LM, Fleming ML, Rodriguez-Monguio R. Disentangling the Cost of Orphan Drugs Marketed in the United States. Healthcare. 2023; 11(4):558. https://doi.org/10.3390/healthcare11040558
Chicago/Turabian StyleAlthobaiti, Hana, Enrique Seoane-Vazquez, Lawrence M. Brown, Marc L. Fleming, and Rosa Rodriguez-Monguio. 2023. "Disentangling the Cost of Orphan Drugs Marketed in the United States" Healthcare 11, no. 4: 558. https://doi.org/10.3390/healthcare11040558
APA StyleAlthobaiti, H., Seoane-Vazquez, E., Brown, L. M., Fleming, M. L., & Rodriguez-Monguio, R. (2023). Disentangling the Cost of Orphan Drugs Marketed in the United States. Healthcare, 11(4), 558. https://doi.org/10.3390/healthcare11040558