Article

Development of Machine Learning Model for VO2max Estimation Using a Patch-Type Single-Lead ECG Monitoring Device in Lung Resection Candidates

1
Department of Pulmonary and Critical Care Medicine, Ajou University School of Medicine, Suwon 16499, Republic of Korea
2
Department of Thoracic and Cardiovascular Surgery, Ajou University School of Medicine, Suwon 16499, Republic of Korea
3
Seers Technology Co., Seongnam-si 13558, Republic of Korea
4
Department of Rehabilitation Medicine, Biomedical Research Institute, Pusan National University Hospital, Busan 49241, Republic of Korea
*
Authors to whom correspondence should be addressed.
These authors contributed equally to this work.
Healthcare 2023, 11(21), 2863; https://doi.org/10.3390/healthcare11212863
Submission received: 19 September 2023 / Revised: 27 October 2023 / Accepted: 29 October 2023 / Published: 30 October 2023
(This article belongs to the Section TeleHealth and Digital Healthcare)

Abstract

:
A cardiopulmonary exercise test (CPET) is essential for lung resection. However, performing a CPET can be challenging. This study aimed to develop a machine learning model to estimate maximal oxygen consumption (VO2max) using data collected through a patch-type single-lead electrocardiogram (ECG) monitoring device in candidates for lung resection. This prospective, single-center study included 42 patients who underwent a CPET at a tertiary teaching hospital from October 2021 to July 2022. During the CPET, a single-lead ECG monitoring device was applied to all patients, and the results obtained from the machine-learning algorithm using the information extracted from the ECG patch were compared with the CPET results. According to the Bland–Altman plot of measured and estimated VO2max, the VO2max values obtained from the machine learning model and the FRIEND equation showed lower differences from the reference value (bias: −0.33 mL·kg−1·min−1, bias: 0.30 mL·kg−1·min−1, respectively). In subgroup analysis, the developed model demonstrated greater consistency when applied to different maximal stage levels and sexes. In conclusion, our model provides a closer estimation of VO2max values measured using a CPET than existing equations. This model may be a promising tool for estimating VO2max and assessing cardiopulmonary reserve in lung resection candidates when a CPET is not feasible.

1. Introduction

Lung cancer is the second most commonly diagnosed cancer and the leading cause of cancer-related mortality [1]. Surgical resection is considered the best curative option for lung cancer [2]. However, lung cancer patients are often elderly, have weakened lung function due to smoking, or have underlying medical conditions [3,4]. Although surgery may be feasible based on the cancer stage, some patients opt for alternative treatments due to concerns about post-surgical complications. Fortunately, advancements in surgical techniques and tools have decreased morbidity and mortality rates, and more patients are now eligible for lung resection [5,6].
Before lung resection, the patient’s risk and ability to tolerate the procedure were thoroughly evaluated. This evaluation includes several tests, such as the pulmonary function test, 6-min walking test, and cardiopulmonary exercise test (CPET) [7]. In particular, the CPET helps assess patients’ cardiopulmonary reserve by measuring cardiac output, ventilation, oxygen uptake, and carbon dioxide output during exercise. Therefore, several guidelines recommend it as an important predictor of post-thoracotomy morbidity and mortality in high-stress situations, such as lung surgery and the immediate postoperative period. According to the British Thoracic Society (BTS), American College of Chest Physicians (ACCP), and European Respiratory Society (ERS) guidelines, some patients who are not considered suitable for surgery based on forced expiratory volume in one second (FEV1) and forced vital capacity (FVC), or diffusing capacity of the lung for carbon monoxide (DLco) may still be able to undergo the procedure if the results of the CPET permit it [8,9,10].
The CPET is a reliable method that ensures precise and reproducible results by continuously monitoring multiple parameters in a controlled environment. In particular, guidelines provide standards for measuring oxygen consumption (VO2), such as maximal oxygen consumption (VO2max) [9] and peak VO2 [8,10]. However, owing to the high cost of equipment such as gas analyzers and the need for trained technicians to collect and interpret data, the use of VO2 assessments for risk prediction in clinical practice is limited [11]. To overcome these limitations in utilizing the CPET in clinical settings, two organizations, the American College of Sports Medicine (ACSM) and the Fitness Registry and Importance of Exercise National Database (FRIEND), have developed equations that estimate VO2max using information about patients and their exercise tests [12,13,14]. These equations are frequently employed in evaluating physical activity in patients and clinical studies [15,16].
Recently, with the development of various wearable devices, the evaluation and tracking of an individual’s physical activity have become more accessible. These devices provide valuable information that helps identify a patient’s baseline condition, including daily steps, heart rate, energy expenditure, and cardiorespiratory fitness. An electrocardiogram (ECG) patch is an example of wearable technology used in remote monitoring equipment to track patients’ regular activities or rehabilitation exercises at home and send clinical data to medical staff. Wearable devices play a crucial role in monitoring due to their potential capabilities [17].
This study aimed to develop a machine learning model to estimate VO2max using data collected through a patch-type single-lead ECG monitoring device during maximal exercise tests in patients with pulmonary disease who are candidates for lung resection. Furthermore, the VO2max estimated through the machine learning model and the VO2max obtained through the clinical equations, which are the previously used estimated VO2max equations, were compared with the actual VO2max measured through the CPET. Through this study, we sought to evaluate the usefulness of a machine learning model in estimating VO2max for patients requiring lung resection surgery with limited exercise capacity or when a CPET is not feasible due to resource constraints.

2. Materials and Methods

2.1. Study Design and Subjects

This prospective single-center study was performed at a tertiary teaching hospital in South Korea between October 2021 and July 2022. Eligible participants were adults (aged ≥19 years) who had been diagnosed with cancer through biopsy or were strongly suspected of having cancer without tissue examination results, leading to scheduled lung resection. Only patients who voluntarily agreed to participate in the study were enrolled. Patients with contraindications to a CPET were excluded, including resting O2 saturation levels < 85%, acute coronary insufficiency, uncontrolled arrhythmia, decompensated heart failure, and acute infection [18]. Patients who had previously experienced allergic reactions to the investigational devices or their components were also excluded.
As part of the preoperative evaluation, all patients underwent a CPET. Before starting the CPET, a patch-type single-lead ECG monitoring device (modiCARE-MC100; SEERS Technology, Pyeongtaek-si, Gyeonggi-do, Republic of Korea) was attached to the skin in front of the chest for examination. This wearable device was kept in place until the completion of the CPET. Therefore, all patients were examined by simultaneously attaching the patch-type single-lead ECG monitoring device during the CPET, and the results obtained from the ECG patch were compared with the CPET results, which are considered the gold standard test.

2.2. Cardio-Pulmonary Exercise Test (CPET)

The patients underwent exercise stress testing on a treadmill using a modified Bruce protocol. The treadmill speed and slope were changed every 3 min according to the protocol (Table S1). The exercise test was terminated according to the indications provided by the American Heart Association (AHA) guidelines, such as ischemic ECG changes, sustained ventricular tachycardia, a drop in systolic blood pressure >10 mmHg accompanied by any other evidence of ischemia, moderate-to-severe angina, central nervous system symptoms (e.g., dizziness, near syncope), signs of poor perfusion (cyanosis or pallor), and the subject’s request to stop [19].
A respiratory gas analyzer (Quark PFT; COSMED Co., Rome, Italy), automatic blood pressure and pulse monitor (TANGO M2; SunTech Medical Inc., Morrisville, NC, USA), and treadmill with an ECG monitoring system (T2100-ST2; GE-Marquette Medical Systems, Milwaukee, MI, USA) were used during the CPET.

2.3. Measuring Device (modiCARE-MC100, MC-100)

The MC-100 had two circular electrodes 120 mm apart. It can record a single-lead ECG with a sampling rate of 256 Hz and send real-time ECG recording data to the research smartphone application through Bluetooth. The electrodes were placed at a 45-degree angle from the internipple line, which is considered the optimal location for single-lead ECG monitoring devices [20].
This device also includes a three-axis accelerometer and three-axis gyroscope sensors, which record at a sampling rate of 50 Hz and are utilized to calculate movement and respiration.

2.4. Developing a Machine Learning Algorithm to Predict VO2max

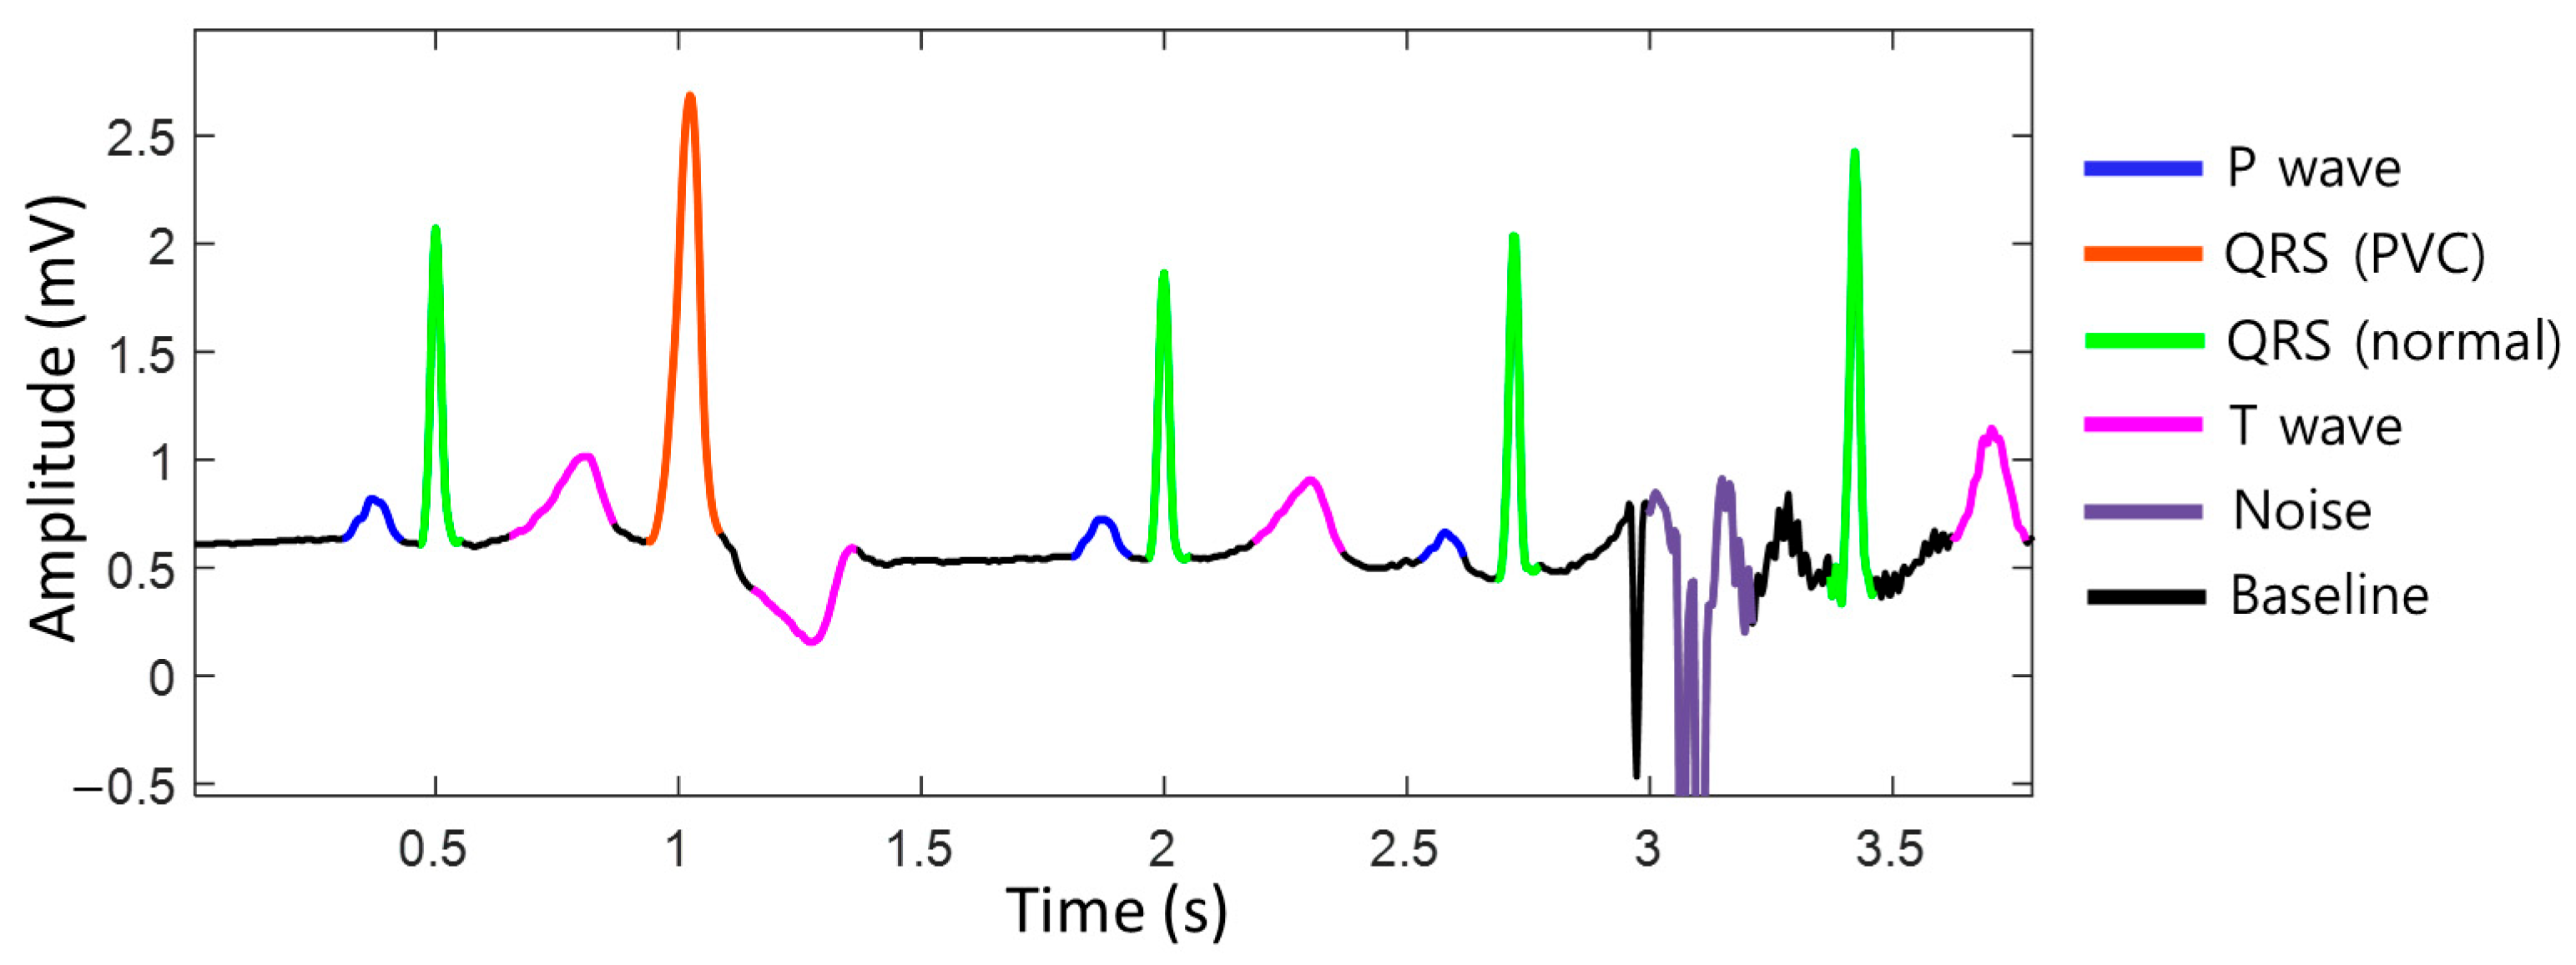
2.4.1. Measurement Variables by MC-100: Heart Rate, Acceleration, and Gyroscope

The MC-100 recorded the heart rate for each heartbeat and measured the acceleration (ACC) and gyroscope (Gyro) at a rate of 50 data points per second. However, the CPET, the reference device, only stores respiratory gas and ECG data once every 15 s. Consequently, we calculated the average heart rate, ACC, and Gyro data over 15 s to extract values at the same intervals as the CPET device.
To achieve accurate heart rate monitoring during exercise, unstructured raw ECG data were standardized into a baseline, p-wave, normal QRS complex, premature ventricular contraction (PVC) QRS complex, T-wave, noise, and fibrillation probabilities on a per-sample basis using deep learning semantic segmentation algorithms (Figure 1). By distinguishing between normal heartbeats and noise, it is possible to accurately assess whether the situation is noise-related, allowing for the measurement of the heart rate that closely approximates the actual heart rate, even during exercise. We utilized the DDRNet-23-slim (Deep Dual-Resolution Networks) architecture, which is a type of semantic segmentation algorithm [21]. This approach allowed us to accurately differentiate between different ECG waveforms using high- and low-resolution feature maps, which are key components of the DDRNet-23-slim model.
The input of this model is set to a 16-s window to capture both local and global features of the ECG. The model parameters are optimized to reflect ECG characteristics. All the data used for training were labeled by medical experts, indicating the start and end points of the baseline, p-wave, normal QRS complex, premature ventricular contraction (PVC) QRS complex, T-wave, noise, and fibrillation (Figure S1).

2.4.2. Feature Selection

We extracted all possible data that could be utilized to develop machine learning models to estimate VO2max and developed a regression model. First, the three items measured by the MC-100 (heart rate, ACC, and Gyro) were checked for correlation with VO2. We found that all three measurements increased as exercise intensity increased and had a correlation coefficient of ≥0.7 (Figure S2). In addition to these, three basic items of information–age, height, and body weight–were also included as variables.
Second, when confirming the correlation between the six variables, the ACC and Gyro showed a high correlation (Figure S3). To avoid multicollinearity, Gyro signals were excluded from the input variables. The removal of highly correlated features enhances the reliability and stability of the model while minimizing the risk of overfitting. As part of the feature selection, we conducted an ablation test to assess the performance of our model by gradually removing the features from the five remaining items. During this process, we obtained regression model evaluation metrics for each combination: R-squared (R2), mean absolute error (MAE), mean squared error (MSE), and root mean square error (RMSE) (Table 1). According to the results, we determined that heart rate, ACC, and body weight were the most practical combinations of features. Finally, we developed regression models that utilized only these three features.

2.4.3. Model Development

We compared seven regression models to evaluate their estimation performance: linear, quadratic, cubic, ridge, lasso, elastic, and random forest. To evaluate and compare the performance of the models, we considered four commonly used metrics in time-series analysis. These metrics included R2 score, MAE, MSE, and RMSE. We found that quadratic regression performed the best; therefore, it was used for model development (Table 2).
We extracted heart rate, ACC, and Gyro data from the MC-100 every 15 s to align with our reference device, the CPET equipment. As a result, the total number of data is 1249, and the 40 participants on average have 31 data per person. Data were randomly split into training and test data in a 4:1 ratio, and the models were internally validated using the test data. The machine-learning models were trained with fivefold cross-validation during the training process, and the test data were used to measure the model performance.

2.4.4. Comparison between the Machine-Learning Model and Clinical Equation

To evaluate the estimation performance of the developed model, it was compared with equations from the American College of Sports Medicine (ACSM), Fitness Registry and Importance of Exercise National Database (FRIEND), and FRIEND equation for patients with heart failure (HF-FRIEND), which are existing formulas for estimating VO2max. These equations have been previously developed and are widely used. The three formulas are as follows:
  • ACSM equation
    VO2max = [speed (m/min) × (0.1 + fractional grade × 1.8) + 3.5];
  • FRIEND equation
    VO2max = [speed (m/min) × (0.17 + fractional grade × 0.79) + 3.5];
  • HF-FRIEND equation
    VO2max = [speed (m/min) × (0.17 + fractional grade × 0.32) + 3.5].
  • The “speed” and “fractional grade” represent the values corresponding to the stage at which the patient achieved their maximum during a CPET conducted according to the modified Bruce protocol.

2.5. Statistical Analysis

The baseline characteristics of the cohort were analyzed using descriptive statistics. Continuous variables were expressed as mean ± standard deviation, while categorical variables were expressed as frequencies (percentages). Statistical significance was determined using two-sided p-values of <0.05, with 95% confidence intervals excluding 0.
The Bland–Altman plot is an analysis based on quantifying the agreement between two quantitative measurements by indicating the mean difference and constructing limits of agreement. The resulting graph is an XY scatter plot, in which the Y-axis shows the difference between the two paired measurements, and the X-axis represents the mean of these measures. In other words, the difference between two paired measurements was plotted against the mean of the two measurements. The plots also indicate the mean differences between two paired measurements and the upper and lower limits of agreement. The limits of agreement were calculated as means ± 1.96 × standard deviation (SD). If the difference between the two methods was within the limits of agreement, it was judged appropriate [22].
The intraclass correlation coefficient (ICC) measures the agreement between the gold standard and tested devices. This provided an estimate of the overall concordance between the two methods. ICC values of ≥0.90 are considered excellent, values of 0.75–0.90 are good, values of 0.60–0.75 are moderate, and values of ≤0.60 indicate low agreement [23].
Descriptive statistics and ICC were analyzed using IBM SPSS Statistics for Windows, Version 29.0. (Armonk, NY, USA: IBM Corp; 2022). Statistical analyses, including classification, clustering, regression, model selection, and preprocessing, were performed using Python 3.6.13 (Reference Manual, Scotts Valley, CA, USA: CreateSpace; 2009) with the sci-kit-learn library (0.24.2).

3. Results

3.1. Baseline Characteristics

A total of 42 patients were enrolled in the study; however, one participant withdrew from the study midway, and another participant had data synchronization issues that made the analysis impossible. Finally, 40 participants were included in the analysis (Figure 2), of whom 24 were males and 16 were females, with an average age of 66.7 years old (Table 3).
Among them, 21 (52.5%) had never smoked, and 19 (47.5%) had a smoking history. Ten patients had chronic obstructive lung disease and six patients had coronary artery disease. A total of 37 patients (92.5%) had Eastern Cooperative Oncology Group performance status scores of 0.

3.2. Pulmonary Function Test (PFT) and CPET

The mean FVC (% predicted), FEV1 (% predicted), and DLCO (% predicted) were 90.7, 88.0%, and 77.7, respectively.
On the CPET, more than half (60%) of the patients reached stage 3, while only two patients advanced to stage 4. The observed maximal heart rate ratio was 87.4% of the predicted maximal heart rate value, and the measured VO2max value was 26.3 ± 5.0 mL·kg−1·min−1.

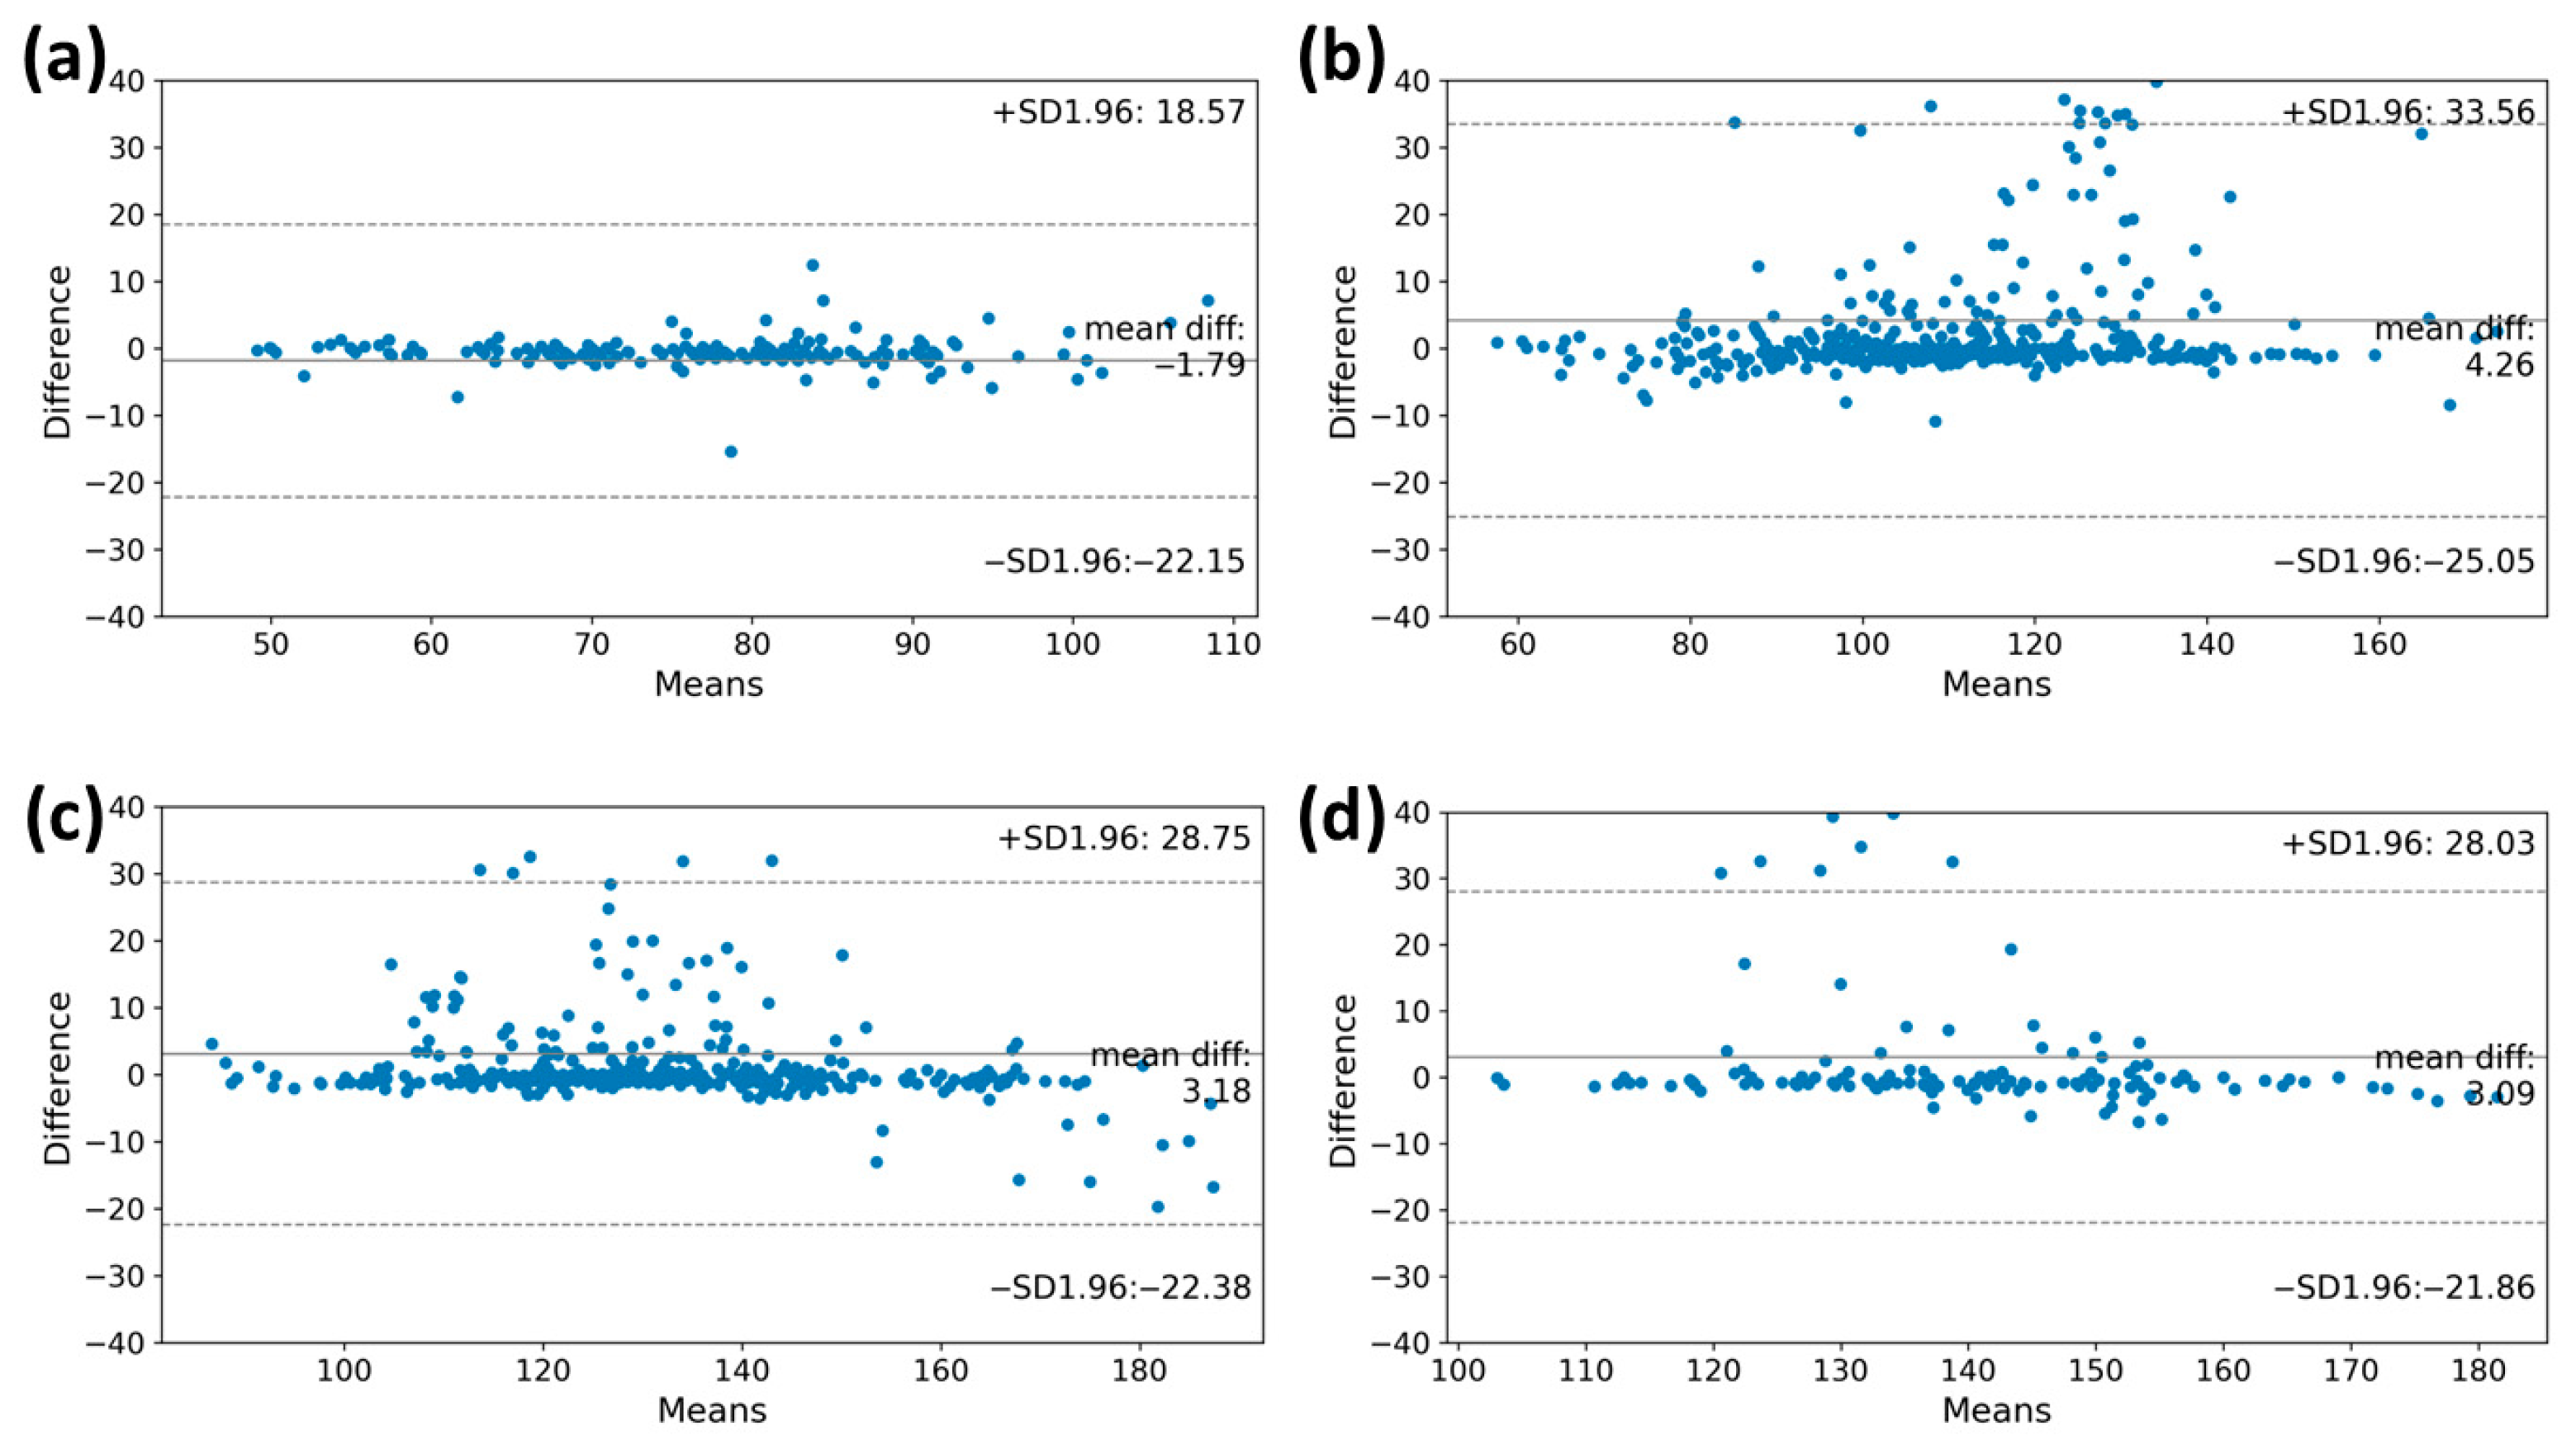
3.3. Heart Rate Accuracy during Graded Exercise Testing

For the high performance of the VO2max estimation model, accurately measuring the heart rate through the MC-100 is crucial. We assessed the degree of agreement of the heart rates obtained using the MC-100 by comparing them with those obtained during the CPET. The Bland–Altman plots in Figure 3 illustrate the degree of agreement between the two methods during the graded exercise testing. A lower difference between the two measurements was observed in the warming-up stage (bias: −1.79 beats/min; limits of agreement: −22.15 beats/min to 18.57 beats/min). As the level goes up, the heart rate value measured through the MC-100 tends to be overestimated as the heart rate increases beyond 100 beats/min (bias: 4.26 beats/min; limits of agreement: −25.05 beats/min to 33.56 beats/min). In stage 2, when the heart rate exceeds 150 beats/min, the MC-100 tends to underestimate the heart rate (bias: 3.18 beats/min; limits of agreement: −22.38 beats/min to 28.75 beats/min). Despite these tendencies, it is important to note that most participants had heart rates within the consensus limits for both monitoring methods.

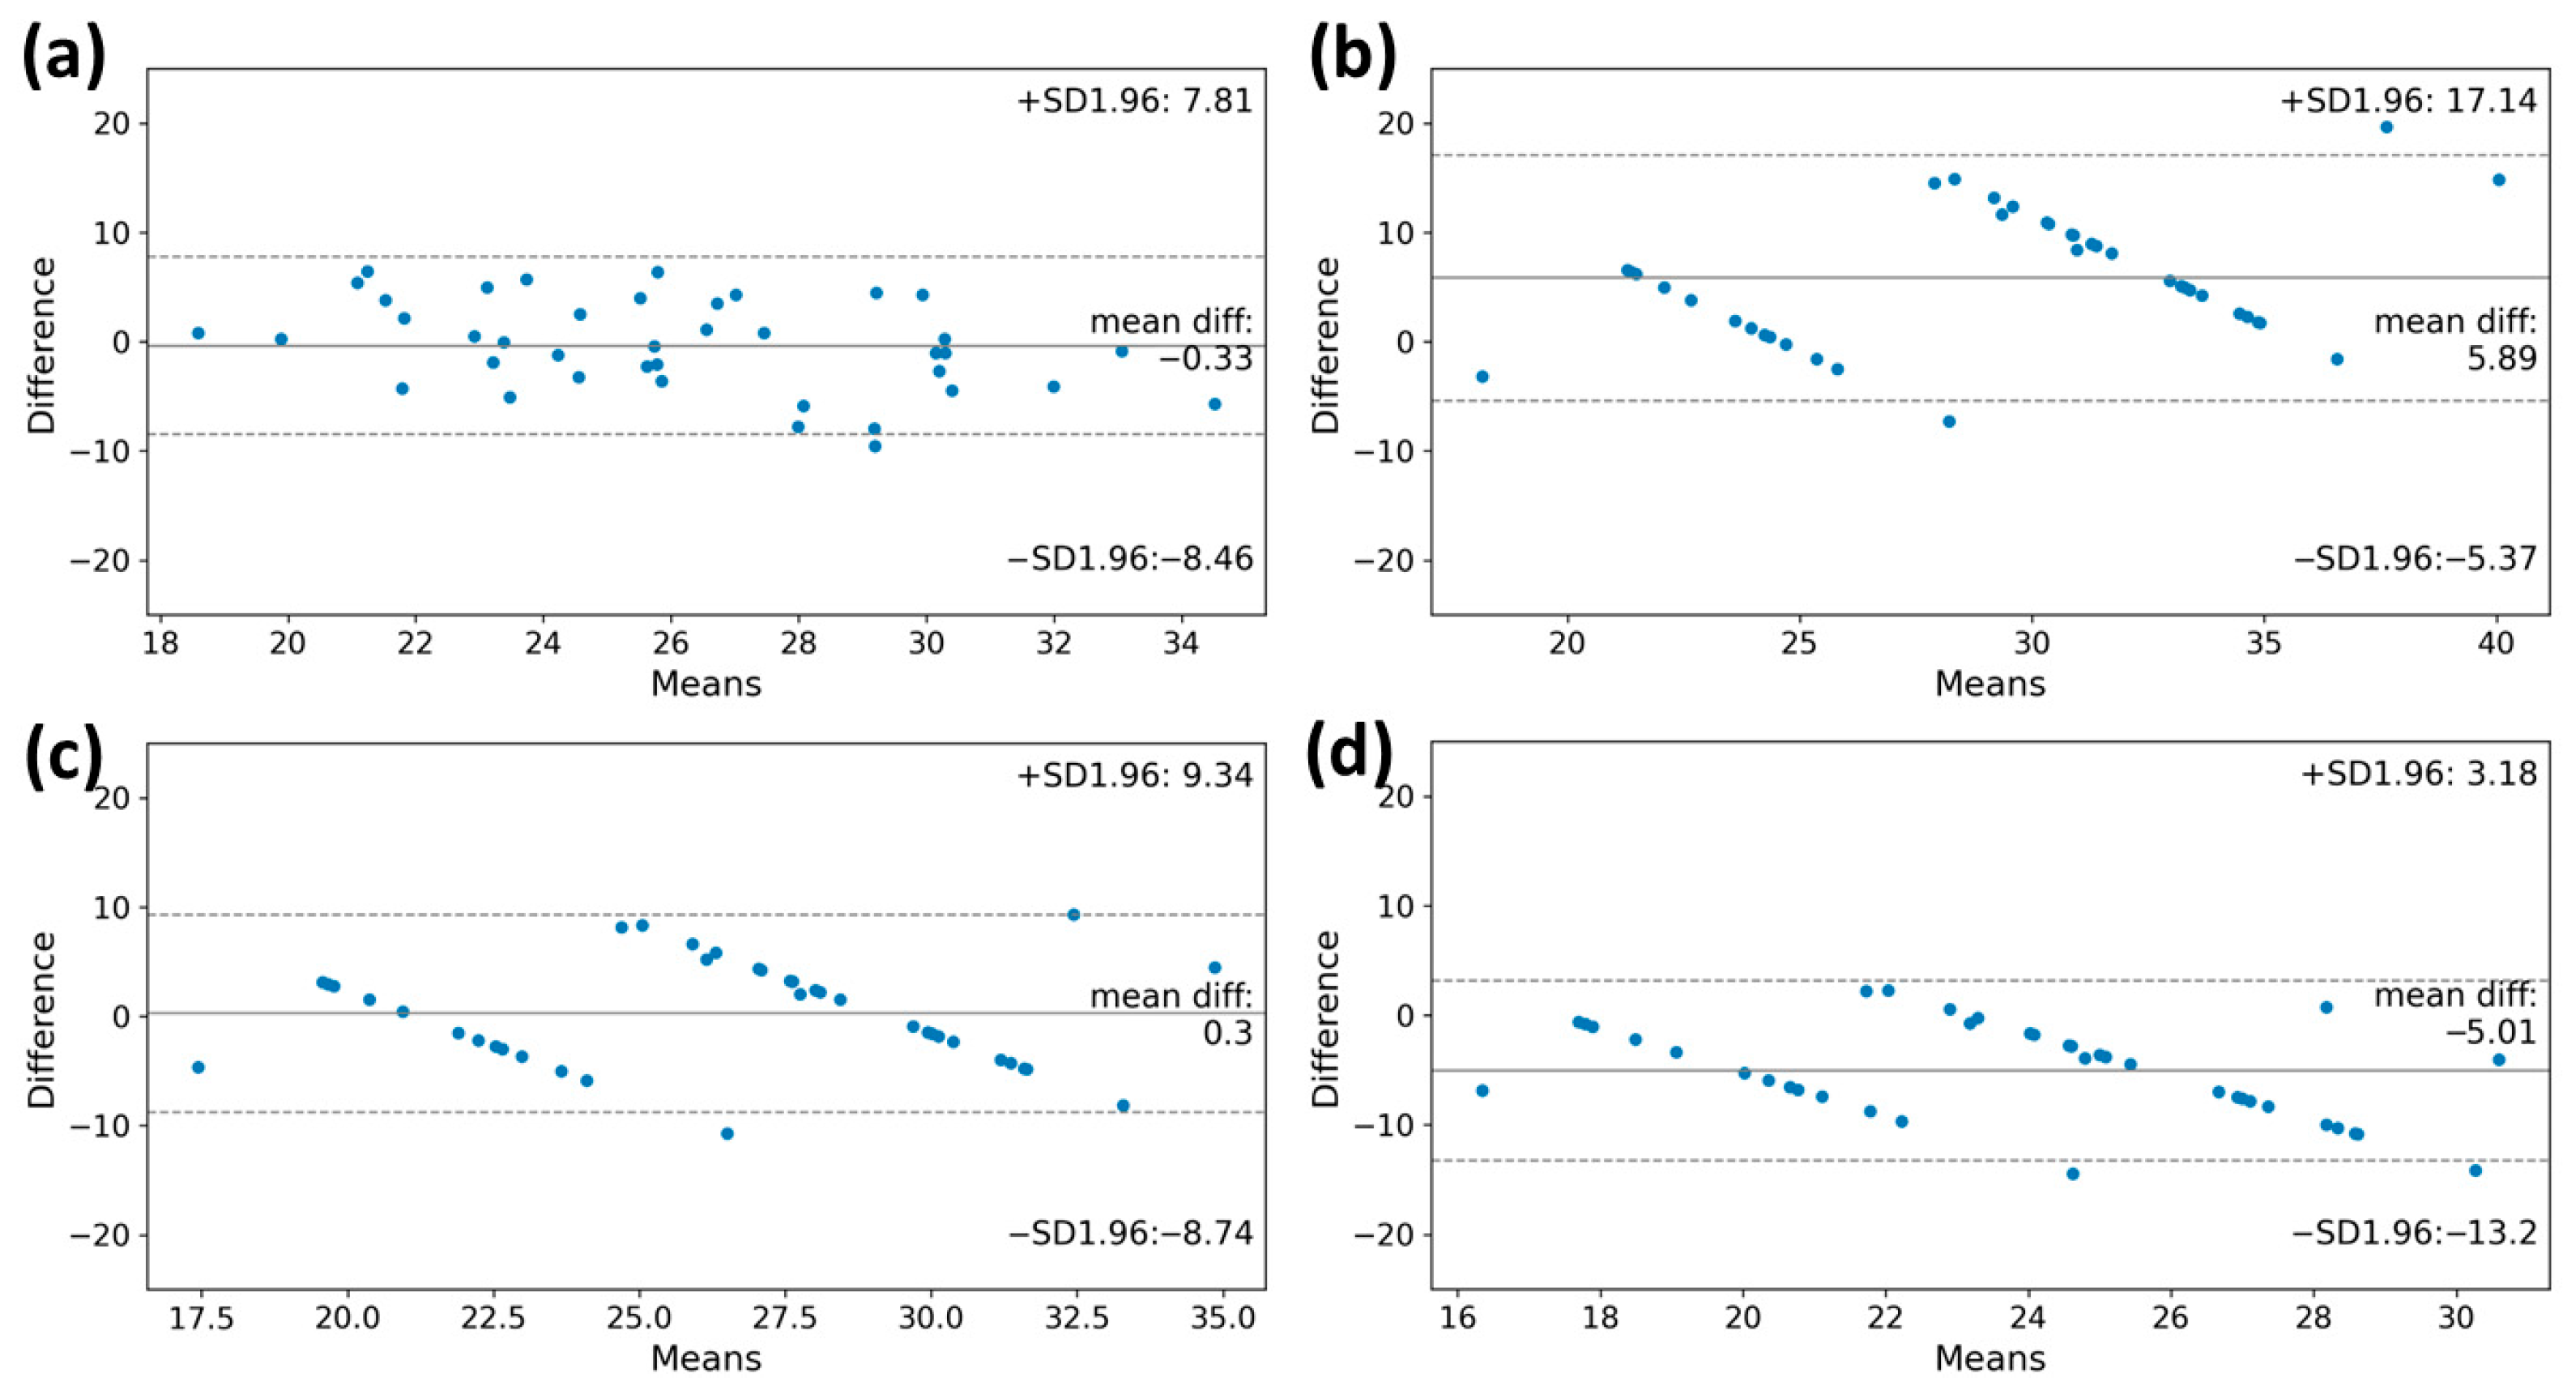
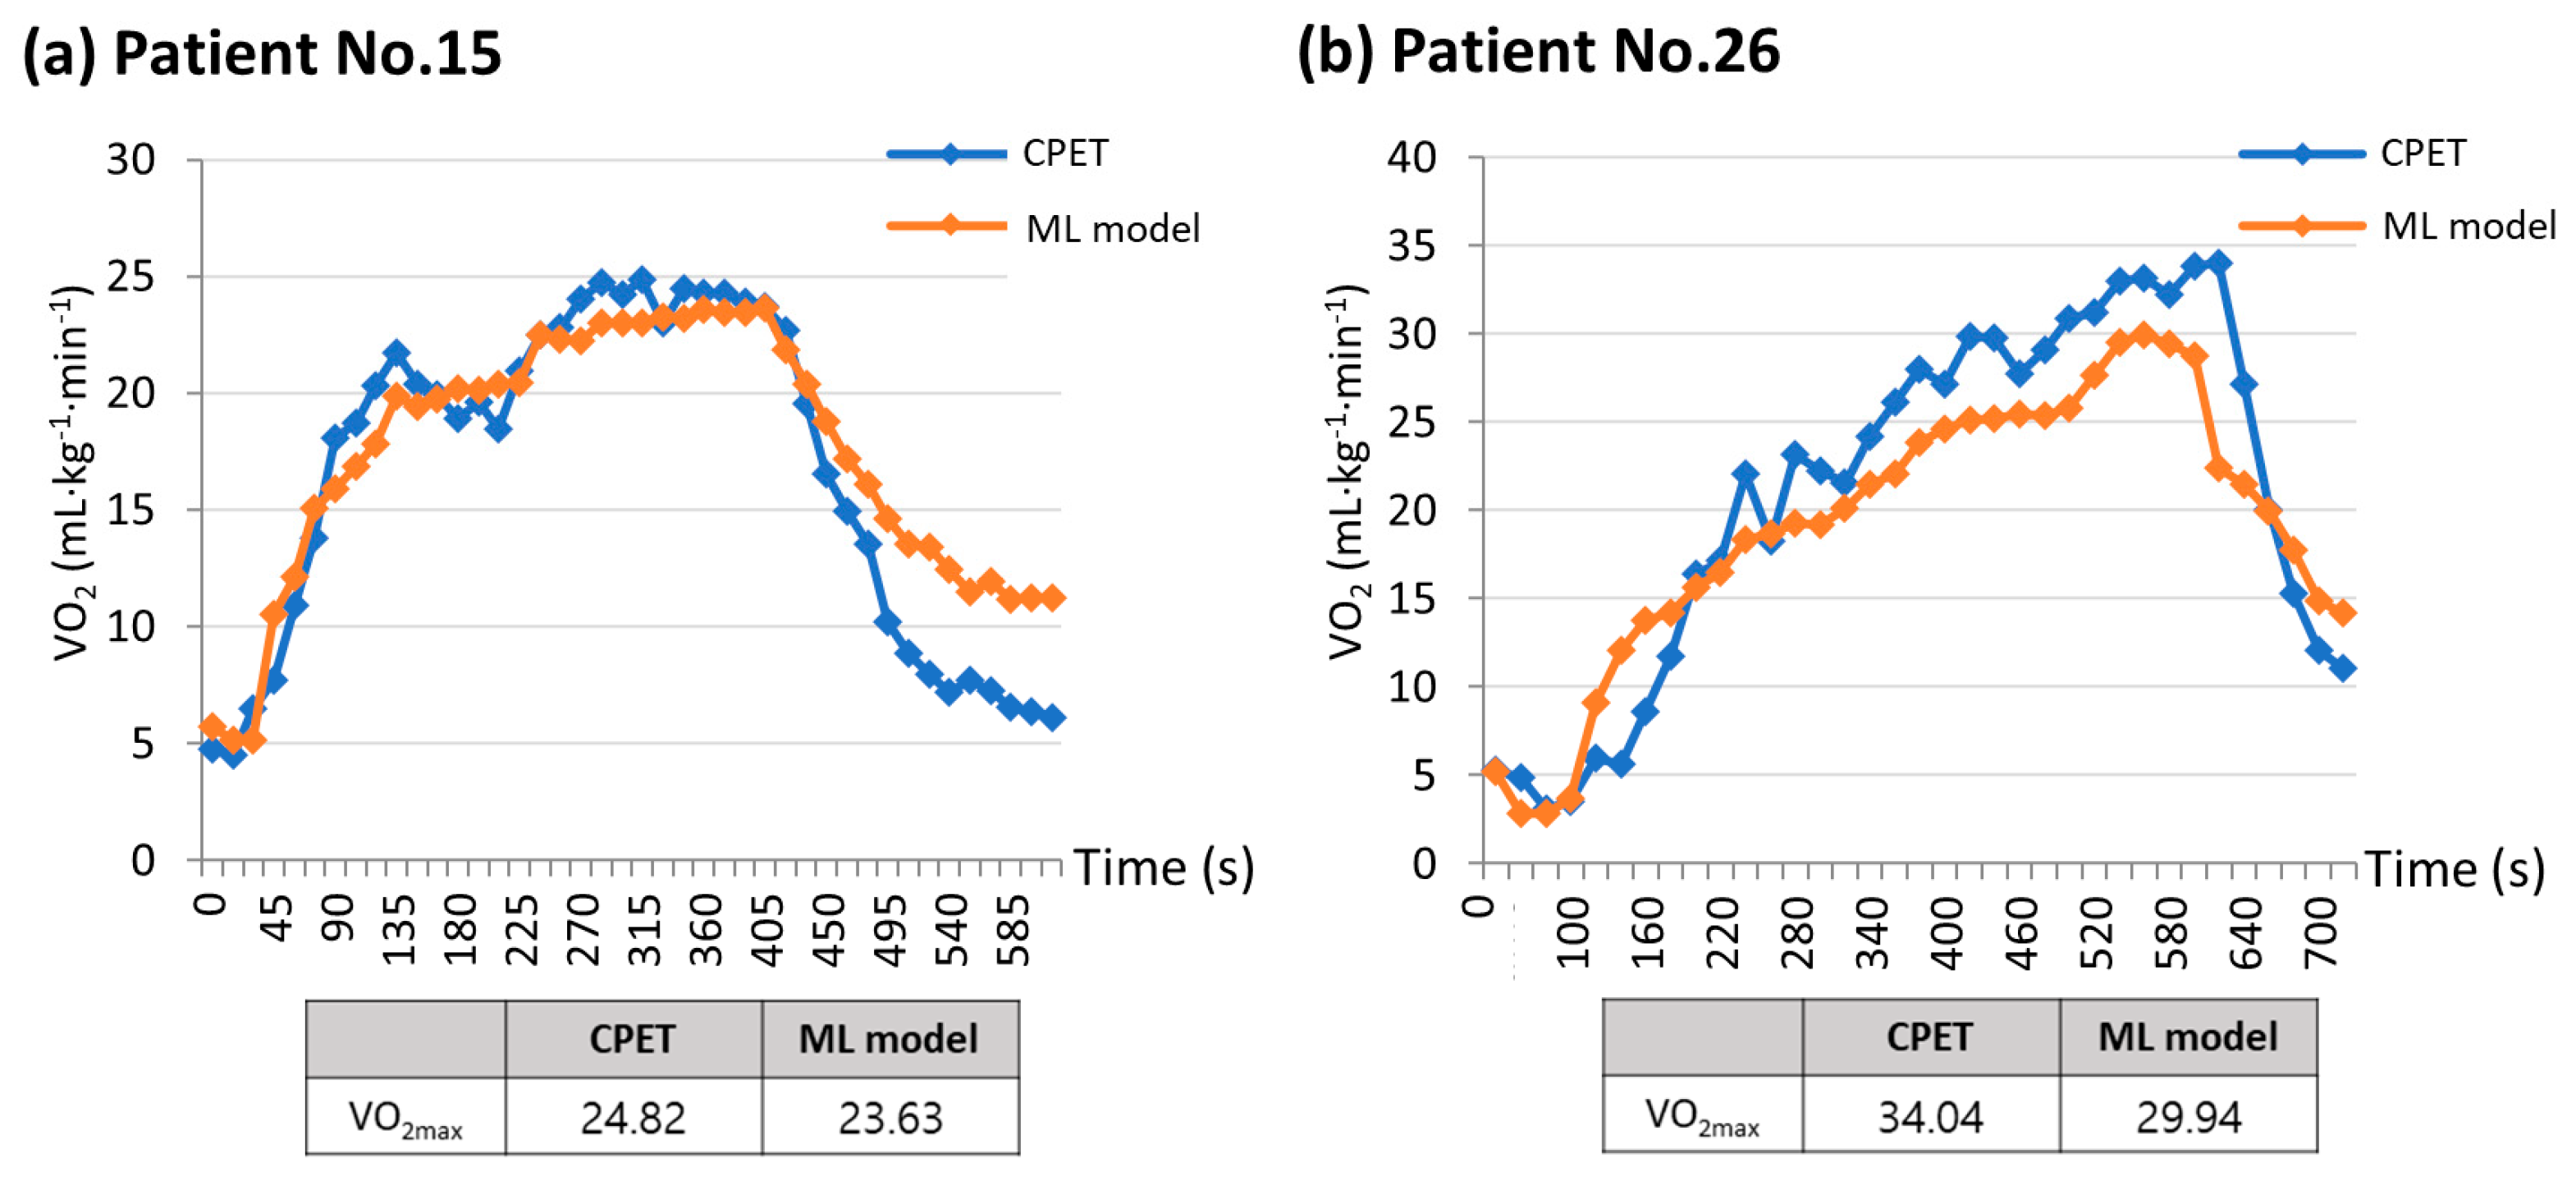
3.4. VO2max Estimation

According to the Bland–Altman plot of measured and estimated VO2max, the VO2max values obtained from the machine learning model and the FRIEND equation showed lower differences from the reference value (bias: −0.33 mL·kg−1·min−1; limits of agreement: −8.46 mL·kg−1·min−1 to 7.81 mL·kg−1·min−1, bias: 0.30 mL·kg−1·min−1; limits of agreement: −8.74 mL·kg−1·min−1 to 9.34 mL·kg−1·min−1, respectively). The VO2max value calculated using the ACSM equation was overestimated compared to the reference (bias: 5.89 mL·kg−1·min−1; limits of agreement, −5.37 mL·kg−1·min−1 to 17.14 mL·kg−1·min−1) (Figure 4). Conversely, the VO2max value derived from the HF-FRIEND equation was found to be underestimated (bias: −5.01 mL·kg−1·min−1; limits of agreement: −13.2 mL·kg−1·min−1 to 3.18 mL·kg−1·min−1).
Similarly, the machine learning model and the FRIEND equation showed a relatively high intraclass correlation coefficient (ICC) for VO2max estimation, with values of 0.693 (95% CI, 0.417–0.838) and 0.708 (95% CI, 0.445–0.846), respectively (Table 4).
Subgroup analysis was performed according to the maximal stage reached by the patient during the CPET and according to sex. For analysis based on the maximum stage the patient reached, the patients were divided, with one group reaching stages 1 or 2 and the other group reaching stages 3 or 4. The machine learning model’s estimated VO2max value showed mean differences of 0.32 mL·kg−1·min−1 and −0.68 mL·kg−1·min−1, respectively, which were more accurate than other equations used for approximating actual VO2max values. In subgroup analysis according to sex, the VO2max values obtained from the machine learning model and the FRIEND equation showed lower differences from the reference value. For further details, please refer to Table 4 and Figure 4.

4. Discussion

This study aimed to develop a machine learning algorithm that can estimate VO2max using a wearable device, a single-lead ECG patch (MC-100), in candidates for lung resection. To assess the level of agreement, we obtained the Bland–Altman plot and intraclass correlation coefficient (ICC) of our machine learning model and three other existing formulas. The results suggest that our model and the FRIEND equation can estimate VO2max more closely than other formulas.
Because lung resection remains the best curative option for lung cancer, a preoperative evaluation is important. A CPET is frequently used to evaluate operability, especially in cases where PFT results are inoperable. Recently, the advancements in wearable technology and the growing attention to measuring physical activity have led to attempts to measure VO2, which requires specialized equipment. Several studies have reported favorable performance in measuring VO2max and VO2peak using a variety of wearable devices, including earbud-based sensors and watches, along with various protocols [24,25,26]. However, as they have predominantly targeted young and healthy adults, they have limitations in terms of their relevance for patient populations that require an evaluation of operability.
More recently, other studies have attempted to measure the VO2max in patients rather than in healthy individuals. Greco et al. studied 31 elderly high-risk surgical patients using the Fitbit Inspire 2 to measure daily steps and VO2max, showing significant correlations (R = 0.56, p = 0.001 and r = 0.58, p = 0.006, respectively) with the actual 6-min walk test results [27]. In a study targeting patients scheduled for major elective intra-abdominal surgery, researchers demonstrated a significant correlation between physical activity levels measured over 7 days using the Garmin Vivosmart HR+ device and actual CPET parameters such as VO2peak [28]. However, no studies have been conducted on patients scheduled for lung resection.
In this study, we developed a machine learning algorithm that can estimate VO2max by utilizing wearable ECG monitoring equipment, MC-100, attached to lung resection candidates during exercise. The MC-100 device accurately measures the heart rate by minimizing the HR noise using its own algorithm. The Bland–Altman plots in Figure 3 show that the heart rates measured by the MC-100 device tended to be lower than those measured by the CPET equipment. However, upon reviewing the actual ECG data, it is clear that the measurements from the MC-100 device are more approximate to the real heart rate (Figure 5). In addition to the closer heart rate, by incorporating acceleration and weight data into the model, it was possible to estimate VO2max, which closely approximated the actual measured values.
VO2max is a reliable indicator of aerobic capacity and cardiorespiratory function. Low levels of cardiorespiratory fitness in cancer patients have been associated with high symptom burden, morbidity, and mortality. However, the limitations of the CPET, which requires specialized equipment and skilled personnel, have restricted its use in clinical practice. Researchers have developed a formula for estimating VO2max using exercise test characteristics. Our study utilized a machine learning model based on information collected using a single-lead ECG monitoring device to estimate VO2max. The model showed a moderate level of agreement, as indicated by an ICC value of 0.693. Compared to other equations, this model demonstrated greater consistency when applied to different maximal stage levels and sexes. When subgroup analysis was performed based on the maximal stage reached by the patients, these strengths became even more apparent. The machine learning model using the ECG monitoring device obtained personalized VO2max values, while the equation-derived values remained the same for all patients who reached the same maximal stage. Therefore, when a CPET is not feasible, our model offers a potential solution for achieving higher accuracy in estimating VO2max.
The strength of this study is that it focused on patients scheduled to undergo lung resection, unlike previous studies that primarily targeted healthy young adults. During the CPET, the two patients were compared based on their measured and estimated VO2max values (Figure 6). Figure 6a depicts a patient with poor pulmonary function (FVC, 63% predicted; FEV1, 61% predicted) but good exercise function (VO2max, 24.82 mL·kg−1·min−1), while Figure 6b shows a patient with normal pulmonary function (FVC, 98% predicted; FEV1, 101% predicted) and good exercise function (VO2max, 34.04 mL·kg−1·min−1). Regardless of the patient’s baseline lung function status, a machine learning model utilizing data collected from a single-lead ECG monitoring device could estimate the VO2max value, with a trend of VO2 values very similar to that of the CPET. In assessing the suitability of surgery, relying solely on lung function test results may lead patients with low lung function to opt for an alternative treatment method. However, using the CPET, we determined that the patient could withstand the surgical procedure. When the CPET is not feasible for a patient, a machine learning model that incorporates data from a single-lead ECG patch obtained through an exercise test can provide a VO2max value comparable to that of the CPET.
Although the CPET progressed to stage 7 according to the maximal incremental treadmill protocols, most patients only reached stage 2 or 3. Additionally, some of them failed to establish a substantial plateau at the maximum point of VO2, which, to make a strict distinction, signifies VO2peak rather than VO2max. However, it should be considered that patients with chronic lung disease and elderly patients were included in this study. Due to their difficulty in maintaining a sufficient plateau, obtaining “the strict” VO2max is very challenging. Furthermore, the maximum heart rate exceeded 80% of the predicted maximum heart rate, indicating that maximal exercise was achieved. From this perspective, we concluded that this can be practically considered as the VO2max.
While this study was conducted with a prospective design, it has the limitation of a small sample size of 40. Furthermore, because the study was conducted at a single institution, external validation was not performed. However, this study included patients with a wide range of ages and underlying diseases. Further studies are required for the practical utilization of this device and machine learning models in clinical settings.

5. Conclusions

This study aimed to develop a machine learning algorithm to accurately estimate VO2max using a single-lead ECG patch in candidates for lung resection. After exploring multiple combinations, a machine learning model was developed utilizing heart rate, acceleration, and body weight. The VO2max values from the developed model and the FRIEND equation showed lower differences from the reference value. In particular, the developed model, with its strength in more approximate heart rate measurement, provides a closer estimation of VO2max values measured using a CPET regardless of maximal stage level or sex than existing equations. In situations where a CPET is not feasible, this model may be a promising tool for estimating VO2max with greater accuracy and assessing the cardiopulmonary reserve in lung resection candidates.

Supplementary Materials

The following supporting information can be downloaded at: https://www.mdpi.com/article/10.3390/healthcare11212863/s1, Figure S1: The process of raw electrocardiogram (ECG) data to measure heart rate. (a) Unstructured ECG raw data are processed through deep-learning semantic segmentation algorithms. (b) The semantic segmentation algorithm accurately differentiates between different ECG waveforms using high-resolution and low-resolution feature maps; Figure S2: (a) Changes in heart rate, acceleration, and gyroscope during stages of CPET. (b) Correlation between VO2 and heart rate, acceleration, and gyroscope; Figure S3: Correlation matrix heatmap displaying the Pearson correlation coefficient values for each feature; Table S1: Modified Bruce protocol.

Author Contributions

Conceptualization, W.Y. and J.E.P.; methodology, W.Y., J.E.P. and J.D.C.; software, J.D.C., H.A.L. and Y.-s.L.; validation, S.S.S.; formal analysis, J.W.P. and Y.J.J.; investigation, H.A.L., J.W.P. and Y.J.J.; resources, J.J. and S.H.; data curation, H.A.L. and J.D.C.; writing—original draft preparation, H.A.L.; writing—review and editing, W.Y. and J.E.P.; visualization, H.A.L., J.D.C. and Y.-s.L.; supervision, S.H.K. and S.S.S.; project administration, S.H. and W.Y. All authors have read and agreed to the published version of the manuscript.

Funding

This research was supported by a grant of the Korea Health Technology R&D Project through the Korea Health Industry Development Institute (KHIDI), funded by the Ministry of Health & Welfare, Republic of Korea (grant number: HI20C2140).

Institutional Review Board Statement

The study protocol was approved by the Institutional Review Board of Ajou University (AJOUIRB-INT-2021-166). The study was conducted following the declaration of Helsinki. All patient data were anonymized and analyzed.

Informed Consent Statement

Written informed consent was obtained from all the participants.

Data Availability Statement

The data presented in this study are available on request from the corresponding author. The data are not publicly available due to a risk of infringement of the patients’ personal information.

Conflicts of Interest

The authors declare no conflict of interest.

References

  1. Siegel, R.L.; Miller, K.D.; Wagle, N.S.; Jemal, A. Cancer statistics, 2023. CA Cancer J. Clin. 2023, 73, 17–48. [Google Scholar] [CrossRef] [PubMed]
  2. Hoy, H.; Lynch, T.; Beck, M. Surgical Treatment of Lung Cancer. Crit. Care Nurs. Clin. N. Am. 2019, 31, 303–313. [Google Scholar] [CrossRef] [PubMed]
  3. Bade, B.C.; Dela Cruz, C.S. Lung Cancer 2020: Epidemiology, Etiology, and Prevention. Clin. Chest Med. 2020, 41, 1–24. [Google Scholar] [CrossRef] [PubMed]
  4. Brunelli, A.; Cassivi, S.D.; Fibla, J.; Halgren, L.A.; Wigle, D.A.; Allen, M.S.; Nichols, F.C.; Shen, K.R.; Deschamps, C. External validation of the recalibrated thoracic revised cardiac risk index for predicting the risk of major cardiac complications after lung resection. Ann. Thorac. Surg. 2011, 92, 445–448. [Google Scholar] [CrossRef] [PubMed]
  5. Deshpand, R.; Chandra, M.; Rauthan, A. Evolving trends in lung cancer: Epidemiology, diagnosis, and management. Indian J. Cancer 2022, 59, S90–S105. [Google Scholar] [CrossRef] [PubMed]
  6. Kim, H.K. Video-Assisted Thoracic Surgery Lobectomy. J. Chest Surg. 2021, 54, 239–245. [Google Scholar] [CrossRef] [PubMed]
  7. Beckles, M.A.; Spiro, S.G.; Colice, G.L.; Rudd, R.M.; American College of Chest Physicians. The physiologic evaluation of patients with lung cancer being considered for resectional surgery. Chest 2003, 123, 105S–114S. [Google Scholar] [CrossRef] [PubMed]
  8. British Thoracic Society; Society of Cardiothoracic Surgeons of Great Britain and Ireland Working Party. BTS guidelines: Guidelines on the selection of patients with lung cancer for surgery. Thorax 2001, 56, 89–108. [Google Scholar] [CrossRef]
  9. Colice, G.L.; Shafazand, S.; Griffin, J.P.; Keenan, R.; Bolliger, C.T.; American College of Chest Physicians. Physiologic evaluation of the patient with lung cancer being considered for resectional surgery: ACCP evidenced-based clinical practice guidelines (2nd edition). Chest 2007, 132, 161S–177S. [Google Scholar] [CrossRef]
  10. Brunelli, A.; Charloux, A.; Bolliger, C.T.; Rocco, G.; Sculier, J.P.; Varela, G.; Licker, M.; Ferguson, M.K.; Faivre-Finn, C.; Huber, R.M.; et al. ERS/ESTS clinical guidelines on fitness for radical therapy in lung cancer patients (surgery and chemo-radiotherapy). Eur. Respir. J. 2009, 34, 17–41. [Google Scholar] [CrossRef]
  11. Kallianos, A.; Rapti, A.; Tsimpoukis, S.; Charpidou, A.; Dannos, I.; Kainis, E.; Syrigos, K. Cardiopulmonary exercise testing (CPET) as preoperative test before lung resection. Vivo 2014, 28, 1013–1020. [Google Scholar]
  12. Riebe, D.; Ehrman, J.K.; Liguori, G.; Magal, M. ACSM’s Guidelines for Exercise Testing and Prescription, 10th ed.; Wolters Kluwer Health: Philadelphia, PA, USA, 2018. [Google Scholar]
  13. Kokkinos, P.; Kaminsky, L.A.; Arena, R.; Zhang, J.; Myers, J. New Generalized Equation for Predicting Maximal Oxygen Uptake (from the Fitness Registry and the Importance of Exercise National Database). Am. J. Cardiol. 2017, 120, 688–692. [Google Scholar] [CrossRef] [PubMed]
  14. Kokkinos, P.; Kaminsky, L.A.; Arena, R.; Zhang, J.; Franklin, B.; Kraus, W.; Triantafyllidi, H.; Benas, D.; Whellan, D.J.; Myers, J. New Equations for Predicting Maximum Oxygen Uptake in Patients with Heart Failure. Am. J. Cardiol. 2020, 128, 7–11. [Google Scholar] [CrossRef] [PubMed]
  15. Scott, J.M.; Zabor, E.C.; Schwitzer, E.; Koelwyn, G.J.; Adams, S.C.; Nilsen, T.S.; Moskowitz, C.S.; Matsoukas, K.; Iyengar, N.M.; Dang, C.T.; et al. Efficacy of Exercise Therapy on Cardiorespiratory Fitness in Patients With Cancer: A Systematic Review and Meta-Analysis. J. Clin. Oncol. 2018, 36, 2297–2305. [Google Scholar] [CrossRef] [PubMed]
  16. Jones, L.W.; Eves, N.D.; Haykowsky, M.; Joy, A.A.; Douglas, P.S. Cardiorespiratory exercise testing in clinical oncology research: Systematic review and practice recommendations. Lancet Oncol. 2008, 9, 757–765. [Google Scholar] [CrossRef] [PubMed]
  17. Brickwood, K.J.; Watson, G.; O’Brien, J.; Williams, A.D. Consumer-Based Wearable Activity Trackers Increase Physical Activity Participation: Systematic Review and Meta-Analysis. JMIR mHealth uHealth 2019, 7, e11819. [Google Scholar] [CrossRef] [PubMed]
  18. Datta, D.; Normandin, E.; ZuWallack, R. Cardiopulmonary exercise testing in the assessment of exertional dyspnea. Ann. Thorac. Med. 2015, 10, 77–86. [Google Scholar] [CrossRef] [PubMed]
  19. Fletcher, G.F.; Balady, G.J.; Amsterdam, E.A.; Chaitman, B.; Eckel, R.; Fleg, J.; Froelicher, V.F.; Leon, A.S.; Pina, I.L.; Rodney, R.; et al. Exercise standards for testing and training: A statement for healthcare professionals from the American Heart Association. Circulation 2001, 104, 1694–1740. [Google Scholar] [CrossRef]
  20. Zhu, H.; Pan, Y.; Wu, F.; Huan, R. Optimized Electrode Locations for Wearable Single-Lead ECG Monitoring Devices: A Case Study Using WFEES Modules based on the LANS Method. Sensors 2019, 19, 4458. [Google Scholar] [CrossRef]
  21. Hong, Y.; Pan, H.; Sun, W.; Jia, Y. Deep dual-resolution networks for real-time and accurate semantic segmentation of road scenes. arXiv 2021, arXiv:2101.06085 2021. [Google Scholar]
  22. Giavarina, D. Understanding Bland Altman analysis. Biochem. Med. 2015, 25, 141–151. [Google Scholar] [CrossRef] [PubMed]
  23. Fokkema, T.; Kooiman, T.J.; Krijnen, W.P.; van der Schans, C.P.; de Groot, M. Reliability and Validity of Ten Consumer Activity Trackers Depend on Walking Speed. Med. Sci. Sports Exerc. 2017, 49, 793–800. [Google Scholar] [CrossRef] [PubMed]
  24. Leboeuf, S.F.; Aumer, M.E.; Kraus, W.E.; Johnson, J.L.; Duscha, B. Earbud-based sensor for the assessment of energy expenditure, HR, and VO2max. Med. Sci. Sports Exerc. 2014, 46, 1046–1052. [Google Scholar] [CrossRef] [PubMed]
  25. Kraft, G.L.; Roberts, R.A. Validation of the garmin forerunner 920xt fitness watch vo2peak test. Int. J. Innov. Educ. Res. 2017, 5, 63. [Google Scholar] [CrossRef]
  26. Cooper, K.D.; Shafer, A.B. Validity and reliability of the polar A300’s fitness test feature to predict VO2max. Int. J. Exerc. Sci. 2019, 12, 393. [Google Scholar]
  27. Greco, M.; Angelucci, A.; Avidano, G.; Marelli, G.; Canali, S.; Aceto, R.; Lubian, M.; Oliva, P.; Piccioni, F.; Aliverti, A.; et al. Wearable Health Technology for Preoperative Risk Assessment in Elderly Patients: The WELCOME Study. Diagnostics 2023, 13, 630. [Google Scholar] [CrossRef]
  28. Jones, L.; Tan, L.; Carey-Jones, S.; Riddell, N.; Davies, R.; Brownsdon, A.; Kelson, M.; Williams-Thomas, R.; Busse, M.; Davies, M.M.; et al. Can wearable technology be used to approximate cardiopulmonary exercise testing metrics? Perioper. Med. 2021, 10, 9. [Google Scholar] [CrossRef]
Figure 1. The segmentation of the electrocardiogram (ECG). The ECG data are standardized into baseline, P-wave, normal QRS complex, premature ventricular contraction (PVC) QRS complex, T-wave, noise, and fibrillation probabilities per sample. ECG, electrocardiogram; QRS complex, a combination of the Q, R, and S waves; PVC, premature ventricular contraction.
Healthcare 11 02863 g001
Figure 2. Flow diagram of the study.
Healthcare 11 02863 g002
Figure 3. The Bland–Altman plots of the heart rate measurements at each stage of the CPET. These plots showed the degree of agreement between the two methods during graded exercise testing. The y-axis shows the differences in heart rate values of the CPET and MC-100, while the x-axis represents the mean heart rate values. The plots also indicate the mean differences between the estimated heart rate and heart rate from MC-100 and the upper and lower limits of agreement. (a) Warming up, (b) Stage 1, (c) Stage 2, and (d) Stage 3. CPET, cardiopulmonary exercise test.
Healthcare 11 02863 g003
Figure 4. The Bland–Altman plots of the VO2max estimation by estimation model and clinical equations. (a) machine learning model, (b) ACSM equation, (c) FRIEND equation, and (d) HF-FRIEND equation. The deviation between the estimated VO2max value and the true measured value was minimal when using the machine learning model for estimation. VO2max, maximal oxygen consumption.
Healthcare 11 02863 g004
Figure 5. Comparisons of heart rate measurement between an electrocardiogram (ECG) and a single-lead ECG monitoring device during a CPET test in two patients. The results showed that the single-lead ECG monitoring device (MC-100) demonstrated significantly less fluctuation than the conventional ECG. In addition, when examining the 12-lead ECG (yellow section), it was found that the HR values had substantial discrepancies. However, the single ECG patch showed more approximate HR measurements and performed better in situations with high noise levels. W, warming up stage; S1, stage1; S2, stage2; S3, stage3; HR, heart rate; CPET, cardiopulmonary exercise test.
Healthcare 11 02863 g005
Figure 6. Comparisons between measured VO2max and estimated VO2max using machine learning model. (a) Patient No.15 has poor pulmonary function but good exercise function, while (b) Patient No.26 has normal pulmonary function and good exercise function. These graphs show that the machine learning model was able to estimate the VO2max value in a manner closely resembling the VO2 trend seen in the CPET, regardless of the patient’s initial lung function status. ML model, machine learning model; VO2max, maximal oxygen consumption; VO2, oxygen consumption; CPET, cardiopulmonary exercise test.
Healthcare 11 02863 g006
Table 1. The performance of the estimation model using different features.
NumberFeatureR2MAEMSERMSE
5HR, ACC, AGE, HEIGHT, BW0.7022.88313.6983.686
4HR, ACC, AGE, HEIGHT0.5923.21218.6444.274
HR, ACC, AGE, BW0.7172.77013.0843.605
HR, ACC, HEIGHT, BW0.6623.04815.3913.888
HR, AGE, HEIGHT, BW0.6033.38118.7354.288
3HR, ACC, AGE0.6883.11217.4524.131
HR, ACC, HEIGHT0.7542.82814.1033.744
HR, ACC, BW0.7942.62211.7733.416
HR, AGE, HEIGHT0.6303.42421.2244.564
HR, AGE, BW0.6743.18918.5534.255
HR, HEIGHT, BW0.6823.25918.3854.244
2HR, ACC0.7702.69713.1053.607
HR, AGE0.6783.16318.3294.224
HR, HEIGHT0.7173.04116.3964.038
HR, BW0.7272.96015.6903.942
1HR0.7352.88215.1833.881
R2, R-squared; MAE, mean absolute error; MSE, mean squared error; RMSE, root mean square error; HR, heart rate; ACC, acceleration; BW, body weight.
Table 2. The performance of the estimation model using different regression models.
LinearQuadraticCubicRidgeLassoElasticRandom Forest
R20.6700.7940.7140.6700.6360.6440.679
MAE3.3292.6222.9013.3283.4433.3963.098
MSE18.65411.77316.38318.65220.61520.12118.345
RMSE4.2703.4163.9254.2694.444.3964.241
R2, R-squared; MAE, mean absolute error; MSE, mean squared error; RMSE, root mean square error.
Table 3. Baseline characteristics.
VariablesPatients (N = 40)
Age, yr66.7 ± 8.8
Male24 (60)
Height, cm161.4 ± 7.1
Weight, kg64.4 ± 10.7
Smoking
  Never21 (52.5)
  Ex-smoker8 (20)
  Current smoker11 (27.5)
Comorbidity
  Coronary artery disease6 (15)
  Heart failure2 (5)
  Arrhythmia1 (2.5) *
  COPD10 (25)
  CCI score4.6 ± 2.6
PFT
  FVC, L3.0 ± 0.7
FVC, % predicted90.7 ± 13.0
  FEV1, L2.2 ± 0.6
FEV1, % predicted88.0 ± 18.8
  DLco, % predicted77.7 ± 17.6
6 MWT, m442.3 ± 57.0
CPET
Maximal stage
   11 (2.5)
   215 (37.5)
   322 (55)
   42 (5)
5–70 (0)
Peak heart rate, bpm133.9 ± 19.0
% predicted maximal HR87.4 ± 12.4 **
VO2max, mL/kg/min26.3 ± 5.0
ECOG performance status
  037 (92.5)
  13 (7.5)
  ≥20 (0)
Values are expressed as the mean ± standard deviation or number (%); * Atrial fibrillation; ** 80% or more of the predicted maximal HR represents maximal exercise; (References value equations for maximal HR; 220-age); COPD, chronic obstructive pulmonary disease; ILD, interstitial lung disease; CCI, Charlson Comorbidity Index; PFT, pulmonary function test; FVC, forced vital capacity; FEV1, forced expiratory volume in 1 s; DLCO, carbon monoxide lung diffusion capacity; 6 MWT, 6-min walking test; CPET, cardiopulmonary exercise test; HR, heart rate; VO2max, maximal oxygen consumption; ECOG, Eastern Cooperative Oncology Group.
Table 4. Measured and estimated VO2max using machine learning and equations in total and subgroups.
CPETML ModelACSMFRIENDHF-FRIEND
Total
(n = 40)
VO2max *
[mL·kg−1·min−1]
26.01
(22.82–30.77)
25.37
(23.49–28.95)
35.77
(24.57–35.77)
29.22
(21.15–29.22)
23.19
(17.39–23.19)
VO2max Difference **
[mL·kg−1·min−1]
-−0.335.890.30−5.01
ICC ***-0.693
(0.417–0.838)
0.517
(−0.126–0.780)
0.708
(0.445–0.846)
0.466
(−0.197–0.759)
Maximal
Stage
1–2
(n = 14)
VO2max
[mL·kg−1·min−1]
22.99
(19.30–25.16)
23.31
(21.71–24.21)
24.57
(24.57–24.57)
21.15
(21.15–21.15)
17.39
(17.39–17.39)
VO2max Difference
[mL·kg−1·min−1]
-0.321.24−2.03−5.68
ICC-0.499
(−0.677–0.843)
0.301
(−1.072–0.772)
0.229
(−0.858–0.727)
0.081
(−0.242–0.493)
Maximal
stage
3–4
(n = 26)
VO2max
[mL·kg−1·min−1]
27.32
(24.93–31.81)
27.84
(25.03–29.82)
35.77
(35.77–35.77)
29.22
(29.22–29.22)
23.19
(23.19–23.19)
VO2max Difference
[mL·kg−1·min−1]
-−0.688.391.56−4.65
ICC-0.488
(−0.145–0.771)
0.085
(−0.150–0.372)
0.209
(−0.637–0.633)
0.094
(−0.288–0.455)
Male
(n = 24)
VO2max
[mL·kg−1·min−1]
26.90
(24.15–31.41)
25.41
(23.73–28.77)
35.77
(24.57–35.77)
29.22
(21.15–2922)
23.19
(17.39–23.19)
VO2max Difference
[mL·kg−1·min−1]
-−0.996.190.25−5.32
ICC-0.545
(−0.034–0.802)
0.365
(−0.220–0.701)
0.562
(−0.037–0.812)
0.325
(−0.231–0.678)
Female
(n = 16)
VO2max
[mL·kg−1·min−1]
23.84
(20.47–26.94)
25.14
(22.50–29.58)
35.48
(24.57–35.77)
28.99
(21.15–29.22)
23.01
(17.39–23.19)
VO2max Difference
[mL·kg−1·min−1]
-0.665.430.38−4.55
ICC-0.808
(0.453–0.933)
0.660
(−0.176–0.895)
0.818
(0.473–0.937)
0.593
(−0.218–0.867)
* Values are median (Q1–Q3); ** Values are differences between measured and estimated VO2max; *** Values are ICC (95% confidence interval); VO2max, maximal oxygen consumption, CPET, cardiopulmonary exercise test; ML, machine-learning; ACSM, American College of Sports Medicine; FRIEND, Fitness Registry and the Importance of Exercise National Database; HF, heart failure; Q, quartile; ICC, intraclass correlation coefficient.
Disclaimer/Publisher’s Note: The statements, opinions and data contained in all publications are solely those of the individual author(s) and contributor(s) and not of MDPI and/or the editor(s). MDPI and/or the editor(s) disclaim responsibility for any injury to people or property resulting from any ideas, methods, instructions or products referred to in the content.

